surveying the impact of live earth on american public...
TRANSCRIPT
Yale/Gallup/ClearVision Surveying the Impact of Live Earth 1
Surveying the Impact of Live Earth on American Public Opinion A Yale University, Gallup, and ClearVision Institute Study
Introduction Live Earth was a global concert event to “combat the climate crisis,” featuring over 150 of the world’s leading musicians and held on 7 continents on July 7, 2007. It reached an estimated global audience of over 2 billion through ticket sales, television, radio, and the internet. In the United States, NBC broadcast the concert during prime time and around the clock on the NBC network of cable channels (Bravo, UNI HD, Sundance, MSNBC, CNBC, Telemundo, and MUN 2). It was also simulcast on 200 Premiere Radio Network stations. Globally, it was broadcast across television networks in more than 100 countries, over the internet by MSN.com, which set a new record of approximately 8 million people tuning in through the web, and on XM and SIRIUS satellite radio. Live Earth was the most recent of a series of global concert events, such as The Concert for Bangladesh (1971), Live Aid (1985), Live 8 (2005), etc., intended to either raise money and/or public awareness about pressing global issues. These concert events have each received great media attention, global audiences, and in some cases raised hundreds of millions of dollars for their respective causes, yet their actual impact on public awareness, concern, and behavior is almost completely unknown. Other than numbers of tickets sold and dollars raised, there have previously been no attempts to evaluate the impact of these events on the attitudes and behavior of the public. Study overview and methodology To assess the impact of Live Earth on American public opinion, Yale University, Gallup, and the ClearVision Institute conducted two nationally representative surveys in the United States. The first survey was conducted one week prior to Live Earth, and measured American global warming beliefs, attitudes, preferences, and behaviors. Using the same questionnaire, the second survey was conducted two weeks after Live Earth. The results of the two national surveys were compared to determine whether American opinion as a whole had shifted. Additionally, the second survey asked if respondents had tuned in to Live Earth. Subsequent analysis was thus able to compare the global warming beliefs, attitudes, preferences, and behaviors of Live Earth “watchers” vs. “non-watchers.” Survey 1 was conducted June 25-28, 2007, one week prior to Live Earth, using telephone interviews with 1,014 adults, aged 18+. Respondents were drawn from Gallup's household panel, which was originally recruited through random selection methods. The CASRO response rate was 42%. The final sample was weighted to be representative of U.S. adults nationwide. For results based on the total sample, one can say with 95% confidence that the margin of sampling error is ±4 percentage points. Survey 2 was conducted July 23-26, 2007, two weeks after Live Earth, using telephone interviews with 1,011 adults, aged 18+. Respondents were drawn from Gallup's household panel, which was originally recruited through random selection methods. The CASRO response rate was 40%. The final sample was weighted to be representative of U.S. adults nationwide. For results based on the total sample, one can say with 95% confidence that the margin of sampling error is ±4 percentage points.

Yale/Gallup/ClearVision Surveying the Impact of Live Earth 2
Results Principal Investigator: Dr. Anthony Leiserowitz School of Forestry and Environmental Studies Yale University (203) 432-4865 (ofc) (203) 815-9970 (cell) [email protected] 1. Did Live Earth influence public opinion on global warming in the United States? We
found that Live Earth had no measured impact on the American public as a whole. From survey 1 to survey 2, there was no change in Americans’:
(see the results on page 6 for full questions)
• Holistic attitudes towards global warming • Belief that global warming is happening • Perceptions of a scientific consensus • Identified cause of global warming (humans or nature) • Levels of worry about global warming • Perceptions of when dangerous impacts will occur • Perceptions of the seriousness of impacts at multiple scales • Perceived urgency of action • Support for:
o An international treaty o Electricity taxes o Gas taxes o Higher fuel efficiency standards for vehicles o Requiring utilities to produce 20% green energy o Requiring new buildings meet higher efficiency standards
• Stated importance of a Presidential candidate’s position on global warming on their vote • Behavioral intentions to:
o Buy fuel efficient car, truck, or SUV o Buy energy efficient appliances o Buy compact fluorescent light bulbs o Alternative transportation o Contact politicians about global warming
• Perceived individual ability to reduce emissions • Perceived ability of the US to reduce emissions • Belief whether an individual can make a difference • Belief whether the US make a difference

Yale/Gallup/ClearVision Surveying the Impact of Live Earth 3
2. Did Live Earth influence those Americans who tuned in? In our second survey (conducted two weeks after Live Earth) we found very large differences in the beliefs, attitudes, and perceptions of Live Earth “watchers1” vs. “non-watchers.” Across the board, watchers were much more likely to be concerned about global warming, support policy, and willing to take individual action. (see attached results) At first glance, Live Earth appears to have had a strong influence on watchers’ beliefs, attitudes, policy preferences, and individual behaviors. But it is possible that those who tuned in to Live Earth were already strongly predisposed to be more concerned about global warming. 3. So, who watched Live Earth? Socio-demographically, watchers were more likely than non-watchers to be:
• Democrats (+31%) • Politically liberal (+11%) • Politically moderate (+5%) • 18-29 years old (+6%) • 50-64 years old (+7%) • College graduates (+10%) • Unmarried (+7%) • Minority (+14%) • Women (+8%)
Self-selection bias (prior concern about global warming)
Watchers were also asked why they tuned in to Live Earth. 38% said they tuned in mainly “to hear the bands and the music”; 32% because they “were concerned about global warming”; 18% for both the music and global warming equally; 5% through channel surfing; and 6% for other reasons. Thus, half of watchers tuned in, at least in part, because Live Earth was about global warming and half to listen to the bands or for other reasons.
1 Approximately 22% of respondents tuned in to the concert. Of these, 85% saw it on television, 10% saw it on the internet, and 7% listened to it on the radio (these add to more than 100% due to some multiple responses, e.g., people who saw it on both TV and the internet). For analysis, all television, internet, and radio respondents are coded as “watchers” and all others (78%) coded as “non-watchers.”
Yale/Gallup/ClearVision Surveying the Impact of Live Earth 4
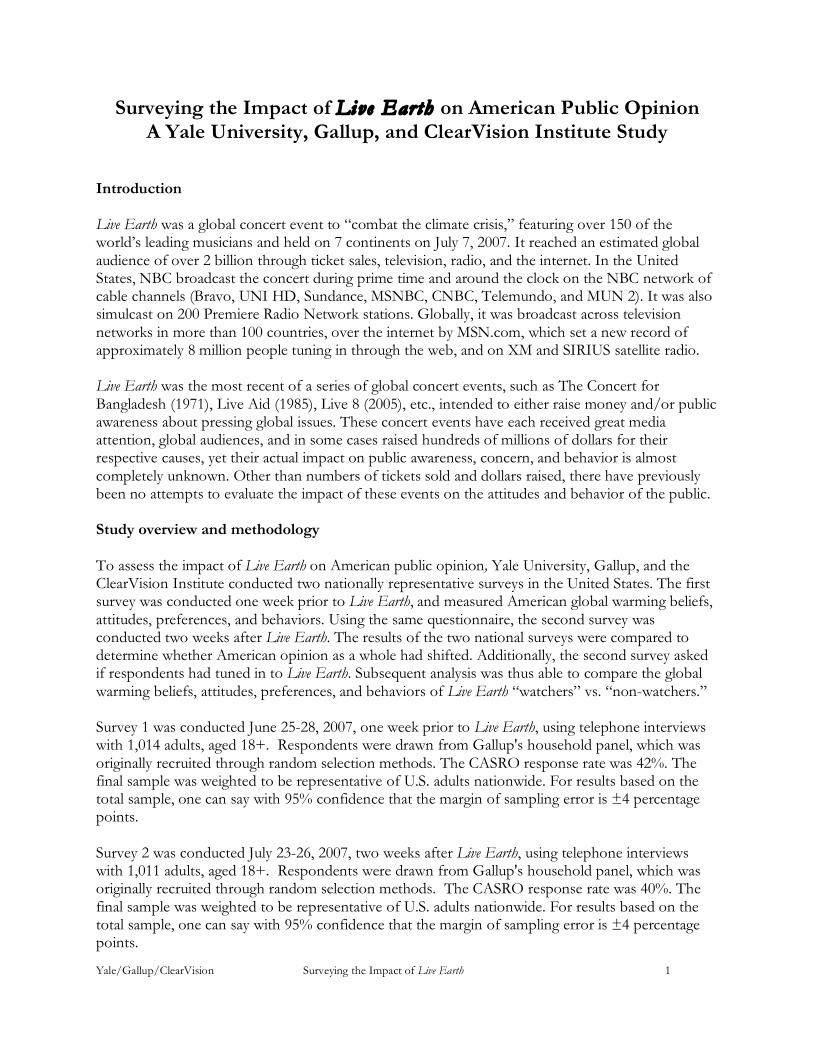
4. How much of the apparent influence of Live Earth can be explained by these socio-demographic and self-selection bias differences between watchers and non-watchers?
Multiple regression analyses2 were conducted to control for the possible influences of political party, political ideology, age, education, marital status, race, gender, and self-selection bias on each result. After controlling for these political, demographic, and self-selection bias factors, watchers were significantly more likely than non-watchers to have stronger attitudes, beliefs, etc. than non-watchers for only five variables:
• Holistic attitudes towards global warming (good or bad): watchers were more likely to say global warming is a very bad thing.
• Cause: watchers were more likely to say global warming is caused by human activities. • Energy efficient buildings: watchers were more likely to support higher requirements for all
new buildings. • Behavior: watchers were more likely to buy energy efficient appliances. • Behavior: watchers were more likely to buy compact fluorescent light bulbs. • US ability to act: watchers were more likely to say the US has the ability to reduce its
emissions. Thus, while most of the differences between watcher and non-watcher responses can be explained by their socio-demographic differences and self-selection bias (prior concern about global warming), Live Earth appears to have had a limited, but statistically significant impact upon some watchers.
Furthermore, watchers were directly asked whether Live Earth made them more worried, less worried, or made no difference in their level of worry about global warming. While most of watchers (62%) said it made no difference, 36% said it made them either “a great deal” (12%) or “somewhat” (24%) more worried about global warming. Of those watchers who said they tuned in primarily because they were concerned about global warming, 44% said Live Earth had made them “a great deal” (15%) or “somewhat” (29%) more worried about global warming. By contrast, of those respondents who tuned in mainly to listen to the music or for another reason, only 29% said it made them either “a great deal” (9%) or “somewhat” (20%) more worried. Thus, Live Earth appears to have had both a reinforcing effect on the attitudes of some watchers who were already concerned about global warming and a smaller effect on other watchers.
2 Multiple regression (partial correlation) is a statistical technique used to determine whether an observed relationship between an explanatory variable and a dependent variable persists, even after the effects of one or more additional explanatory variables are removed. For example, there is an observed negative relationship between height and hair length, i.e., short people tend to have longer hair than tall people. This may seem odd at first, but if the explanatory variable gender is added to the regression equation, the observed relationship disappears (because women tend to be both shorter and have longer hair than men). If the relationship between height and hair length persists even after the effect of gender is removed, then one can be more confident that the observed correlation is not spurious (StatSoft.com).

Yale/Gallup/ClearVision Surveying the Impact of Live Earth 5
5. Some watchers took individual action after Live Earth:
• Emissions reduction: 39% of watchers said that in the weeks following Live Earth, they took action to reduce their own greenhouse gas emissions, while an additional 44% said they planned to do so. Only 17% of watchers said they did not plan to take action to reduce their own greenhouse gas emissions.
• Information seeking: 20% of watchers said they had sought out additional information about global warming since Live Earth. An additional 36% said they planned to seek out additional information in the future, while 44% of watchers said they did not plan to.
6. In part, Live Earth’s audience in the United States was limited by lack of awareness of
the event itself:
• One week prior to the concert, 62% of Americans had heard “nothing at all” about Live Earth and 29% had heard “only a little.”
• After the concert, the 78% of respondents who had not tuned in were asked why. 37% said “they were too busy with other things”; 26% said they “did not know about it”; 15% were “not interested in the bands or music”; 13% were “not interested in global warming”; and 8% had another reason.
7. Caveats
• This study was conducted only in the United States – we did not assess the impact of Live Earth in other countries.
• This study only evaluated the impact of Live Earth, which was uniquely focused on the issue of global warming. We did not assess the impact of prior global concert events (e.g., Live Aid, Live 8, etc.), which attempted to raise awareness about other pressing global issues. Nonetheless, these results do raise important questions about the impact of such events.
• Only a controlled within-subject experimental design can directly measure the influence of an event on a particular individual, so this study was unable to directly assess whether watching Live Earth changed individual attitudes towards climate change. By contrast, this survey was conducted using a cross-sectional sampling design, in which the responses of two different representative samples of Americans were compared, allowing us to assess any potential change in American attitudes as a whole. Additionally, in the second survey, we were able to directly compare the responses of watchers vs. non-watchers, which allowed us to infer the impact of Live Earth on those individuals who tuned in.
Conclusion Thus, Live Earth appears to have had no immediate impact on American public opinion as a whole. It does appear, however (within the limitations of this study), that Live Earth did reinforce and amplify attitudes about global warming among those watchers who were already concerned, while having a smaller impact on other watchers. Importantly, Live Earth was intended to be the start of a multi-year campaign to raise awareness, change individual behavior, and increase public pressure for governments to act. It remains to be seen how effective this campaign will be.

Yale/Gallup/ClearVision Surveying the Impact of Live Earth 6
Surveying the Impact of Live Earth on American Public Opinion A Yale University, Gallup, and ClearVision Institute Study
Responses of Live Earth “watchers” vs. “non-watchers”3
Note: The results below come from Survey 2, which was conducted July 23-26, 2007, two weeks after Live Earth, using telephone interviews with 1,011 adults, aged 18+. Respondents were drawn from Gallup's household panel, which was originally recruited through random selection methods. The CASRO response rate was 40%. The final sample was weighted to be representative of U.S. adults nationwide. For results based on the total sample, one can say with 95% confidence that the margin of sampling error is ±4 percentage points. Items marked with an asterisk indicate multiple regression results in which watchers remain significant predictors even after controlling for socio-demographics and self-selection bias. * = p <. 05 ** = p < .01 Figure 1: Overall Attitude*
“Please think about global warming for a moment. On a scale of 1 to 6, where one means it is a “very bad thing” and six means it is a “very good thing”, how would you rate global warming?”
3Approximately 22% of respondents tuned in to the concert. Of these, 85% saw it on television, 10% saw it on the internet, and 7%
listened to it on the radio (these add to more than 100% due to some multiple responses, e.g., people who saw it on both TV and the internet). For analysis, all television, internet, and radio respondents are coded as “watchers” and all others (78%) coded as “non-watchers.”

Yale/Gallup/ClearVision Surveying the Impact of Live Earth 7
Figure 2: Personally Convinced
“How convinced are you that global warming is happening -- would you say you are – completely convinced, mostly convinced, not so convinced, or not at all convinced?”
Figure 3: Scientific Consensus
“Which comes closer to your own view -- most scientists think global warming is happening, most
scientists think global warming is not happening, there is a lot of disagreement among scientists about whether or not global warming is happening, or do you not know enough to say?”

Yale/Gallup/ClearVision Surveying the Impact of Live Earth 8
Figure 4: Cause of Global Warming*
“If global warming is happening, do you think it is -- caused mostly by human activities or caused mostly by natural changes in the environment?”
Figure 5: Worry
“How much do you personally worry about global warming –
a great deal, a fair amount, only a little, or not at all?”

Yale/Gallup/ClearVision Surveying the Impact of Live Earth 9
Figure 6: Seriousness of Threat
“How serious of a threat is global warming to _________ very serious, somewhat serious, not very serious, or not at all serious?“
Percent responding “very serious”
Figure 7: Timing of Impacts
“When do you think global warming will start to have dangerous impacts on people around the world -- is it having dangerous impacts now, will it have dangerous impacts in 10 years, in 25 years,
in 50 years, in 100 years, or will it never have dangerous impacts?”
Yale/Gallup/ClearVision Surveying the Impact of Live Earth 10
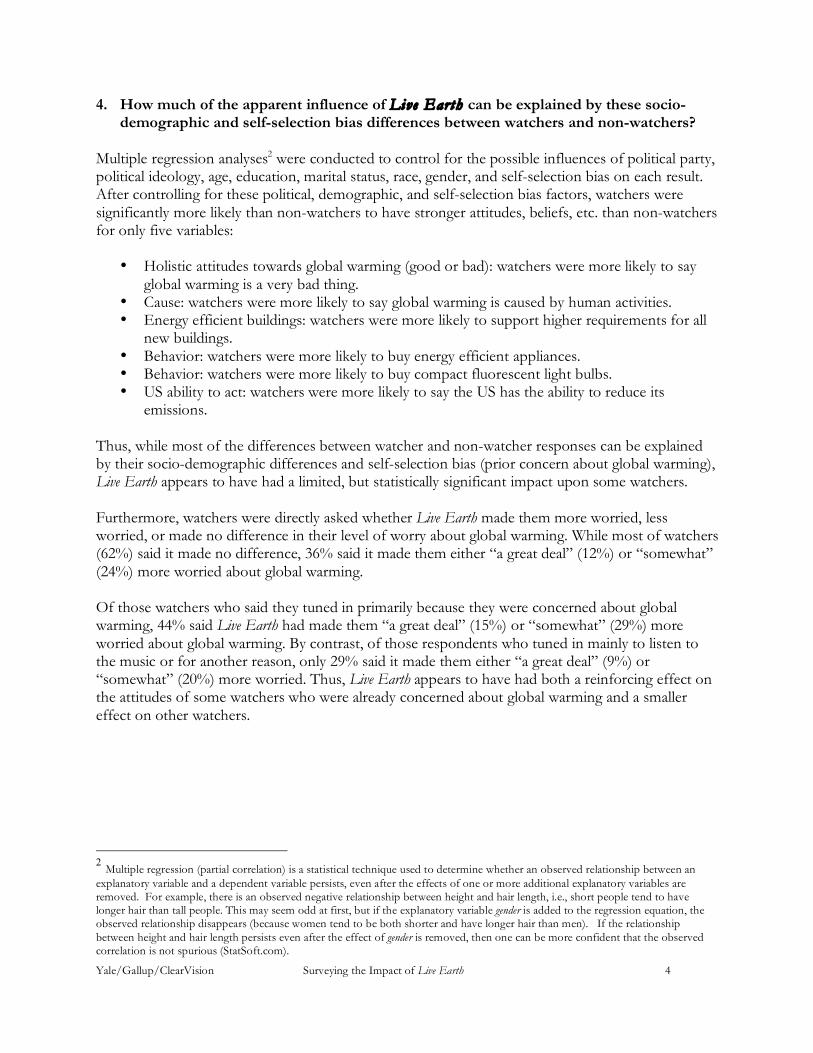
Figure 8: Urgency of Action “Do you strongly agree, somewhat agree, somewhat disagree or strongly disagree with the following
statement? Life on earth will continue without major disruptions only if we take immediate and drastic action to reduce global warming.”
Figure 9: Influence on Vote for President
“If the presidential election were held today, how important would a candidate’s position on global warming be in your decision about whom to vote for -- extremely important, very important,
somewhat important, or not that important?”

Yale/Gallup/ClearVision Surveying the Impact of Live Earth 11
Figure 10: Policy Preferences*
“As you may know, global warming is said to be partly caused by the emission of carbon dioxide from the burning of gasoline, oil, coal, and natural gas in cars, homes, and electric power plants. Do you favor or oppose each of the following as a way for the federal or state governments to reduce
both carbon dioxide emissions and global warming? How about…
• “Requiring that any newly constructed home, residential, or commercial building meet higher energy efficiency standards.”*
• “Requiring automakers to increase the fuel efficiency of cars, trucks, and SUVs to 35 miles per gallon, even if it meant a new car would cost up to $500 more to buy.”
• “Requiring electric utilities to produce at least 20% of their electricity from wind, solar, or other renewable energy sources, even if it cost the average household an extra $100 a year.”
• “Agreeing to an international treaty that requires the United States to cut its emissions of carbon dioxide 90% by the year 2050.”
• “Increasing taxes on gasoline so people either drive less or buy cars that use less gas.”* • “Increasing taxes on electricity so people use less of it.”
Percent somewhat to strongly support

Yale/Gallup/ClearVision Surveying the Impact of Live Earth 12
Figure 11: Behavior**
“How likely are you to do each of the following because of your concerns about global warming -- very likely, somewhat likely, somewhat unlikely, or very unlikely?”
• “Buy energy-efficient appliances (such as, refrigerators, stoves, washing machines,
dishwashers)”** • “Buy compact fluorescent light bulbs”** • “Buy a more fuel-efficient car, SUV, or truck” • “Bike, ride public transit, or car pool one more time a week” • “Contact politicians to express your views on global warming (such as by writing letters,
telephoning, sending e-mails, or signing petitions)”
Percent somewhat or very likely

Yale/Gallup/ClearVision Surveying the Impact of Live Earth 13
Figure 12: US Capability*
“Do you strongly agree, somewhat agree, somewhat disagree, or strongly disagree with each of the following statements…
The United States can take actions that will help reduce global warming.”
Figure 13: Efficacy of US Action
“The actions of a single country like the United States
won’t make any difference in reducing global warming.”