survey: traffic volume count - wordpress.com · survey - traffic volume count pune cycle plan 2017...
TRANSCRIPT

AUGUST 2017
SURVEY: TRAFFIC VOLUME COUNT
Survey - Traffic Volume Count Pune Cycle Plan 2017
Traffic Volume Counts
The Survey for Traffic Volume Count was conducted by - iTrans, PDA & CEE in Consortium, for Pune
Cycle Plan.
The Traffic Volume Count survey helps us understand the Modal share of each vehicle type in the
city. It is specifically designed to understand the share of Cycles on the road in the city.
The surveys were carried out from 20th May 2016 to 25th June 2016. Survey was conducted on 9
Arterial Roads in the city as well as, on the 4 major roads in the Core area of the City. At a given
location, counts were taken for 4 hours, 2 times a day, from 7 a.m. to 11 a.m. in the morning and 5
p.m. to 9 p.m. in the evening.
The survey was conducted on both sides of the road simultaneously in the same time bracket, and as
per the durations mentioned above. For the survey, multiple locations were selected for Arterial
roads, which were longer and had a considerable change in the land use.
(Refer Figure 2, for Survey form).
Following is the list of Streets, which were part of the survey:
[Refer Map (Figure 1) for the approximate locations of the survey]
1. Bajirao Road*
2. Shivaji Road*
3. J. M. Road*
4. F. C. Road*
5. Shankarshet Road
6. Solapur Road
7. Satara Road
8. Sinhagad Road
9. Karve Road
10. Baner Road
11. Aundh Road
12. Ganeshkhind Road
13. S. B. Road
14. Old Mumbai-Pune
Highway
15. Alandi Road
16. Nagar Road
Methodology
The survey was specifically designed to capture the peak hour of cyclists, thus enabling us to observe
the actual number of cyclists on the streets, in contrast to the peak hours of motorized vehicles.
The form consists of 4 hours of counts at a given time (Morning / Evening), which is divided into 8
slots of 15 mins, with a buffer period of 15 mins, between 2 slots. The travel direction is marked by
highlighting either of the option, ‘To Core City’ or ‘From Core City’, which means that the traffic is

Survey - Traffic Volume Count Pune Cycle Plan 2017
either travelling towards the Core of the City or away from it, giving a sense of direction.
A team of 10 persons conducted the survey at a given point; with them forming 2 sub-groups, who
were then assigned their respective side of the road.
Following categories were considered for the survey, Pedestrians, Bicycles, 2-Wheelers, 4-Wheelers,
Cars, Trucks, Buses and Auto-Rickshaws. Each person was assigned a Category, except where Truck /
Bus and Auto – Rickshaw were grouped together. Refer Figure 3 for a sample filled form on-site.
Observations
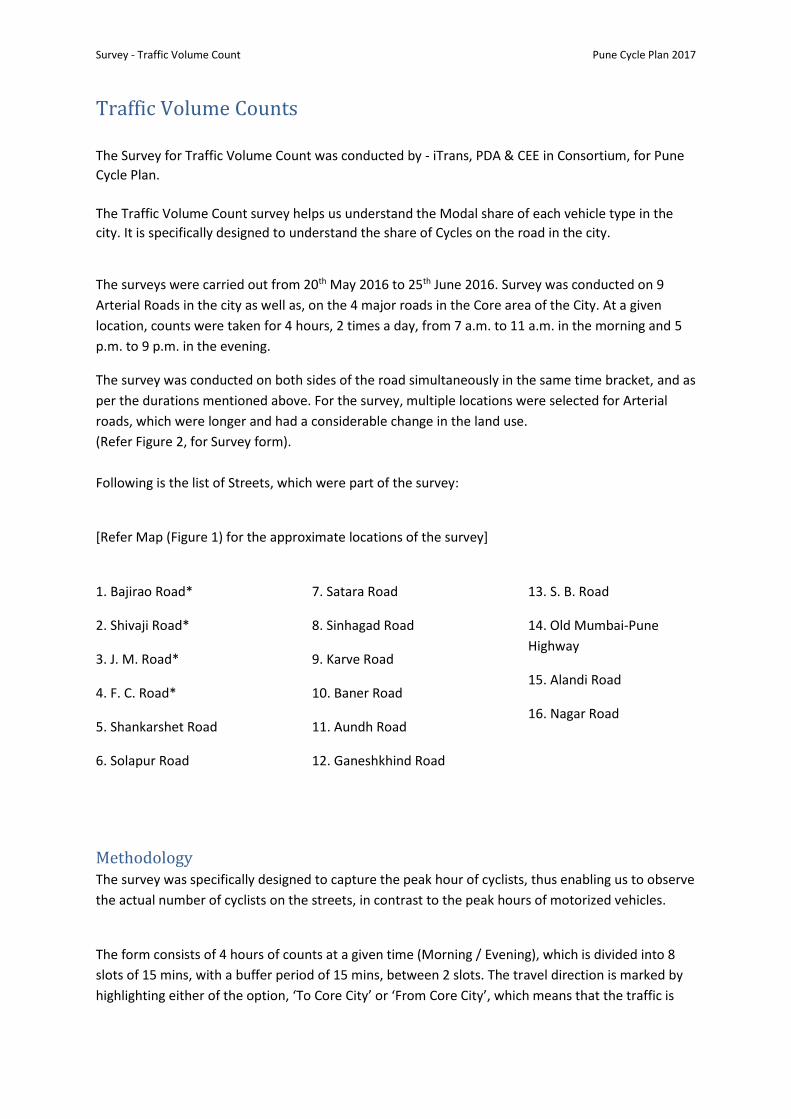
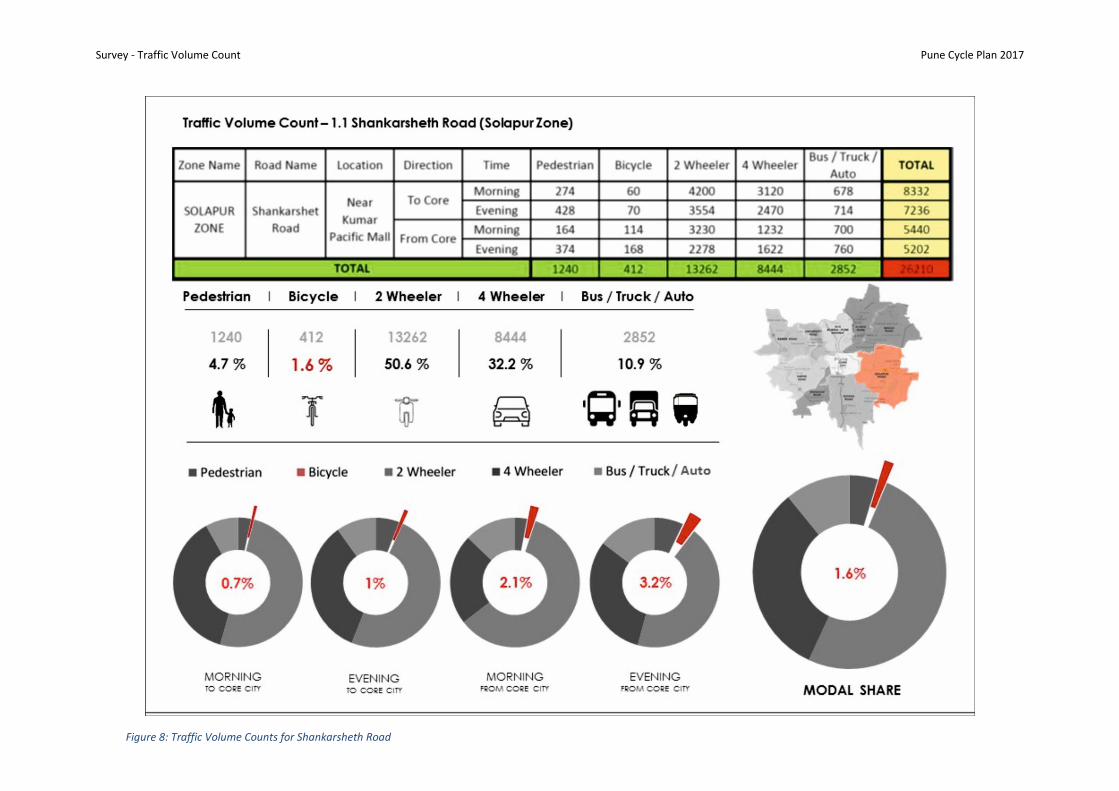
As can be observed from the survey data, the modal share for Bicycles is higher on Shivaji Road and
Bajirao Road in Core City and Satara Road & Sinhagad Road as well, as compared to other roads in
the city, which can be seen from the data below (Figure 4, 5, 10 & 11).
It has also been observed that the modal share for cyclists is higher in the early morning, suggesting
the peak time for cycles lies between 7.00 a.m to 8.30 a.m., which is different as compared peak
time for Motorized Vehicles, which lies between 9.00 a.m. to 11.00 a.m.
The overall data from the survey suggests that there are a significant number of cycles on the road
and hence demands the need to create and provide proper infrastructure in order to ensure safety
of cyclists.

Survey - Traffic Volume Count Pune Cycle Plan 2017
Figure 1: Locations for Traffic Volume Counts

Survey - Traffic Volume Count Pune Cycle Plan 2017
Figure 2: Survey form for Traffic Volume Count

Survey - Traffic Volume Count Pune Cycle Plan 2017
Figure 3: Sample filled form from Onsite Survey
Survey - Traffic Volume Count Pune Cycle Plan 2017
Figure 4: Traffic Volume Counts for Bajrao Road *Average of survey at 2 locations on the street

Survey - Traffic Volume Count Pune Cycle Plan 2017
Figure 5: Traffic Volume Counts for Shivaji Road *Average of survey at 2 locations on the street

Survey - Traffic Volume Count Pune Cycle Plan 2017
Figure 6: Traffic Volume Counts for J.M. Road *Average of survey at 2 locations on the street

Survey - Traffic Volume Count Pune Cycle Plan 2017
Figure 7: Traffic Volume Counts for F.C. Road *Average of survey at 2 locations on the street
Survey - Traffic Volume Count Pune Cycle Plan 2017
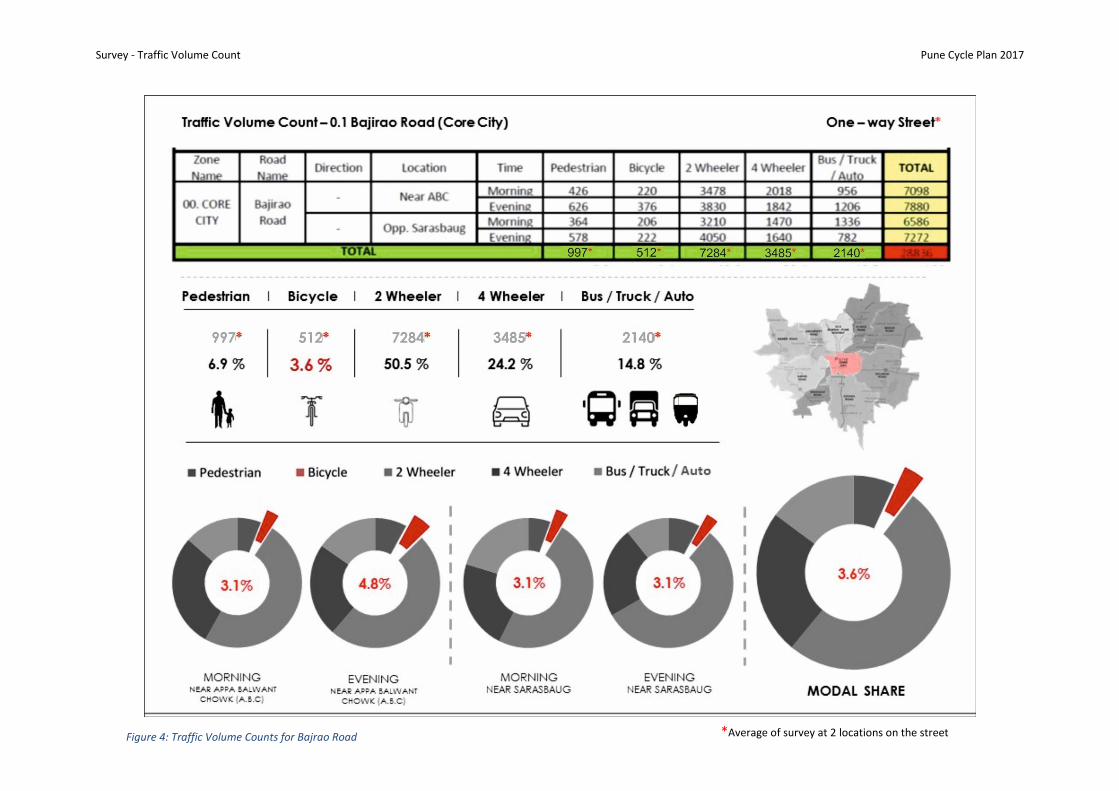
Figure 8: Traffic Volume Counts for Shankarsheth Road

Survey - Traffic Volume Count Pune Cycle Plan 2017
Figure 9: Traffic Volume Counts for Solapur Road
Survey - Traffic Volume Count Pune Cycle Plan 2017
Figure 10: Traffic Volume Counts for Satara Road

Survey - Traffic Volume Count Pune Cycle Plan 2017
Figure 11: Traffic Volume Counts for Sinhgad Road
Survey - Traffic Volume Count Pune Cycle Plan 2017
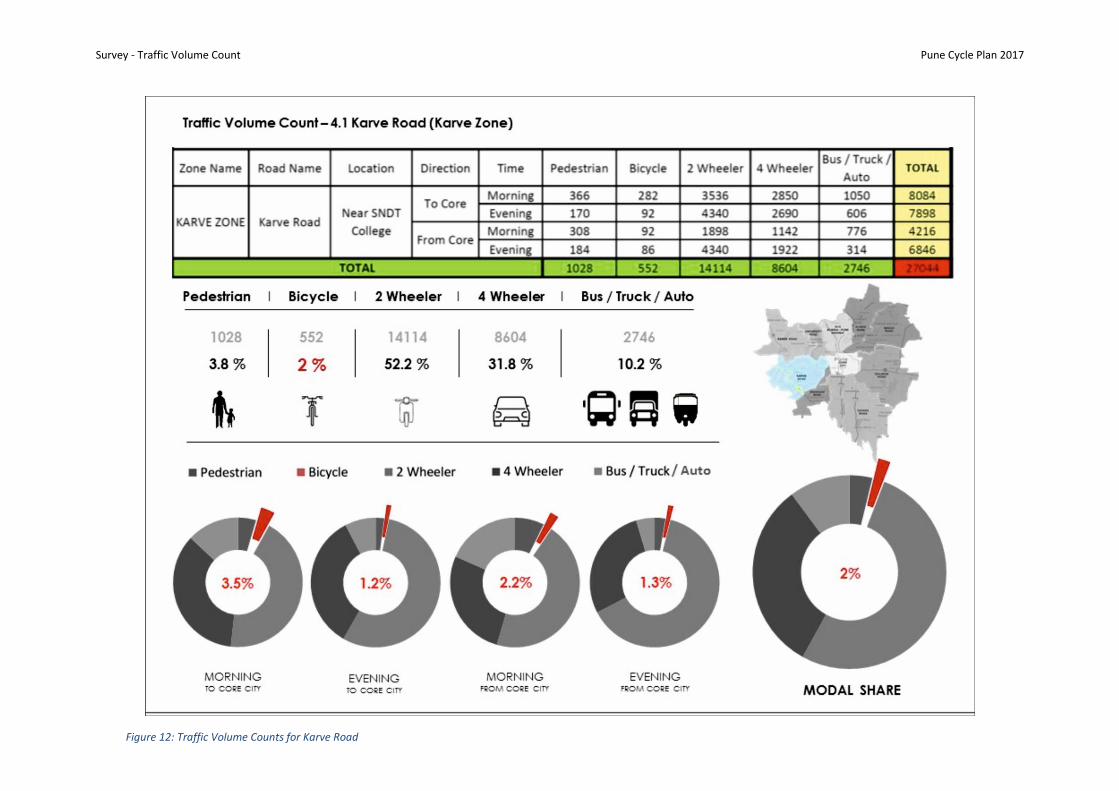
Figure 12: Traffic Volume Counts for Karve Road
Survey - Traffic Volume Count Pune Cycle Plan 2017
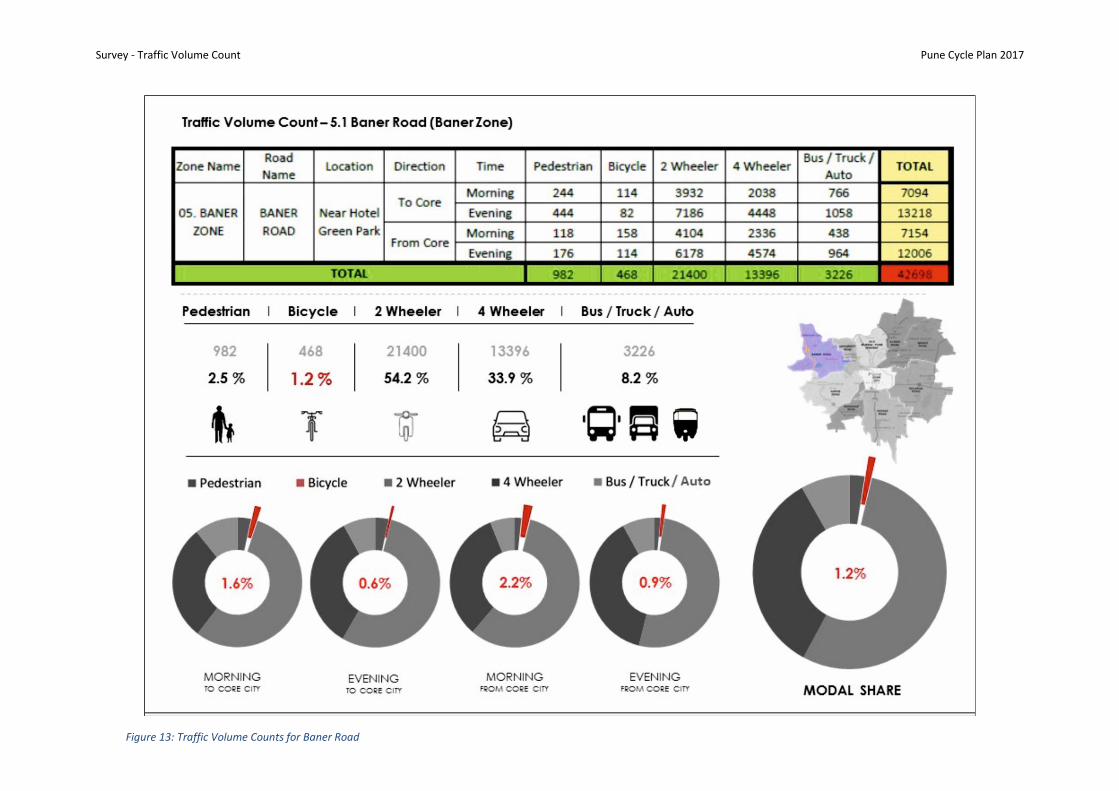
Figure 13: Traffic Volume Counts for Baner Road

Survey - Traffic Volume Count Pune Cycle Plan 2017
Figure 14: Traffic Volume Counts for Aundh Road

Survey - Traffic Volume Count Pune Cycle Plan 2017
Figure 15: Traffic Volume Counts for Ganeshkhind Road

Survey - Traffic Volume Count Pune Cycle Plan 2017
Figure 16: Traffic Volume Counts for S.B. Road
Survey - Traffic Volume Count Pune Cycle Plan 2017
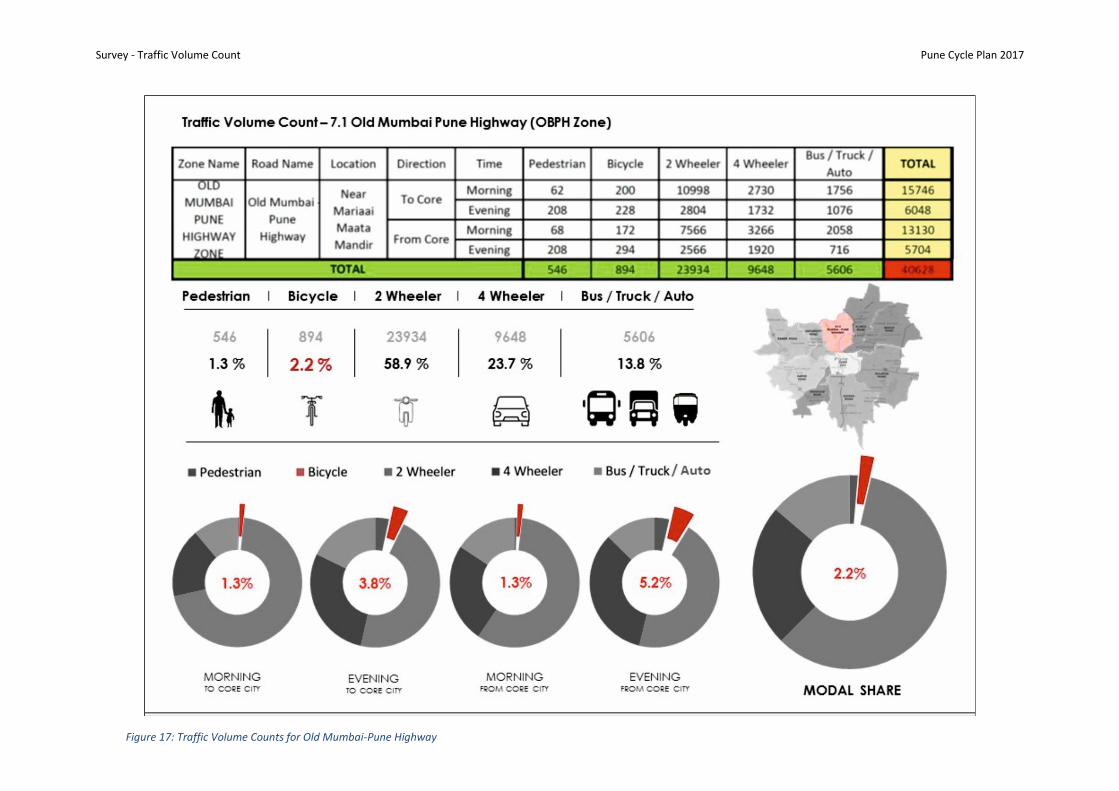
Figure 17: Traffic Volume Counts for Old Mumbai-Pune Highway
Survey - Traffic Volume Count Pune Cycle Plan 2017
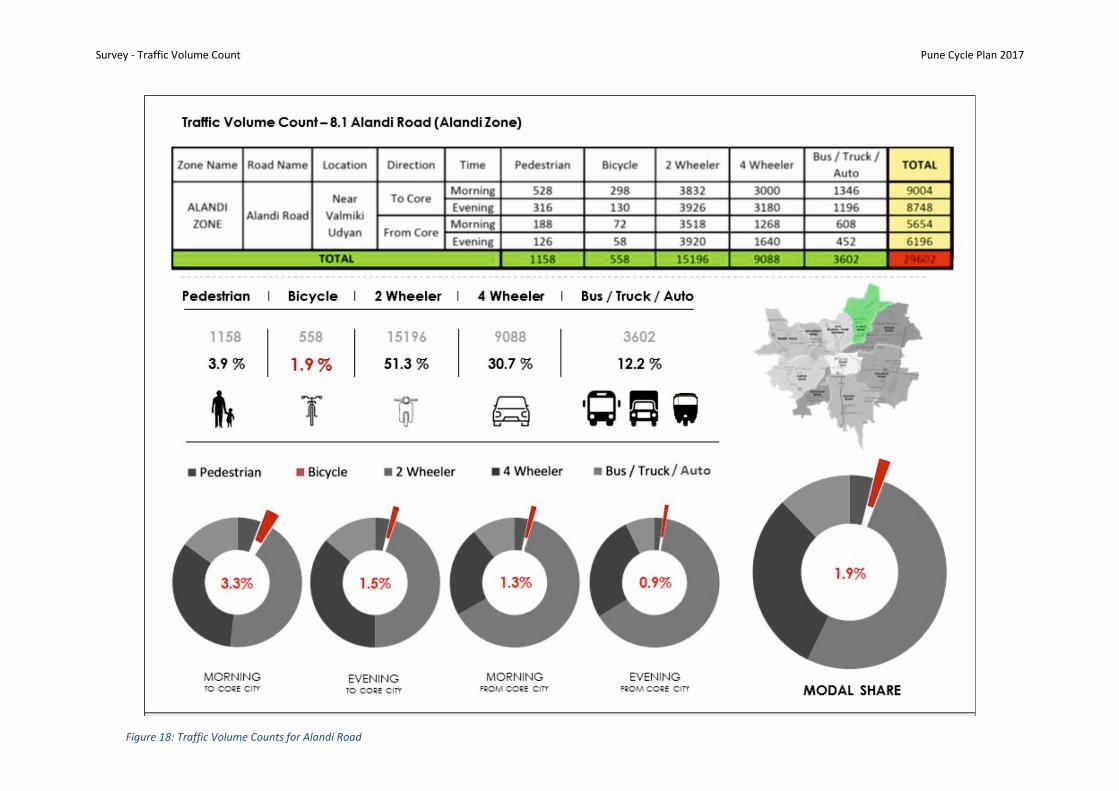
Figure 18: Traffic Volume Counts for Alandi Road

Survey - Traffic Volume Count Pune Cycle Plan 2017
Figure 19: Traffic Volume Counts for Nagar Road

Survey - Traffic Volume Count Pune Cycle Plan 2017
0.0
10000.0
20000.0
30000.0
40000.0
50000.0
60000.0
70000.0
Baj
irao
Ro
ad
Shiv
aji R
oad
J.M
. Ro
ad
F.C
. Ro
ad
Shan
kars
het
h R
oad
Sola
pu
r R
oad
Sata
ra R
oad
Sin
hag
ad R
oad
Kar
ve R
oad
Ban
er R
oad
Au
nd
h R
oad
Gan
esh
khin
d R
oad
S.B
. Ro
ad
OB
PH
Ala
nd
i Ro
ad
Nag
ar R
oad
No
. of
Veh
icle
sComparison - Traffic Volume Count
Pedestrians Bicycles 2 Wheelers 4 Wheelers Bus / Truck / Auto
Figure 20: Chart - Comparison of Data