survey: questions and data analysis
TRANSCRIPT

Survey: Questions and data analysis
Housing Design: Research and PracticeJukka Hirvonen & Anne Tervo 1.11.2021

Background: Why solo dwellers, why questionnaire?
1. Why this topic?
i. Growth of solo-living
ii. However, only few studies discussing solo dwellers’ domestic spatial needs
(focusing on dwelling features and housing design practices)
iii. Terminology: one-person households, solo dwellers and solo-living
2. Research question: How much space and what type of domestic space is needed by solo
dwellers? Focusing on working aged solo dwellers in the HMA.
3. Testing and deepening findings of an interview study (Tervo & Lilius, 2016):
Methodological goals!

What is it like at your home? Do you have guests? Do you clean? Is it nice to come home?
Open web-based surveyin Helsingin Sanomat, national newspaper
How to start collaboration
with the media?

Alternatives to implement a survey for the residents
1. Open web survey (inexpensive, but data is not representative)
2. Postal survey for a representative sample (more expensive)
3. Survey by phone for a representative sample (better response rate but even more expensive)
4. Panel survey (a group of people that have been assembled, filled out a profile, and are willing to share their opinions, close to postal survey costs)
Example of a postal survey: Environmental Attitude Survey 2017 in Helsinki
- Simple random sample of 3 000 persons: 17–74 years old population in Helsinki
- After one reminder, sample was almost 1 000 responses, response rate 33 %
- Source: Hirvonen, Jukka & Vanhatalo, Maaria (2018). Ympäristöasenteet jakaupunkikehitys Helsingissä ja Vantaalla. Research Series 2018:1. City of Helsinki, Executive Office, Urban Research and Statistics.
Remember to add data
collection costs to your budget!

Survey (our case)
1. Multidisciplinary research team (interests: wellbeing, habits, housing)
2. 10 themes and 42 questions (mainly multiple-choice questions)
3. Themes: (1) Home routines, (2) eating habits, (3) use of social media at home, (4) work
and home, (5) visitors, (6) pets, (7) power of decision, (8) satisfaction towards home,
(9) how does your home feel like (two open-ended questions) and (10) dream home.
4. We used small amount of data that covered questions connected to housing design
practices

Questions used in the analysis
1. What would be the ideal number of rooms needed by your household? Give the number of rooms excluding the kitchen.
2. What would be the ideal apartment size needed by your household?
3. What kitchen type do you consider to be the best? Multiple-choice question (separate kitchen that is sufficiently large to accommodate a dining table, open plan kitchen connected to the living room or other space and kitchenette).
4. If you would receive additional ten square meters in your current dwelling, how would you use them? Choose all the spaces in which you would use these extra square metres. Multiple-choice question (living room, kitchen, dining space, bedroom, work space, bathroom, sauna, hallway, walk-in closet or other storage space and I do not need extra space.
5. I experience a shortage of space at home. Five-level scale ranging from completely agree (value 1) to completely disagree (value 5).

Defining survey questions
1. Ask questions that are relevant for your interests: surveys become easily too long and
you lose respondents!
2. Preliminary ideas about the analysis: Hypothesis (do your homework = 1. examine
what has already been studied meaning ask what is NOT already known and 2. build
your understanding on the existing knowledge)
OUR SURVEY:
1. Questions related to housing design practices were defined based on preceding
interview study (N = 68)
a. Significance of the kitchen type
b. Shortage of space (more than one room)
2. Survey enabled to test the findings of interview study with a bigger sample (N = 1 453)

Background information (our case)
1. Related to analysis: Try to figure out what you need.
2. In addition to typical background information (age, gender, household size and
composition, number of underaged children, postal code, education, income, position in
labour market, dwelling type and number of rooms/apartment type, apartment size) we
asked kitchen type (open-plan kitchen, separate kitchen with a dining table, separate
kitchen without dining table, kitchenette, no kitchen).
3. What we should have asked: Year of construction.

Variables used in the analysis
Background information :
- Age, income, apartment size (floor area), apartment type (room number, kitchen excluded), household size (persons), kitchen type, postal code
Ideal/ preferred dwelling features:
- Dwelling type, dwelling size, kitchen type
Derived variables:
- Desired extra rooms
- Desired extra space (square meters)
- Dwelling density (space per person)
- Desired extra dwelling density
Small amount of variables can provide significant results.

Responses and analysis were based on the current housing situation.

Some methods for survey analysis- In our article, we used only quite simple statistical methods: Calculating means, medians
and other statistics, cross tabulations.
- Often these are quite sufficient for survey analysis. But, depending on research questions, sometimes also more complex methods are needed.
- Statistical models: e.g. how a set of explanatory variables (independent variables) predict one dependent variable. Various models depending on types of variables:
1. Linear regression: a dependent variable continuous, independent variables continuous/dichotomous
2. Logistic regression: a dependent variable dichotomous, independent variables continuous/dichotomous
3. ANOVA (analysis of variance): dependent variable continuous, independent variables categorical.
As the analysis tool we used SPSS-program – a good tool for survey data analysis. Other alternatives: SAS, Stata ….

Analyzing representativenessComparison: Research data vs population statistics
- Before the analysis we explored the representativeness of the data: comparing features of the data with population statistics (Helsingin seudun aluesarjat, Statistics Finland)
- Highly important when not having representative sample (validity)
Age groups in our data:
- Age groups under 40 years were over-represented and age groups over 50 years under-represented
- The age group of 40–49 years is ”correctly” represented

Analyzing representativeness – continued
Location and gender in our data:
- Residents of Helsinki were over-represented
- Women were over-represented: in population 51 % women, in survey data 77 %.
- Women are typically over-represented in surveys. Young men are difficult to catch.

Self-selected sample and generalization of results
- Our data was self-selected sample (i.e. not representative sample), which is always biased.
- Therefore, resulted statistics (means, percentage values etc.) cannot be generalized for the
whole population.
- However, this type of data allowed to study interdependencies of variables, e.g. current
apartment size vs. experienced shortage of space.

Example of correction of nonresponse bias
- In a case of a random sample: possible to correct
nonresponse bias by weighting responses.
- In the Environmental Attitude Survey 2017:
- Young age groups were under-represented
and older age groups over-represented.
- We calculated for each age group a weight,
which compensated this bias.
- When analyzing the data every response
were weighted → distributions and statistics
were more reliable (better generalization for
the population).
age group weight18-29 1,4230-39 1,2740-49 1,1850-59 0,9260-69 0,5970-74 0,60

Current and ideal dwelling
“What would be the ideal number of rooms needed by your household? Give the number of rooms excluding the kitchen.”
- Majority of solo respondents (85%) lived in apartments with one or two rooms (kitchen is not counted as a room).
- One-room apartments were inhabited by 42 per cent, but perceived as ideal by only 3 per cent.
- Three-room apartments were inhabited by 12 per cent, and perceived as ideal apartment type by 44 per cent.

Desires concerning extra rooms: a gap between a current and an ideal dwelling
- In an optimal situation, 48 per cent would like to have one extra room, and 23 per cent even two or more extra rooms.
- 27 per cent of the solo respondents already lived in their ideal apartment types with a majority (57%) of these respondents occupied two-room apartments.

Current and ideal dwelling size by incomelevel
- Income level predicts strongly the current living space (not surprising)
- Also, dependency between the income level and ideal living space, but not linear.
- In general, somewhat realistic dreams and hopes (mainly one extra room): ”Ideals” are realistic.

Terminology: Lessons learnt
1. Small things may cause big problems.
2. Example: using “ideal” (ideal apartment size, ideal number of rooms)
i. We used the Finnish word “ihanteellinen” that is not exactly “ideal”.
ii. Translation: Think in advance how the words used in survey (applies to other data
collection methods as well) can be translated. Important in non-English surveys!
3. Choose the terminology used in the field
i. Diminishes misunderstandings
ii. Makes it easy to define terminology/ key concepts
iii. In order to do this, it is necessary to considered analysis and even publishing processes
before staring data collection (Significance of the literature review)
4. Respondents’ (lay persons) language vs. Professionals’ jargon

The experienced shortage of space byrespondents’ age
- More than a quarter of respondents in the age groups 20–49 experienced shortage of space (completely/somewhat agree the statement).
- In the age group 60–69 years this share was only 8 %.
- Statistics describing shortage of space (overcrowded) exclude one-person households (Norm 4)

Experienced shortage of space in relation to solo respondents’ current dwelling size
- In dwellings (apartments) less than 31 m2, 50 % experienced shortage of space.
- Even in dwellings less than 21 m2
about half of respondents did not experience a shortage of space → Experiences seem to be very subjective and individual.
- In dwellings more than 50 m2 almost nobody experienced shortage of space.

Subjective experience and dwelling density
- Interdependence between measured dwelling density (m2 per person) and experienced shortage of space is different between the solo respondents and other respondents.
- In multi-person households, only 20 % experienced shortage of space when the dwelling density is 26–30 m2, whereas almost a half of the solo respondents did so.
- The explanation: all apartments contain communal spaces (kitchen, bathroom, hallway), which are not necessarily notably different in size in different apartment types and sizes.
- The conclusion: it is not reasonable to compare dwelling density per capita between different household types, because solo dwellers lack the opportunity to share domestic spaces.

Desires concerning extra dwelling density –solo dwellers and multi-person households
- When current dwelling density was controlled, we find a regularity: solo dwellers desired roughly 10 m2 more extra space than two-person households, and roughly 12–13 m2 more extra space than 3–4 persons households.
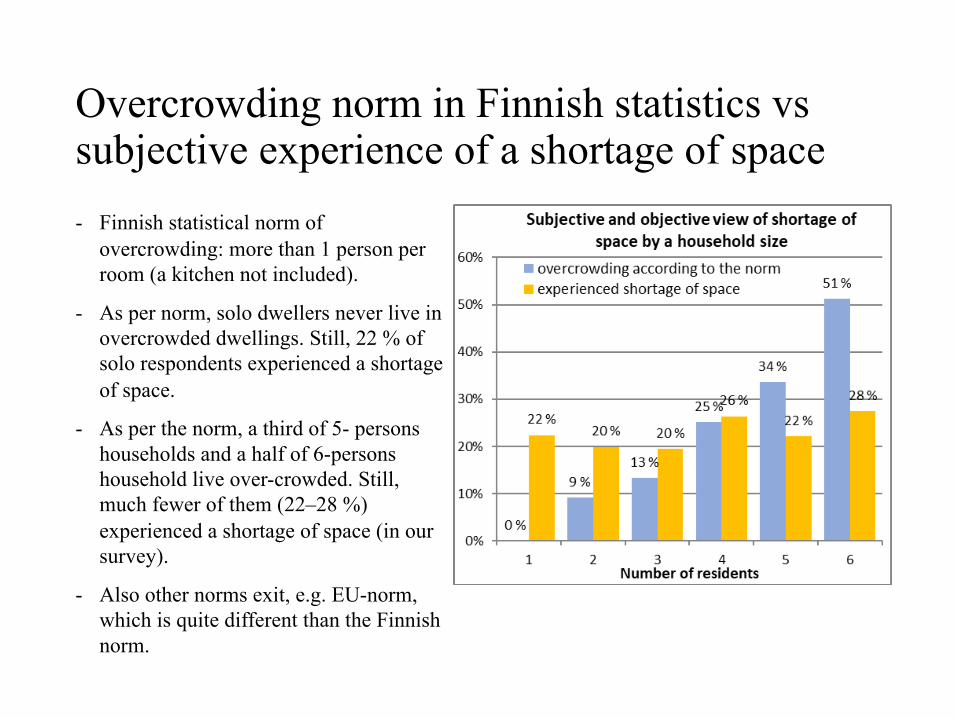
Overcrowding norm in Finnish statistics vssubjective experience of a shortage of space- Finnish statistical norm of
overcrowding: more than 1 person per room (a kitchen not included).
- As per norm, solo dwellers never live in overcrowded dwellings. Still, 22 % of solo respondents experienced a shortage of space.
- As per the norm, a third of 5- persons households and a half of 6-persons household live over-crowded. Still, much fewer of them (22–28 %) experienced a shortage of space (in our survey).
- Also other norms exit, e.g. EU-norm, which is quite different than the Finnish norm.

The overcrowding norm, ”subjectiveovercrowding” and the number of rooms
- The norm does not support very well with respondents´ subjective feeling.
- In one-room apartments, 39 % of solo respondents experienced a shortage of space.
- As per the norm, a 4-room dwelling with a 5-person family is overcrowded. However, almost 70 % of them did not experience a shortage of space (in our survey).
Share of respondents who experienced a shortage of space, by a number of rooms and a number of residents
Number of rooms
Number of residents in a dwelling1
person2
persons3
persons4
persons5
persons1 39 % 46 % 75 %2 15 % 29 % 59 % 65 % 67 %3 5 % 12 % 22 % 53 % 68 %4 4 % 6 % 12 % 28 % 31 %5 5 % 4 % 14 % 17 %6 6 % 0 % 1 % 16 %
Yellow area = overcrowding
according to the norm

Some methodology related findings: Apartment type, kitchen type and shortage of space1. 36% experienced shortage of space in 1-room apart. with an open-plan kitchen
2. 19% experienced shortage of space in 1-room apart. with separate kitchens
3. Apartment size did not explain the difference completely: 1-room apart. with an open-
plan kitchen, approx. 32m2 and 1-room apart. with separate kitchens approx. 38m2.

Main points/ Conclusion
1. Background information and survey questions: What are you going to need in the
analysis? Variables used in the analysis.
2. Difference between self-selected and representative sample
3. Terminology (language issues, field-specific terms and concepts)
4. Difference ways of conducting survey (resources: time and costs)
Networking: Find experts to work with (and who know
different things than you do).