survey on corruption (the asia foundation april 2015)
TRANSCRIPT

This survey is made possible by the generous support of the Australian Government through the Australian Department of Foreign Affairs and Trade. The Asia Foundation and the Sant-Maral Foundation have implemented the survey, which does not necessarily reflect the views of Australian Government and DFAT.
Cover photos by:S. MandakhjargalbayarE. Enkhtulga
SURVEY ON PERCEPTIONS AND KNOWLEDGE OF CORRUPTION
Strengthening Transparency in Mongolia Project
April, 2015

SURVEY ON PERCEPTIONS AND KNOWLEDGE OF CORRUPTION
4
TABLE OF CONTENTS
I. Introduction ................................................................................................................................ 7
II. Key Findings ................................................................................................................................ 8
III. Survey Methodology .................................................................................................................. 9
1. Major problems ................................................................................................................. 11
2. Expectations of Fairness and Transparency in Elections ........................................... 13
3. Level of Corruption ............................................................................................................ 16
4. Assessment of Corruption Trends .................................................................................. 19
5. Fighting Corruption ........................................................................................................... 21
6. Anti-corruption Initiatives ............................................................................................... 27
7. Expectations of Fair Treatment ....................................................................................... 29
8. Grand Corruption .............................................................................................................. 30
9. Petty Corruption ................................................................................................................ 35
10. Factors Shaping Public Attitudes ................................................................................... 39
11. Data Demographics ......................................................................................................... 40
IV. Survey Instrument ...................................................................................................................... 43
SURVEY ON PERCEPTIONS AND KNOWLEDGE OF CORRUPTION
5
LIST OF FIGURES:
Figure 1.1: Major problems (choose one, open question) ........................................................ 11
Figure 1.2: Unemployment .............................................................................................................. 12
Figure 1.3: Corruption ....................................................................................................................... 12
Figure 1.4: Corruption is a common practice in our country ..................................................... 12
Figure 2.1: To what extent do you expect the following aspects of the elections to be fair and transparent? (Valid %) ......................................................................... 13
Figure 2.2: How fair and transparent are the following stages of the election process? ...... 15
Figure 2.3: Mean response values for each election stage (from 1 = “Not at all” to 4 = “To a large extent”) ...................................................... 16
Figure 3.1: Impact of corruption ...................................................................................................... 16
Figure 3.2: Extent of corruption ....................................................................................................... 18
Figure 3.3: Extent of corruption ....................................................................................................... 18
Figure 3.4: Rural vs. UB rankings of corruption ............................................................................ 19
Figure 4.1: In the past three years, how has the level of corruption in Mongolia changed? .................................................................................................. 20
Figure 4.2: How do you expect the level of corruption in the next three years to change? .. 20
Figure 5.1: Factors hindering the fight against corruption (from 1 = “not at all” to 4 = “a lot”) ............................................................................. 21
Figure 5.2: Measures to eliminate corruption ............................................................................. 22
Figure 5.3: In your opinion, who should organize and lead the effort to combat corruption? (Choose one) .............................................................................. 23
Figure 5.4: How do you think the current government will perform compared to its predecessor in fighting corruption? ...................................................................... 23
Figure 5.5: How do you evaluate the IAAC’s performance in fighting corruption? ................. 24
Figure 5.6: How much confidence do you have in the IAAC to fight corruption? ................... 24
Figure 5.7: Are you confident that IAAC is an impartial law enforcement body? ................... 25
Figure 5.8: Since the introduction of the new law on corruption, are you aware of any officials being prosecuted by the justice system? ............................................ 25
Figure 5.9: Are you aware of a telephone hotline to report corruption? .................................. 26
Figure 5.10: Would you report a corruption case if the IAAC would accept anonymous information? ............................................................................................... 26
Figure 6.1: How IMPORTANT is each of the following? ............................................................... 28

SURVEY ON PERCEPTIONS AND KNOWLEDGE OF CORRUPTION
6
Figure 6.2: How EFFECTIVE is each of the following? .................................................................. 28
Figure 7.1: Fair treatment in education and health ...................................................................... 29
Figure 7.2: Fair treatment by the judiciary and law enforcement ............................................. 29
Figure 7.3: Fair treatment from local and national government ................................................ 30
Figure 8.1: Definitions of grand corruption ................................................................................... 31
Figure 8.2: Why is there GC in Mongolia? ..................................................................................... 31
Figure 8.3: The level of GC in Mongolia .......................................................................................... 32
Figure 8.4: How frequently do you hear about incidents of grand corruption? ...................... 32
Figure 8.5: If you know of a specific case, how was the bribe given? ..................................... 33
Figure 8.6: Do you think that GC has any negative impact on you and your family? .............. 33
Figure 8.7: In your opinion, who should organize and lead the effort to combat grand corruption? (Choose one) .................................................................................. 34
Figure 8.8: In your opinion, what is the most effective way to combat GC? ............................ 35
Figure 9.1: If you face a situation in which you are directly asked for a bribe by a public or private official, what are you most likely to do? (Choose one) ........... 35
Figure 9.2: Where would you report corruption, if anywhere? ................................................... 36
Figure 9.3: In the past three months, have you or anyone in your household paid a bribe in any form? ........................................................................................................ 37
Figure 9.4: Which of the following applies to the bribes you paid in the past three months? 37
Figure 9.5: Percent of households whose budget was “seriously damaged” ......................... 38
Figure 10.1: Leading variables in shaping attitudes ...................................................................... 40
Figure 11.1: If you face a situation in which you are directly asked for a bribe by a public or private official, what are you most likely to do? (By area) .................. 41
Figure 11.2: If you face a situation in which you are directly asked for a bribe by a public or private official, what are you most likely to do? (By gender) ............. 41
Figure 11.3: If you face a situation in which you are directly asked for a bribe by a public or private official, what are you most likely to do? (By income) ............ 42
Figure 11.4: If you face a situation in which you are directly asked for a bribe by a public or private official, what are you most likely to do? (By age) ................... 42
LIST OF TABLES:
Table 1: Sample Distribution ...................................................................................................... 10Table 3.1: Top five corrupt institutions ......................................................................................... 17Table 10.1 Factors shaping public attitudes ................................................................................. 39

SURVEY ON PERCEPTIONS AND KNOWLEDGE OF CORRUPTION
7
I. INTRODUCTION
In April 2015, The Asia Foundation, in collaboration with Sant-Maral Foundation, conducted its sixteenth Survey on Perceptions and Knowledge of Corruption (SPEAK) in Mongolia, a nationwide survey of citizens in rural soums, aimags, and the capital city Ulaanbaatar, generously supported by Australia’s Department of Foreign Affairs and Trade. Known from 2006 to 2011 as the Mongolia Corruption Benchmarking Survey, it was renamed SPEAK in 2012.
SPEAK is one of just a few regular, nationwide surveys in Mongolia, and its results are widely cited and used by civil society and government organizations. It provides a unique and robust tool for government policymakers and civil society groups to raise awareness and educate the public. The survey measures public perceptions and understanding of corruption, grand corruption, government institutions, and the impact of petty corruption on the day-to-day life of Mongolian households. The longitudinal design of the survey helps to track long-term changes and trends in perceptions and attitudes.
In 2012, The Asia Foundation also introduced a complementary report, the Study of Private Perceptions of Corruption (STOPP), under the USAID-funded Strengthening Transparency and Governance project (STAGE), to better gauge over time the perceptions of Mongolian private sector actors. Currently, The Asia Foundation has commissioned a number of detailed, in-depth studies focusing on health, mining, and construction, which will be released later in 2015.
SURVEY ON PERCEPTIONS AND KNOWLEDGE OF CORRUPTION
8
II. KEY FINDINGS
l Since the second half of 2013, the trend in combating corruption has reversed.
l In March 2013, slightly over a third of respondents (35.1 percent) thought that the government of PM Altankhuyag would do better with corruption than its predecessor. In April 2015, less than a tenth (7.2 percent) thought that the government of PM Saikhanbileg would do better than its predecessor.
l If, in September 2013, more than a third of respondents (41 percent) thought that corruption had increased in the last three years, in April 2015, more than half (59 percent) thought that corruption had increased.
l If, in September 2013, slightly over half of respondents (52.5 percent) were optimistic that corruption would decrease in the next three years, in April 2015, just more than a quarter of respondents (27.4 percent) were so optimistic.
l Positive evaluations of the Independent Authority Against Corruption’s (IAAC) performance have been decreasing, from 29.4 percent in September 2013 to 22.6 percent in March 2014, and to 16.6 percent in April 2015. A decrease is also observed in respondents’ confidence in the IAAC, with 46.5 percent confident in 2013, 45.7 percent in 2014, and just 39.2 percent in 2015. In addition, confidence in the IAAC’s impartiality has dropped significantly, from 34.7 percent in March 2014 to 21.7 percent in April 2015.
l A majority of respondents continue to “strongly” or “somewhat” agree with the statement, “Corruption is a common practice in our country” – more than 80 percent since 2006, rising to 85.3 percent in April 2015.
l Campaign finance at various stages of the electoral process is expected to be one of the biggest concerns in the upcoming 2016 Elections. Slightly over half (53 percent) expect that campaign finance will be “not at all” fair and transparent.
l For the first time, political corruption is emerging as a strong concern. Three of the five institutions deemed most corrupt are political: political parties, national government, and Parliament. National government ranked at the top for the first time since 2006.
l Among factors hindering the anti-corruption fight, a cultural factor, “the habit of solving problems through corrupt practices,” has fallen from first to second place in the rankings (from a mean value of 3.45 in November 2012 to 3.12 in April 2015). Instead, imperfect legislation and sanctions has moved into first place.
l Since 2012, the most popular way to fight corruption has been strong enforcement measures.
l Among recent initiatives by state institutions to reduce corruption, respondents ranked “introduction of new technology” highest in both importance and effectiveness. Almost

SURVEY ON PERCEPTIONS AND KNOWLEDGE OF CORRUPTION
9
two thirds of respondents (71.6 percent) rated it as “significantly” or “extremely” important, and over half of respondents (62.2 percent) rated it as “significantly” or “extremely” effective.
l The most widely cited reasons for Grand Corruption in Mongolia were lack of transparency at high levels of government (19.5 percent) and merger of business and
political interests (19.1 percent).
III. SURVEY METHODOLOGY
Structured, face-to-face interviews were conducted with adults 18 years of age and above. A multi-stage, random sampling procedure was used with probability sampling in an area cluster.
In the first stage, Ulaanbaatar and up to two aimags (provinces) from each of the four regions were selected randomly, followed by the random selection of soums (counties) within those aimags and khoroos (subdistricts) in Ulaanbaatar. Aimag centers and soum centers (administrative centers) were always included in the sample.
In the second stage, the primary sample units (PSUs) were selected. In Ulaanbaatar, the PSUs were randomly selected khesegs (subdistricts). In the aimag centers, the PSUs were randomly selected bags (the smallest political subdivision of an aimag). In soum centers, a block of households was designated by the interview supervisor. The size of PSUs was kept at eight households.
In the third stage, the starting point and included households were established. In apartment areas of Ulaanbaatar, interviewers were provided with addresses (building and flat number). In ger districts, the field executive provided interviewers with street numbers and starting points. Working from the starting point, the interviewers in ger districts would skip the first household, interview the second household, then use the right-hand rule and interview every third household. In aimag centers and soums centers, starting points were determined by supervisors, and interviewers then followed the right-hand rule and selected every third household. At the household level, the head of household or the household member who was most familiar with household matters was selected for the interview.
This report highlights the findings of the SPEAK V survey, which was started on March 30, 2015, and completed on April 16, 2015. The enumerators surveyed 170 PSUs consisting of 1,360 households in eight districts of Ulaanbaatar and in 22 soums of six aimags.1 The sample distribution is shown in the following table:
1 Results are based on face-to-face interviews with 1,360 adults aged 18 and older. For results based on the total national sample of adults, the margin of sampling error is ±1.6 percentage points (if p=10 percent and 1-p=90 percent) to ±2.6 percentage points (if p=40 percent and 1-p=60 percent) at the 95% confidence level. In addition to sampling error, question wording and practical difficulties in conducting surveys can introduce error or bias into the findings of public opinion polls.

SURVEY ON PERCEPTIONS AND KNOWLEDGE OF CORRUPTION
10
TABLE 1: SAMPLE DISTRIBUTION
Region City/Aimag District/Soum Households Interviewed
Ulaanbaatar 560
Khan-Uul 56
Bayanzurkh 128
Sukhbaatar 65
Chingeltei 72
Bayangol 88
Songinokhairkhan 119
Nalaikh/Baganuur 32
Aimags 800
Western Region
Uvs 200
Ulaangom (central soum) 80
Turgen 24
Sagil 32
Zuungovi 32
Khyargas 32
Khangai Region
Arkhangai 120
Erdenebulgan (central soum) 56
Ikh Tamir 32
Battsengel 32
Ovorkhangai 160
Arvaikheer (central soum) 56
Bat-Ulzii 40
Bayangol 32
Taragt 32
Central Region
Dundgovi 104
Saintsagaan (central soum) 48
Gurvansaikhan 32
Delgertsogt 24
Tov 120
Zuunmod (central soum) 56
Argalant 20
Bayankhangai 20
Lun 24
Eastern Region
Khentii 96
Kherlen (central soum) 40
Batnorov 32
Tsenkhermandal 24
Total 1360
SURVEY ON PERCEPTIONS AND KNOWLEDGE OF CORRUPTION
11
1. MAJOR PROBLEMS
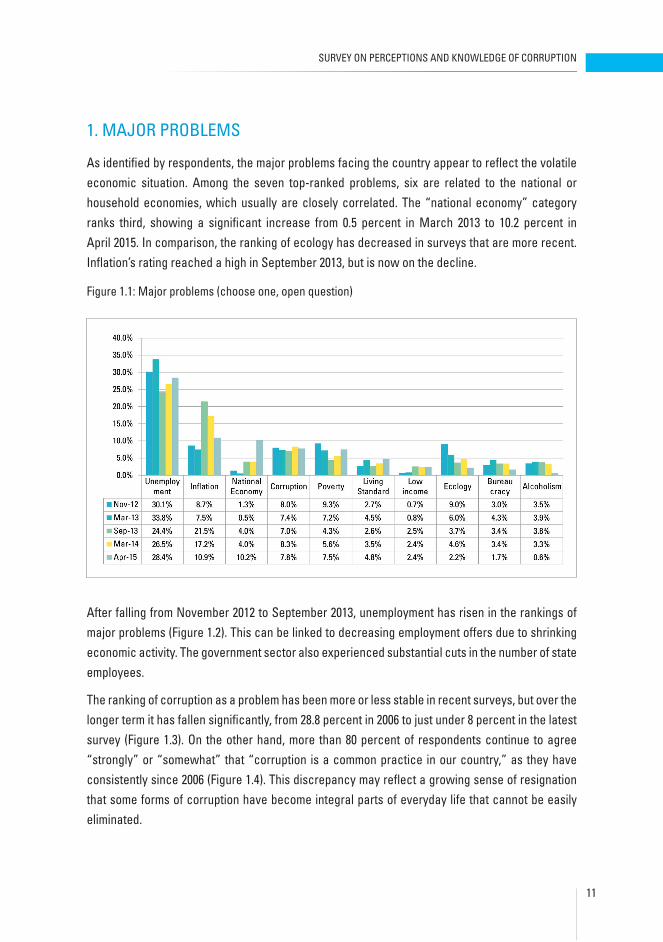
As identified by respondents, the major problems facing the country appear to reflect the volatile economic situation. Among the seven top-ranked problems, six are related to the national or household economies, which usually are closely correlated. The “national economy” category ranks third, showing a significant increase from 0.5 percent in March 2013 to 10.2 percent in April 2015. In comparison, the ranking of ecology has decreased in surveys that are more recent. Inflation’s rating reached a high in September 2013, but is now on the decline.
Figure 1.1: Major problems (choose one, open question)
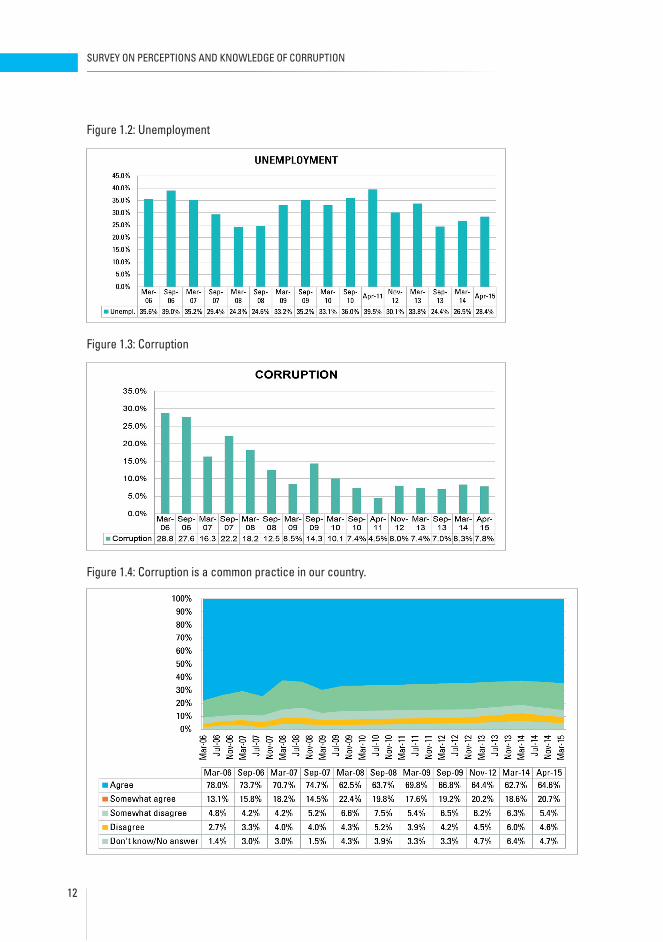
After falling from November 2012 to September 2013, unemployment has risen in the rankings of major problems (Figure 1.2). This can be linked to decreasing employment offers due to shrinking economic activity. The government sector also experienced substantial cuts in the number of state employees.
The ranking of corruption as a problem has been more or less stable in recent surveys, but over the longer term it has fallen significantly, from 28.8 percent in 2006 to just under 8 percent in the latest survey (Figure 1.3). On the other hand, more than 80 percent of respondents continue to agree “strongly” or “somewhat” that “corruption is a common practice in our country,” as they have consistently since 2006 (Figure 1.4). This discrepancy may reflect a growing sense of resignation that some forms of corruption have become integral parts of everyday life that cannot be easily eliminated.
SURVEY ON PERCEPTIONS AND KNOWLEDGE OF CORRUPTION
12
Figure 1.2: Unemployment
Figure 1.3: Corruption
Figure 1.4: Corruption is a common practice in our country.
EXPECTATIONS OF FAIRNESS AND TRANSPARENCY IN ELECTIONS

SURVEY ON PERCEPTIONS AND KNOWLEDGE OF CORRUPTION
13
2. EXPECTATIONS OF FAIRNESS AND TRANSPARENCY IN ELECTIONS
With parliamentary elections coming in 2016, there has already been a surge of political activity. Much public debate has focused on vote-counting systems, electoral districts and constituencies, and voter participation. It has been observed that the public views these matters with caution due to many past electoral irregularities.
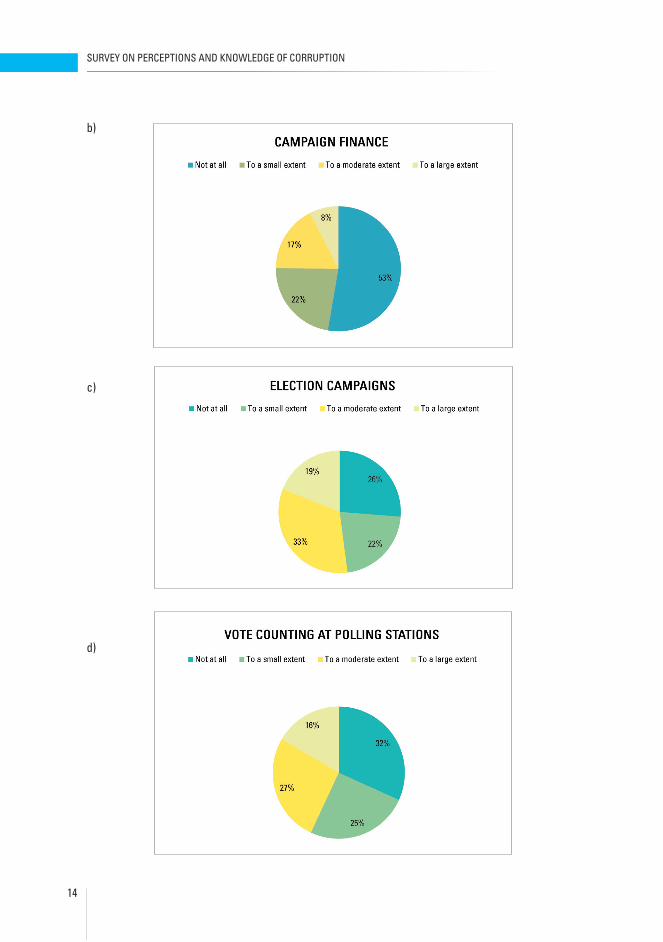
Based on valid answers,2 respondents had the lowest expectation of fairness and transparency in campaign finance (Figure 2.1b). Slightly over half of respondents (53 percent) considered campaign finance to be “not at all” fair and transparent.
Over half of respondents (60 percent) considered the preparatory stage of elections – voter registration, assembling teams of observers, etc. – to be fair and transparent “to a small extent” or “not at all” (Figure 2.1a). Close to 57 percent had a negative view of the fairness and transparency of vote counting at the polling station (Figure 2.1d), and slightly more than half (51 percent) considered the final stage of elections – aggregation and reporting of results by the General Election Commitee – to be fair and transparent “to a small extent” or “not at all” (Figure 2.1e).
Election campaigns fared better when rated for fairness and transparency, but still, a quarter of respondents saw this process as not transparent at all (Figure 2.1c). This relatively positive assessment can mainly be linked to the public’s higher exposure to election campaign process in comparison to other stages.
Figure 2.1: To what extent do you expect the following aspects of the elections to be fair and transparent? (Valid %)
a)
2 Valid %: calculations excluding “don’t know” and “no answer” options.
SURVEY ON PERCEPTIONS AND KNOWLEDGE OF CORRUPTION
14
b)
c)
d)

SURVEY ON PERCEPTIONS AND KNOWLEDGE OF CORRUPTION
15
e)
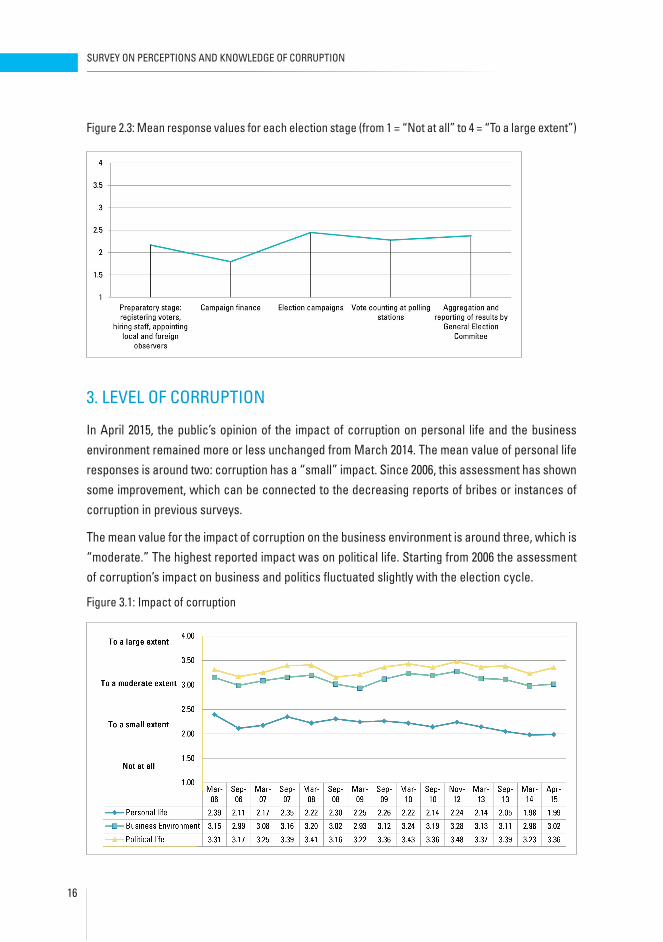
Nevertheless, when we include non-valid responses in the results,3 the highest percentage of respondents with no opinion was in the category of campaign finance (Figure 2.2). Nearly a quarter of respondents (23.1 percent) could not answer the question. A notable percentage of respondents had no opinion or expressed uncertainty about the preparatory stage and the vote-counting stages of the election process. Moreover, if we look at mean values, campaign finance and the preparatory stage of elections are rated the least fair and transparent (Figure 2.3).
Figure 2.2: How fair and transparent are the following stages of the election process?
3 Non-valid responses: “don’t know” and “no answer”
SURVEY ON PERCEPTIONS AND KNOWLEDGE OF CORRUPTION
16
Figure 2.3: Mean response values for each election stage (from 1 = “Not at all” to 4 = “To a large extent”)
3. LEVEL OF CORRUPTION
In April 2015, the public’s opinion of the impact of corruption on personal life and the business environment remained more or less unchanged from March 2014. The mean value of personal life responses is around two: corruption has a “small” impact. Since 2006, this assessment has shown some improvement, which can be connected to the decreasing reports of bribes or instances of corruption in previous surveys.
The mean value for the impact of corruption on the business environment is around three, which is “moderate.” The highest reported impact was on political life. Starting from 2006 the assessment of corruption’s impact on business and politics fluctuated slightly with the election cycle.
Figure 3.1: Impact of corruption
SURVEY ON PERCEPTIONS AND KNOWLEDGE OF CORRUPTION
17
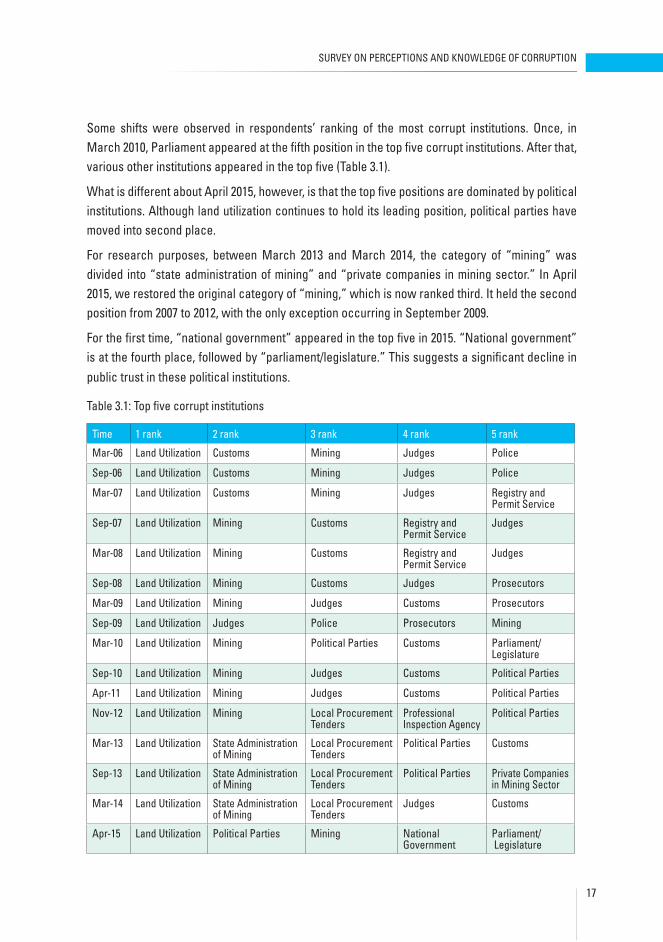
Some shifts were observed in respondents’ ranking of the most corrupt institutions. Once, in March 2010, Parliament appeared at the fifth position in the top five corrupt institutions. After that, various other institutions appeared in the top five (Table 3.1).
What is different about April 2015, however, is that the top five positions are dominated by political institutions. Although land utilization continues to hold its leading position, political parties have moved into second place.
For research purposes, between March 2013 and March 2014, the category of “mining” was divided into “state administration of mining” and “private companies in mining sector.” In April 2015, we restored the original category of “mining,” which is now ranked third. It held the second position from 2007 to 2012, with the only exception occurring in September 2009.
For the first time, “national government” appeared in the top five in 2015. “National government” is at the fourth place, followed by “parliament/legislature.” This suggests a significant decline in public trust in these political institutions.
Table 3.1: Top five corrupt institutions
Time 1 rank 2 rank 3 rank 4 rank 5 rank
Mar-06 Land Utilization Customs Mining Judges Police
Sep-06 Land Utilization Customs Mining Judges Police
Mar-07 Land Utilization Customs Mining Judges Registry and Permit Service
Sep-07 Land Utilization Mining Customs Registry and Permit Service
Judges
Mar-08 Land Utilization Mining Customs Registry and Permit Service
Judges
Sep-08 Land Utilization Mining Customs Judges Prosecutors
Mar-09 Land Utilization Mining Judges Customs Prosecutors
Sep-09 Land Utilization Judges Police Prosecutors Mining
Mar-10 Land Utilization Mining Political Parties Customs Parliament/ Legislature
Sep-10 Land Utilization Mining Judges Customs Political Parties
Apr-11 Land Utilization Mining Judges Customs Political Parties
Nov-12 Land Utilization Mining Local Procurement Tenders
Professional Inspection Agency
Political Parties
Mar-13 Land Utilization State Administration of Mining
Local Procurement Tenders
Political Parties Customs
Sep-13 Land Utilization State Administration of Mining
Local Procurement Tenders
Political Parties Private Companies in Mining Sector
Mar-14 Land Utilization State Administration of Mining
Local Procurement Tenders
Judges Customs
Apr-15 Land Utilization Political Parties Mining National Government
Parliament/ Legislature

SURVEY ON PERCEPTIONS AND KNOWLEDGE OF CORRUPTION
18
Closer examination of mean levels of assessment of corruption in various institutions shows that most have an average score of three (Figure 3.2). Respondents consider the banking sector to be affected by corruption to some extent. While land utilization is at the top, as a majority of respondents consider it to be significantly affected by corruption.
Figure 3.2: Extent of corruption
4
4 Respondents are asked to evaluate corruption levels of various institutions. Numerical value scaling from 1 to 5 represents an institution as not corrupt at all to extremely corrupt. Mean values are the average of points from 1 to 5.
Broken down it can be seen that a significant number of respondents believe that most of these institutions are moderately, significantly, or extremely corrupt (Figure 3.3). This assessment of extent of corruption ranges from the highest of 81.4 percent of respondents evaluation of land utilization to the lowest of 39.6 percent of respondents evaluation of banking and financial institutions.
Figure 3.3: Extent of corruption

SURVEY ON PERCEPTIONS AND KNOWLEDGE OF CORRUPTION
19
When we segregate rural respondents from Ulaanbaatar respondents, some significant differences can be observed. UB respondents rated corruption much higher in the listed institutions than did rural respondents. Among the institutions with the greatest difference was the tax office, with a difference of 0.44 (Figure 3.4). Four other institutions with a notable rural-UB divide are the Professional Inspection Agency, political parties, the Registry and Permit Service, and local procurement tenders, with differences ranging from 0.39 to 0.43. UB residents’ greater exposure to media and access to services could be among the reasons for their higher assessments of corruption levels.
Figure 3.4: Rural vs. UB rankings of corruption
4. ASSESSMENT OF CORRUPTION TRENDS
Respondents’ evaluation of trends in levels of corruption showed more or less continuous improvement from 2006 through 2014. The belief that corruption levels were declining reached an all-time high in September 2013 and March 2014, but the April 2015 survey showed a significant turnaround in that belief (Figure 4.1). In March 2014, just 39.9 percent of respondents believed that levels of corruption had increased a little or a lot, but in April 2015 this number had grown to 59 percent.
SURVEY ON PERCEPTIONS AND KNOWLEDGE OF CORRUPTION
20
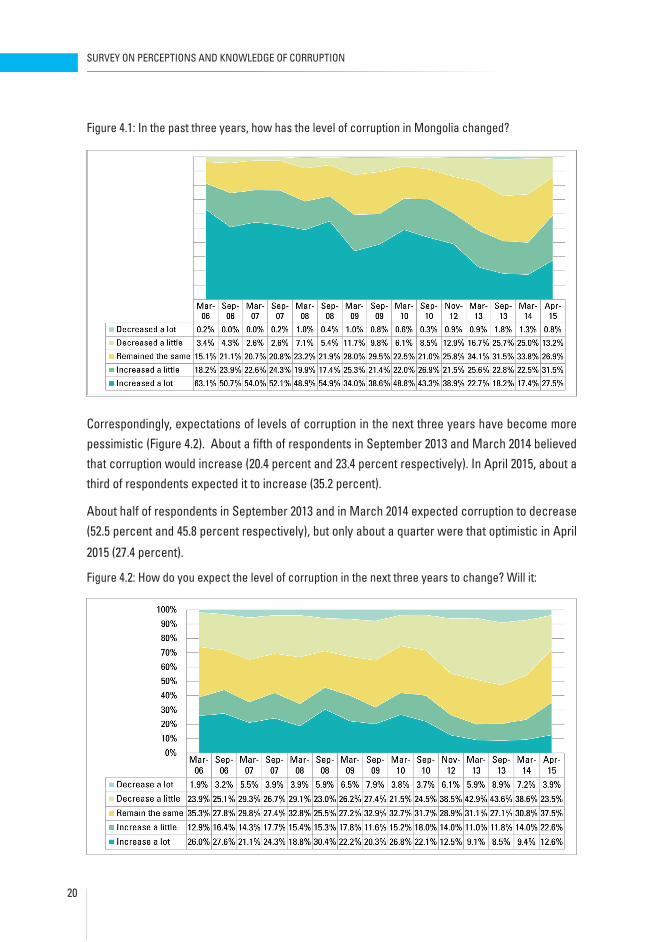
Figure 4.1: In the past three years, how has the level of corruption in Mongolia changed?
Correspondingly, expectations of levels of corruption in the next three years have become more pessimistic (Figure 4.2). About a fifth of respondents in September 2013 and March 2014 believed that corruption would increase (20.4 percent and 23.4 percent respectively). In April 2015, about a third of respondents expected it to increase (35.2 percent).
About half of respondents in September 2013 and in March 2014 expected corruption to decrease (52.5 percent and 45.8 percent respectively), but only about a quarter were that optimistic in April
2015 (27.4 percent).
Figure 4.2: How do you expect the level of corruption in the next three years to change? Will it:

SURVEY ON PERCEPTIONS AND KNOWLEDGE OF CORRUPTION
21
5. FIGHTING CORRUPTION
In exploring perceptions of the factors hindering the fight against corruption, we can find both negative and positive trends (Figure 5.1). On the positive side, in November 2012, the top factor was “the habit of solving problems through corrupt practices.” It retained its lead until March 2014, but its mean value has steadily decreased over the years of the survey, from 3.45 to 3.12. This trend is probably attributable to the gradual decrease in reports of petty corruption cases.
Other factors have fluctuated. “Imperfect legislation or sanctions against corruption” fell in the rankings from a mean value of 3.28 in November 2012 to 3.05 in September 2013, but in April 2015 it bounced back to 3.13 to become the highest-ranked factor hindering the fight against corruption. “Lack of will to control corruption from national political leadership” has also increased and now stands in third place. “Lack of will to control corruption from local political leadership” stands slightly lower, in fifth place.
Among the positive trends we have observed is the continuing decline of “corruption in law enforcement bodies,” from 3.41 in November 2012 to 3.04 in April 2015.
Figure 5.1: Factors hindering the fight against corruption (from 1 = “not at all” to 4 = “a lot”)

SURVEY ON PERCEPTIONS AND KNOWLEDGE OF CORRUPTION
22
Since November 2012, respondents have consistently ranked “strong enforcement measures and punishment” as the most effective way to eliminate corruption (Figure 5.2). This is followed by “consistent implementation of the rule of law.” This can be tied to the inconsistency of much legislation and its implementation.
“Strengthening civil control over public administration” has declined over the years, to 11.9 percent in April 2015. In contrast, “strengthening state control over public administration” has gained support and now stands at 15.4 percent. “Building public awareness” fell substantially in the last year, to 9.9 percent.
The general lack of support for civic and public initiatives can be attributed to respondents’ lack of belief in their efficacy.
“Increasing public employees’ salaries” had shown a consistent rising trend since November 2012, but it declined abruptly to 8.3 percent in April 2015. The previous increase was tied to public concern about inflation (Figure 1.1), which was creating demand for salary increases. The decline of “inflation” and the rise of “national economy” in the latest rankings of major problems appear to have affected respondents’ priorities.
Figure 5.2: Measures to eliminate corruption

SURVEY ON PERCEPTIONS AND KNOWLEDGE OF CORRUPTION
23
Despite minor shifts, the institution that respondents would prefer to lead the fight against corruption remains substantially unchanged since November 2012. The top choice by a large margin is the IAAC, selected by more than a third of respondents (37.8 percent) in April 2015. “National government” fell
by a few points from March 2014, and stands in second place with 14.2 percent. “Civil society” is third.
Figure 5.3: In your opinion, who should organize and lead the effort to combat corruption? (Choose one)
Is the current government fighting corruption more effectively than its predecessor? Public opinion on this question began to turn negative in September 2013 (Figure 5.4), and the current government of PM Saikhanbileg saw a decisive drop in the latest poll, amid general discontent with the state of the national economy and related governance issues. In September 2013, over a third of respondents (39.6 percent) believed that PM Altankhuyag’s government was doing better than the previous government of PM Batbold. However, in April 2015, less than a tenth of respondents (7.2 percent) believed the current government of PM Saikhanbileg was doing better than its predecessor.
Figure 5.4: How do you think the current government will perform compared to its predecessor in fighting corruption?

SURVEY ON PERCEPTIONS AND KNOWLEDGE OF CORRUPTION
24
The same negative trends emerged in respondents’ evaluations of the main anticorruption institution, the IAAC (Figures 5.5 and 5.6). Negative evaluations of IAAC performance increased from 32.1 percent in September 2013 to 37.3 percent in March 2014, and to 45.5 percent in April 2015. Correspondingly, confidence in IAAC decreased from 46.5 percent in September 2013 to 45.7 percent in March 2014, and to 39.2 percent in April 2015.
Figure 5.5: How do you evaluate the IAAC’s performance in fighting corruption?
Figure 5.6: How much confidence do you have in the IAAC to fight corruption?

SURVEY ON PERCEPTIONS AND KNOWLEDGE OF CORRUPTION
25
From March 2010 to March 2014, the number of respondents that considered IAAC to be an impartial law enforcement body was increasing, from a fifth of respondents (21.7 percent) in March 2010 to a third of respondents (34.7 percent) in March 2014 (Figure 5.7). Due to general discontent with the political system, this situation changed significantly in April 2015, as opinion reverted to the levels of March 2010.
Figure 5.7: Are you confident that IAAC is an impartial law enforcement body?
Another factor that can be tied to the IAAC evaluation is prosecutions of public officials. The public’s awareness of such prosecutions has decreased from 51.6 percent in September 2013 to 40.4 percent in April 2015 (Figure 5.8).
Figure 5.8: Since the introduction of the new law on corruption, are you aware of any officials being prosecuted by the justice system?
SURVEY ON PERCEPTIONS AND KNOWLEDGE OF CORRUPTION
26
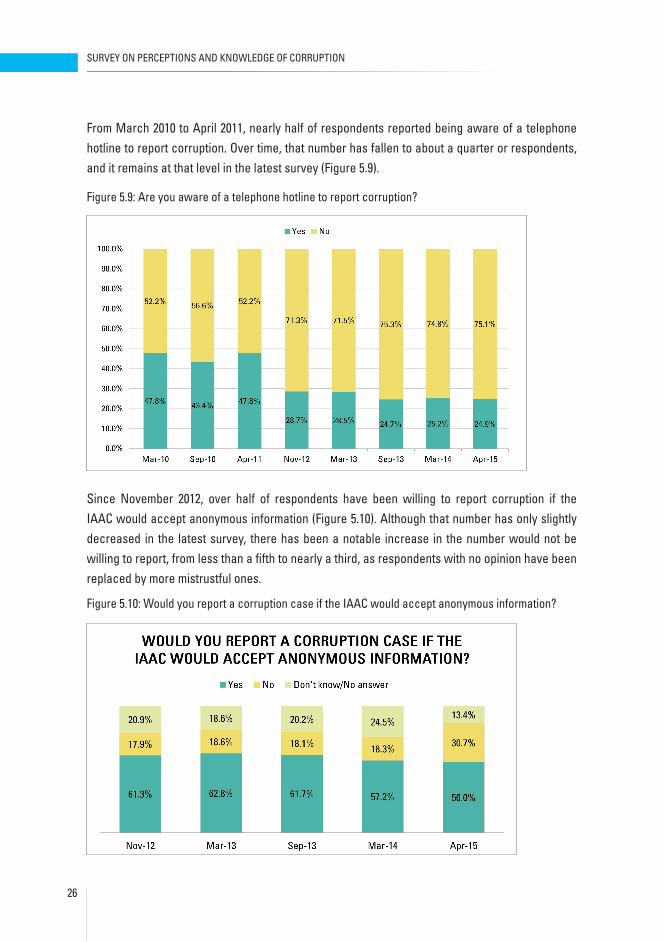
From March 2010 to April 2011, nearly half of respondents reported being aware of a telephone hotline to report corruption. Over time, that number has fallen to about a quarter or respondents, and it remains at that level in the latest survey (Figure 5.9).
Figure 5.9: Are you aware of a telephone hotline to report corruption?
Since November 2012, over half of respondents have been willing to report corruption if the IAAC would accept anonymous information (Figure 5.10). Although that number has only slightly decreased in the latest survey, there has been a notable increase in the number would not be willing to report, from less than a fifth to nearly a third, as respondents with no opinion have been replaced by more mistrustful ones.
Figure 5.10: Would you report a corruption case if the IAAC would accept anonymous information?
SURVEY ON PERCEPTIONS AND KNOWLEDGE OF CORRUPTION
27
6. ANTI-CORRUPTION INITIATIVES
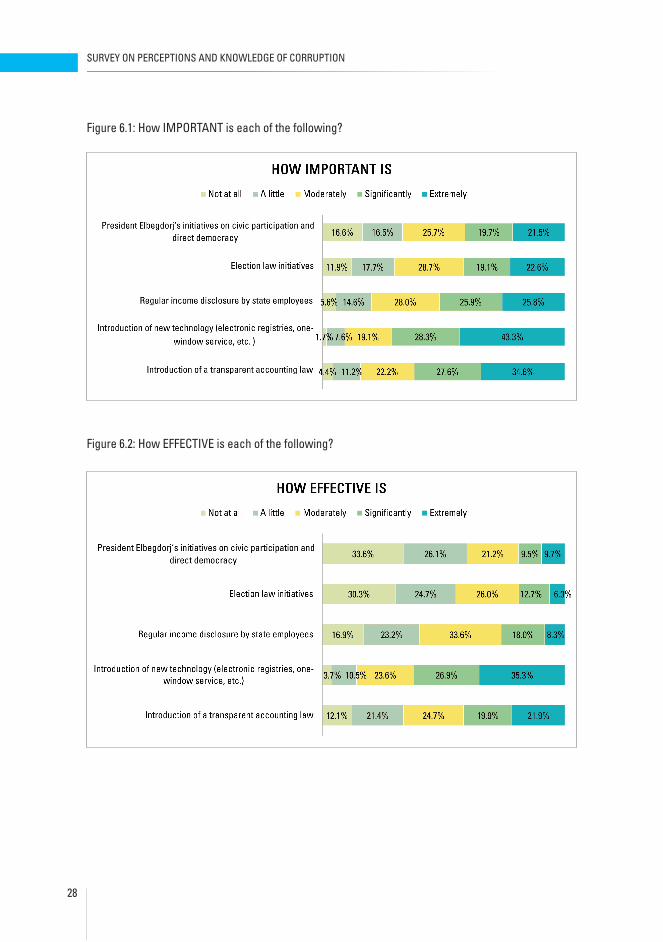
Among recent initiatives by state institutions to reduce corruption, “introduction of new technology” was ranked highest by respondents in both importance and effectiveness (Figures 6.1 and 6.2). About two thirds of respondents (71.6 percent) rated it “significantly” or “extremely” important, and over half of respondents (62.2 percent) called it “significantly” or “extremely” effective.
As new technology generally means computerization, respondents’ attitudes suggest a pragmatic outlook. Most can imagine benefits from public service automation5, such as eliminating human service providers with their potential for corrupt practices.
Next in the rankings by importance and effectiveness is the introduction of a transparent accounting law. Clear, formal procedures can also eliminate human interference. Well over half of respondents (62.2 percent) considered this measure “significantly” or “extremely” important. Somewhat less than half (41.8 percent) thought it would be “significantly” or “extremely” effective.
Among other initiatives, about half of respondents (51.7 percent) considered regular income disclosure by state employees to be “significantly” or “extremely” important, but only a quarter (26.3 percent) thought this measure would be “significantly” or “extremely” effective.
The lesser importance and effectiveness ascribed to civic participation seems to reflect the public’s skepticism about the capabilities of civil society. Although this attitude is changing, it is a rather slow process.
As for the election law initiative: while over a third of respondents (41.7 percent) considered it “significantly” or “extremely” important, less than a fifth (19 percent) considered it “significantly” or “extremely” effective. Such public skepticism may be tied to the constant changes in election laws.
5 Government Services Kiosks (Mongolian term “TUTS machine“)
SURVEY ON PERCEPTIONS AND KNOWLEDGE OF CORRUPTION
28
Figure 6.1: How IMPORTANT is each of the following?
Figure 6.2: How EFFECTIVE is each of the following?
SURVEY ON PERCEPTIONS AND KNOWLEDGE OF CORRUPTION
29
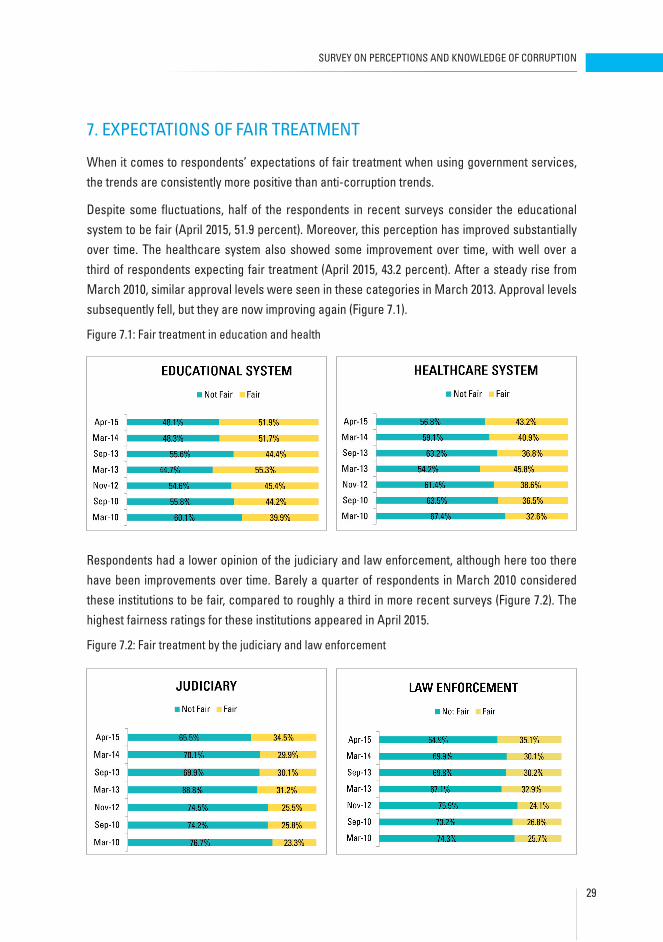
7. EXPECTATIONS OF FAIR TREATMENT
When it comes to respondents’ expectations of fair treatment when using government services, the trends are consistently more positive than anti-corruption trends.
Despite some fluctuations, half of the respondents in recent surveys consider the educational system to be fair (April 2015, 51.9 percent). Moreover, this perception has improved substantially over time. The healthcare system also showed some improvement over time, with well over a third of respondents expecting fair treatment (April 2015, 43.2 percent). After a steady rise from March 2010, similar approval levels were seen in these categories in March 2013. Approval levels subsequently fell, but they are now improving again (Figure 7.1).
Figure 7.1: Fair treatment in education and health
Respondents had a lower opinion of the judiciary and law enforcement, although here too there have been improvements over time. Barely a quarter of respondents in March 2010 considered these institutions to be fair, compared to roughly a third in more recent surveys (Figure 7.2). The highest fairness ratings for these institutions appeared in April 2015.
Figure 7.2: Fair treatment by the judiciary and law enforcement
SURVEY ON PERCEPTIONS AND KNOWLEDGE OF CORRUPTION
30
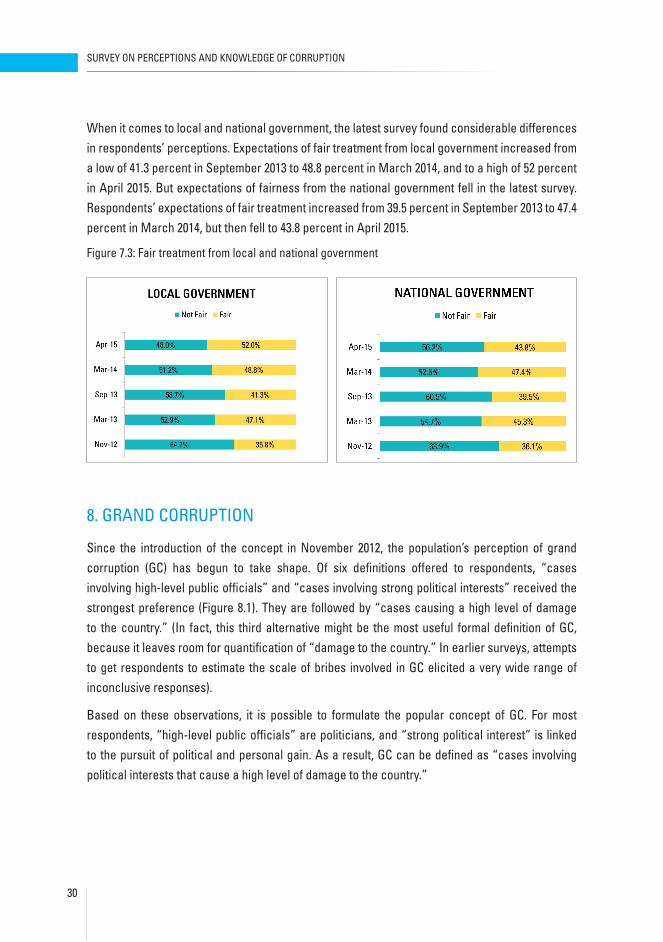
When it comes to local and national government, the latest survey found considerable differences in respondents’ perceptions. Expectations of fair treatment from local government increased from a low of 41.3 percent in September 2013 to 48.8 percent in March 2014, and to a high of 52 percent in April 2015. But expectations of fairness from the national government fell in the latest survey. Respondents’ expectations of fair treatment increased from 39.5 percent in September 2013 to 47.4 percent in March 2014, but then fell to 43.8 percent in April 2015.
Figure 7.3: Fair treatment from local and national government
8. GRAND CORRUPTION
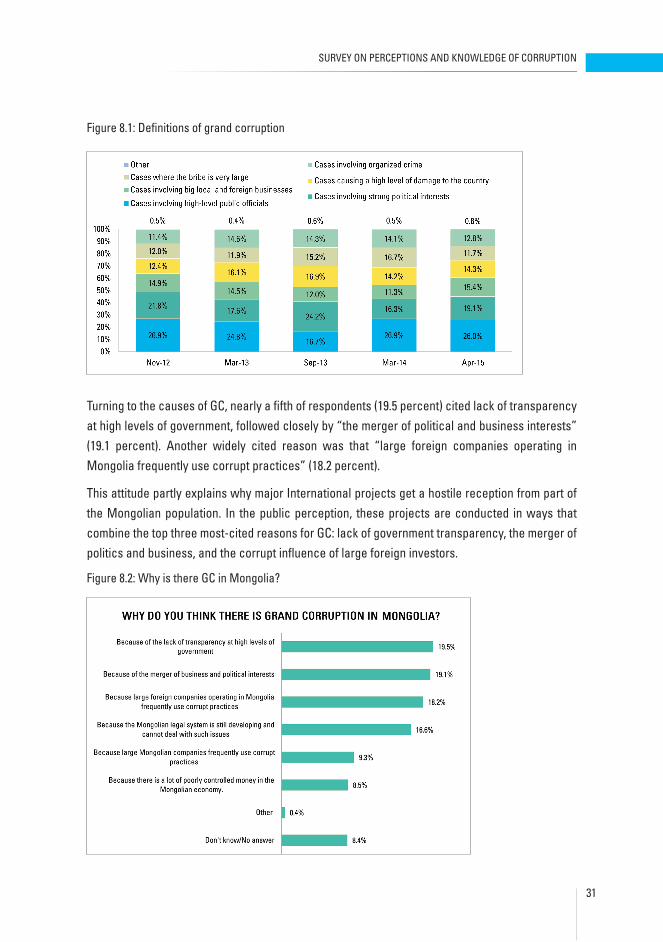
Since the introduction of the concept in November 2012, the population’s perception of grand corruption (GC) has begun to take shape. Of six definitions offered to respondents, “cases involving high-level public officials” and “cases involving strong political interests” received the strongest preference (Figure 8.1). They are followed by “cases causing a high level of damage to the country.” (In fact, this third alternative might be the most useful formal definition of GC, because it leaves room for quantification of “damage to the country.” In earlier surveys, attempts to get respondents to estimate the scale of bribes involved in GC elicited a very wide range of inconclusive responses).
Based on these observations, it is possible to formulate the popular concept of GC. For most respondents, “high-level public officials” are politicians, and “strong political interest” is linked to the pursuit of political and personal gain. As a result, GC can be defined as “cases involving political interests that cause a high level of damage to the country.”
SURVEY ON PERCEPTIONS AND KNOWLEDGE OF CORRUPTION
31
Figure 8.1: Definitions of grand corruption
Turning to the causes of GC, nearly a fifth of respondents (19.5 percent) cited lack of transparency at high levels of government, followed closely by “the merger of political and business interests” (19.1 percent). Another widely cited reason was that “large foreign companies operating in Mongolia frequently use corrupt practices” (18.2 percent).
This attitude partly explains why major International projects get a hostile reception from part of the Mongolian population. In the public perception, these projects are conducted in ways that combine the top three most-cited reasons for GC: lack of government transparency, the merger of politics and business, and the corrupt influence of large foreign investors.
Figure 8.2: Why is there GC in Mongolia?
SURVEY ON PERCEPTIONS AND KNOWLEDGE OF CORRUPTION
32
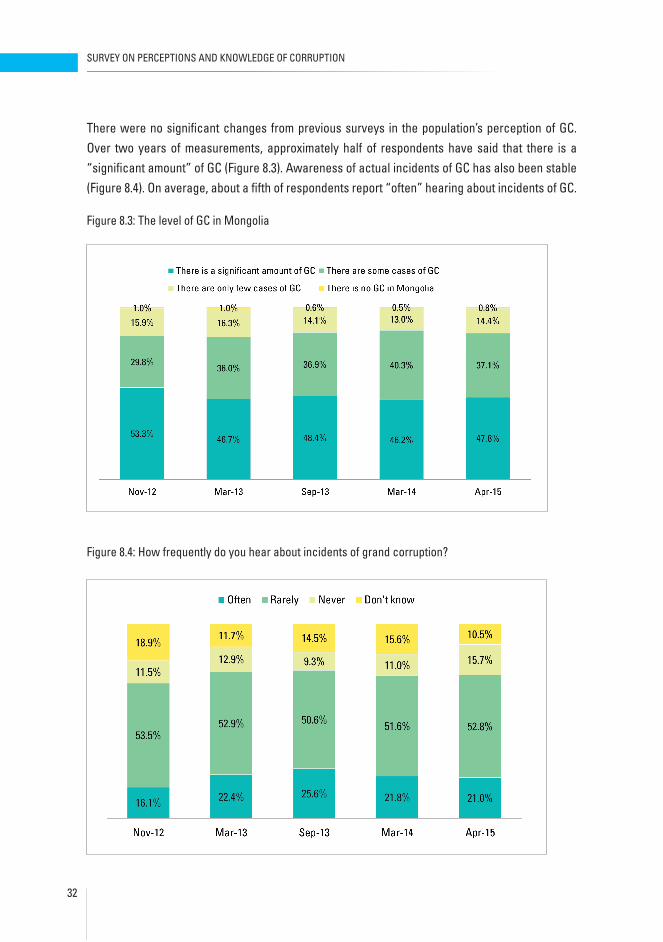
There were no significant changes from previous surveys in the population’s perception of GC. Over two years of measurements, approximately half of respondents have said that there is a “significant amount” of GC (Figure 8.3). Awareness of actual incidents of GC has also been stable (Figure 8.4). On average, about a fifth of respondents report “often” hearing about incidents of GC.
Figure 8.3: The level of GC in Mongolia
Figure 8.4: How frequently do you hear about incidents of grand corruption?
SURVEY ON PERCEPTIONS AND KNOWLEDGE OF CORRUPTION
33
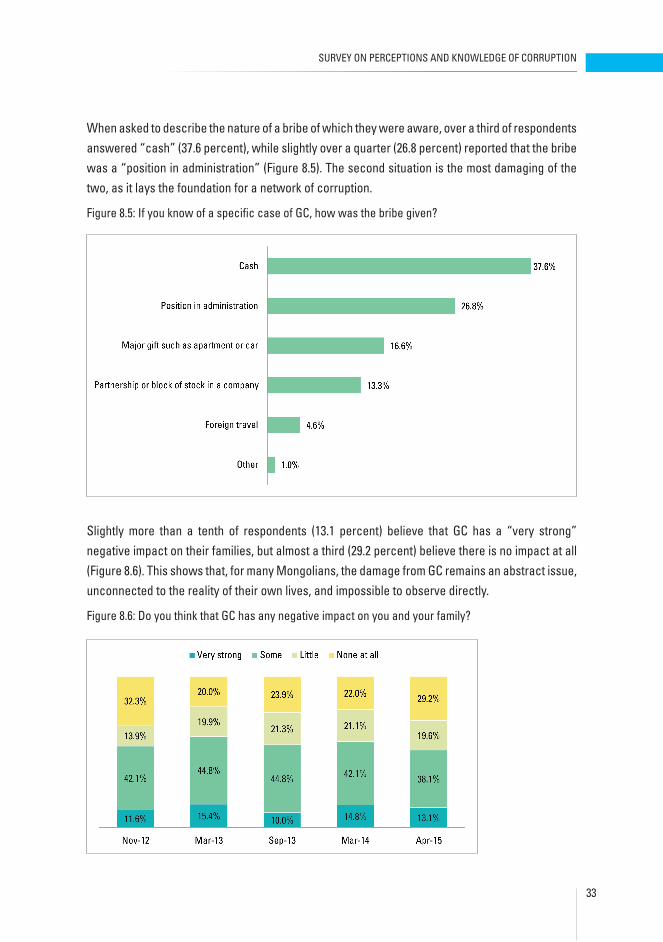
When asked to describe the nature of a bribe of which they were aware, over a third of respondents answered “cash” (37.6 percent), while slightly over a quarter (26.8 percent) reported that the bribe was a “position in administration” (Figure 8.5). The second situation is the most damaging of the two, as it lays the foundation for a network of corruption.
Figure 8.5: If you know of a specific case of GC, how was the bribe given?
Slightly more than a tenth of respondents (13.1 percent) believe that GC has a “very strong” negative impact on their families, but almost a third (29.2 percent) believe there is no impact at all (Figure 8.6). This shows that, for many Mongolians, the damage from GC remains an abstract issue, unconnected to the reality of their own lives, and impossible to observe directly.
Figure 8.6: Do you think that GC has any negative impact on you and your family?

SURVEY ON PERCEPTIONS AND KNOWLEDGE OF CORRUPTION
34
Another sign that GC is “abstract” for much of the population can be seen in the preferences for leadership to fight GC. The no-response or no-opinion rate was much higher for grand corruption than it was for general corruption (43.2 percent for grand corruption and 0.7 percent for general corruption respectively). Thus, although respondents preferred the leadership of the IAAC in both cases, the totals are 37.8 percent for general corruption, but just 17.7 percent for grand corruption (Figure 8.7 and Figure 5.3). This shows that the population as a whole has less clarity of opinion about which institution is most suitable to deal with grand corruption.
Figure 8.7: In your opinion, who should organize and lead the effort to combat grand corruption? (Choose one)
Among ways to combat GC, most respondents preferred legislative tuning, increasing the authority of law enforcement organizations, and a stronger role for civil society. Notably, the fewest respondents believed in the effectiveness of independent media outlets or political parties with a strong anticorruption agenda.

SURVEY ON PERCEPTIONS AND KNOWLEDGE OF CORRUPTION
35
Figure 8.8: In your opinion, what is the most effective way to combat GC?
9. PETTY CORRUPTION
Overall, the public’s attitudes toward petty corruption remained roughly the same from March 2014 to April 2015 (Figure 9.1). Over a third of respondents said they would not pay a bribe if asked. The number who would report the incident increased slightly, from 12.9 percent in March 2014 to 15.3 percent in April 2015. The other categories remained more or less unchanged.
Figure 9.1: If you face a situation in which you are directly asked for a bribe by a public or private official, what are you most likely to do? (Choose one)

SURVEY ON PERCEPTIONS AND KNOWLEDGE OF CORRUPTION
36
Due to changes in response options6, we cannot directly compare where respondents said they would report corruption. Nevertheless, in the surveys prior to April 2015, about half of all respondents said they would report to the IAAC (Figure 9.2a). Slightly over a fifth of respondents in April 2015 (22 percent) said they would report corruption to management, while 14 percent said they would report corruption to the newly introduced Government Hotline 11-11 (Figure 9.2b).
Figure 9.2: Where would you report corruption, if anywhere?
a) Before April 2015
b) April 2015
6 In April 2015, the new category “Government 11-11 hotline” was added to response options (Figure 9.2b).
SURVEY ON PERCEPTIONS AND KNOWLEDGE OF CORRUPTION
37
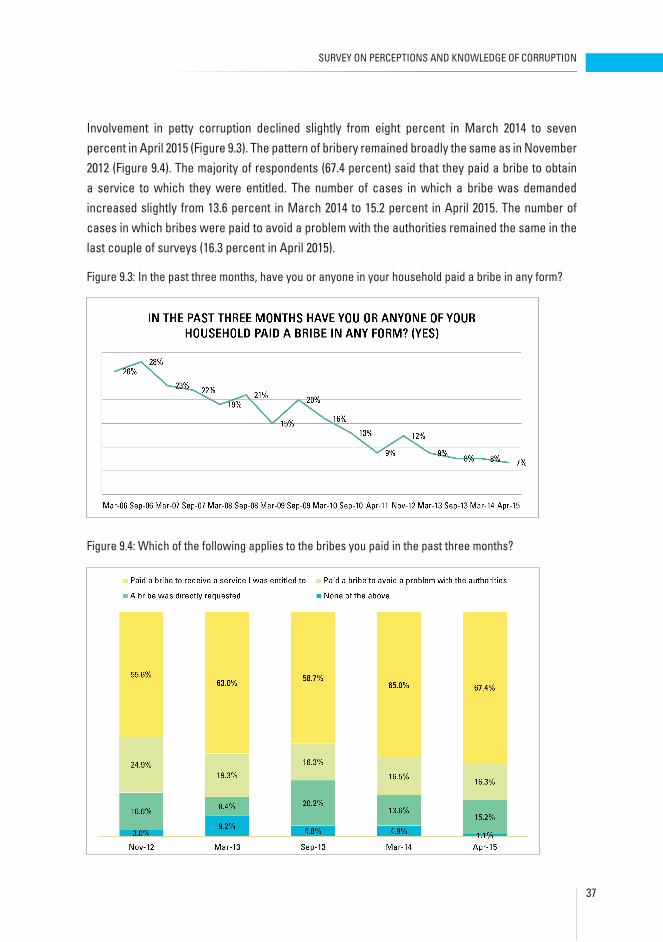
Involvement in petty corruption declined slightly from eight percent in March 2014 to seven percent in April 2015 (Figure 9.3). The pattern of bribery remained broadly the same as in November 2012 (Figure 9.4). The majority of respondents (67.4 percent) said that they paid a bribe to obtain a service to which they were entitled. The number of cases in which a bribe was demanded increased slightly from 13.6 percent in March 2014 to 15.2 percent in April 2015. The number of cases in which bribes were paid to avoid a problem with the authorities remained the same in the last couple of surveys (16.3 percent in April 2015).
Figure 9.3: In the past three months, have you or anyone in your household paid a bribe in any form?
Figure 9.4: Which of the following applies to the bribes you paid in the past three months?
SURVEY ON PERCEPTIONS AND KNOWLEDGE OF CORRUPTION
38
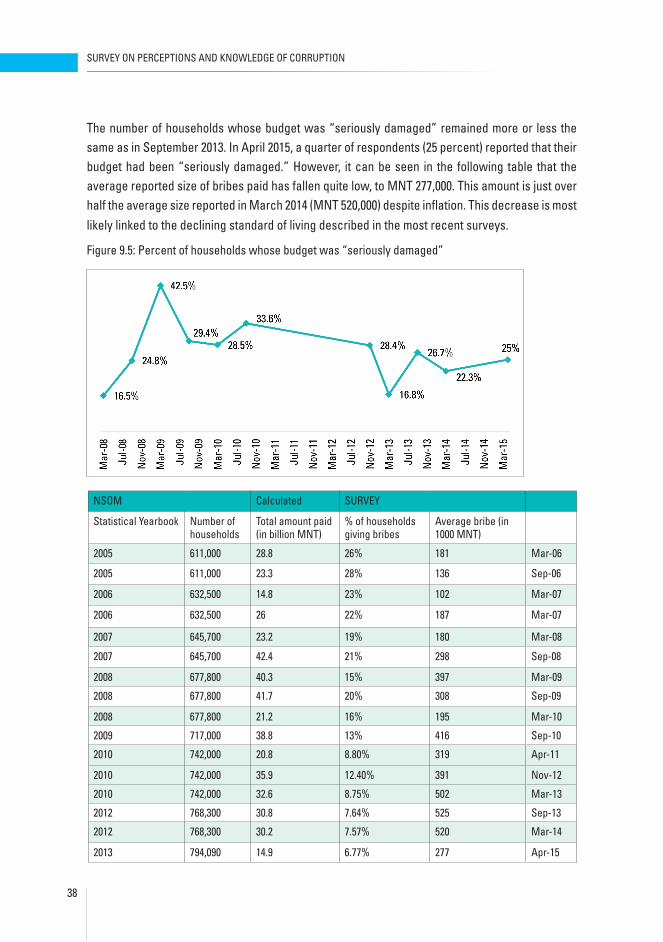
The number of households whose budget was “seriously damaged” remained more or less the same as in September 2013. In April 2015, a quarter of respondents (25 percent) reported that their budget had been “seriously damaged.” However, it can be seen in the following table that the average reported size of bribes paid has fallen quite low, to MNT 277,000. This amount is just over half the average size reported in March 2014 (MNT 520,000) despite inflation. This decrease is most likely linked to the declining standard of living described in the most recent surveys.
Figure 9.5: Percent of households whose budget was “seriously damaged”
Mar-06
Sep-06
Mar-07
Mar-07
Mar-08
Sep-08
Mar-09
Sep-09
Mar-10
Sep-10
Apr-11
Nov-12
Mar-13
Sep-13
Mar-14
Apr-15
SURVEY
Average bribe (in 1000 MNT)
181
136
102
187
180
298
397
308
195
416
319
391
502
525
520
277
% of households giving bribes
26%
28%
23%
22%
19%
21%
15%
20%
16%
13%
8.80%
12.40%
8.75%
7.64%
7.57%
6.77%
Calculated
Total amount paid (in billion MNT)
28.8
23.3
14.8
26
23.2
42.4
40.3
41.7
21.2
38.8
20.8
35.9
32.6
30.8
30.2
14.9
NSOM
Number of households
611,000
611,000
632,500
632,500
645,700
645,700
677,800
677,800
677,800
717,000
742,000
742,000
742,000
768,300
768,300
794,090
Statistical Yearbook
2005
2005
2006
2006
2007
2007
2008
2008
2008
2009
2010
2010
2010
2012
2012
2013
SURVEY ON PERCEPTIONS AND KNOWLEDGE OF CORRUPTION
39
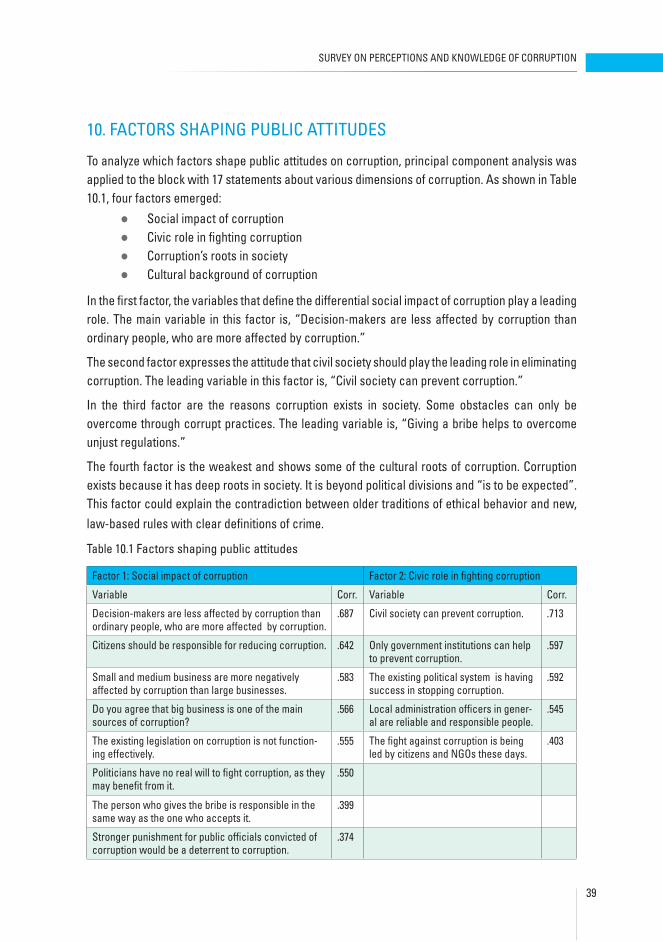
10. FACTORS SHAPING PUBLIC ATTITUDES
To analyze which factors shape public attitudes on corruption, principal component analysis was applied to the block with 17 statements about various dimensions of corruption. As shown in Table 10.1, four factors emerged:
l Social impact of corruptionl Civic role in fighting corruptionl Corruption’s roots in societyl Cultural background of corruption
In the first factor, the variables that define the differential social impact of corruption play a leading role. The main variable in this factor is, “Decision-makers are less affected by corruption than ordinary people, who are more affected by corruption.”
The second factor expresses the attitude that civil society should play the leading role in eliminating corruption. The leading variable in this factor is, “Civil society can prevent corruption.”
In the third factor are the reasons corruption exists in society. Some obstacles can only be overcome through corrupt practices. The leading variable is, “Giving a bribe helps to overcome unjust regulations.”
The fourth factor is the weakest and shows some of the cultural roots of corruption. Corruption exists because it has deep roots in society. It is beyond political divisions and “is to be expected”. This factor could explain the contradiction between older traditions of ethical behavior and new, law-based rules with clear definitions of crime.
Table 10.1 Factors shaping public attitudes
Factor 1: Social impact of corruption Factor 2: Civic role in fighting corruption
Variable Corr. Variable Corr.
Decision-makers are less affected by corruption than ordinary people, who are more affected by corruption.
.687 Civil society can prevent corruption. .713
Citizens should be responsible for reducing corruption. .642 Only government institutions can help to prevent corruption.
.597
Small and medium business are more negatively affected by corruption than large businesses.
.583 The existing political system is having success in stopping corruption.
.592
Do you agree that big business is one of the main sources of corruption?
.566 Local administration officers in gener-al are reliable and responsible people.
.545
The existing legislation on corruption is not function-ing effectively.
.555 The fight against corruption is being led by citizens and NGOs these days.
.403
Politicians have no real will to fight corruption, as they may benefit from it.
.550
The person who gives the bribe is responsible in the same way as the one who accepts it.
.399
Stronger punishment for public officials convicted of corruption would be a deterrent to corruption.
.374
SURVEY ON PERCEPTIONS AND KNOWLEDGE OF CORRUPTION
40
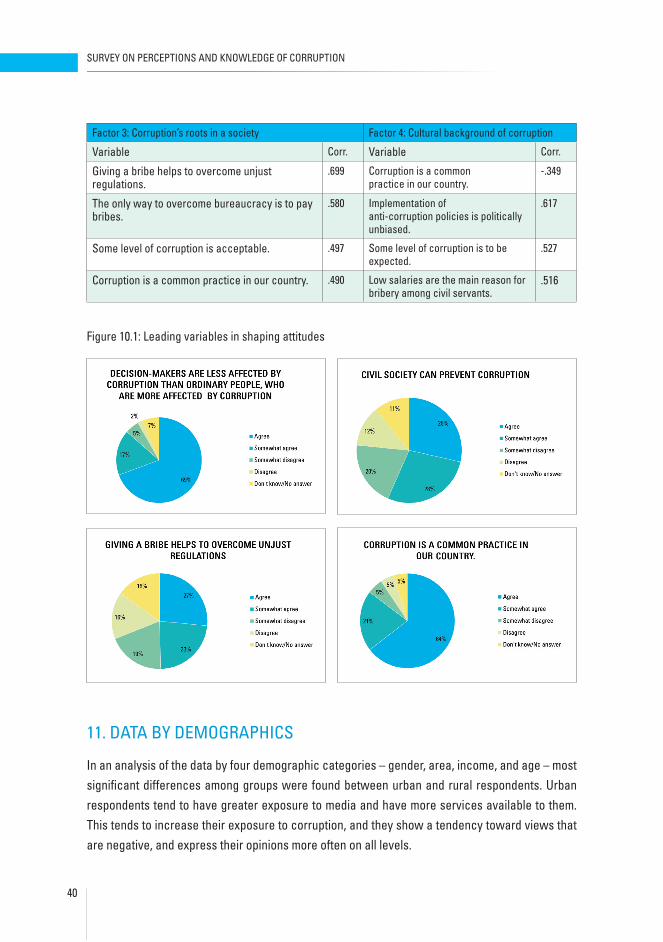
Factor 3: Corruption’s roots in a society Factor 4: Cultural background of corruption
Variable Corr. Variable Corr.
Giving a bribe helps to overcome unjust regulations.
.699 Corruption is a commonpractice in our country.
-.349
The only way to overcome bureaucracy is to pay bribes.
.580 Implementation of anti-corruption policies is politically unbiased.
.617
Some level of corruption is acceptable. .497 Some level of corruption is to be expected.
.527
Corruption is a common practice in our country. .490 Low salaries are the main reason for bribery among civil servants.
.516
Figure 10.1: Leading variables in shaping attitudes
11. DATA BY DEMOGRAPHICS
In an analysis of the data by four demographic categories – gender, area, income, and age – most significant differences among groups were found between urban and rural respondents. Urban respondents tend to have greater exposure to media and have more services available to them. This tends to increase their exposure to corruption, and they show a tendency toward views that are negative, and express their opinions more often on all levels.

SURVEY ON PERCEPTIONS AND KNOWLEDGE OF CORRUPTION
41
Figure 11.1: If you face a situation in which you are directly asked for a bribe by a public or private official, what are you most likely to do? (Choose one)
At first glance, although some gender differences can be found in separate variables, this is mostly the effect of women expressing no opinion or being undecided. Once such cases are excluded, the differences between men and women fall below the margin of error and are no longer significant. We may also note that men exhibit a preference for extreme response options such as “totally,” “very,” and “a lot.” In contrast, women prefer milder responses such as “rather,” “some,” and “a little.” Concerning the main aspect of what respondents will do if directly asked for a bribe, however, gender differences are minimal.
Figure 11.2: If you face a situation in which you are directly asked for a bribe by a public or private official, what are you most likely to do? (Choose one)
SURVEY ON PERCEPTIONS AND KNOWLEDGE OF CORRUPTION
42
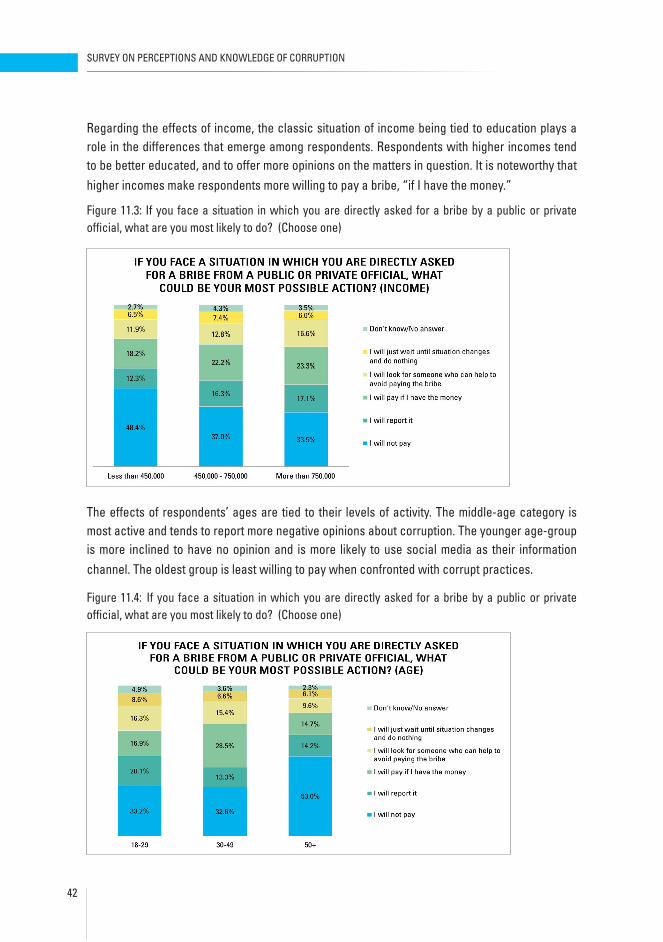
Regarding the effects of income, the classic situation of income being tied to education plays a role in the differences that emerge among respondents. Respondents with higher incomes tend to be better educated, and to offer more opinions on the matters in question. It is noteworthy that higher incomes make respondents more willing to pay a bribe, “if I have the money.”
Figure 11.3: If you face a situation in which you are directly asked for a bribe by a public or private official, what are you most likely to do? (Choose one)
The effects of respondents’ ages are tied to their levels of activity. The middle-age category is most active and tends to report more negative opinions about corruption. The younger age-group is more inclined to have no opinion and is more likely to use social media as their information channel. The oldest group is least willing to pay when confronted with corrupt practices.
Figure 11.4: If you face a situation in which you are directly asked for a bribe by a public or private official, what are you most likely to do? (Choose one)

SURVEY ON PERCEPTIONS AND KNOWLEDGE OF CORRUPTION
43
IV. SURVEY ON CORRUPTION PERCEPTION AND KNOWLEDGE
SURVEY INSTRUMENT
The goal of this survey, the Survey on Perception and Knowledge of Corruption, is to study the perceived levels of corruption in Mongolia. We will ask more than 1300 citizens nationwide to respond to this survey. We would like to learn what your opinions are about different types of corruption and what situation you may face in your everyday life related to corruption.
Please be assured that your individual answers and comments will be kept in strictest confidence – nothing that you say will be identified to you in any way.
Thanks for your time to work to respond to our survey. If you have any question related to the survey, please contact us by the phone number 70116373. The results of this survey are going to be widely presented to the public.
Part A. General
1. In your opinion what is the most important social, economic, or political problem in the country today?
2. Some people believe that corruption affects different spheres of life in Mongolia. In your view, does corruption affect … not at all, to a small extent, to a moderate extent or to a large extent?
Spheres not at all to a small extent
to a moderate extent
to a large extent
Don’t know/No answer
2.1 Your personal and family life
1 2 3 4 9
2.2 Business environment 1 2 3 4 9
2.3 Political life 1 2 3 4 9
3. In 2016-2017 Mongolia is facing Parliamentary and Presidential Elections. In your opinion, how much transparency and fairness there is in a following stages of Election process?

SURVEY ON PERCEPTIONS AND KNOWLEDGE OF CORRUPTION
44
Spheres Not at all
to a small extent
to a moderate extent
to a large extent
Don’t know/No answer
3.1. Preparatory stage: registering voters, hiring staff, appointing local and foreign observers
1 2 3 4 9
3.2. Campaign finance 1 2 3 4 9
3.3 Election campaigns 1 2 3 4 9
3.4. Vote counting at polling stations 1 2 3 4 9
3.5. Aggregation and reporting of results by GEC 1 2 3 4 9
4. Could you express your opinion on the following statements?
Agree Some-what agree
Some-what dis-agree
Dis-agree
Don’t Know/No Answer
4.1 Corruption is a common practice in our country.
1 2 3 4 9
The existing political system1 is having success in stopping corruption
1 2 3 4 9
a Civil society can prevent corruption 1 2 3 4 9
4.3b Only government institutions may help to prevent corruption.
1 2 3 4 9
Fighting corruption is being led by citizens and NGOs these days
1 2 3 4 9
Politicians have no real will to fight corruption as they may benefit from it
1 2 3 4 9
4.6. Do you agree that the only way to overcome bureaucracy is to pay bribes
1 2 3 4 9
Small and medium business are the more negatively affected by corruption than large businesses
1 2 3 4 9
Some level of corruption is acceptable 1 2 3 4 9
Do you agree that large business is one of the main sources of corruption
1 2 3 4 9
Giving a bribe helps to overcome unjust regula-tions
1 2 3 4 9
Local administration officers in general are reli-able and responsible people
1 2 3 4 9
Citizens should be responsible to reduce corrup-tion
1 2 3 4 9
The existing legislation on corruption is not func-tioning effectively.
1 2 3 4 9

SURVEY ON PERCEPTIONS AND KNOWLEDGE OF CORRUPTION
45
Decision-makers are less affected by corruption than ordinary people, who are more affected by corruption.
1 2 3 4 9
Low salary is the main reason for bribes among public civil servants
1 2 3 4 9
A deterrent to corruption will be stronger punish-ment for public officials convicted of corruption.
1 2 3 4 9
Some level of corruption is expected 1 2 3 4 9
The person who gives the bribe is in the same way responsible as the one who accepts it
1 2 3 4 9
Implementation of anti-corruption policies are politically unbiased.
1 2 3 4 9
5. In the past three years, how has the lev-el of corruption in Mongolia changed?
Increased a lot 1.
Increased a little 2.
Remained the same 3.
Decreased a little 4.
Decreased a lot 5.
Don’t know/No answer 9.
6. How do you expect the level of corrup-tion in the next three years to change? Will it?
Increase a lot 1.
Increase a little 2.
Remain the same 3.
Decrease a little 4.
Decrease a lot 5.
Don’t know/No answer 9.
Part B. Combating Corruption
7. In your opinion, who should organize and lead the effort to combat corruption (1 choice)
National government 1.
Local government 2.
Law enforcement 3.
Civil society 4.
Parliament 5.
Courts 6.
NGOs 7.
President 8.
IAAC 9.
Ministry of Justice 10.
The private sector 11.
Other (specify) 12.

SURVEY ON PERCEPTIONS AND KNOWLEDGE OF CORRUPTION
46
8. How do you think the current government will perform compared to its predeces-sor in fighting corruption:
Will deal better with corruption 1.
Will stay the same 2.
Will do worse 3.
Don’t know/No answer 9.
9. In your opinion, how much is the impact, of the following factors, hindering efforts to combat corruption?
Not at all
A little Moderately A lot Don’t know/No answer
9.1 Low professionalism in the delivery of state services
1 2 3 4 9
Lack of will to control corruption from national political leadership
1 2 3 4 9
Lack of will to control corruption from local political leadership
1 2 3 4 9
The habit of solving problems through corrupt practices
1 2 3 4 9
Corruption in law enforcement bodies 1 2 3 4 9
Public passivity 1 2 3 4 9
Imperfect legislation or sanctions/penalties against corruption
1 2 3 4 9
10. What should be done to prevent corruption? (1 choice)
Strong enforcement measures and punishment 1.
Increasing public employees’ salaries 2.
Transparency in administrative decision-making 3.
Strengthening state control over public administration 4.
Strengthening civil (non-government) control over public administration
5.
Building public awareness 6.
Consistent implementation of the rule of law. 7.
Other (specify) 8.
11. Since the introduction of the new law on corruption in 2006 are you aware of any officials being prosecuted by the justice system on a corruption charge?
Yes 1.
No 2.
12. Are you aware of a telephone hotline to report corruption at IAAC? Yes 1.
No 2.
13. Would you report a corruption case if the IAAC would accept anonymous information?
Yes 1.
No 2.
Don’t know/No answer 9.
SURVEY ON PERCEPTIONS AND KNOWLEDGE OF CORRUPTION
47
Block C. Institutions
14. How do you evaluate the IAAC’s performance in fighting corruption?
Very good 1.
Good 2.
Nor good, nor bad 3.
Bad 4.
Very bad 5.
Don’t know/No answer 9.
15. How much confidence do you have in the IAAC in fighting corruption?
Confident 1.
Rather confident 2.
Rather not confident 3.
Not confident 4.
Don’t know/No answer 9.
16. Are you confident that IAAC is an impartial law enforce-ment body?
Yes
No
Don’t know/No answer
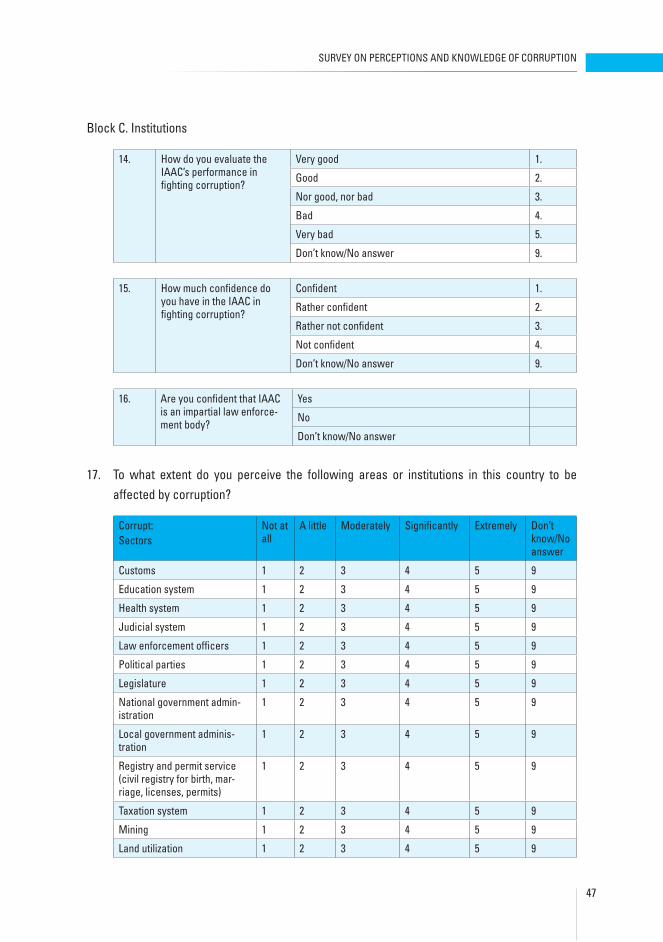
17. To what extent do you perceive the following areas or institutions in this country to be affected by corruption?
Corrupt:Sectors
Not at all
A little Moderately Significantly Extremely Don’t know/No answer
Customs 1 2 3 4 5 9
Education system 1 2 3 4 5 9
Health system 1 2 3 4 5 9
Judicial system 1 2 3 4 5 9
Law enforcement officers 1 2 3 4 5 9
Political parties 1 2 3 4 5 9
Legislature 1 2 3 4 5 9
National government admin-istration
1 2 3 4 5 9
Local government adminis-tration
1 2 3 4 5 9
Registry and permit service (civil registry for birth, mar-riage, licenses, permits)
1 2 3 4 5 9
Taxation system 1 2 3 4 5 9
Mining 1 2 3 4 5 9
Land utilization 1 2 3 4 5 9

SURVEY ON PERCEPTIONS AND KNOWLEDGE OF CORRUPTION
48
Professional Inspection Agency
1 2 3 4 5 9
Procurement tenders 1 2 3 4 5 9
Banks & financial institutions 1 2 3 4 5 9
18. Could you name another area or institution strong-ly affected by corruption:
Block E. Personal experience
19. If you face a sit-uation in which you are directly asked for a bribe from a public or private official, what could be most your possi-ble action?
I will not pay 1.
I will report it answer Q20 2.
I will pay if I have the money 3.
I will look for someone who can help to avoid paying the bribe 4.
I will just wait until situation changes and do nothing 5.
Don’t know/No answer 9.
20. If you report then where?
(only one choice)
Management2 1.
IAAC 2.
Police 3.
Media 4.
Government Hotline 11-11 5.
Other 6.
21. What is your main source of infor-mation about corruption?
(only one choice)
TV (answer Q22) 1.
Newspapers magazines 2.
Internet or Social Media (answer Q23) 3.
Radio 4.
Personal Experience 5.
Friends/ relatives 6.
Word of mouth 7.
Other sources (specify) 8.
22. If TV is the main source which channel is most informative in exposing corruption?
23. If Internet or Social Media is the main source which site is most informative in exposing corruption?
Facebook 1.
Information/news sites 2.
Twitter 3.
Other sources (specify): 4.
SURVEY ON PERCEPTIONS AND KNOWLEDGE OF CORRUPTION
49
LET’S CONSIDER FOLLOWING MATTERS.
24. To what degree of fair treatment are you expecting to receive when contacting following institutions?
Spheres Not fair Rather not fair Rather fair Fair Don’t know/No answer
Education system 1 2 3 4 9
Health system 1 2 3 4 9
Judicial system 1 2 3 4 9
Law enforcement 1 2 3 4 9
Local government administration 1 2 3 4 9
National state administration 1 2 3 4 9
25. Are you aware of the conflict of interest law passed?
Yes 1.
No 2.
26. If you discover a case of conflict of interest would you report it?
Yes 1.
No 2.
27. If you were aware of a situation of conflict of interest where would you report it?
(only one choice)
Management3 1.
IAAC 2.
Police 3.
Media 4.
Government Hotline 11-11 5.
Other 6.
28. In your opinion, how often are public officials acting in violation of conflict of interest?
Always 1.
Sometimes 2.
Rarely 3.
Never 4.
Don’t know/No answer 9.
29. Did your family give some money or gifts as bribery in the last 3 months?
Yes 1.
No go to block F 2.
Don’t know go to block F 3.
Refused go to Block F 4.

SURVEY ON PERCEPTIONS AND KNOWLEDGE OF CORRUPTION
50
30. To whom have you paid bribes in the past 3 months? (multiple)
31. If paid how much did it cost approximately? (multiple)
1. Teacher
2. Health Sector Employee
3. Clerk in national state administration
4. Policeman
5. Judge
6. Advocate/Lawyer
7. Prosecutor
8. Tax officer
9. Utilities service personal
10. Custom’s officer
11. Local government official
12. Media (newspapers, TV, Radio)
13. Other
32. How much does the total amount of bribes paid affect your family budget?
Not at all 1.
A little 2.
Somewhat 3.
Seriously 4.
Don’t know/No answer 9.
33. Which of the following mostly applies to the bribes paid in the past three months?
A bribe was directly requested 1.
Paid a bribe to avoid a problem with the authorities 2.
Paid a bribe to receive a service I was entitled to 3.
None of above 4.

SURVEY ON PERCEPTIONS AND KNOWLEDGE OF CORRUPTION
51
Block F: Government Transparency 34. In your opinion how IMPORTANT are following initiatives and actions on increasing transparency and efficiency of the state administration?
Not at all
A little Moderately Significantly Extremely Don’t know/No answer
Introduction of a transparent accounting law
1 2 3 4 5 9
Introduction of new technol-ogy (electronic registries, one-window service, etc.)
1 2 3 4 5 9
Regular income disclosure by state employees
1 2 3 4 5 9
Election law initiatives 1 2 3 4 5 9
Elbegdorj’s initiatives on civic participation and direct democracy
1 2 3 4 5 9
35. In your opinion how EFFECTIVE are following initiatives and actions on increasing transparency and efficiency of the state administration?
Not at all
A little Moderately Significantly Extremely Don’t know/No answer
Introduction of a transparent accounting law
1 2 3 4 5 9
Introduction of new technol-ogy (electronic registries, one-window service, etc.)
1 2 3 4 5 9
Regular income disclosure by state employees
1 2 3 4 5 9
Election law initiatives 1 2 3 4 5 9
Elbegdorj’s initiatives on civic participation and direct democracy
1 2 3 4 5 9
Block G: Grand Corruption
38. What is your under-standing of grand corruption?
Cases involving strong political interests 1.
Cases involving high-level public officials 2.
Cases involving big local and foreign businesses 3.
Cases causing a high level of damage to the country 4.
Cases involving organized crime 5.
Cases where the bribe is very large 6.
Other (specify): 7.
Don’t Know/Refused 9.
SURVEY ON PERCEPTIONS AND KNOWLEDGE OF CORRUPTION
52
39. What do you think about the level of grand corruption in Mongolia?
There is a significant amount of GC 1.
There are some cases of GC 2.
There are only few cases of GC 3.
There is no GC in Mongolia 4.
Don’t know/No answer 9.
40. Why do you think there is grand corruption in Mon-golia?
Because the Mongolian legal system is still developing and cannot deal with such issues
1.
Because there is a lot of poorly controlled money in the Mongo-lian economy
2.
Because of the lack of transparency at high levels of govern-ment
3.
Because large foreign companies operating in Mongolia fre-quently use corrupt practices
4.
Because large Mongolian companies frequently use corrupt practices
5.
Because of the merger of business and political interests 6.
Other (specify): 7.
Don’t Know/Refused 9.
41. Do you have any idea about the size of grand corruption bribes?
Yes 1.
No 2.
Don’t Know/Refused 9.
44. How frequently do you hear about grand corruption incidences?
Often 1.
Rarely 2.
Never go to Q46 3.
Don’t know/No answer go to Q46 9.
45. If you heard, which way the bribe was given? (multiple responses)
Cash 1.
Major gift such as apartment or car 2.
Partnership or block of stock in a company 3.
Foreign travel 4.
Position in administration 5.
Other(specify): 6.
Don’t know/No answer 7.

SURVEY ON PERCEPTIONS AND KNOWLEDGE OF CORRUPTION
53
46. Do you think that GC has any negative impact on you and your family?
Very strong 1.
Some 2.
Little 3.
None at all go to Demography 4.
Don’t know/No answer 9.
47. If there is a negative impact, can you be specific about what sort of impact it has on you and your family?
Decreasing standard of living 1.
Degrading family business 2.
Bureaucracy, non transparency 3.
Public services are down 4.
Increasing prices 5.
Impact on environment 6.
Other 7.
Don’t know/No answer 9.
48. In your opinion, who should orga-nize and lead the effort to combat Grand corruption (1 choice)
National government 1.
Local government 2.
Law enforcement 3.
Civil society 4.
Parliament 5.
Courts 6.
NGOs 7.
President 8.
IAAC 9.
Ministry of Justice 10.
The private sector 11.
Other (specify) 12.
49 In your opinion, what is the most effective way to combat GC? (please mark 2 most important)
Increase the authority of law enforcement organizations
1
Increase accountability for false income statements
2
Increase the role and capacity of civil society organizations
3
Tune anti-corruption legislation 4
Strengthen the role of ethics in settling cor-ruption disputes
5
Support independent media outlets 6
Support political parties with a strong anticor-ruption agenda
7

SURVEY ON PERCEPTIONS AND KNOWLEDGE OF CORRUPTION
54
Block H: Demography
1. Year of birth: 19………2.Gender: male / female 3. Education: Did not go to school ............... 1 Primary/not completed secondary................................ 2 Secondary............................... 3 Vocational............................... 4 High.......................................... 5
4. Employment Full time job.......................... 1 Part time job......................... 2 Professional training.......... 3 Unemployed......................... 4 Home-based Caretaker ..... 5 Retired/on allowance........ 6 Army...................................... 7 Student................................ 8
c if selected retired, army or student than go to 7
5. Social statute- worker............................. 1- office worker................. 2- self-employed................ 3- herder/farmer................ 4- intelligentsia.................. 5
6. SectorPublic/ state officer......... 1Public/ state service...... 2Private/mixed sector...... 3NGO.................................. 4
7. Marital status:
Married..................................... 1 Living with partner, but not married..................................... 2 Single........................................ 3 Separated or divorced........... 4 Widowed.................................. 5
8. Number of people in house hold:
9. Number of household employed:
10. Estimated Income of Household:
Monthly: Annual:
11. City/Aimag: District/Soum: Khoroo/Bag:
12. Phone number4:
13. Interviewer
1 triangular semi-presidential system: President- Parliament- Government
2 Refers to the management of the place where the corruption occurred, e.g., the department store, the management of the department store would be approached.
3 Refers to the management of the place where the corruption occurred, e.g., the department store, the management of the department store would be approached.
4 Only if respondents agrees to provide the phone number, we need it for control


SURVEY ON PERCEPTIONS AND KNOWLEDGE OF CORRUPTION
56