survey of external data possibilities for commercial insurance
TRANSCRIPT

Survey of External Data Possibilities for Commercial Insurance
2013 CAS Ratemaking and Product Management Seminar
Robert J. Walling, III
March 12, 2013 5:15pm PT

About the Presenter – Rob Walling
B.S. Secondary Math Education – Miami University 1987 Fellow of Casualty Actuarial Society (FCAS)
Committee Chair of Ratemaking, ERM and New Fellows
Principal, Pinnacle Actuarial Resources, Inc. Areas of Focus – Captives &Alternative Markets, Regulatory, Commercial Lines Ratemaking and g y gLoss Reserving, Expert Witness, Legislative Cost
Wife, Anne, and three kids, , Graduate of Miami University Lifelong Cincinnati Reds fan
2
Lifelong Cincinnati Reds fan

Topics for Discussion
Internal Data Competitive Benchmarking Alternatives to Credit/Business Characteristics Property Commercial Auto Professional Liability
3

Internal DataInternal Data

Internal Data
Rating Underwriting
Multiline information (auto, WC, umbrella, broadening
Cancellation Reinstatement
d
endorsements, etc.) Affiliations/Associations
Endorsements
Agency Marketing
Claims Application Information
Billi Pl Marketing Loss Prevention
Billing Plan Payment history
5
Loss Control/Loss Prevention Opportunities
Loss Control Surveys Social Media/Customer Satisfaction

Loss Control Survey as Scorecard Input
7

Improvement in Loss Control Survey Score Leads to Better than Expected Lossesp
25,000,000 0.30
GLM Actual vs Expected ‐WC
10%
6%
20,000,000
0.10
0.20
4%
‐4%
0%
‐13% 10,000,000
15,000,000
‐0.10
0.00
Expo
sures
Log o
f Multip
lier
‐17% ‐15%
5,000,000
‐0.30
‐0.20
‐‐0.40
mChange_in_RCA_2
Exposures Relativity Approx 95% Confidence Interval
Type 3: = 0.42%

Improvement in Loss Control Survey Score Leads to Superior Large Loss Experiencep g p
27%20 000 000
25,000,000
0.30
0.40
11% 11% 15,000,000
20,000,000
0.10
0.20
eslier
‐1%0%
10,000,000 0.00 Ex
posure
Log o
f Multip
‐15%‐18%
5,000,000
‐0.20
‐0.10
‐26%
‐‐0.30
Ch i C 2mChange_in_RCA_2
Exposures Likelihood

Competitive BenchmarkingCompetitive Benchmarking

Commercial Auto Scorecard Example
11

Commercial Auto Example ‐ Hartford
NOTICETHELIFT!
12

Trucking Example – Great West
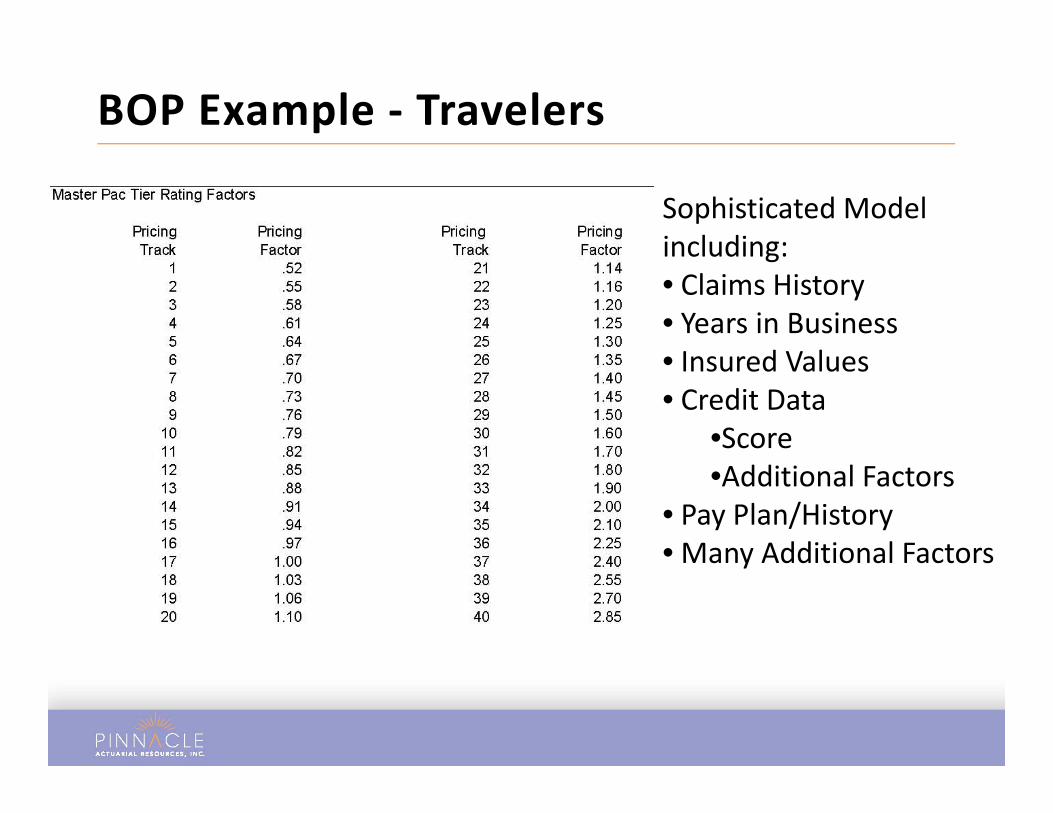
BOP Example ‐ Travelers
Sophisticated Model including:including:• Claims History• Years in BusinessI d V l• Insured Values
• Credit Data•Score•Additional Factors
• Pay Plan/History• Many Additional FactorsMany Additional Factors

BOP Scorecard ‐ Farmers

Underwriting Scorecard ‐ Farmers

Underwriting Scorecard ‐ Farmers
Alternatives to Credit/Business Characteristics

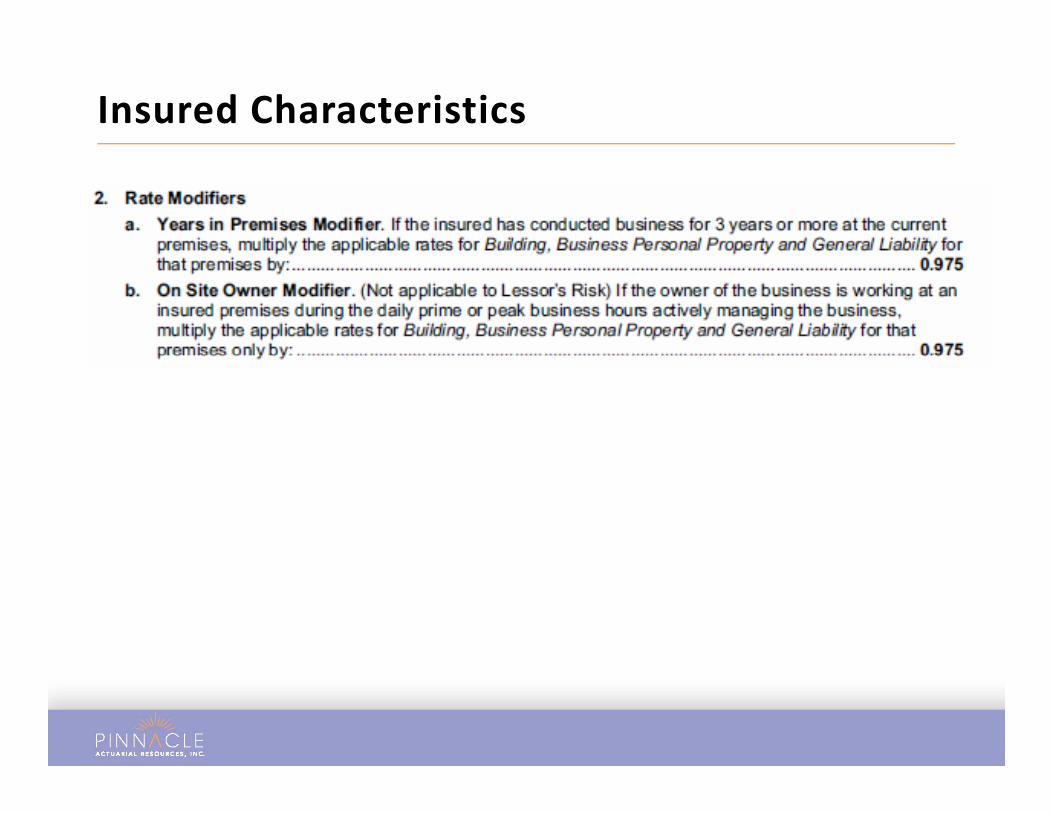
Insured Characteristics
Years in Business vs. Year on Risk (Tenure)l Prior Claims
Collateral Policies/Endorsements Years at Current Premises On‐Site Owner vs AbsenteeOn Site Owner vs. Absentee Payment History (NSF, Cancelation Notice, Reinstatement)Reinstatement) Type of Company (S‐Corp, C Corp, LLC, Sole
i )Proprietor, etc.)

BOP Insured Characteristics Example

Years in Business

Years in Business + Prior Claims
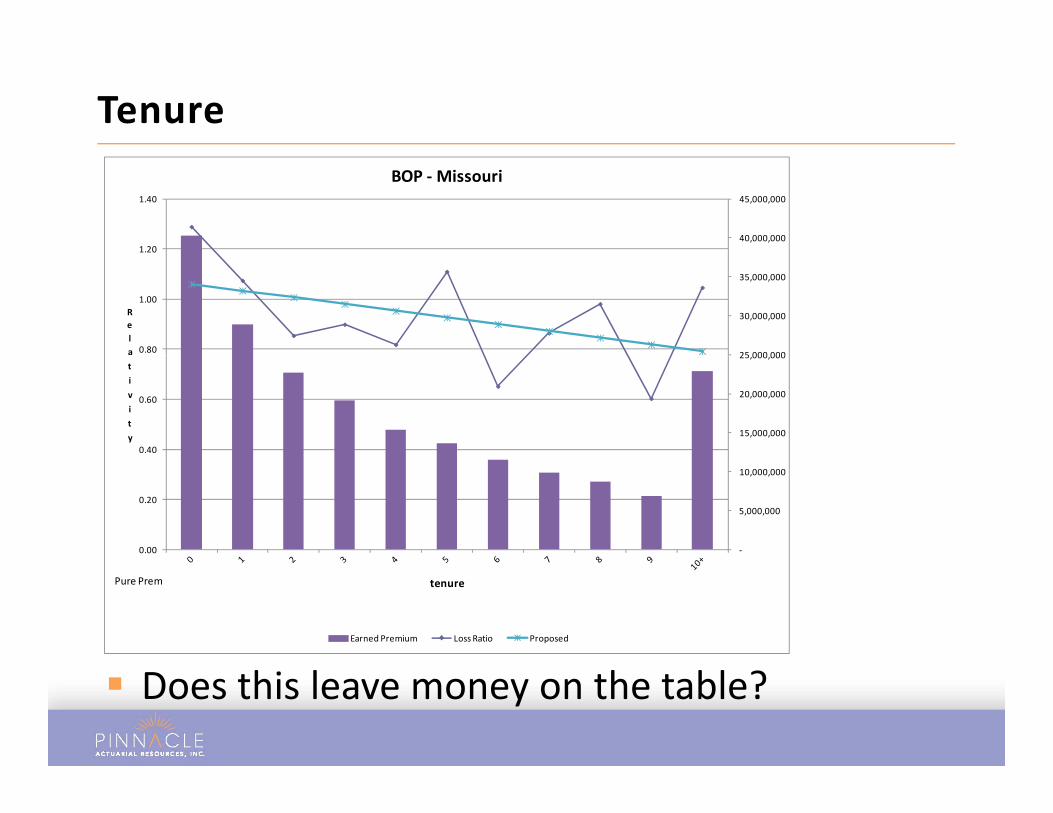
Tenure
40,000,000
45,000,000
1.20
1.40
BOP ‐Missouri
25 000 000
30,000,000
35,000,000
0.80
1.00Rela
15,000,000
20,000,000
25,000,000
0.40
0.60
tivity
‐
5,000,000
10,000,000
0.00
0.20
tenure
Earned Premium Loss Ratio Proposed
Pure Prem
Does this leave money on the table?
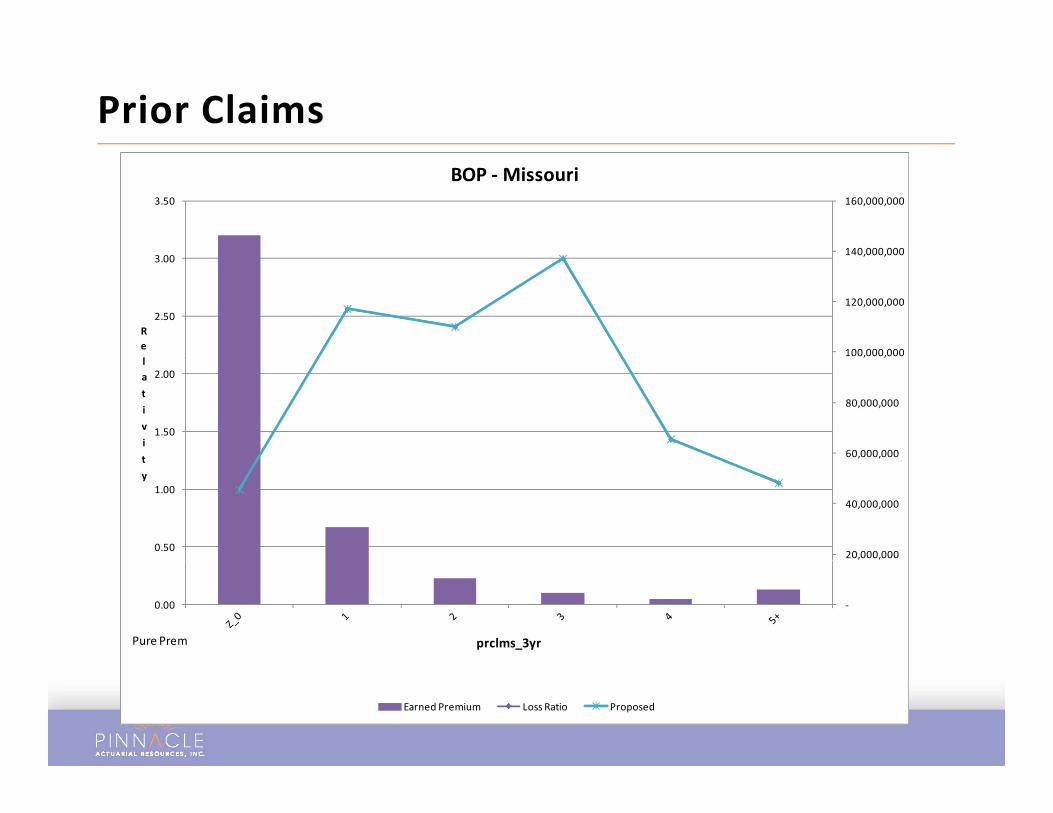
Prior Claims
140 000 000
160,000,000 3.50
BOP ‐Missouri
100,000,000
120,000,000
140,000,000
2.50
3.00
Re
60,000,000
80,000,000
100,000,000
1.50
2.00lativit
20,000,000
40,000,000
, ,
0.50
1.00
ty
‐0.00
prclms_3yrPure Prem
Earned Premium Loss Ratio Proposed

Prior Claims
3 0
3.5
2.5
3.0
1.5
2.0
1.0
0.0
0.5
None 1 Sm 1 Lg 2 Sm 1 Sm, 1 Lg 2 Lg 3 Sm 2 Sm, 1 Lg 1 Sm, 2 Lg 3 Lgg , g g , g , g g
Travelers VA New Selected

Multiple Policy Discounts
Insured Characteristics

PropertyProperty

Property Characteristics
Building Ageld l ll ll Building Type – Sole Occupant, Mall, Strip Mall
Central Alarm Validation of Total Insured Values Inspection Data – (Real Estate and Prior Claims)Inspection Data (Real Estate and Prior Claims) Hazard Zones (Flood, Brush Fire, Coast/Wind, Sink Holes Earthquake)Sink Holes, Earthquake)

Commercial AutoCommercial Auto
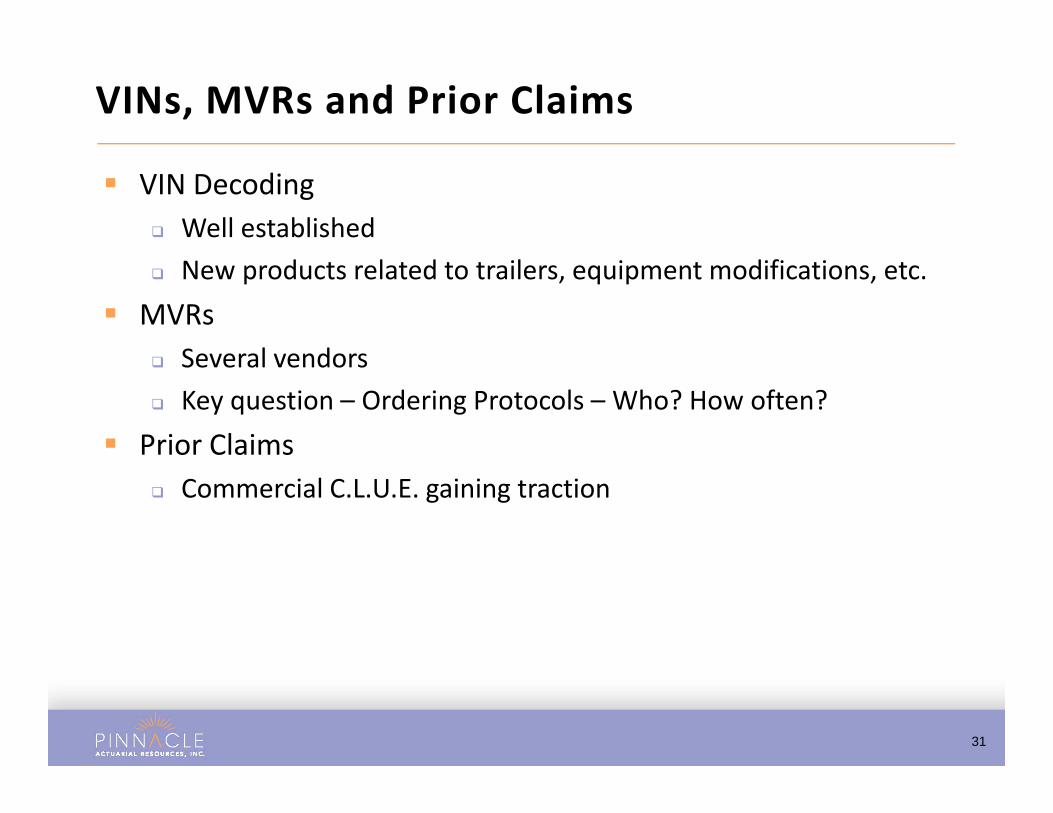
VINs, MVRs and Prior Claims
VIN Decoding Well established New products related to trailers, equipment modifications, etc.
MVRsSeveral vendors Several vendors
Key question – Ordering Protocols – Who? How often? Prior Claims
Commercial C.L.U.E. gaining traction
31

Federal Motor Carrier Safety Administration‐Safety Measurement System Replaces SAFER Scores companies in several categories
Unsafe Driving (Speeding, reckless, lane changes) Fatigued Driving/Hours of Service
Driver Fitness/Training Driver Fitness/Training Controlled Substances/Alcohol Vehicle Maintenance Cargo‐Related (Spills, HazMat) Crash Experience
32

SMS Basic Information
33

SMS Basic Information
34

SMS Scoring
35
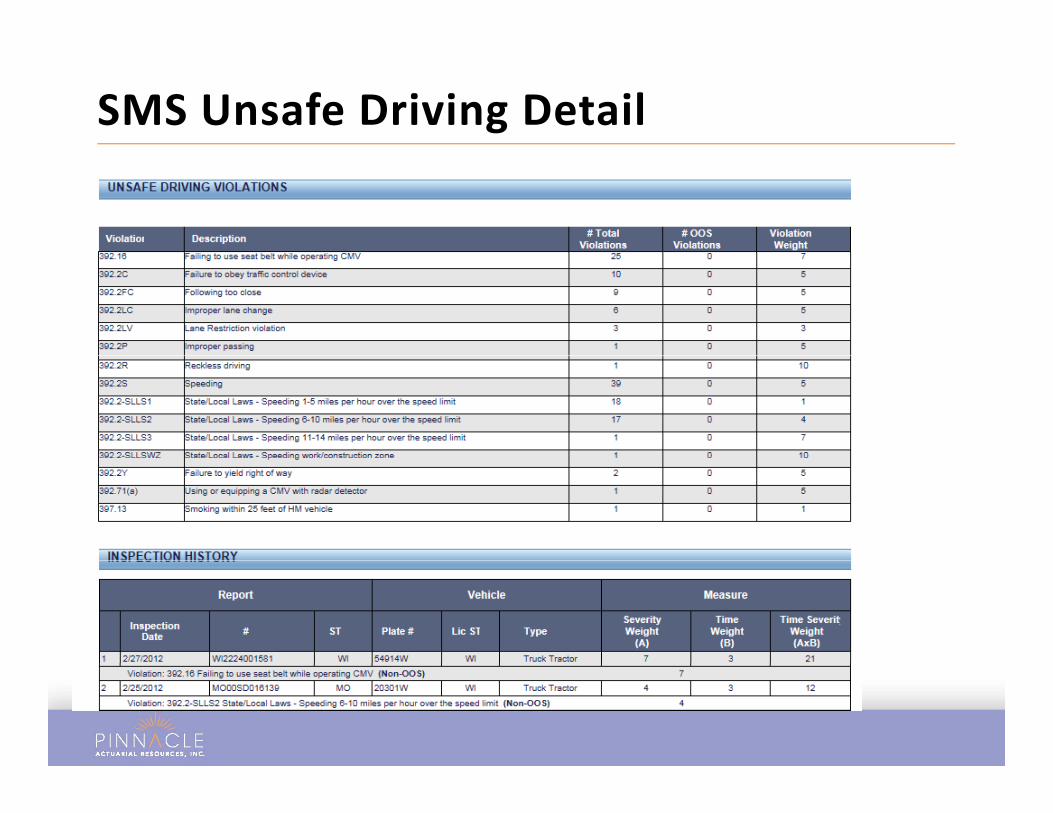
SMS Unsafe Driving Detail

SMS Unsafe Driving Detail
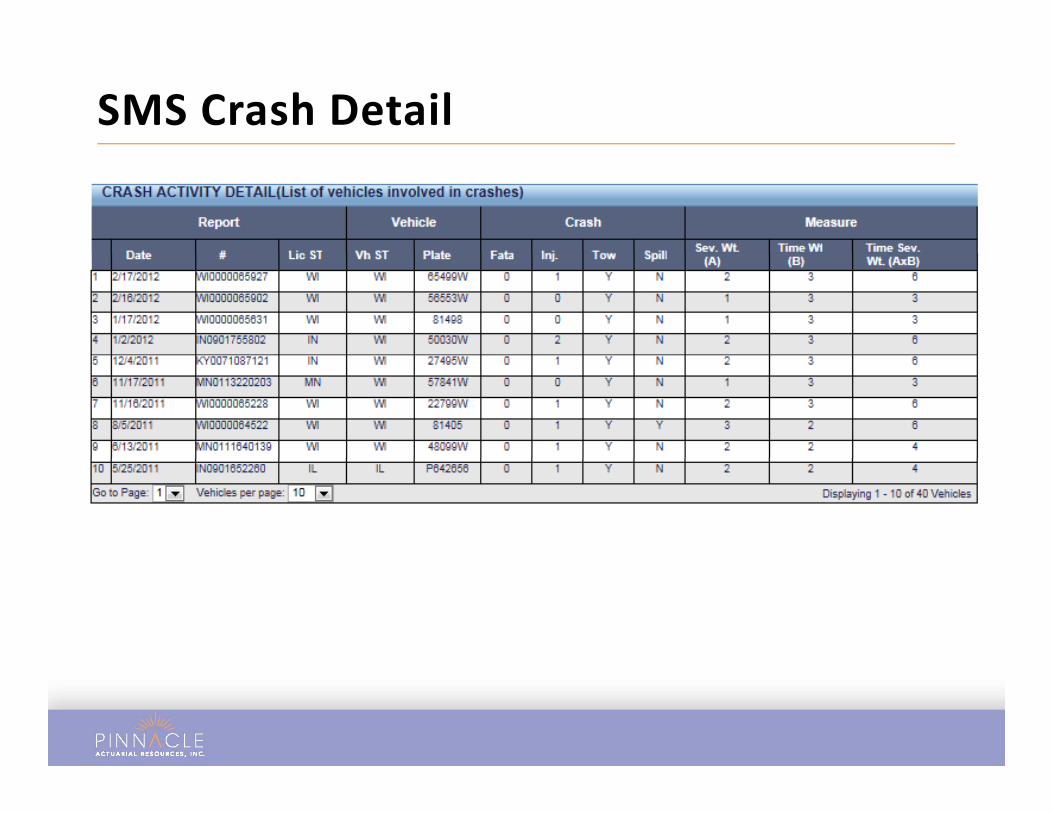
SMS Crash Detail

SMS Crash Detail
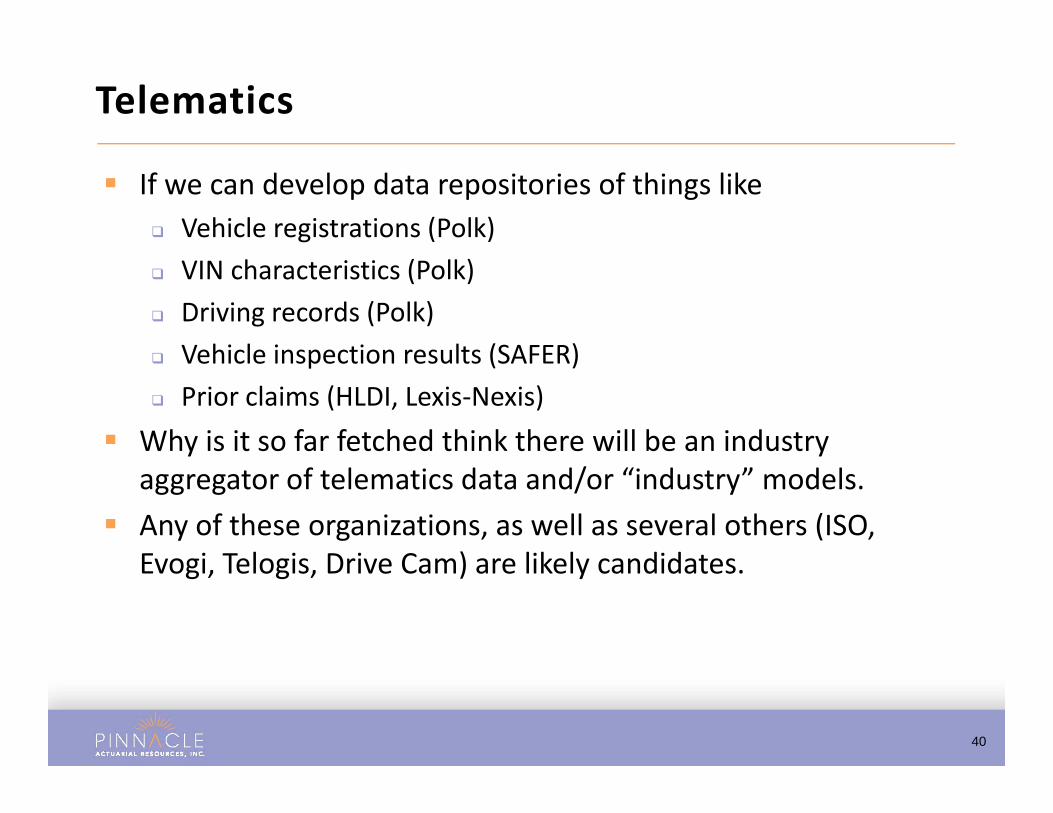
Telematics
If we can develop data repositories of things like Vehicle registrations (Polk) VIN characteristics (Polk) Driving records (Polk) Vehicle inspection results (SAFER) Vehicle inspection results (SAFER) Prior claims (HLDI, Lexis‐Nexis)
Why is it so far fetched think there will be an industry aggregator of telematics data and/or “industry” models.
Any of these organizations, as well as several others (ISO, Evogi Telogis Drive Cam) are likely candidatesEvogi, Telogis, Drive Cam) are likely candidates.
40


Professional LiabilityProfessional Liability

Hospital Professional Data
Centers for Medicare & Medicaid Services (CMS) Hospital Quality Initiative(CMS) Hospital Quality Initiative Captures information on over 4,000 Medicare‐
f d h lcertified hospitals
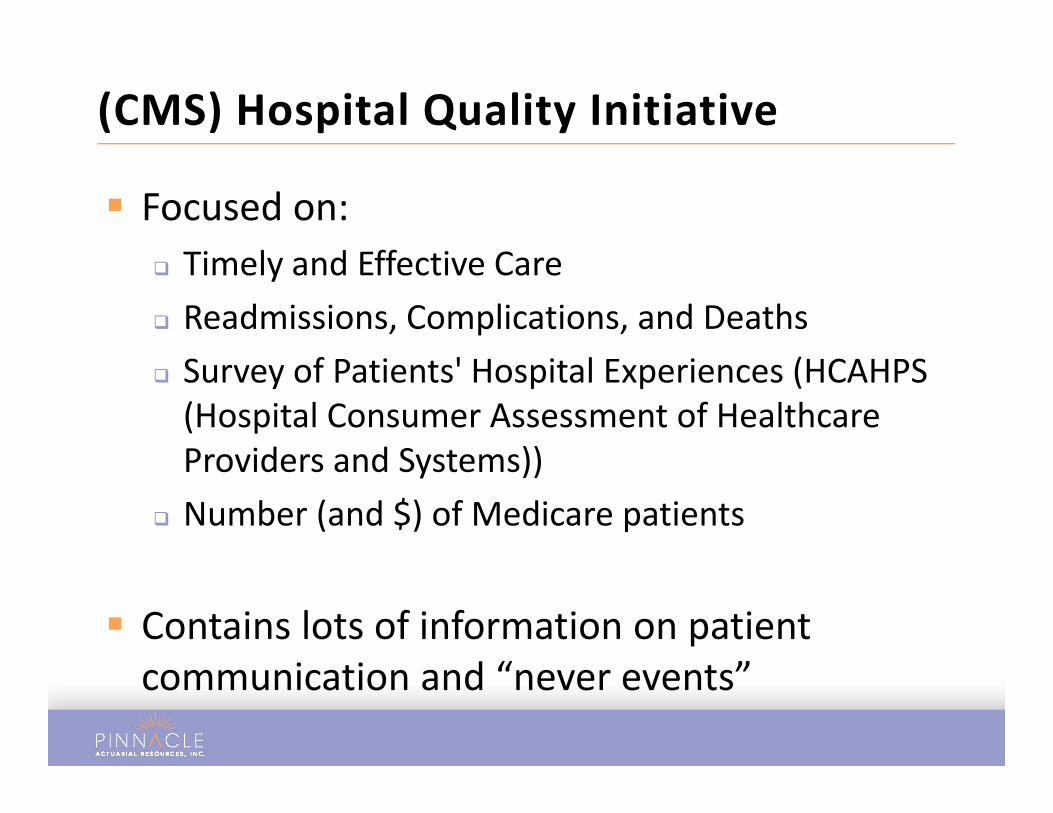
(CMS) Hospital Quality Initiative
Focused on:Ti l d Eff i C Timely and Effective Care
Readmissions, Complications, and Deaths Survey of Patients' Hospital Experiences (HCAHPS (Hospital Consumer Assessment of Healthcare Providers and Systems))Providers and Systems))
Number (and $) of Medicare patients
Contains lots of information on patient i i d “ ”communication and “never events”

Patients not given information about what to do during their recovery at home.
32%45,000
50,000
0.30
0.40
Medical ‐ 0_150k Model 3 Frequency
26%
35,000
40,000
0.10
0.20
‐5%
0%
20,000
25,000
30,000
‐0.20
‐0.10
0.00
Expo
sures
Log o
f Multip
lier
‐35%‐39%
5,000
10,000
15,000
‐0.50
‐0.40
‐0.30
‐‐0.60
H_COMP_6_N_P_rng Type 3: = <.0001
Exposures Frequency Approx 95% Confidence Interval
yp

Blood Incompatibility Claims
60,000
0 80
0.90
Medical ‐ 0_150k Model 3 Frequency
76%
40,000
50,000
0.60
0.70
0.80
33%
30,000
0.40
0.50
Expo
sures
Log o
f Multip
lier
10,000
20,000
0.10
0.20
0.30
0% ‐0.00
HAC_3_rng Type 3: = <.0001
Exposures Frequency Approx 95% Confidence Interval
yp

Pneumonia Death Rate
45,000
50,000 0.20
Medical ‐ 0_150k Model 3 Frequency
30 000
35,000
40,000
0.10
0.15
‐1%0%
4% 4% 4%
20,000
25,000
30,000
0.00
0.05
Expo
sures
Log o
f Multip
lier
‐9%
5,000
10,000
15,000
‐0.10
‐0.05
‐‐0.15
pneumonia_death_rate_rng Type 3: = <.0001
Exposures Frequency Approx 95% Confidence Interval

Patients Receiving “Right Antibiotic”
45,000
50,000 0.30
Medical ‐ 0_150k Model 3 Frequency
14%
35,000
40,000
0.10
0.20
16%
0%
20,000
25,000
30,000
‐0.10
0.00
Expo
sures
Log o
f Multip
lier
‐16%
‐20%
5,000
10,000
15,000
‐0.30
‐0.20
‐‐0.40
OP_7_rng Type 3: = <.0001
Exposures Frequency Approx 95% Confidence Interval
