survey of electricity (and gas) trends and drivers in asia · survey of electricity (and gas)...
TRANSCRIPT
Survey of electricity (and gas) trends and drivers in Asia 10th International Chlor-Alkali & Vinyls Conference 2016, Bangkok, Thailand
Xinmin Hu ([email protected])
2-3 March 2016
The Lantau Group Confidential and Proprietary
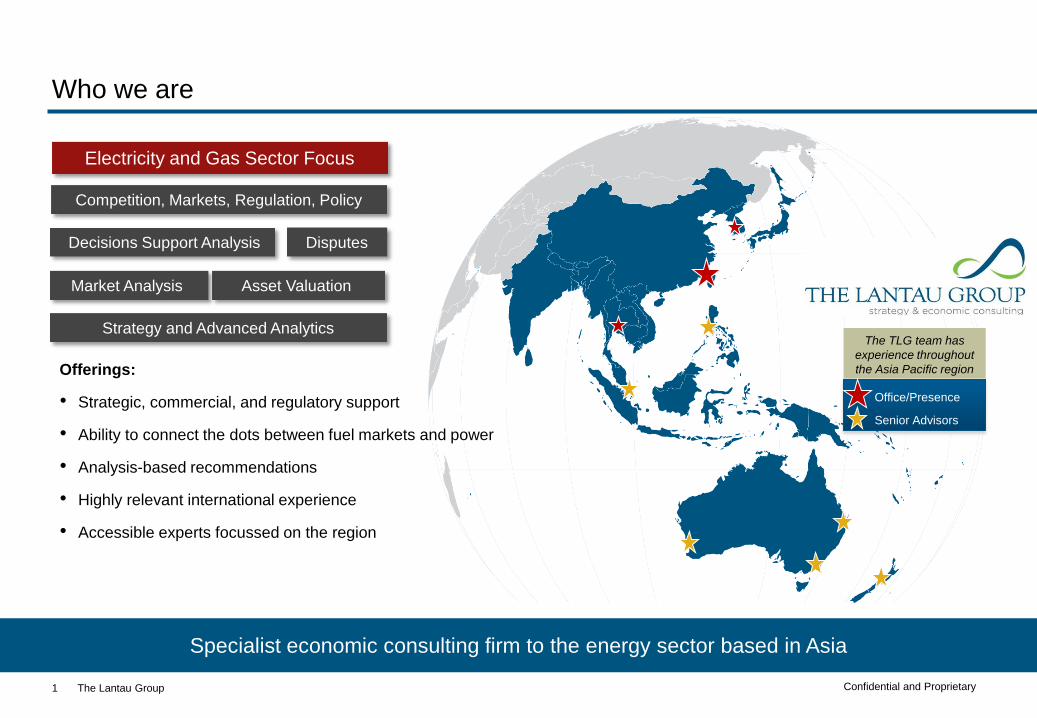
Who we are
Decisions Support Analysis
Asset Valuation
Strategy and Advanced Analytics
Competition, Markets, Regulation, Policy
Disputes
Market Analysis
Electricity and Gas Sector Focus
The TLG team has
experience throughout
the Asia Pacific region
Office/Presence
Senior Advisors
Offerings:
• Strategic, commercial, and regulatory support
• Ability to connect the dots between fuel markets and power
• Analysis-based recommendations
• Highly relevant international experience
• Accessible experts focussed on the region
Specialist economic consulting firm to the energy sector based in Asia
1
The Lantau Group Confidential and Proprietary
0
5
10
15
20
25
US
¢/k
Wh
2014 Prices Asian Cities European Cities Australian Cites
US Cites
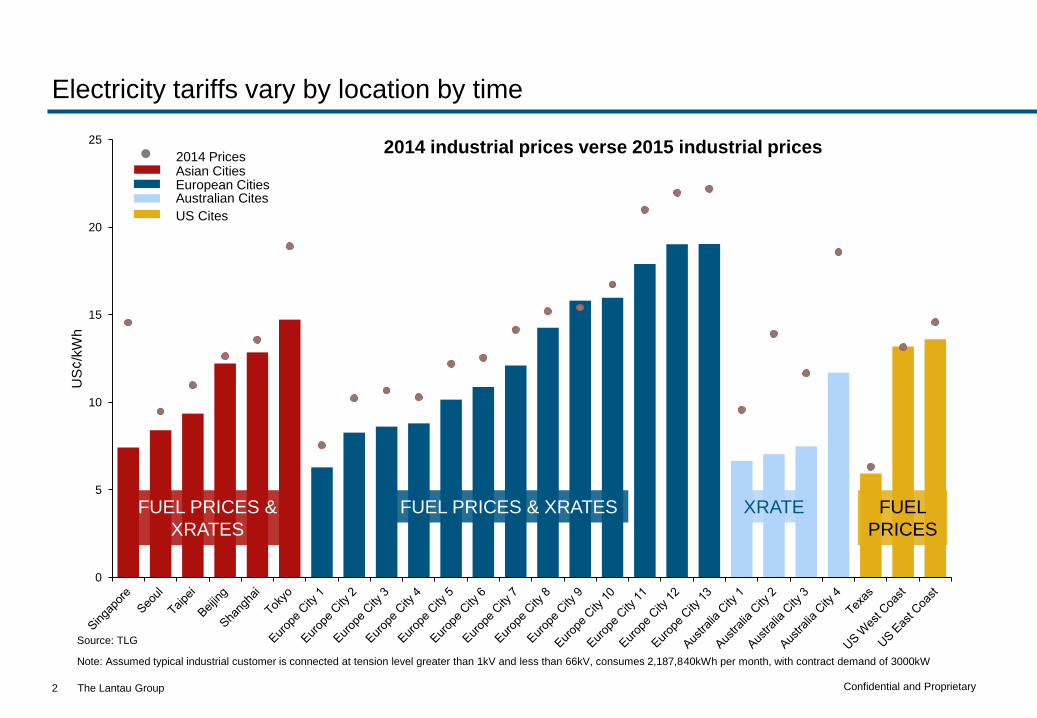
2014 industrial prices verse 2015 industrial prices
Source: TLG
FUEL
PRICES
FUEL PRICES & XRATES FUEL PRICES &
XRATES
XRATE
Note: Assumed typical industrial customer is connected at tension level greater than 1kV and less than 66kV, consumes 2,187,840kWh per month, with contract demand of 3000kW
Electricity tariffs vary by location by time
2
The Lantau Group Confidential and Proprietary
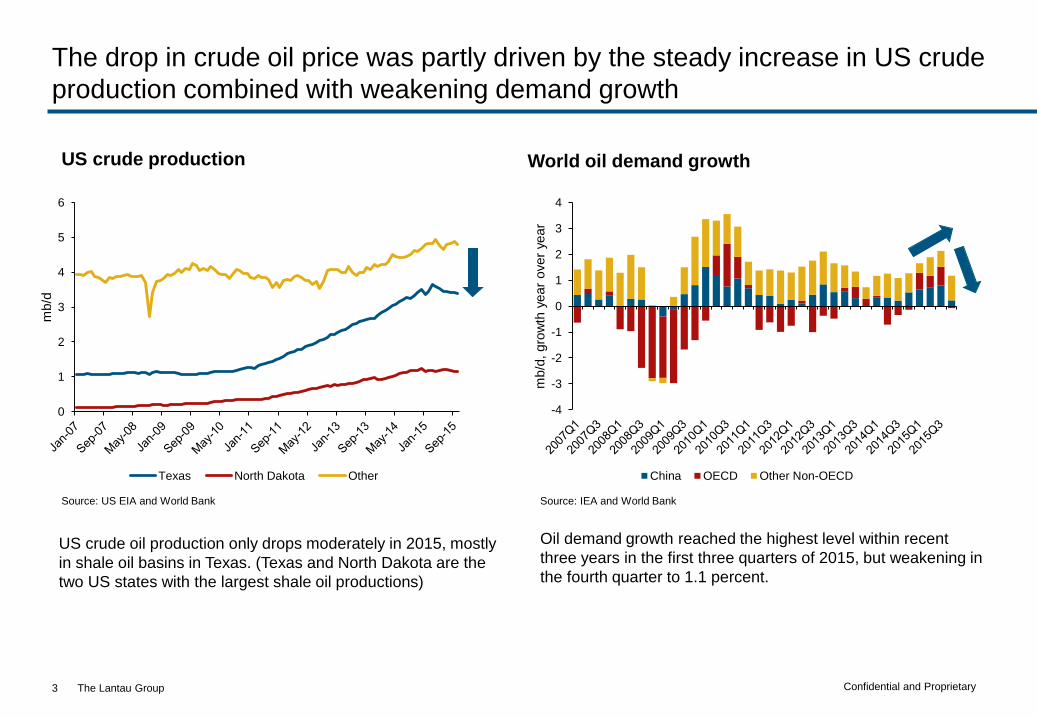
The drop in crude oil price was partly driven by the steady increase in US crude
production combined with weakening demand growth
3
Source: US EIA and World Bank
US crude production World oil demand growth
Source: IEA and World Bank
-4
-3
-2
-1
0
1
2
3
4
mb/d
, gro
wth
year
over
year
China OECD Other Non-OECD
0
1
2
3
4
5
6
mb/d
Texas North Dakota Other
US crude oil production only drops moderately in 2015, mostly
in shale oil basins in Texas. (Texas and North Dakota are the
two US states with the largest shale oil productions)
Oil demand growth reached the highest level within recent
three years in the first three quarters of 2015, but weakening in
the fourth quarter to 1.1 percent.

The Lantau Group Confidential and Proprietary
Forward price curves are still converging, but to a lower long-term level –
though the range is wide
4
Brent forward curve
Source: ICE
Dated Brent
($/barrel)
2013 (historical) 109
2014 (historical) 99
2015 (historical) 53
2016 (forecast) 32
2017 (forecast) 38
2018 (forecast) 42
2019 (forecast) 45
2020 (forecast) 47
0
20
40
60
80
100
120
140
2000 2002 2004 2006 2008 2010 2012 2014 2016 2018 2020 2022 2024
End 2009
USD/barrel
June 2014
End 2008
Sept 2014
October 2014
Feb 2015
June 2015
15 Jan 2016
End 2009
USD/barrel
June 2014
End 2008
Sept 2014
October 2014
Feb 2015
Dec 2015
Spot Brent
50 to 75
80 to 100 June ‘14 to Feb ‘15
June ‘15 to Jan ‘16
?

The Lantau Group Confidential and Proprietary
Lower prices are leading to delays in new gas development projects
5
2015 2016
3.6 Mtpa PNG T1
3.6 Mtpa PNG T2
5 Mtpa Australia Gorgon T1
5 Mtpa Gorgon T2
5 Mtpa GorgonT3
4.25 Mtpa Australia (Curtis) T1
2017
4.25 Mtpa Curtis T2
7.8 Mtpa Australia Gladstone T1,2
2.1 Mtpa Indonesia Donggi-Senoro
4.5 Mtpa Australia APLNG T1
2014
= coal seam gas projects
9 Mtpa Sabine Pass LNG
train 1 and 2 from US
9 Mtpa Sabine Pass LNG
train 3 and 4
2018
Originally planned commission date
Current low LNG prices pushed back new LNG projects

The Lantau Group Confidential and Proprietary
0
50
100
150
200
Most tariff reductions linked to fuel markets
Newcastle coal price FOB, USD per metric ton
0
50
100
150 Brent crude oil price, USD per barrel
Source: World Bank
Down>60%
Down>70%
The Lantau Group Confidential and Proprietary
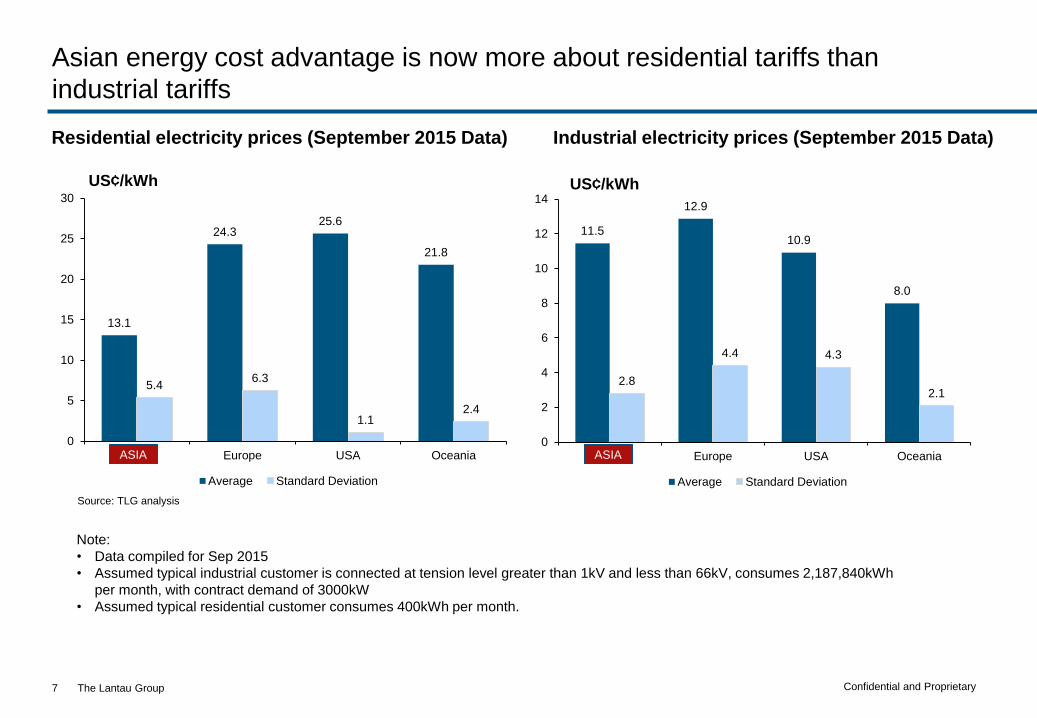
13.1
24.3 25.6
21.8
5.4 6.3
1.1 2.4
0
5
10
15
20
25
30
Aisa Europe USA Oceania
Average Standard Deviation
11.5
12.9
10.9
8.0
2.8
4.4 4.3
2.1
0
2
4
6
8
10
12
14
Aisa Europe USA Oceania
Average Standard Deviation
Asian energy cost advantage is now more about residential tariffs than
industrial tariffs
Note:
• Data compiled for Sep 2015
• Assumed typical industrial customer is connected at tension level greater than 1kV and less than 66kV, consumes 2,187,840kWh
per month, with contract demand of 3000kW
• Assumed typical residential customer consumes 400kWh per month.
Source: TLG analysis
Industrial electricity prices (September 2015 Data) Residential electricity prices (September 2015 Data)
US¢/kWh US¢/kWh
ASIA ASIA
7

The Lantau Group Confidential and Proprietary
China
8

The Lantau Group Confidential and Proprietary
Key factors affecting power cost in China
9
Reduction and control of coal
use in key cities
Gas/coal price/demand growth drops
More stringent environmental control costs
Promotion of Renewable
energy
Increasing transmission costs due to UHV builds
Upwards factors:
• Emissions control and
national ETS
• Renewable share
• Reduction of coal use
• UHV and grid expansion
Downwards factors:
• Fall of fuel prices
• Fall of project cost of
wind and solar
• Slowing growth of
demand
Opportunities from
market reform:
• Direct contracting
• Retail market opening
• Power plant dispatch
policies
The Lantau Group Confidential and Proprietary
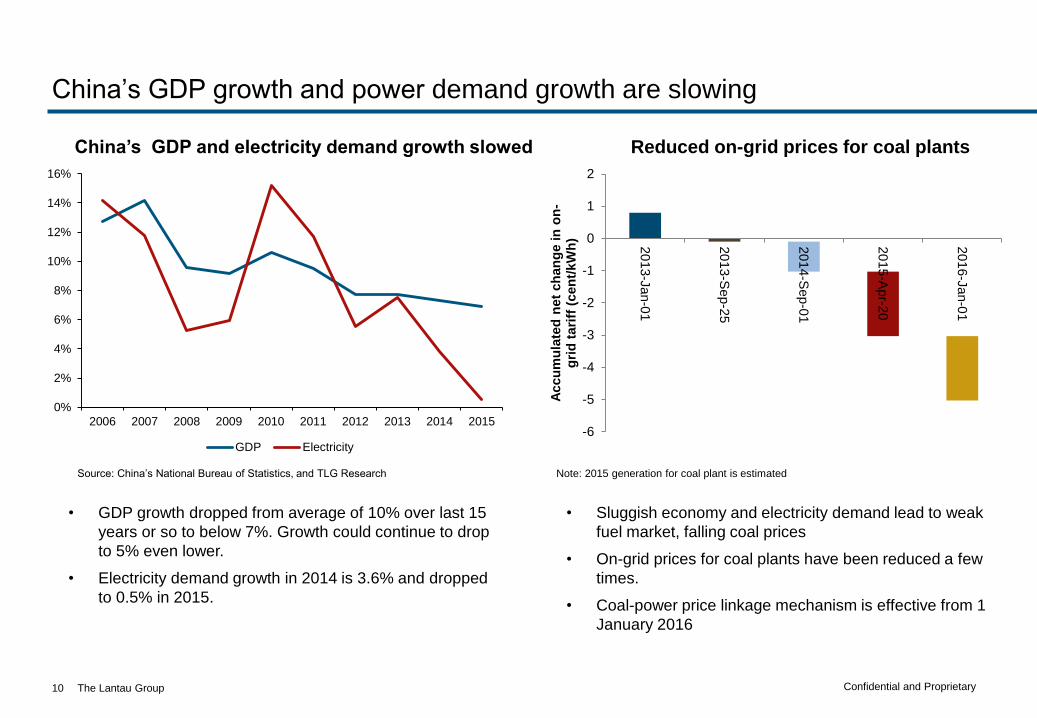
China’s GDP growth and power demand growth are slowing
10
0%
2%
4%
6%
8%
10%
12%
14%
16%
2006 2007 2008 2009 2010 2011 2012 2013 2014 2015
GDP Electricity
China’s GDP and electricity demand growth slowed
Source: China’s National Bureau of Statistics, and TLG Research
• GDP growth dropped from average of 10% over last 15
years or so to below 7%. Growth could continue to drop
to 5% even lower.
• Electricity demand growth in 2014 is 3.6% and dropped
to 0.5% in 2015.
• Sluggish economy and electricity demand lead to weak
fuel market, falling coal prices
• On-grid prices for coal plants have been reduced a few
times.
• Coal-power price linkage mechanism is effective from 1
January 2016
Note: 2015 generation for coal plant is estimated
Reduced on-grid prices for coal plants
-6
-5
-4
-3
-2
-1
0
1
2
20
13-J
an-0
1
20
13-S
ep-2
5
20
14-S
ep-0
1
20
15-A
pr-2
0
20
16-J
an-0
1
Accu
mu
late
d n
et
ch
an
ge in
on
-g
rid
tari
ff (
cen
t/kW
h)

The Lantau Group Confidential and Proprietary
Environmental problems remain serious and more renewable energy targeted
11
Curtailment of wind and solar generation from
2013-2015
Source: NEA publications
National Climate Center
Days of
smog
Smoggy days of 74 cities in 2013
While the regions in the East, South and Central are perplexed by air quality problems, clean power generation of wind and solar in the west and north is being curtailed.
Transmission to link the regions is needed.
The Lantau Group Confidential and Proprietary
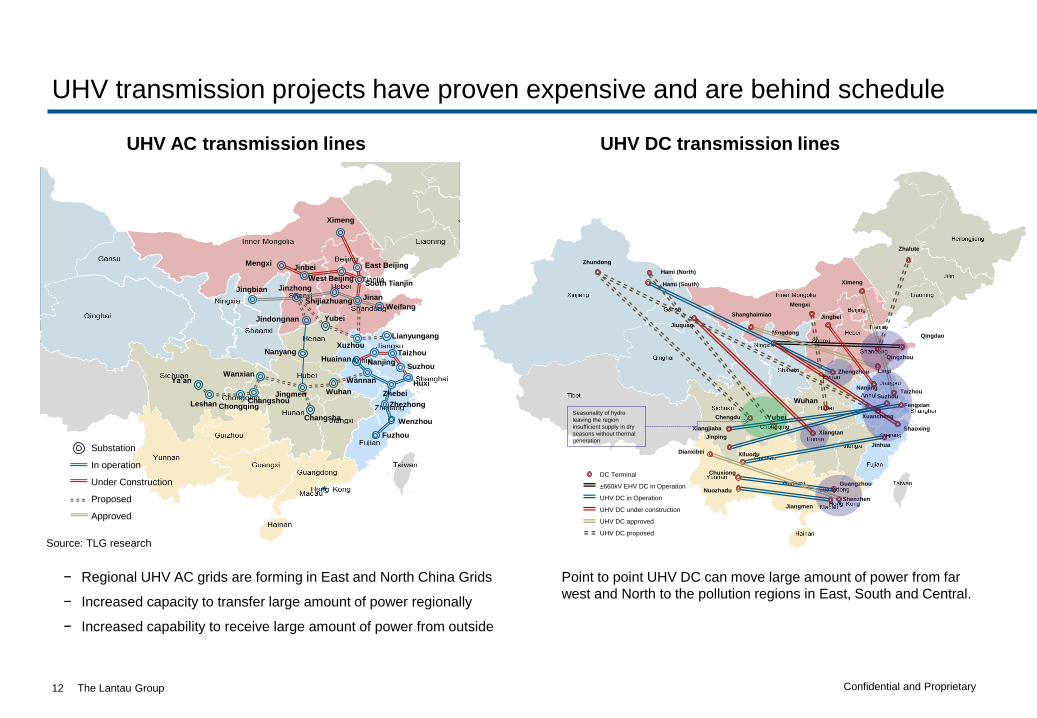
UHV transmission projects have proven expensive and are behind schedule
12
Ximeng
Mengxi
West BeijingSouth Tianjin
Weifang
JinanShijiazhuang
JinzhongJingbian
Jindongnan Yubei
Xuzhou
Nanjing
Taizhou
Suzhou
Huxi
Zhebei
Wannan
Huainan
Wuhan
Changsha
Nanyang
Substation
In operation
Under Construction
Proposed
Approved
Zhezhong
Ya’an
Leshan ChongqingChangshou
Wanxian
Fuzhou
Wenzhou
Jingmen
Jinbei East Beijing
Lianyungang
Source: TLG research
DC Terminal
±660kV EHV DC in Operation
UHV DC in Operation
UHV DC under construction
UHV DC approved
UHV DC proposed
Jinping
Nuozhadu
Jiangmen
Hami (South)
Taizhou
Ningdong
Shaoxing
Mengxi
Xiluodu
Jinhua
Ximeng
Wuhan
Zhengzhou
Xiangjiaba
Qingdao
Jiuquan
Xiangtan
Zhalute
Shanghaimiao
Fengxian
Qingzhou
Linyi
Suzhou
Shenzhen
Dianxibei
Chuxiong
Guangzhou
Zhundong
XuanchengChengdu Yubei
Hami (North)
Seasonality of hydro
leaving the region
insufficient supply in dry
seasons without thermal
generation
Jingbei
Nanjing
UHV AC transmission lines UHV DC transmission lines
− Regional UHV AC grids are forming in East and North China Grids
− Increased capacity to transfer large amount of power regionally
− Increased capability to receive large amount of power from outside
Point to point UHV DC can move large amount of power from far
west and North to the pollution regions in East, South and Central.
The Lantau Group Confidential and Proprietary
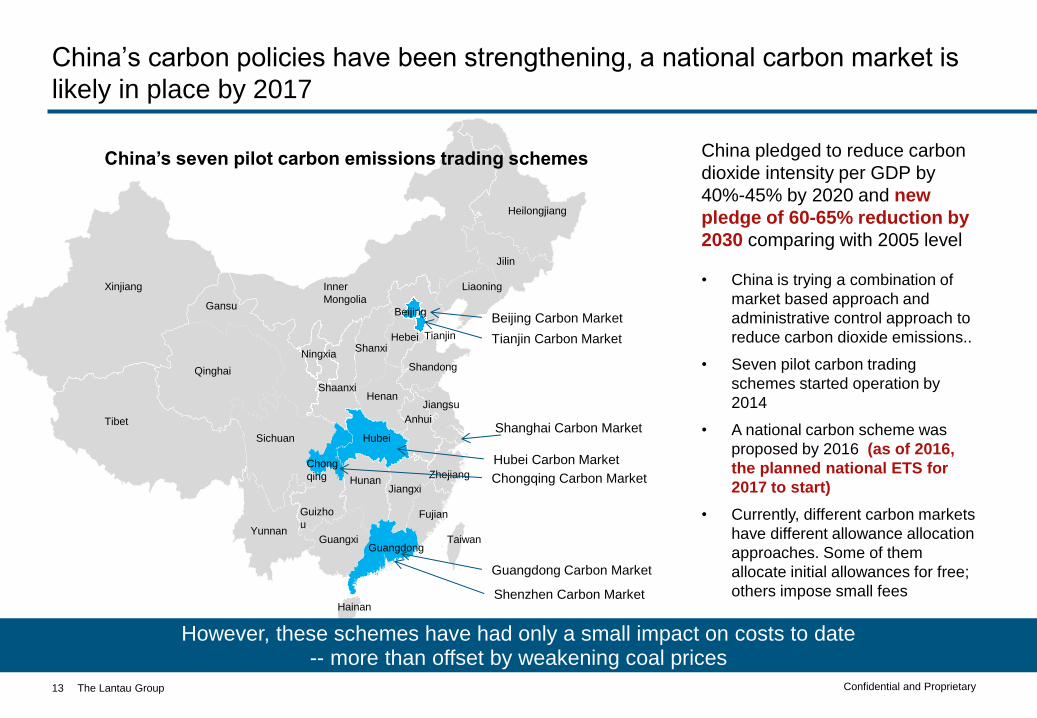
China’s carbon policies have been strengthening, a national carbon market is
likely in place by 2017
13
Xinjiang
Tibet
Qinghai
Gansu
Inner
Mongolia
Ningxia
Sichuan
Yunnan
Guizho
u
Chong
qing
Guangdong
Fujian
Taiwan
Jiangxi
Guangxi
Hunan
Hubei
Henan
Anhui
Jiangsu
Shandong
Liaoning
Jilin
Heilongjiang
Shanxi
Shaanxi
Hebei
Beijing
Zhejiang
Hainan
Beijing Carbon Market
Tianjin Carbon Market
Guangdong Carbon Market
Shenzhen Carbon Market
Shanghai Carbon Market
Chongqing Carbon Market
Hubei Carbon Market
China pledged to reduce carbon
dioxide intensity per GDP by
40%-45% by 2020 and new
pledge of 60-65% reduction by
2030 comparing with 2005 level
• China is trying a combination of
market based approach and
administrative control approach to
reduce carbon dioxide emissions..
• Seven pilot carbon trading
schemes started operation by
2014
• A national carbon scheme was
proposed by 2016 (as of 2016,
the planned national ETS for
2017 to start)
• Currently, different carbon markets
have different allowance allocation
approaches. Some of them
allocate initial allowances for free;
others impose small fees
However, these schemes have had only a small impact on costs to date -- more than offset by weakening coal prices
Tianjin
China’s seven pilot carbon emissions trading schemes
The Lantau Group Confidential and Proprietary
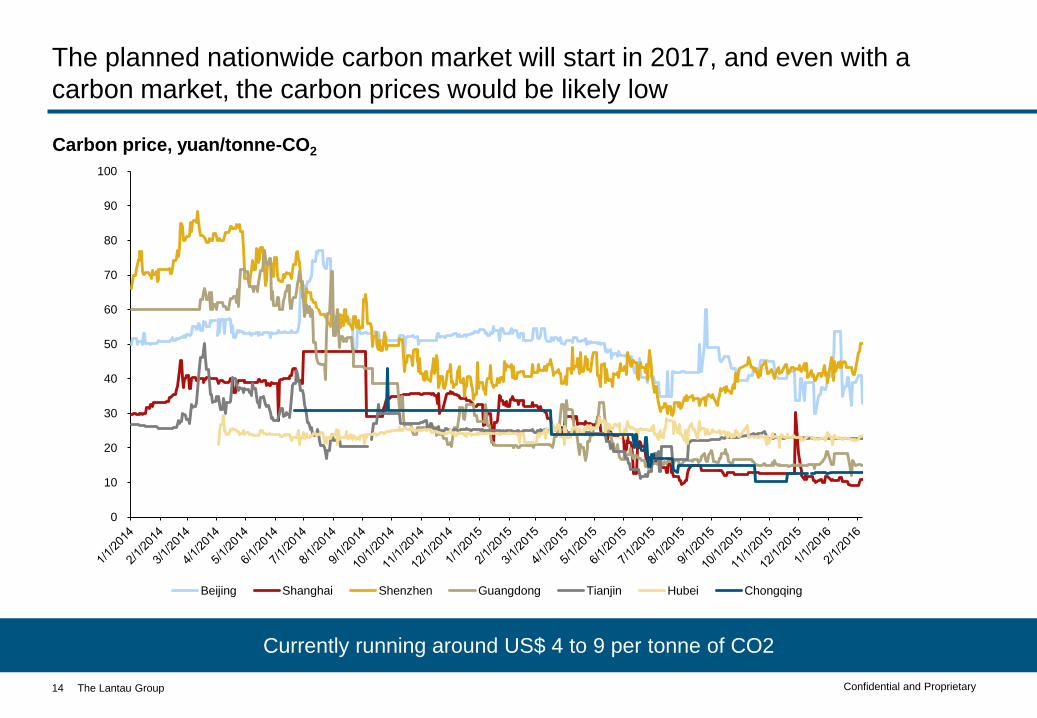
The planned nationwide carbon market will start in 2017, and even with a
carbon market, the carbon prices would be likely low
14
Currently running around US$ 4 to 9 per tonne of CO2
Carbon price, yuan/tonne-CO2
0
10
20
30
40
50
60
70
80
90
100
Beijing Shanghai Shenzhen Guangdong Tianjin Hubei Chongqing

The Lantau Group Confidential and Proprietary
China is reforming its energy and power industry, opportunities exist but…
15
Market reform implementation remains unclear
Network separation and separate transmission and distribution pricing
• Bilateral contracting between end users and generators is becoming possible;
• Changing regulation of transmission pricing already led to lower tariffs in Shenzhen, the pilot reform
Retail market opening
• Competition aimed to improve the efficiency of retailers
• Should increase choices of end-users and potentially lower prices
Reforming generation dispatch
• Increasing competition in the generation sector
• Supply cost reduction overall
The Lantau Group Confidential and Proprietary
Summary
• Dramatically weaker energy cost environment due to fuel market and macro factors
• Some delays to new gas and oil projects seen, some efforts to firm prices, and an upward
sloping oil forward curve
– But forecast is still well below levels projected even a year ago
• Asian electricity prices driven largely by fuel prices, fuel mix, and environmental concern
• Each market affected differently based on its fuel mix, reliance on imported fuels, and supply /
demand balance
16

The Lantau Group Confidential and Proprietary
Contact
Mike Thomas [email protected]
Xinmin Hu [email protected]
By phone +852 2521 5501 (office)
By mail 4602-4606 Tower 1, Metroplaza
223 Hing Fong Road,
Kwai Fong, Hong Kong
Online www.lantaugroup.com
Rigour
Value
Insight
Energy Power Utilities
17
Thank You

The Lantau Group Confidential and Proprietary
Fuel prices affect each Asian country differently – reflecting differences in fuel mix
and energy policy and regulation
18
Source: Various government sources
Generation fuel mix across countries
in 2013 and 2014 China
Coal generation share
was squeezed down by
hydro and other
renewables. More
renewable generation
means more levies on
end-users to pay
renewable generation. On
average, tariff increased in
2014 from 2013
Japan
More gas generation to
replace expensive oil
power generation, reducing
overall supply cost,
offsetting the replacement
cost of cheaper nuclear
generation. Tariff on
average reduced slightly in
2014 from 2013.
Australia
Lower hydro availability
was compensated by more
gas and renewable
generation, which are more
expensive. Tariffs
increased in 2014 from
2013, even gas price in
2014 was cheaper than in
2013.
Singapore
Expensive oil generation
was squeezed to 0.9%
from 5% by cheaper gas
generation. Tariff
decreased in 2014 from
2013
Australia (NSW) China Japan Singapore
0%
10%
20%
30%
40%
50%
60%
70%
80%
90%
100%
2013 2014 2013 2014 2013 2014 2013 2014
Coal Gas Oil Nuclear Hydro Other renewables Others
Local
Coal
Imported
Gas
Imported
Coal
Imported
Gas & Oil

The Lantau Group Confidential and Proprietary
0
20
40
60
80
100
120
140
160
0
100
200
300
400
500
600
700
800
900
1000
0
2000
4000
6000
8000
10000
12000
14000
16000
0
20
40
60
80
100
120
140
160
180
200
Brent oil price in Asian currencies compared to USD
19
Source: World Bank, Oanda
Down 71%
Brent crude oil price, USD per barrel Brent crude oil price, CNY per barrel
Brent crude oil price, SGD per barrel
Down 69%
Brent crude oil price, JPY per barrel
Down 66% Down 67%