survey basics: introduction to qualtrics - oxy.edu qualtrics... · survey basics: introduction to...
TRANSCRIPT
Survey Basics: Introduction to Qualtrics
IRAP Professional Development Workshop Series
Zak Buschbach
Summer 2015
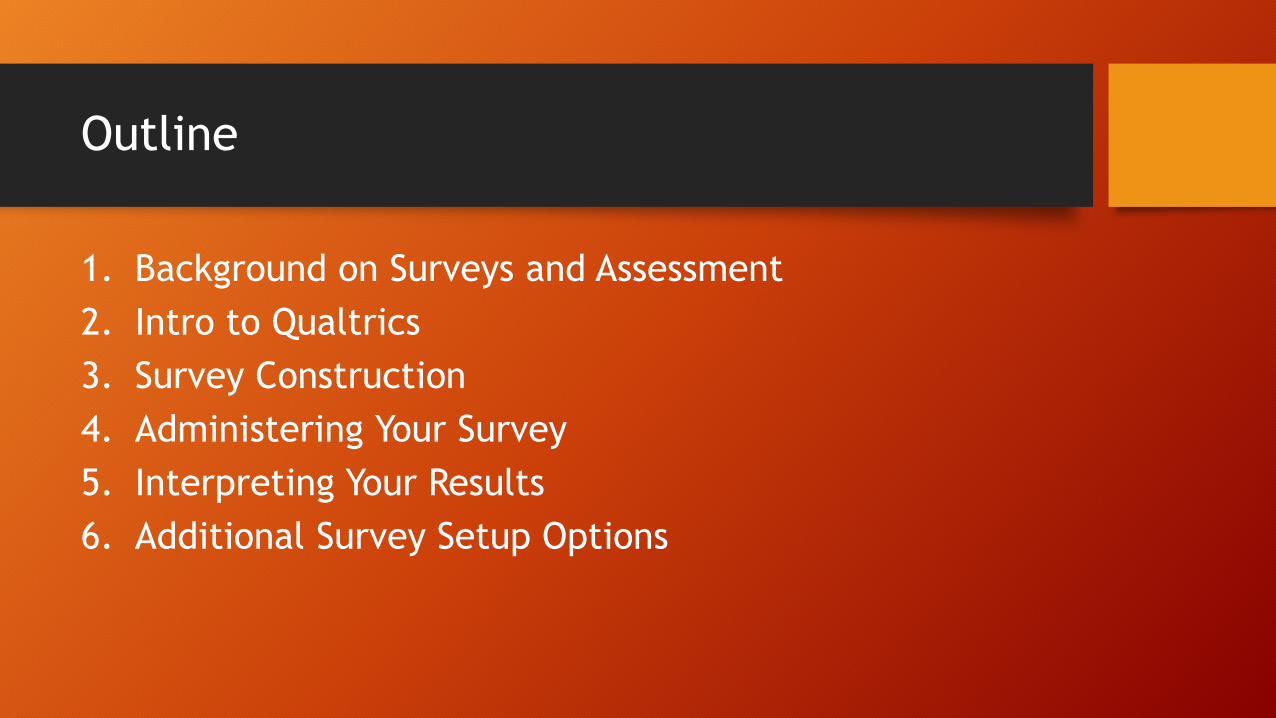
Outline
1. Background on Surveys and Assessment
2. Intro to Qualtrics
3. Survey Construction
4. Administering Your Survey
5. Interpreting Your Results
6. Additional Survey Setup Options
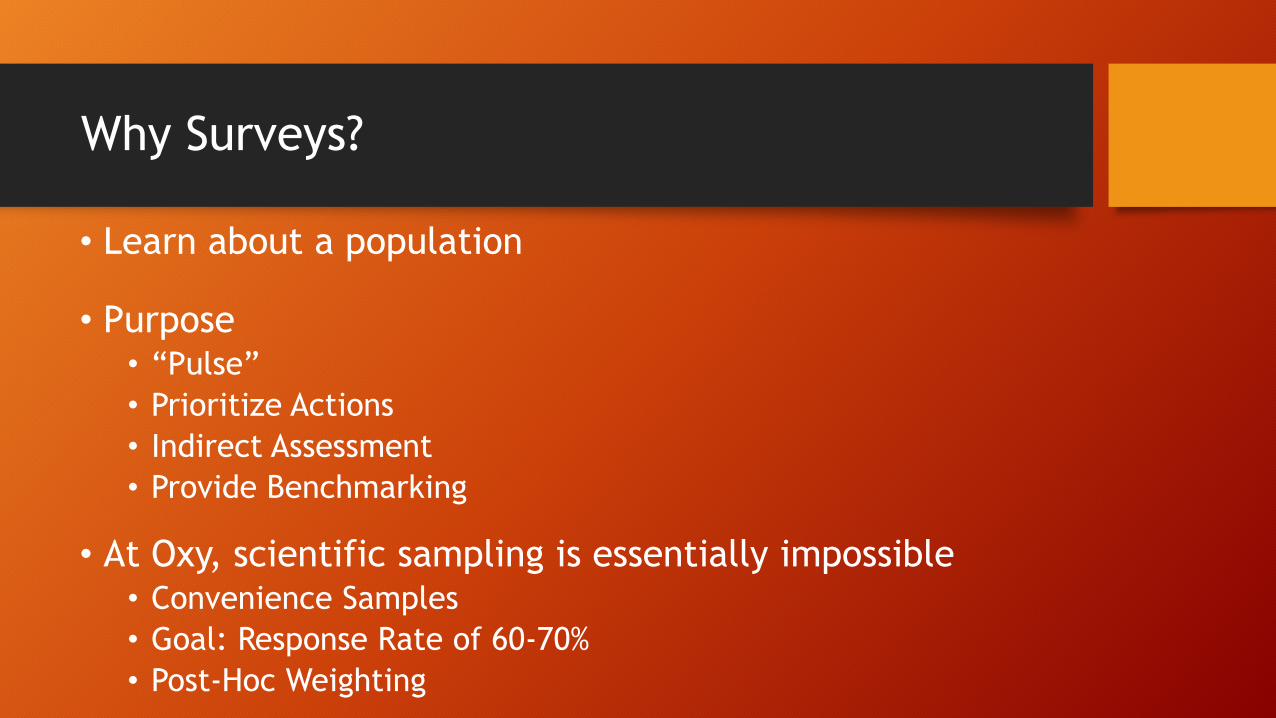
Why Surveys?
• Learn about a population
• Purpose • “Pulse”
• Prioritize Actions
• Indirect Assessment
• Provide Benchmarking
• At Oxy, scientific sampling is essentially impossible • Convenience Samples
• Goal: Response Rate of 60-70%
• Post-Hoc Weighting
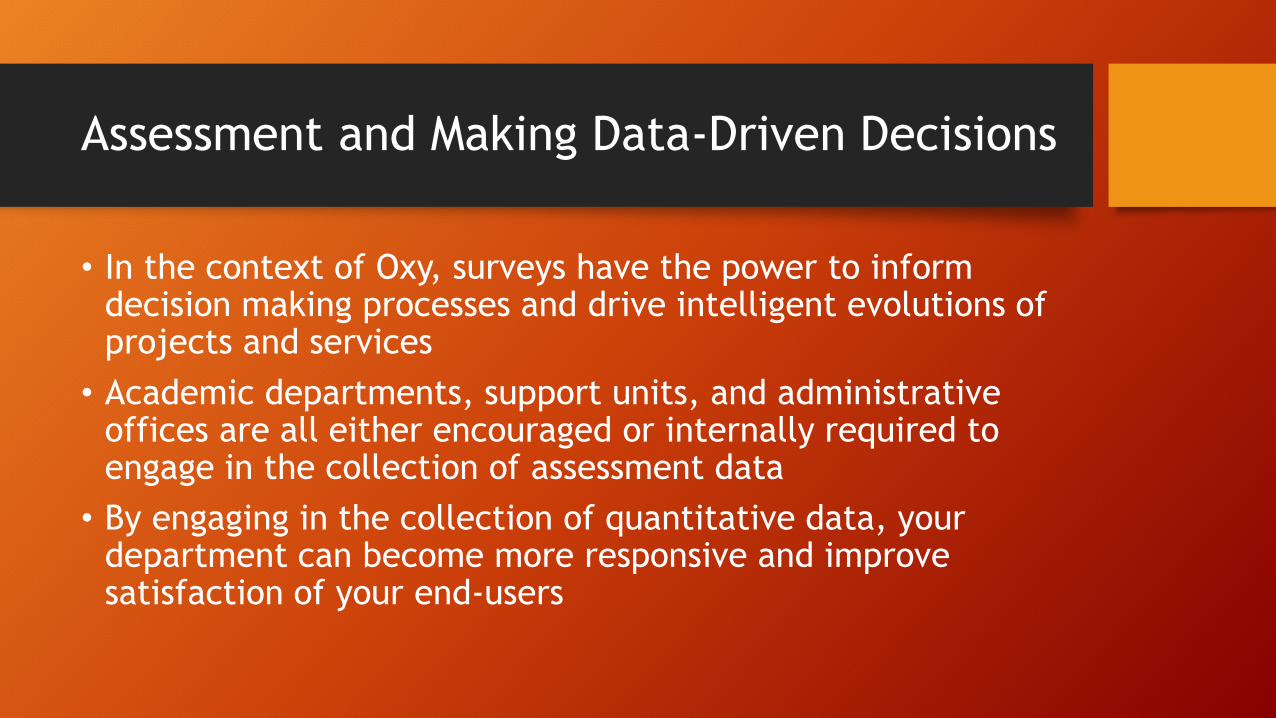
Assessment and Making Data-Driven Decisions
• In the context of Oxy, surveys have the power to inform decision making processes and drive intelligent evolutions of projects and services
• Academic departments, support units, and administrative offices are all either encouraged or internally required to engage in the collection of assessment data
• By engaging in the collection of quantitative data, your department can become more responsive and improve satisfaction of your end-users
What is Qualtrics?
• Qualtrics is a professional survey administration and management tool • Google Forms has proven to be a popular alternative, but
serves only very simple needs
• Oxy has an institution license • For an account, email Carey Sargent ([email protected])
• Collaboration on surveys with anyone at Oxy is easy
Designing Survey Questions
• Research Question? PURPOSE? (think about your hypothesis/conclusion/abstract/report)
• LESS IS MORE!
• Focus on Knowledge, Skills, Attitudes
• Validity (Content) and Reliability (Consistency) • Pilot your survey, get feedback, know your audience
• Think about your analysis while developing
Dos and Don’ts of Surveys
• Ensure • Questions and responses are clear and concise • Response categories are exhaustive and mutually
exclusive
• Avoid • Double negatives • Double barreled questions • Biased/leading questions
Building Your Instrument
• Your survey instrument should be as short and as straightforward as possible while still measuring what you need it to – only ask necessary questions • People are much less likely to complete your survey if it is long
• If you must have a long survey, split questions into groups on different pages • Two benefits: saves partial responses should people drop-off partway
through; may increase completion speed & response rate
Question Design Choices
• Types of questions: • General Forms
• Multiple Choice • Slider/Scale (snap to whole numbers in most cases, especially when Likert) • Matrix • Free Response
• Unusual Forms • Rank Order Lists • Explanatory/Introductory Text • Document Upload
• Not all question types work on mobile devices – an amber asterisk will indicate compatibility issues (sliders are the most popular type of question with mobile issues)
Other Design Features
• Question Blocks • Blocks show up as separate pages in the live survey
• Have an introductory page as the first block
• Display and Skip Logic • Display logic allows you to create contingency questions –
questions that only display in response to a condition (such as if the respondent says yes to a question)
• Skip logic allows you to jump to a different section of the survey in response to a condition
Steps before Launch
• Survey Options and Look and Feel are the two final settings menus to be addressed before launching a survey
• Survey Preview allows you to see how the survey will look to your respondents
• Launching is the final step before administering your survey
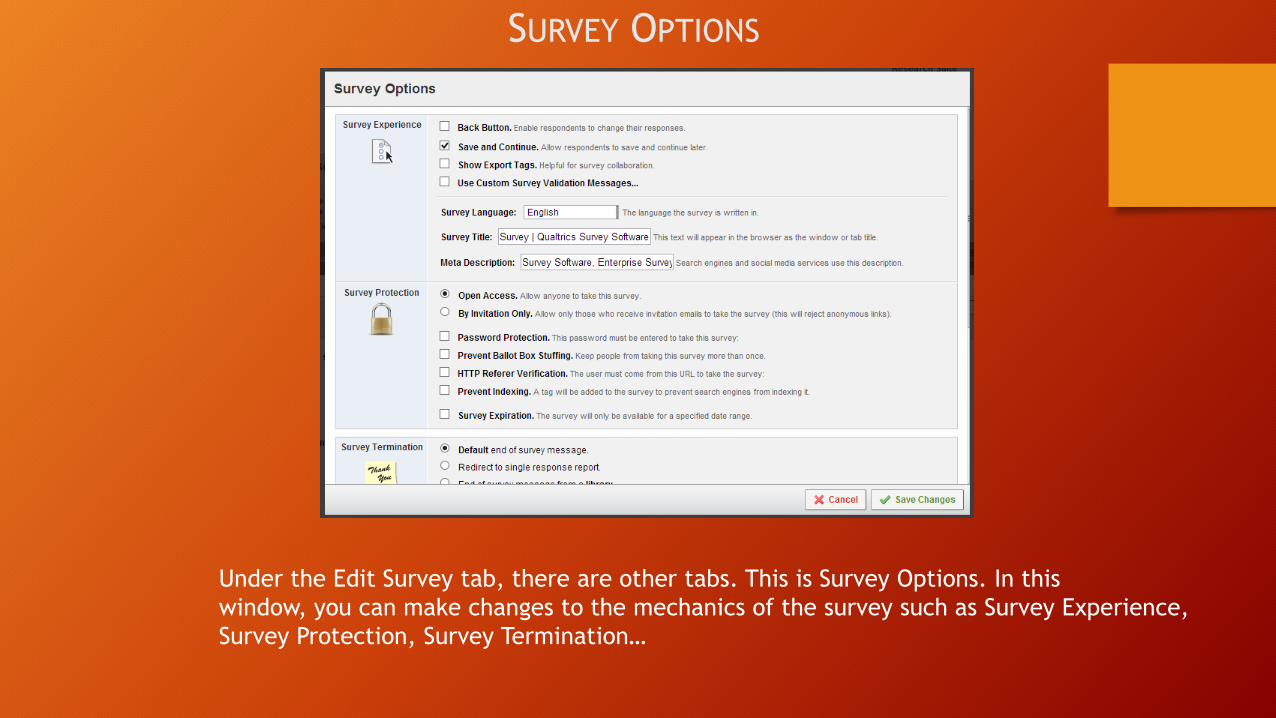
SURVEY OPTIONS
Under the Edit Survey tab, there are other tabs. This is Survey Options. In this
window, you can make changes to the mechanics of the survey such as Survey Experience,
Survey Protection, Survey Termination…
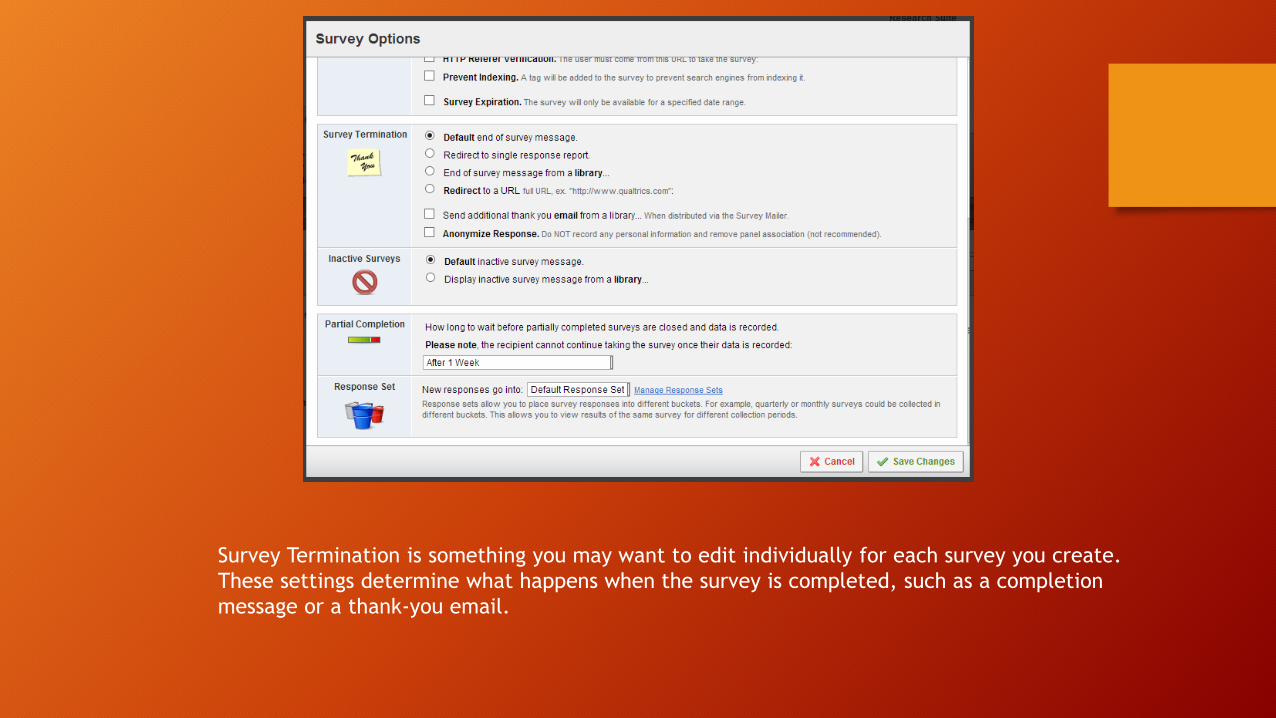
Survey Termination is something you may want to edit individually for each survey you create.
These settings determine what happens when the survey is completed, such as a completion
message or a thank-you email.
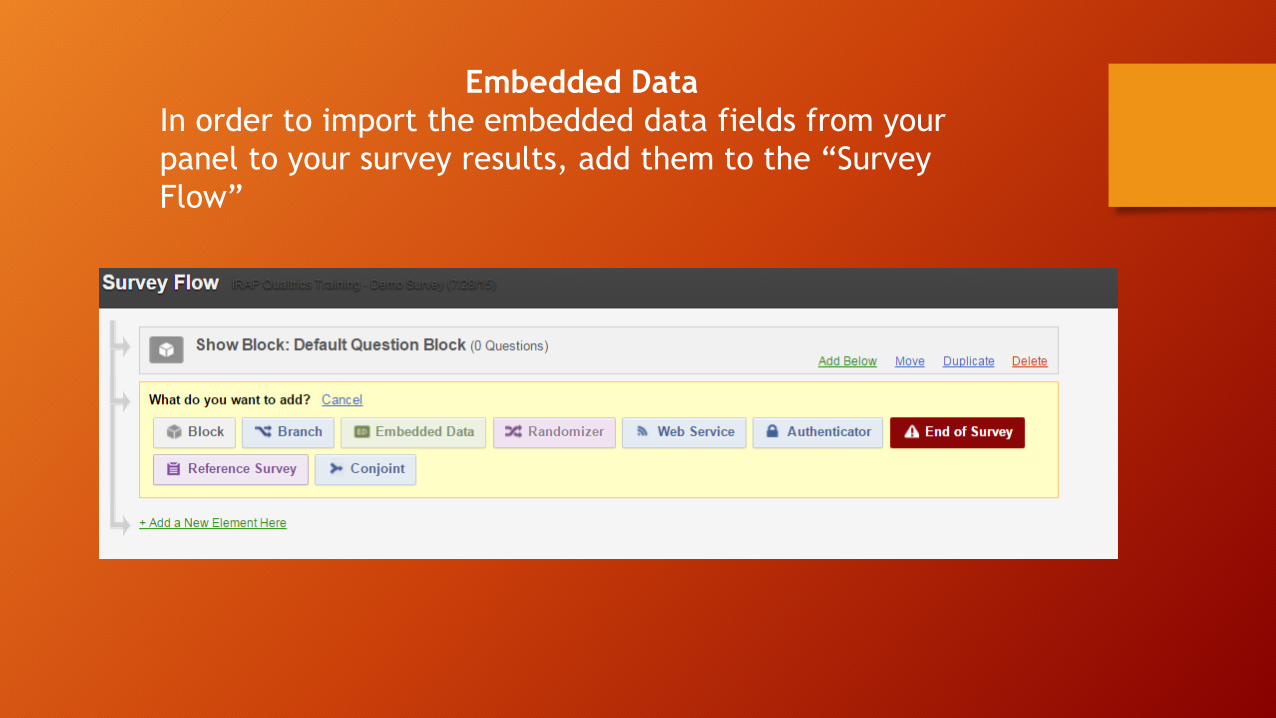
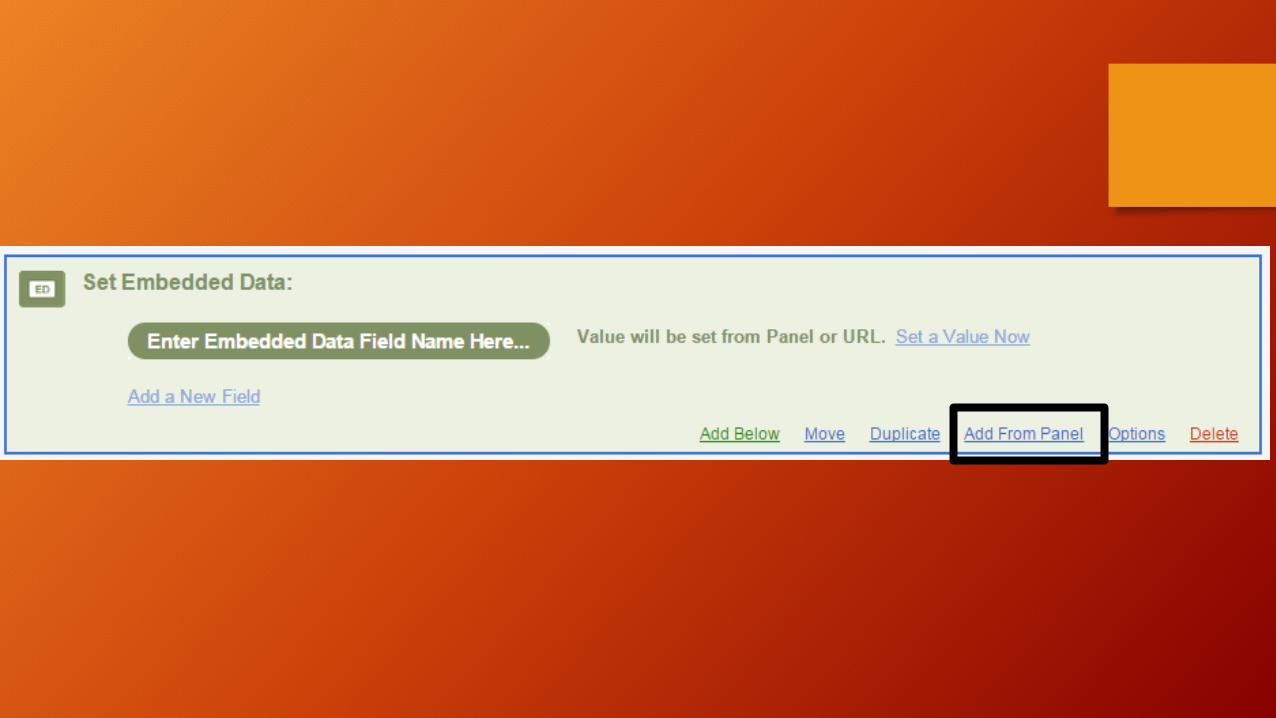
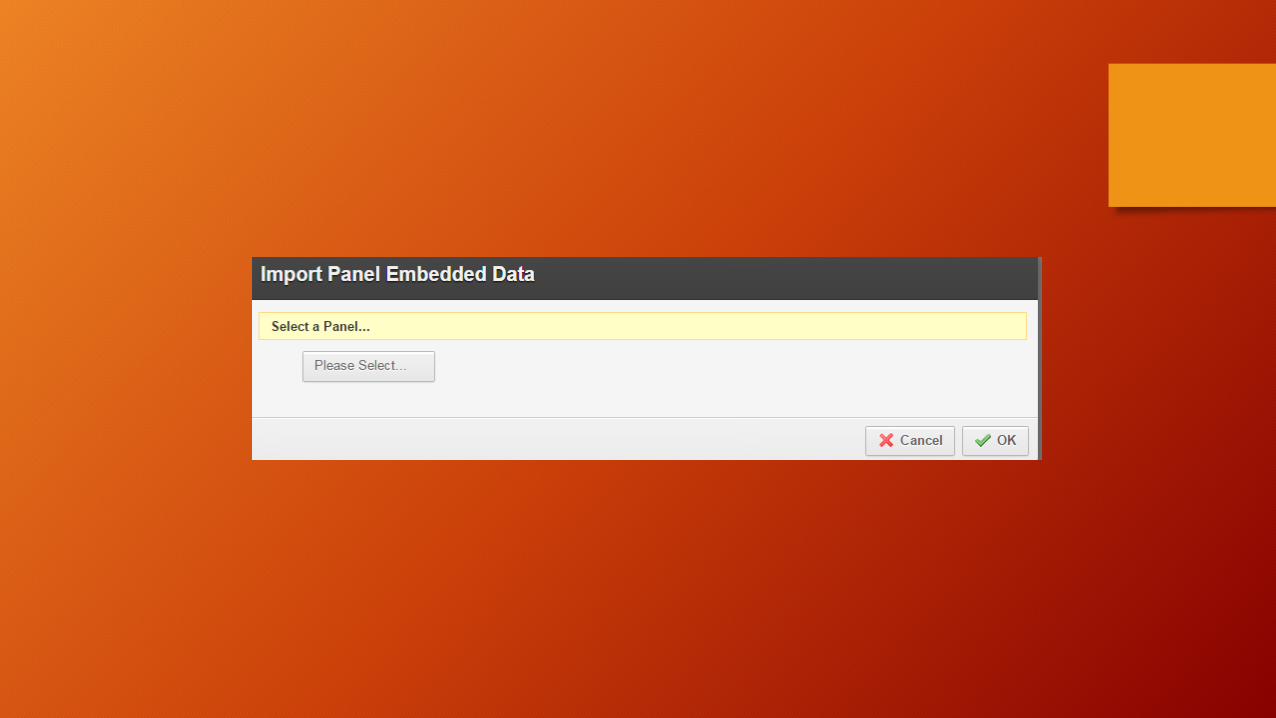
Embedded Data
In order to import the embedded data fields from your
panel to your survey results, add them to the “Survey
Flow”
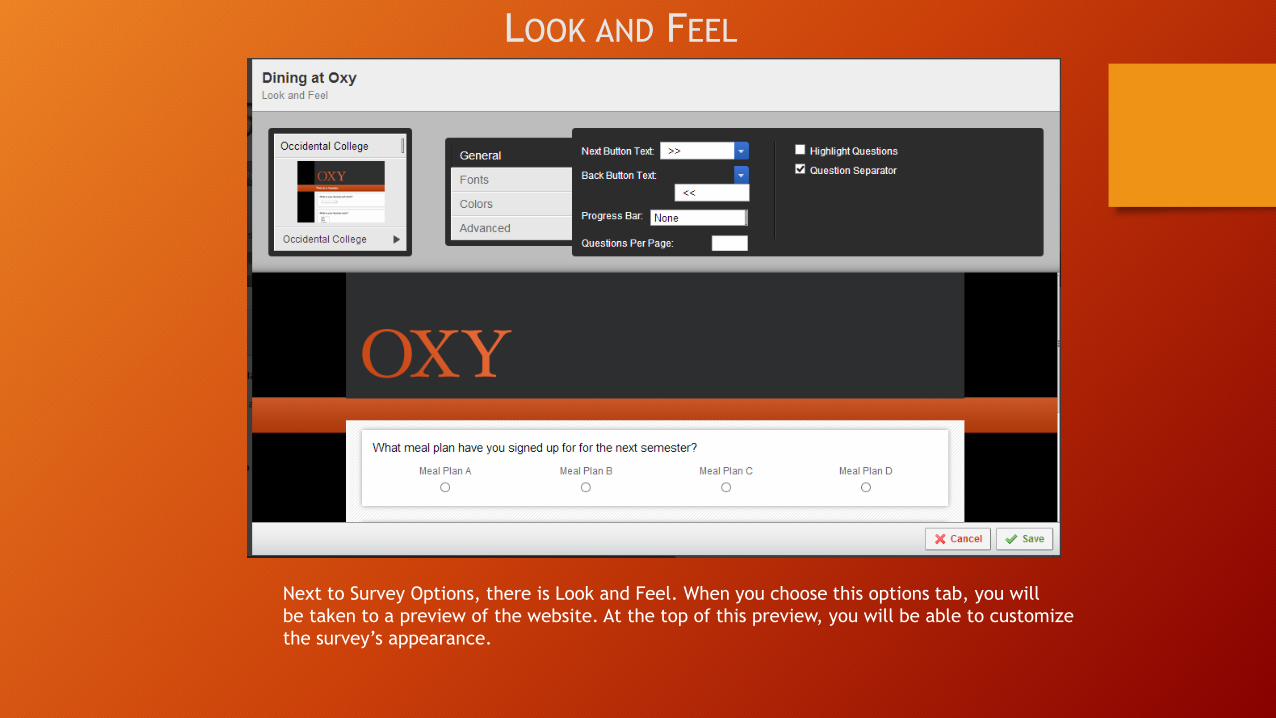
LOOK AND FEEL
Next to Survey Options, there is Look and Feel. When you choose this options tab, you will
be taken to a preview of the website. At the top of this preview, you will be able to customize
the survey’s appearance.
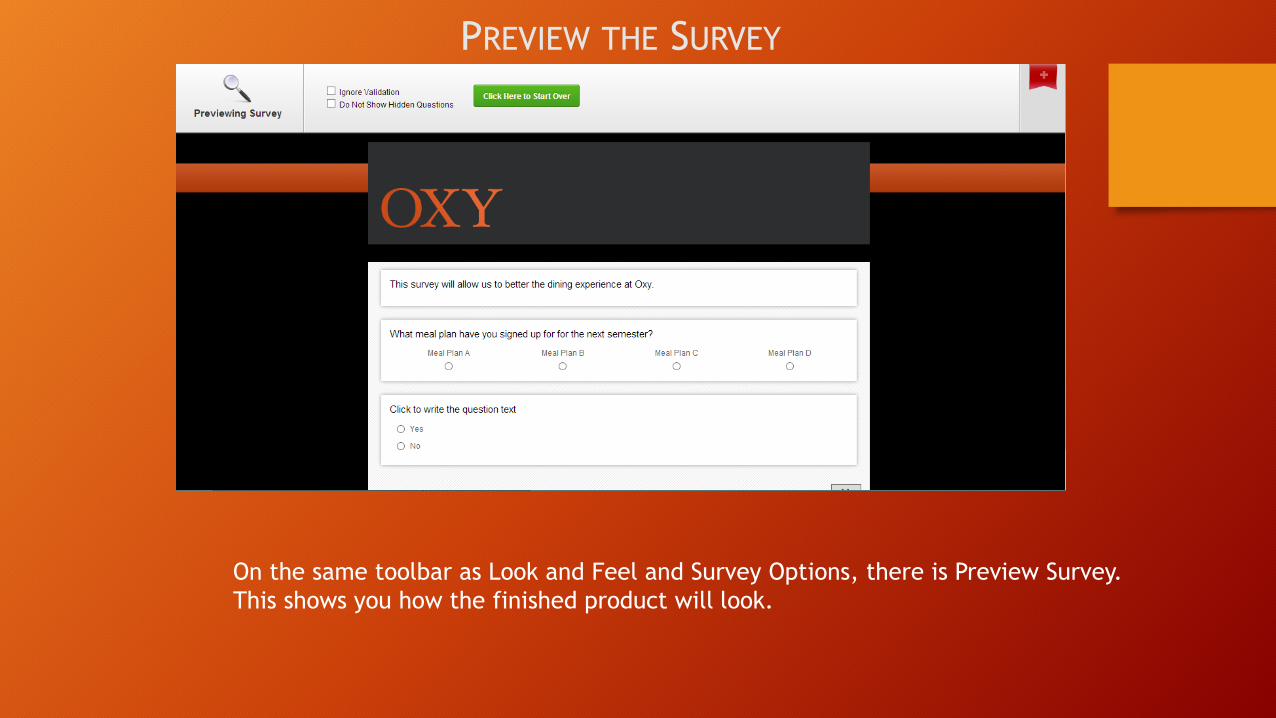
PREVIEW THE SURVEY
On the same toolbar as Look and Feel and Survey Options, there is Preview Survey.
This shows you how the finished product will look.
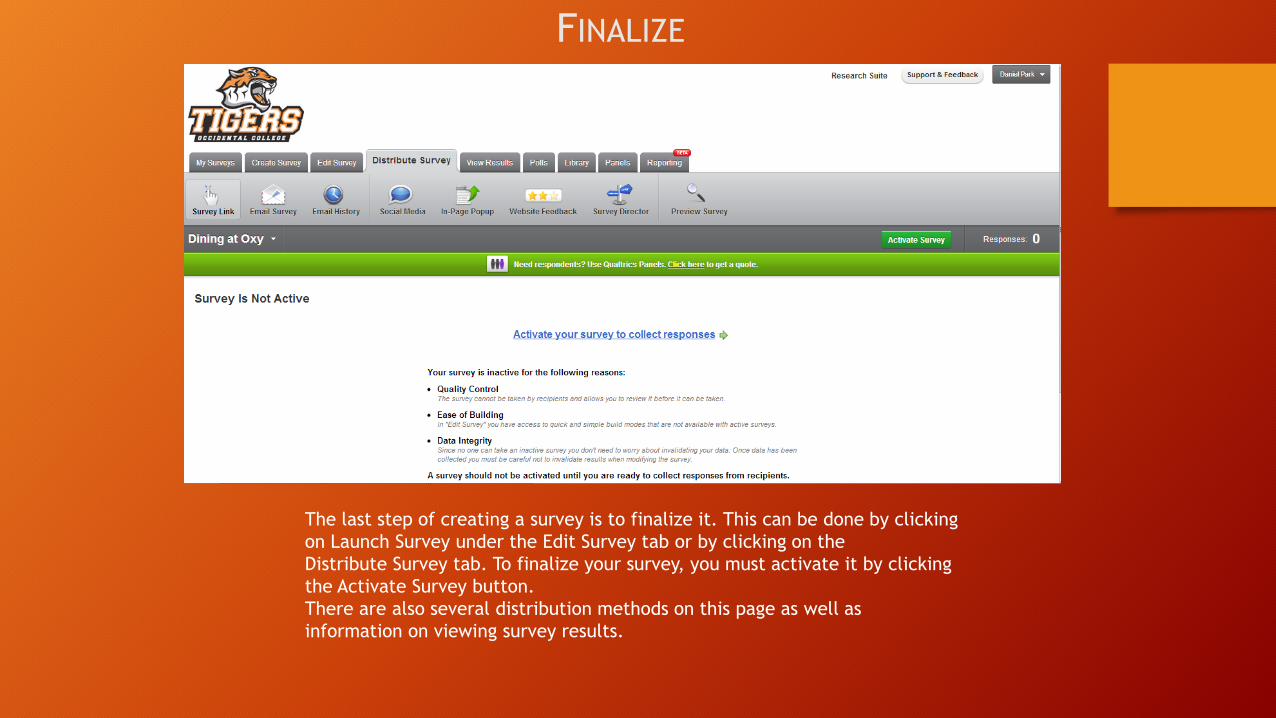
FINALIZE
The last step of creating a survey is to finalize it. This can be done by clicking
on Launch Survey under the Edit Survey tab or by clicking on the
Distribute Survey tab. To finalize your survey, you must activate it by clicking
the Activate Survey button.
There are also several distribution methods on this page as well as
information on viewing survey results.
Administration: Panel or Anonymous Link?
• Panel • Use for administering to set list of people
• Use when you want to link respondents with responses
• Use to link embedded data
• Anonymous Link • Use for sending to listservs, posting on websites, etc.
• Use when you don’t need to link respondents
• Use for anonymous data collection
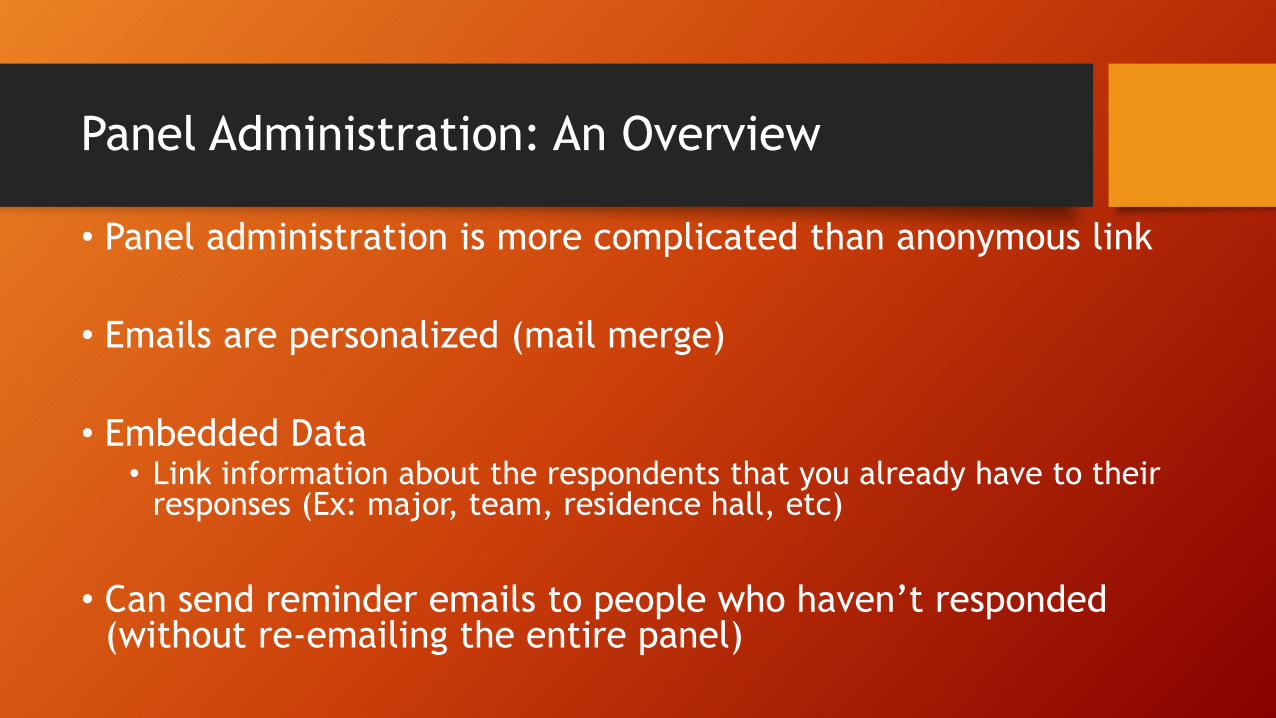
Panel Administration: An Overview
• Panel administration is more complicated than anonymous link
• Emails are personalized (mail merge)
• Embedded Data • Link information about the respondents that you already have to their
responses (Ex: major, team, residence hall, etc)
• Can send reminder emails to people who haven’t responded (without re-emailing the entire panel)
Crash Course in Stats
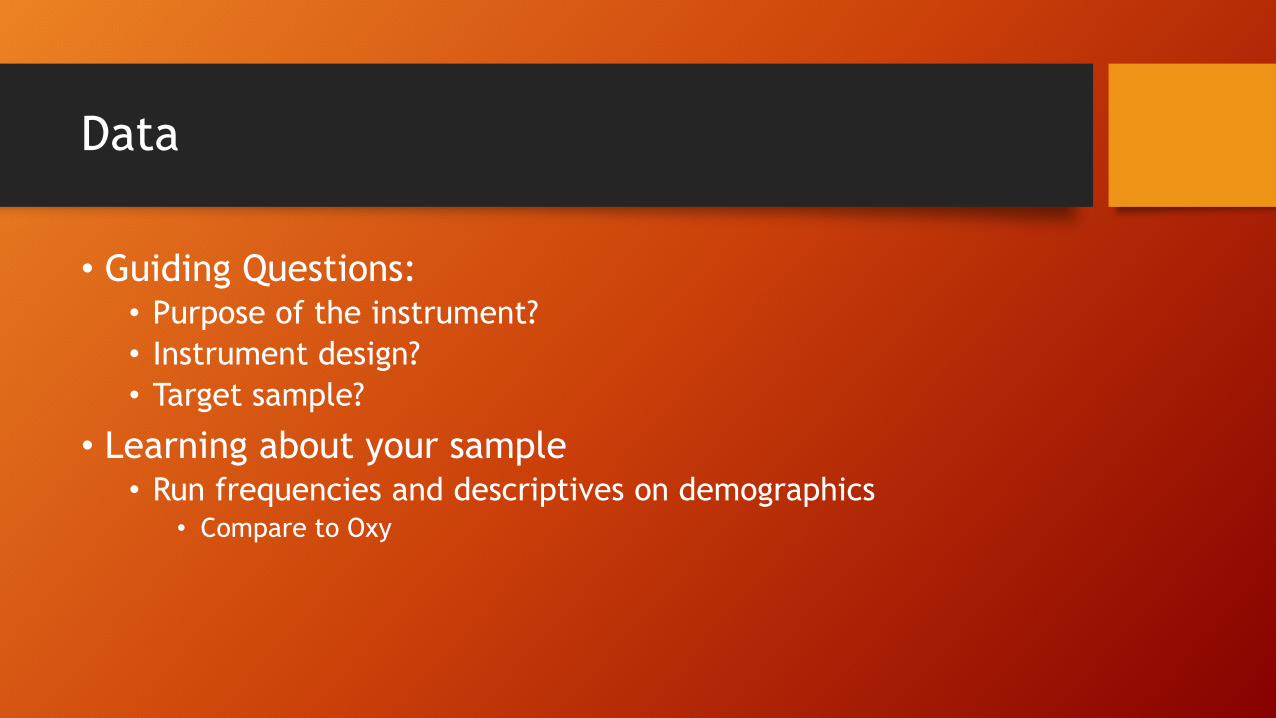
Data
• Guiding Questions: • Purpose of the instrument?
• Instrument design?
• Target sample?
• Learning about your sample • Run frequencies and descriptives on demographics
• Compare to Oxy
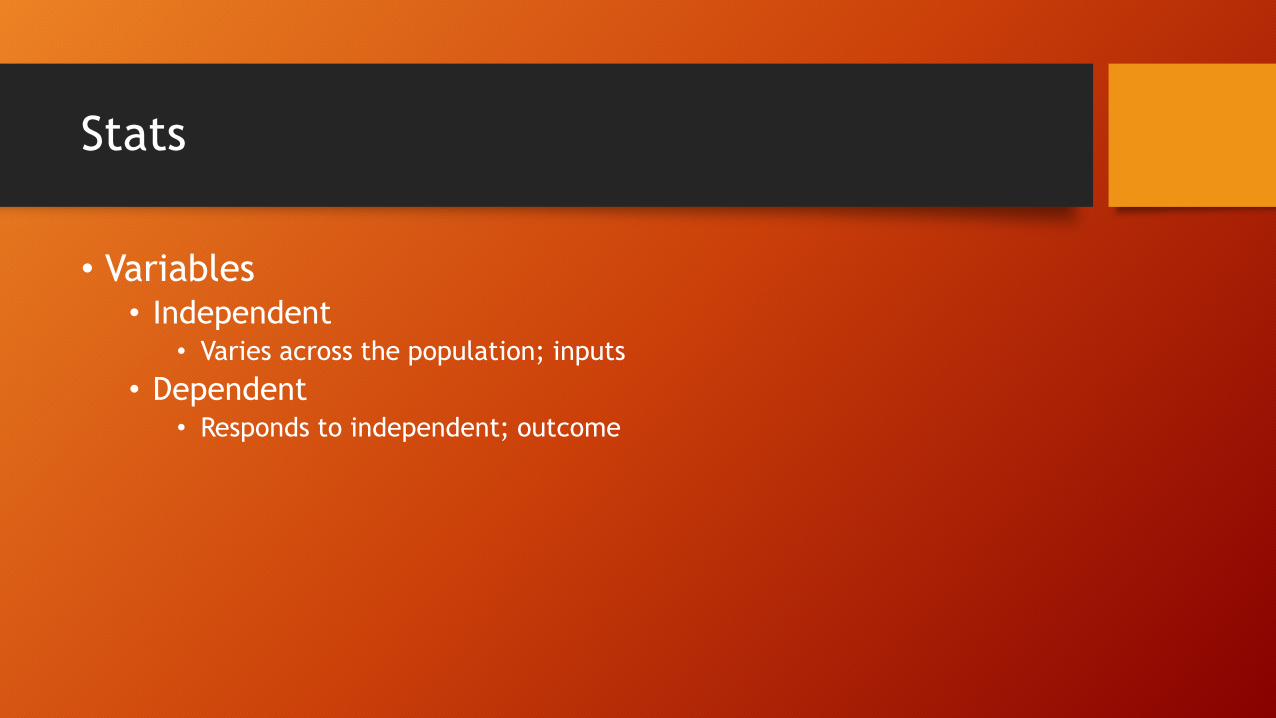
Stats
• Variables • Independent
• Varies across the population; inputs
• Dependent • Responds to independent; outcome
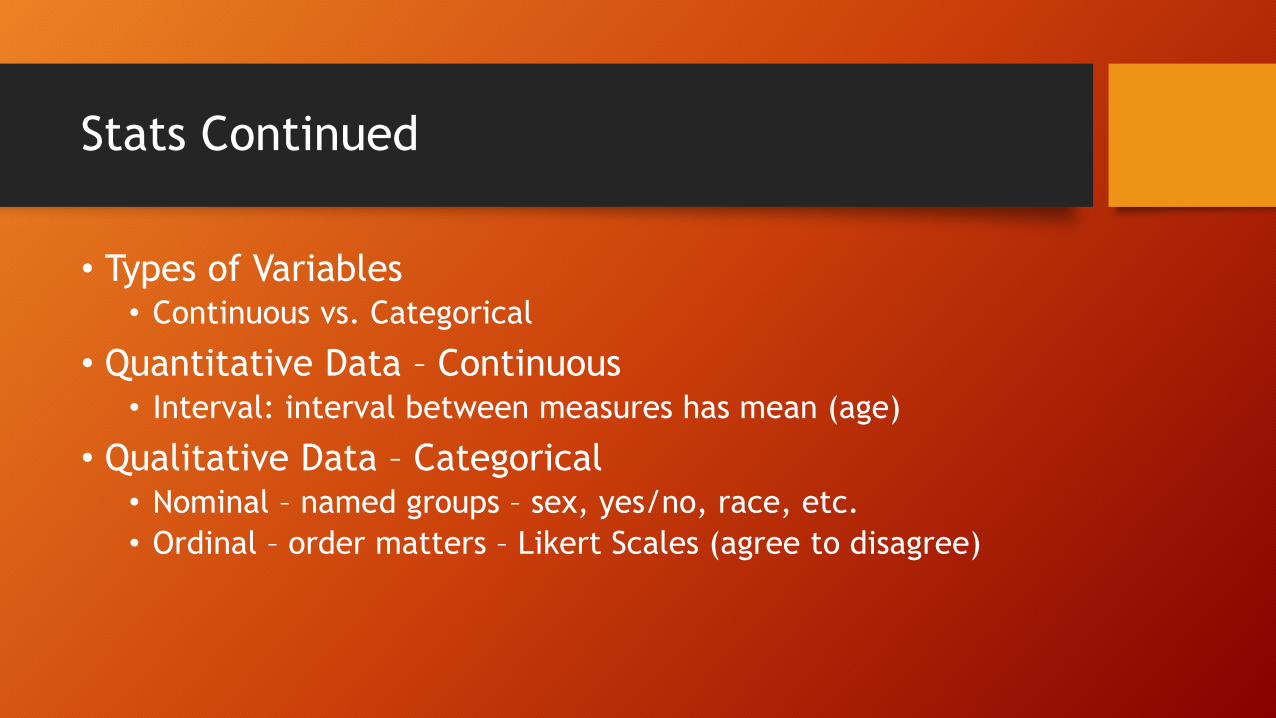
Stats Continued
• Types of Variables • Continuous vs. Categorical
• Quantitative Data – Continuous • Interval: interval between measures has mean (age)
• Qualitative Data – Categorical • Nominal – named groups – sex, yes/no, race, etc.
• Ordinal – order matters – Likert Scales (agree to disagree)
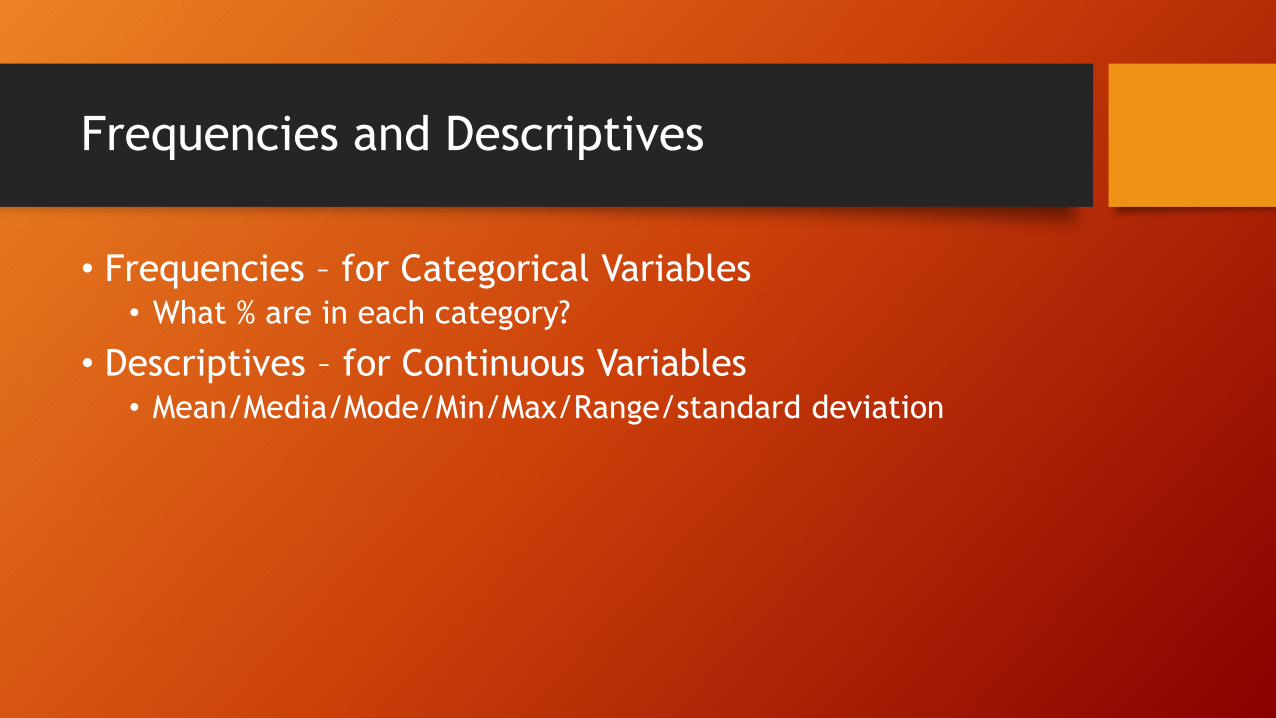
Frequencies and Descriptives
• Frequencies – for Categorical Variables • What % are in each category?
• Descriptives – for Continuous Variables • Mean/Media/Mode/Min/Max/Range/standard deviation
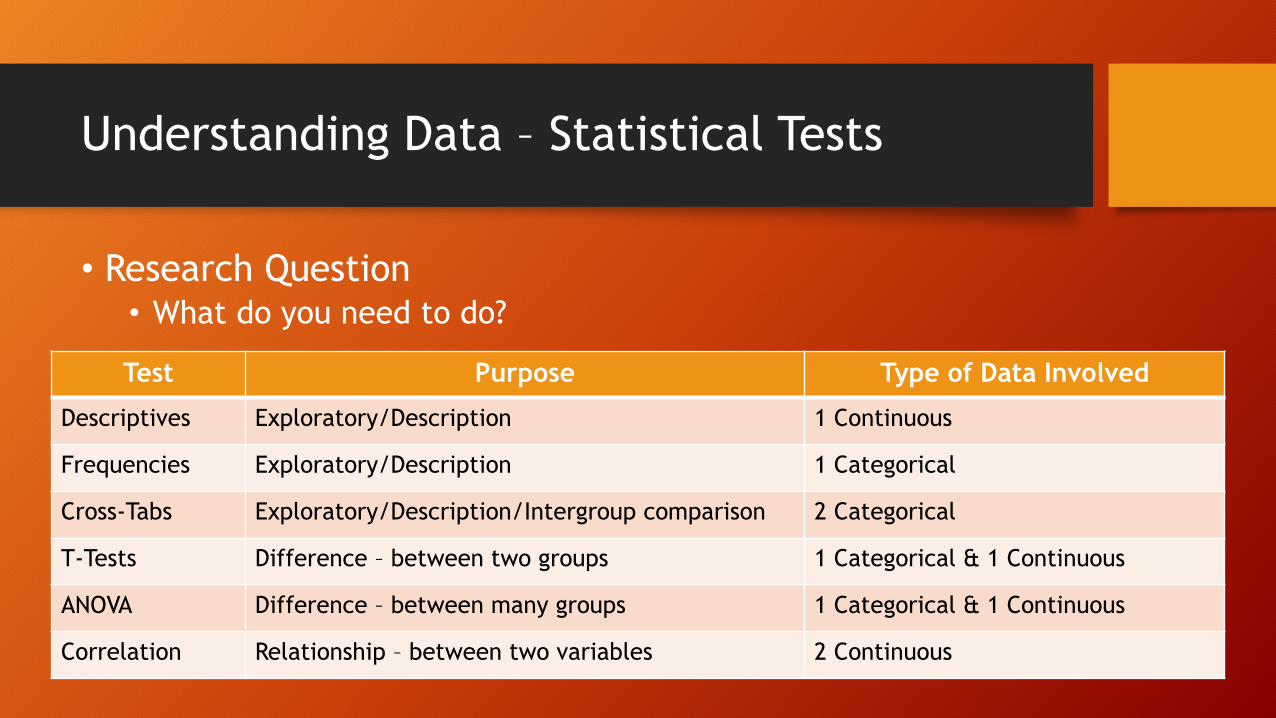
Understanding Data – Statistical Tests
• Research Question • What do you need to do?
Test Purpose Type of Data Involved
Descriptives Exploratory/Description 1 Continuous
Frequencies Exploratory/Description 1 Categorical
Cross-Tabs Exploratory/Description/Intergroup comparison 2 Categorical
T-Tests Difference – between two groups 1 Categorical & 1 Continuous
ANOVA Difference – between many groups 1 Categorical & 1 Continuous
Correlation Relationship – between two variables 2 Continuous
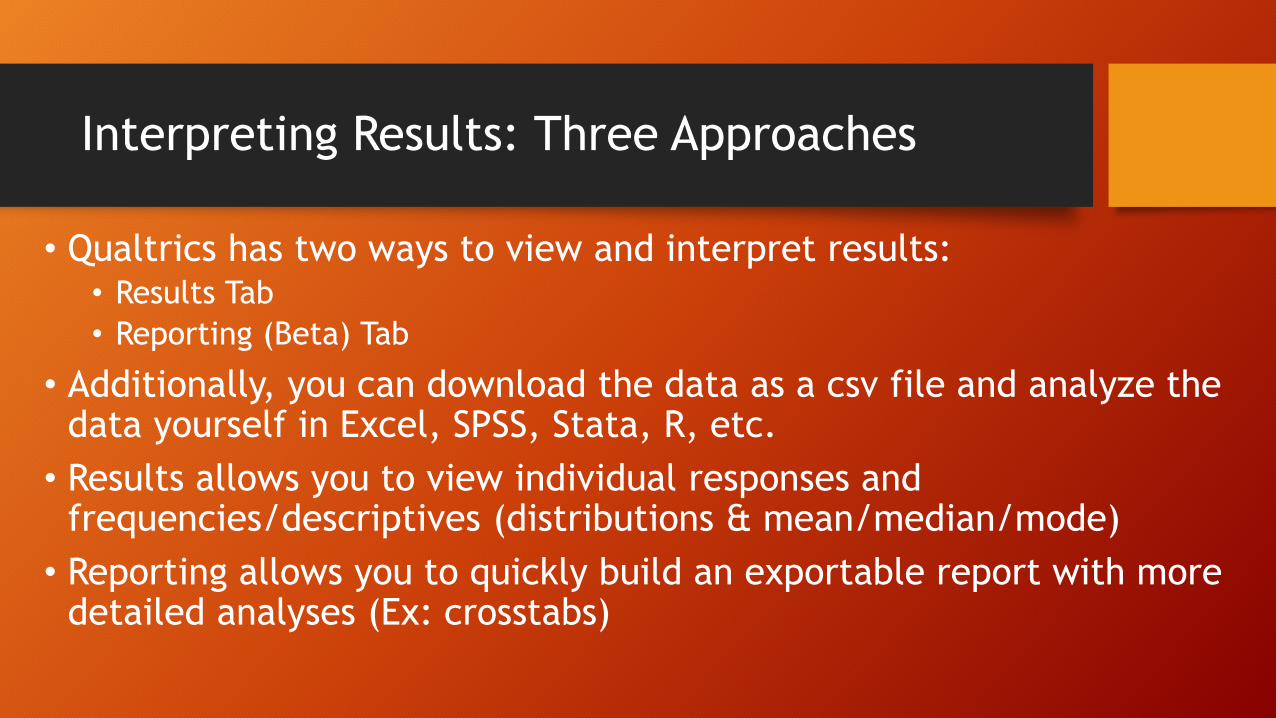
Interpreting Results: Three Approaches
• Qualtrics has two ways to view and interpret results: • Results Tab
• Reporting (Beta) Tab
• Additionally, you can download the data as a csv file and analyze the data yourself in Excel, SPSS, Stata, R, etc.
• Results allows you to view individual responses and frequencies/descriptives (distributions & mean/median/mode)
• Reporting allows you to quickly build an exportable report with more detailed analyses (Ex: crosstabs)
Reporting Using Qualtrics
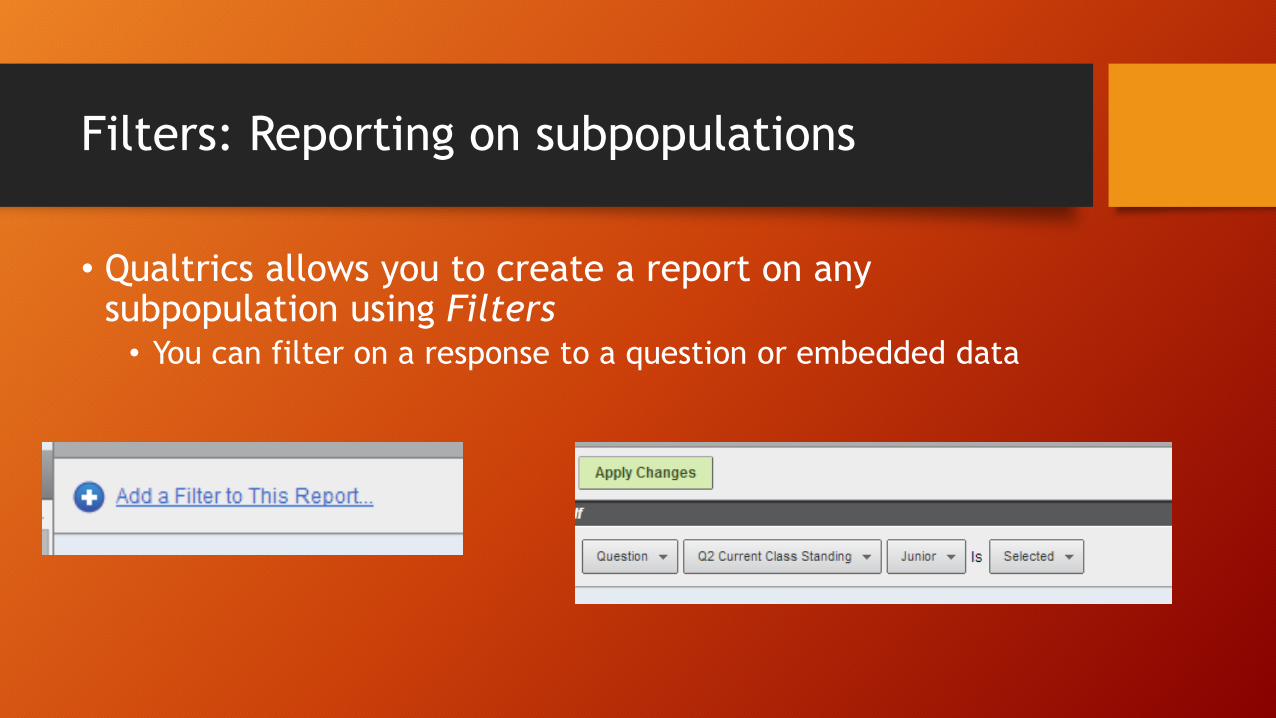
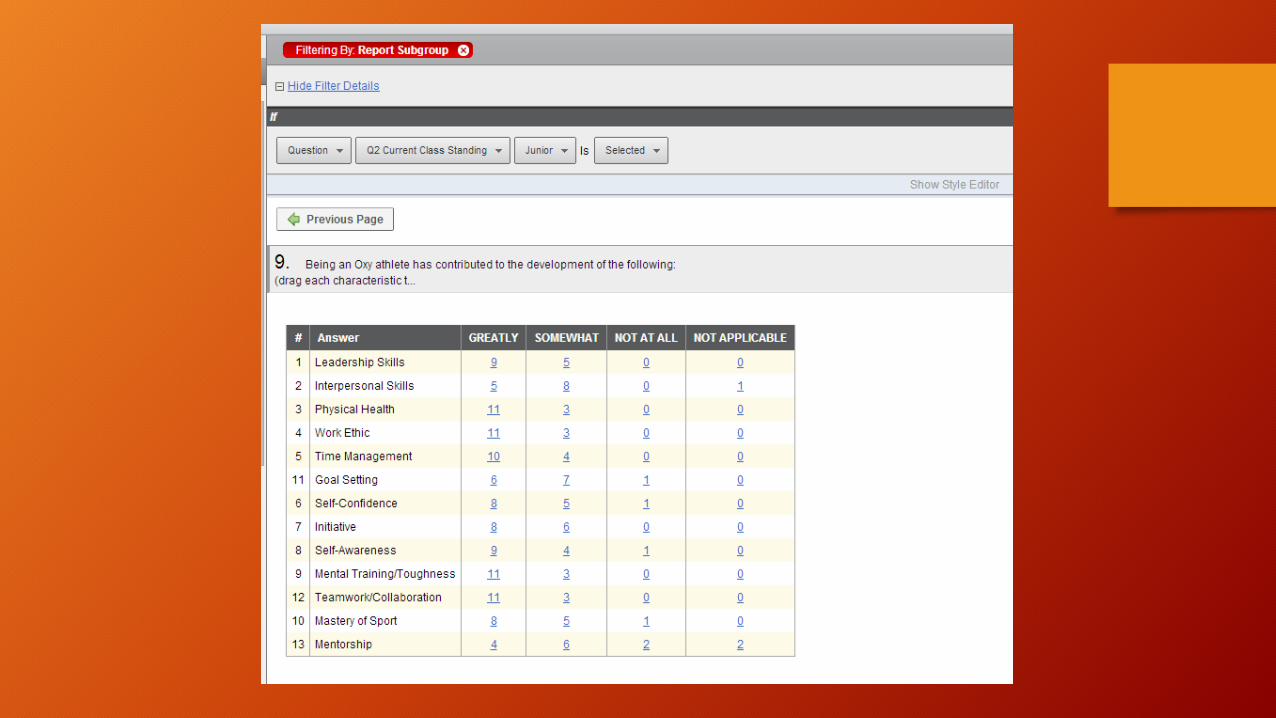
Filters: Reporting on subpopulations
• Qualtrics allows you to create a report on any subpopulation using Filters • You can filter on a response to a question or embedded data
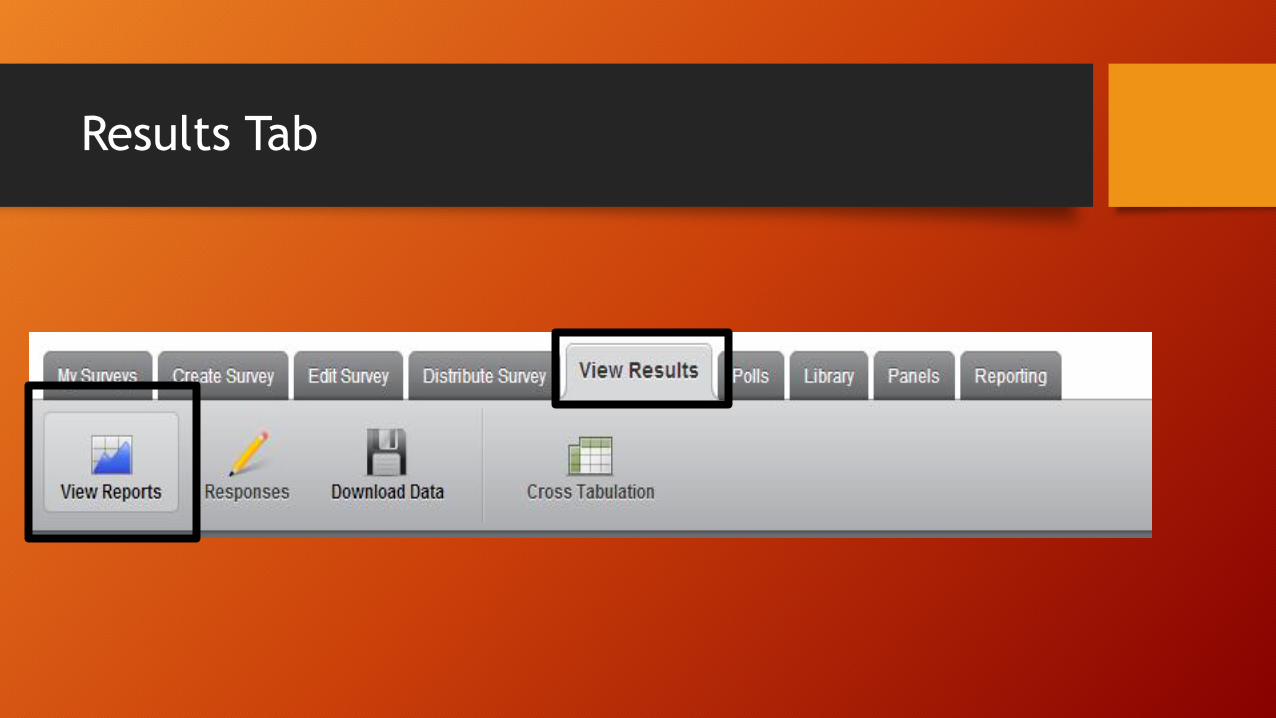
Results Tab
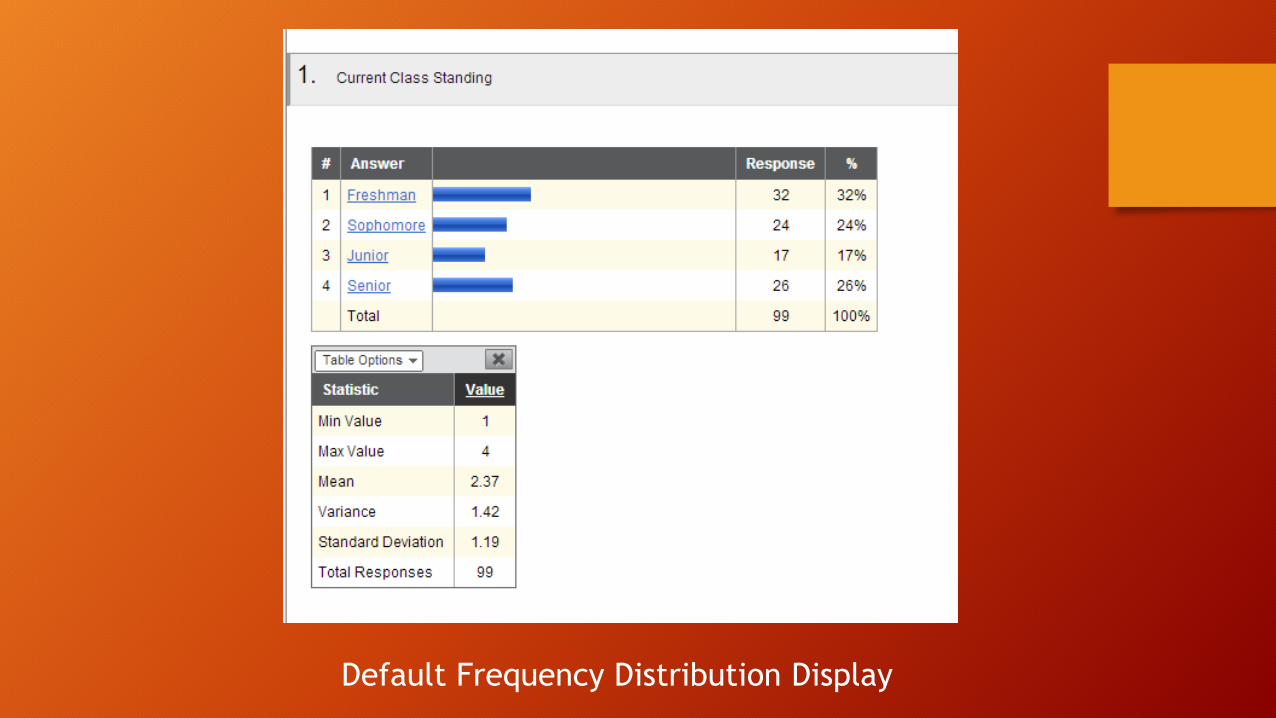
Default Frequency Distribution Display
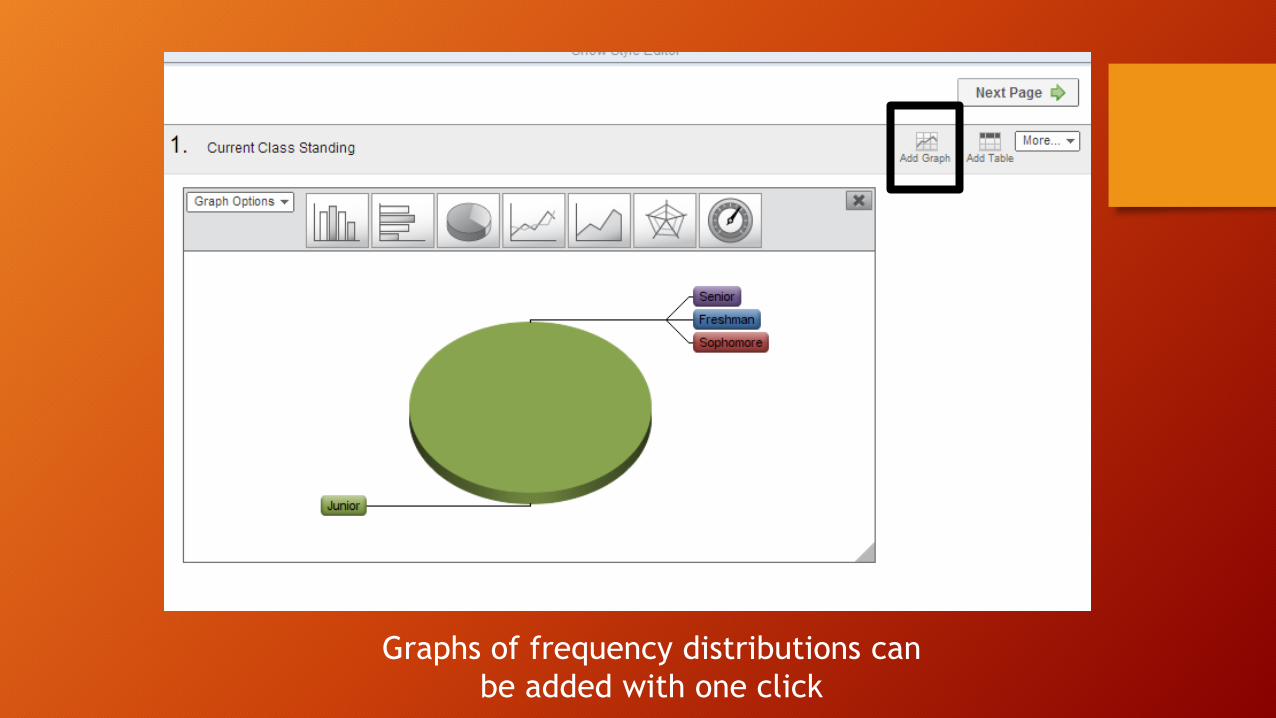
Graphs of frequency distributions can
be added with one click
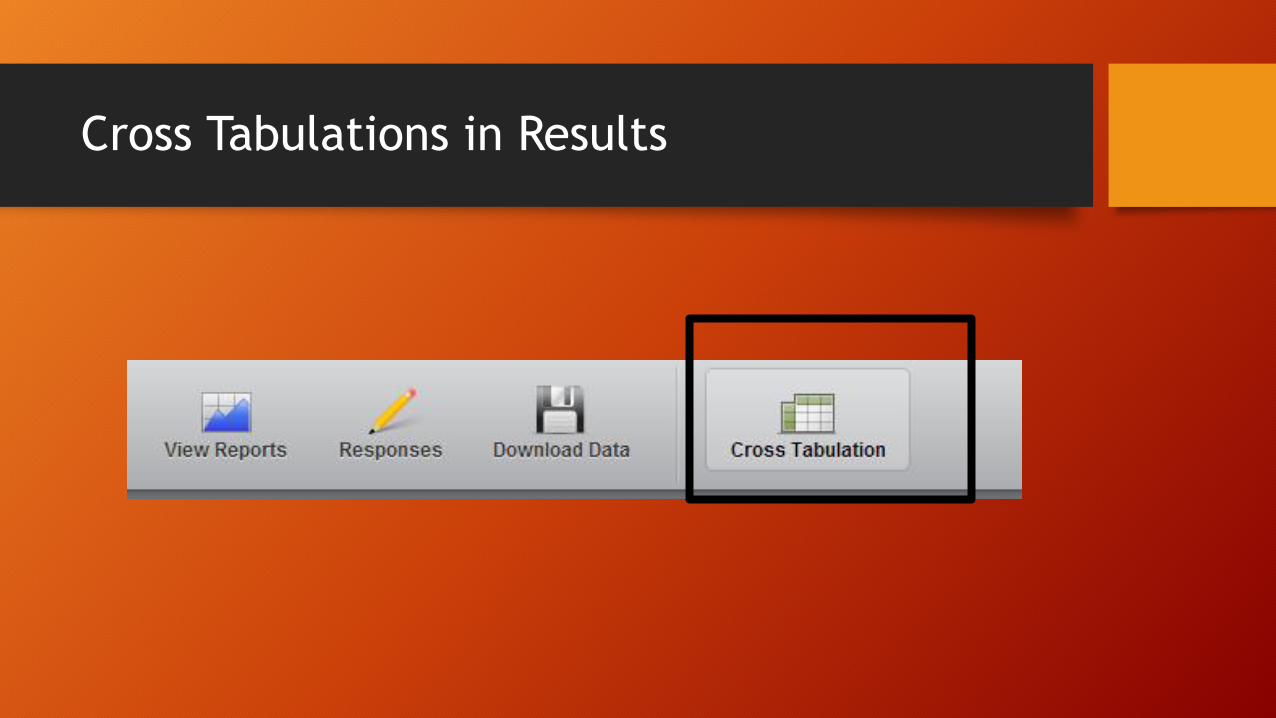
Cross Tabulations in Results
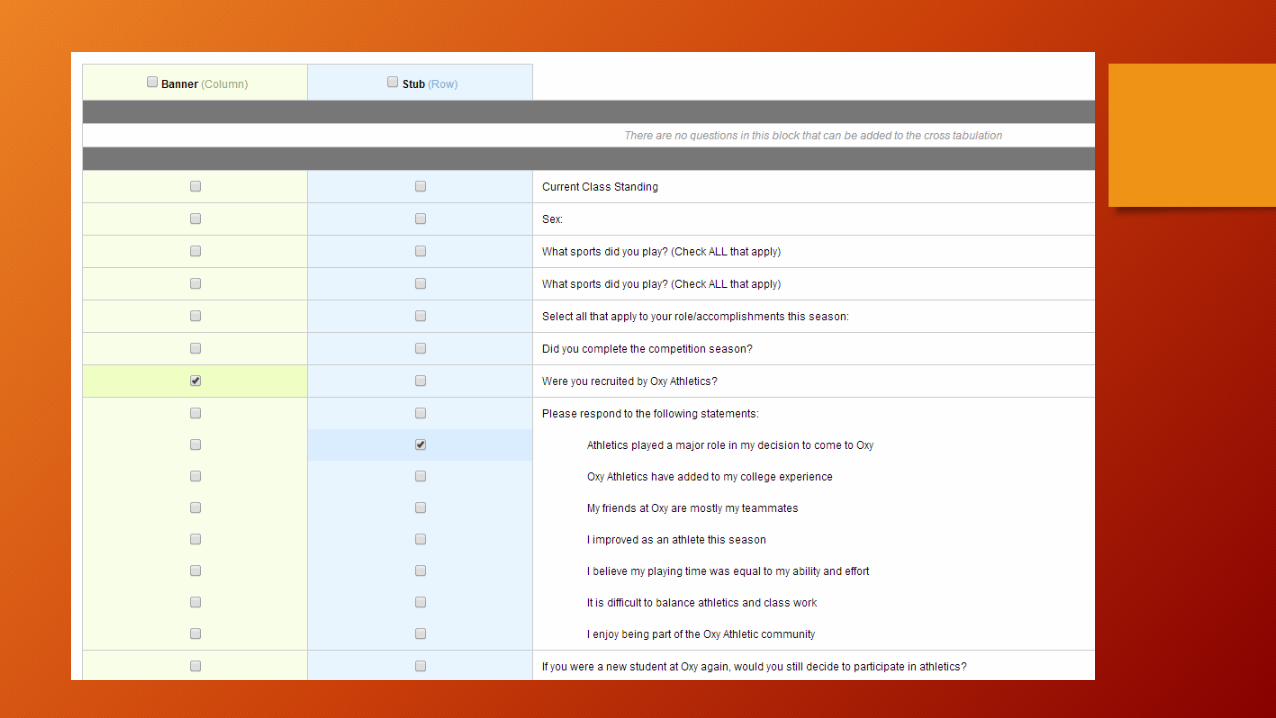
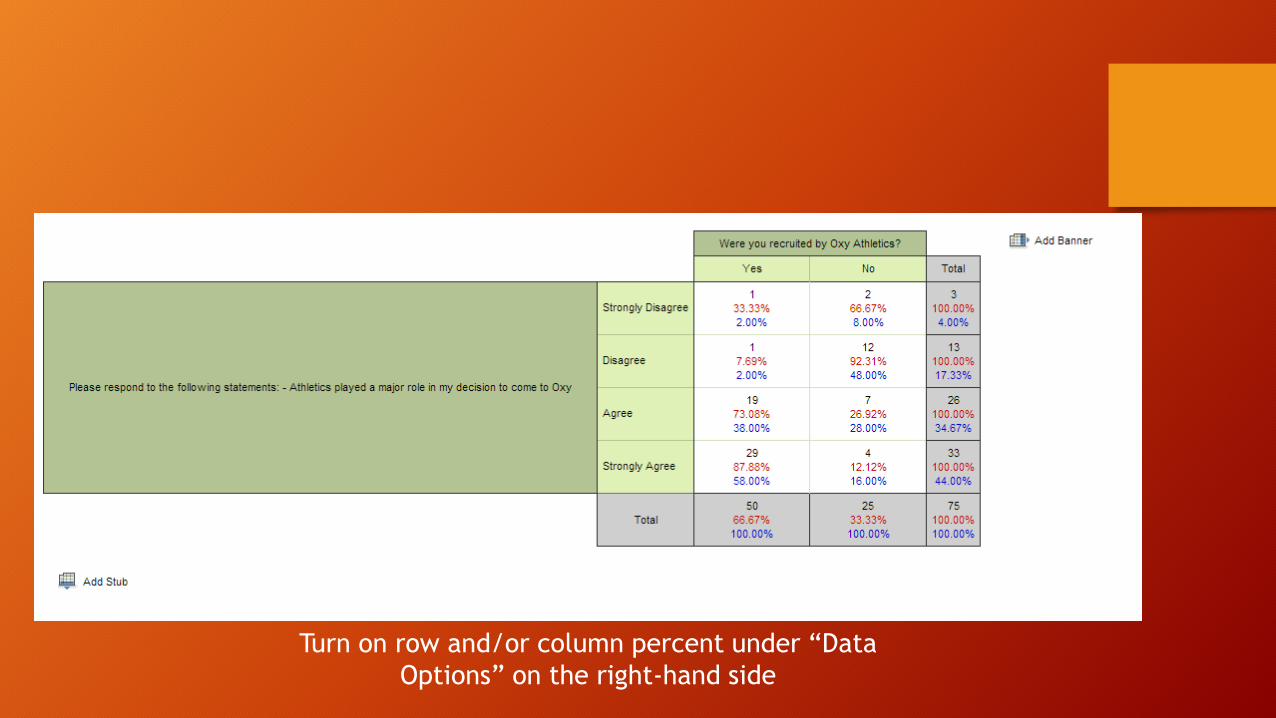
Turn on row and/or column percent under “Data
Options” on the right-hand side
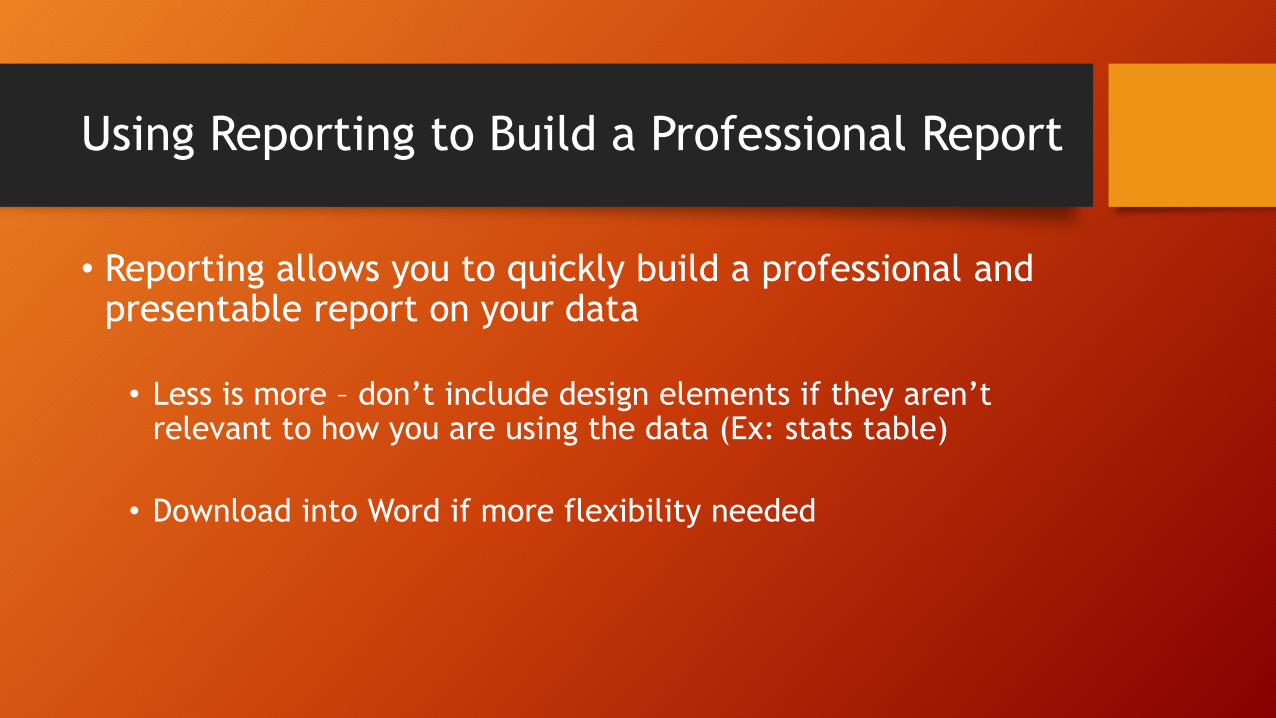
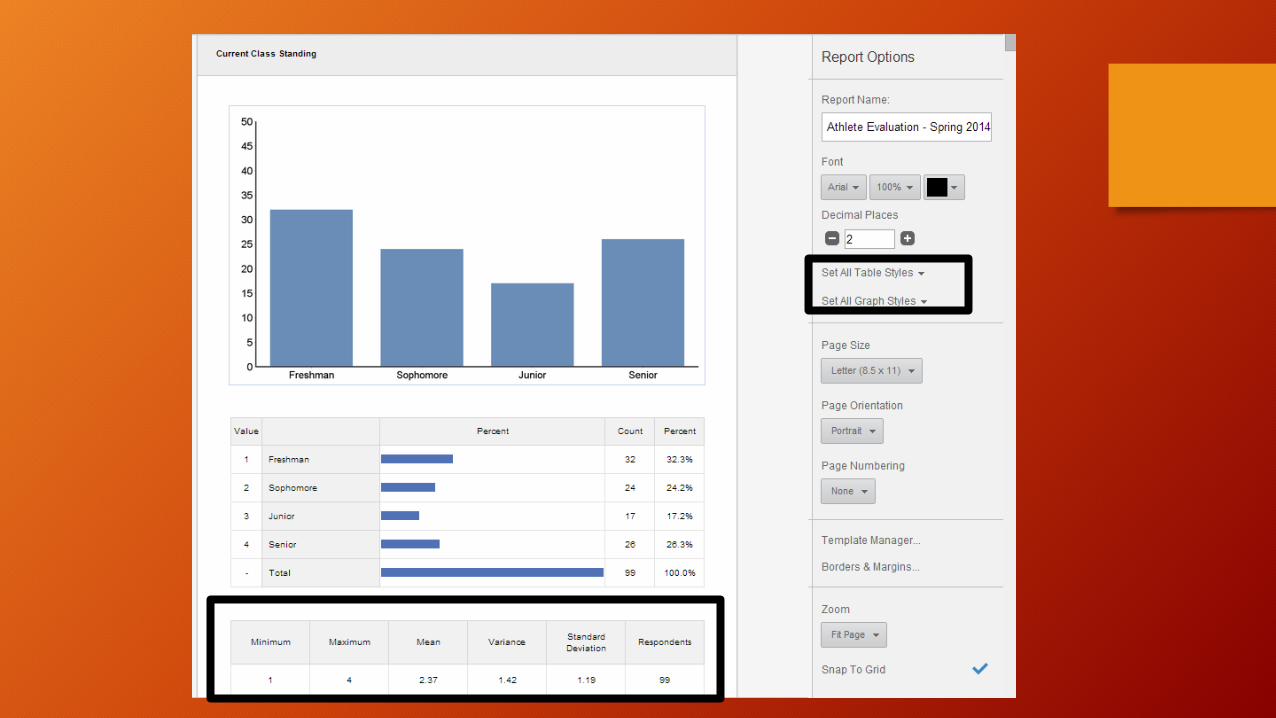
Using Reporting to Build a Professional Report
• Reporting allows you to quickly build a professional and presentable report on your data
• Less is more – don’t include design elements if they aren’t relevant to how you are using the data (Ex: stats table)
• Download into Word if more flexibility needed
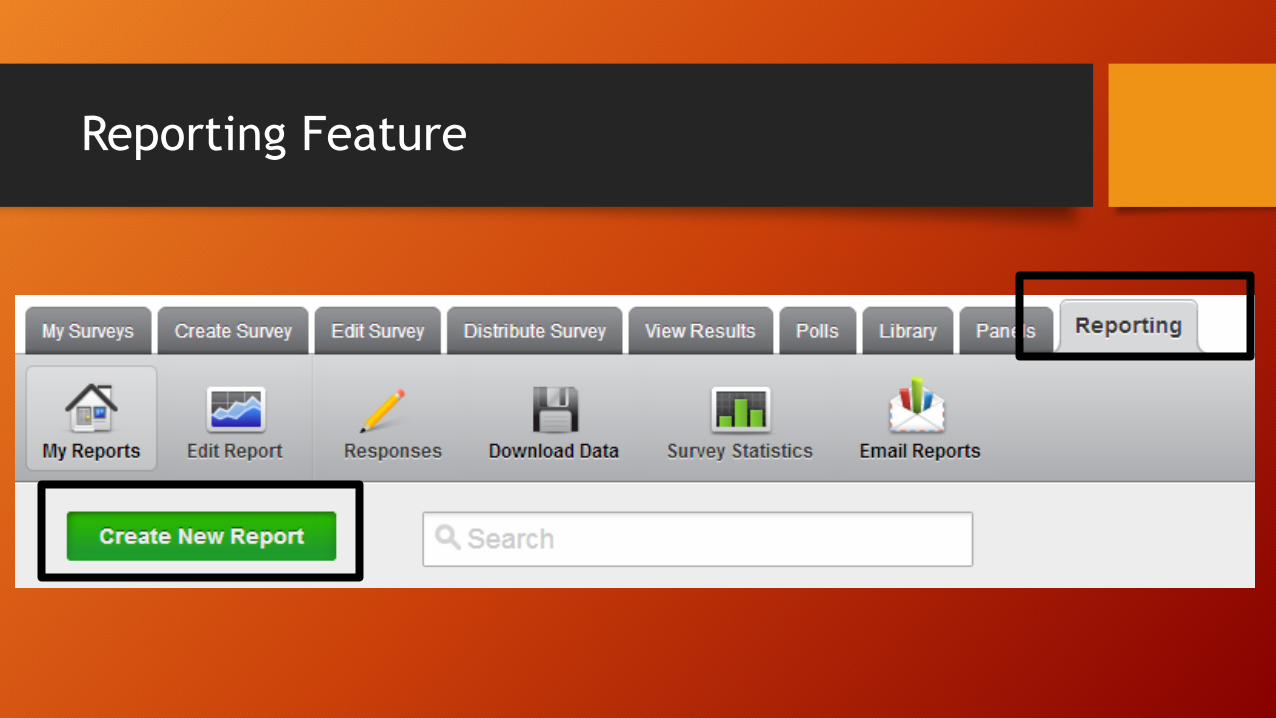
Reporting Feature
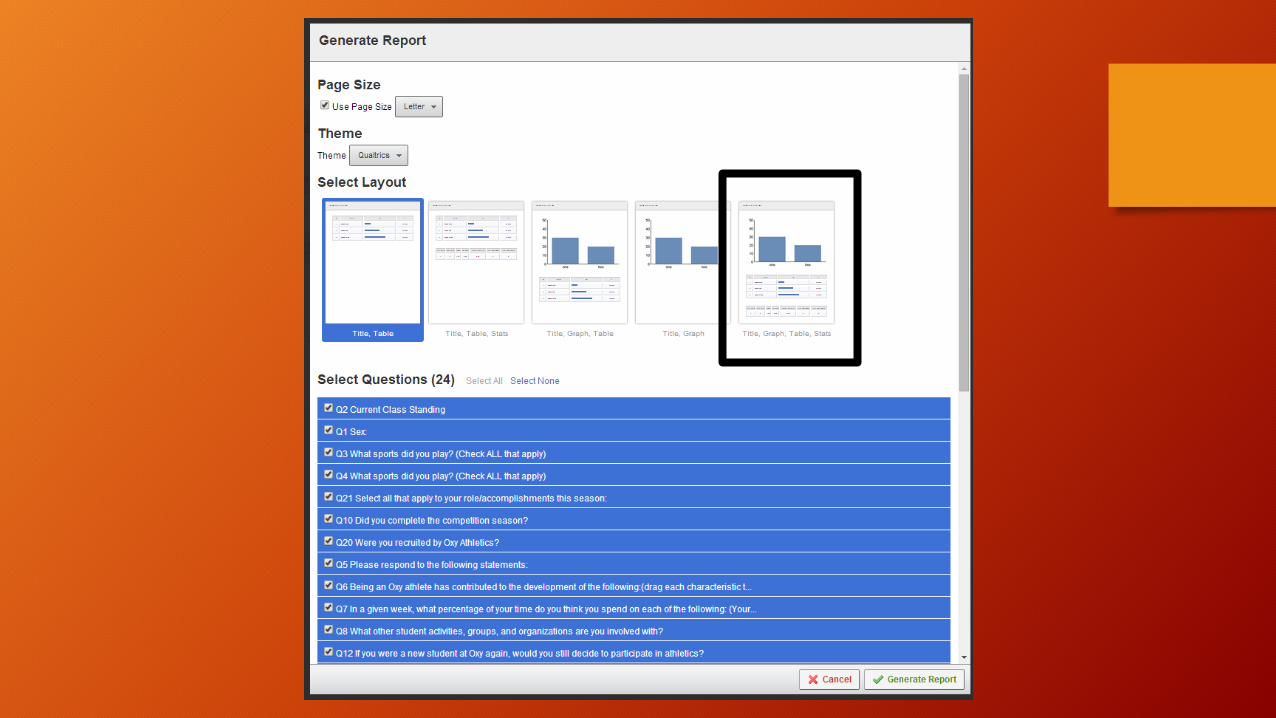
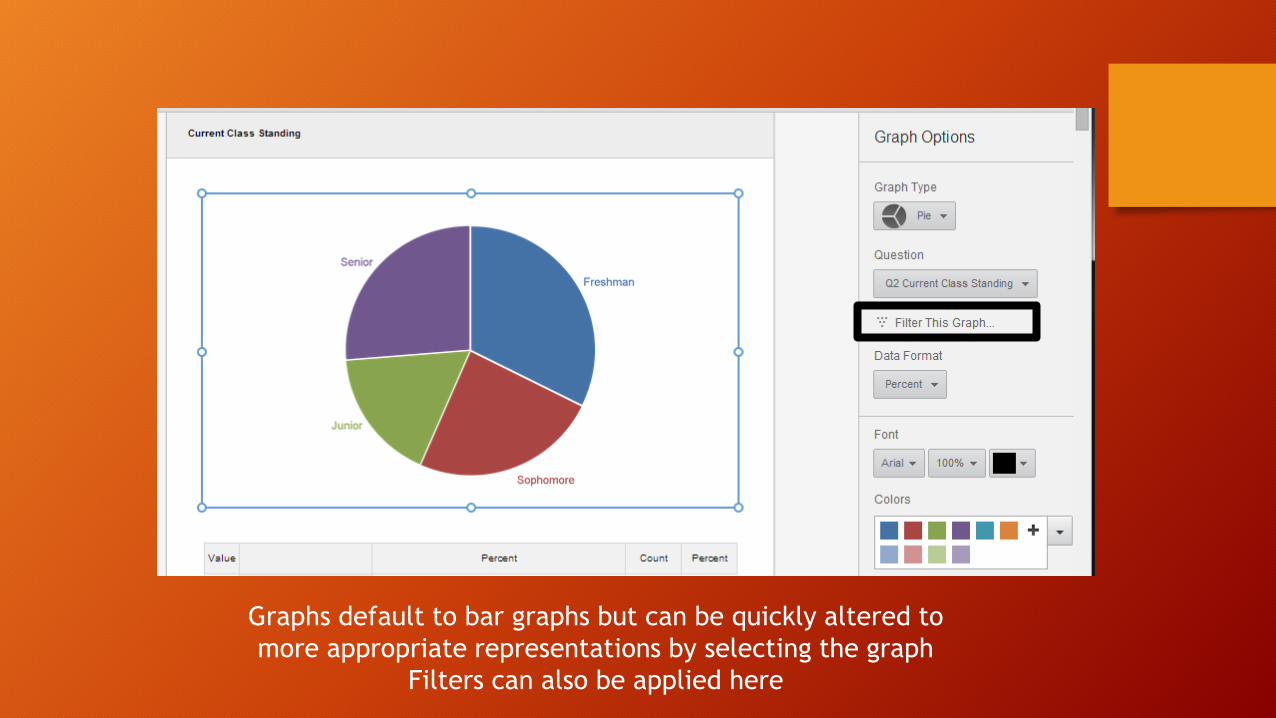
Graphs default to bar graphs but can be quickly altered to
more appropriate representations by selecting the graph
Filters can also be applied here
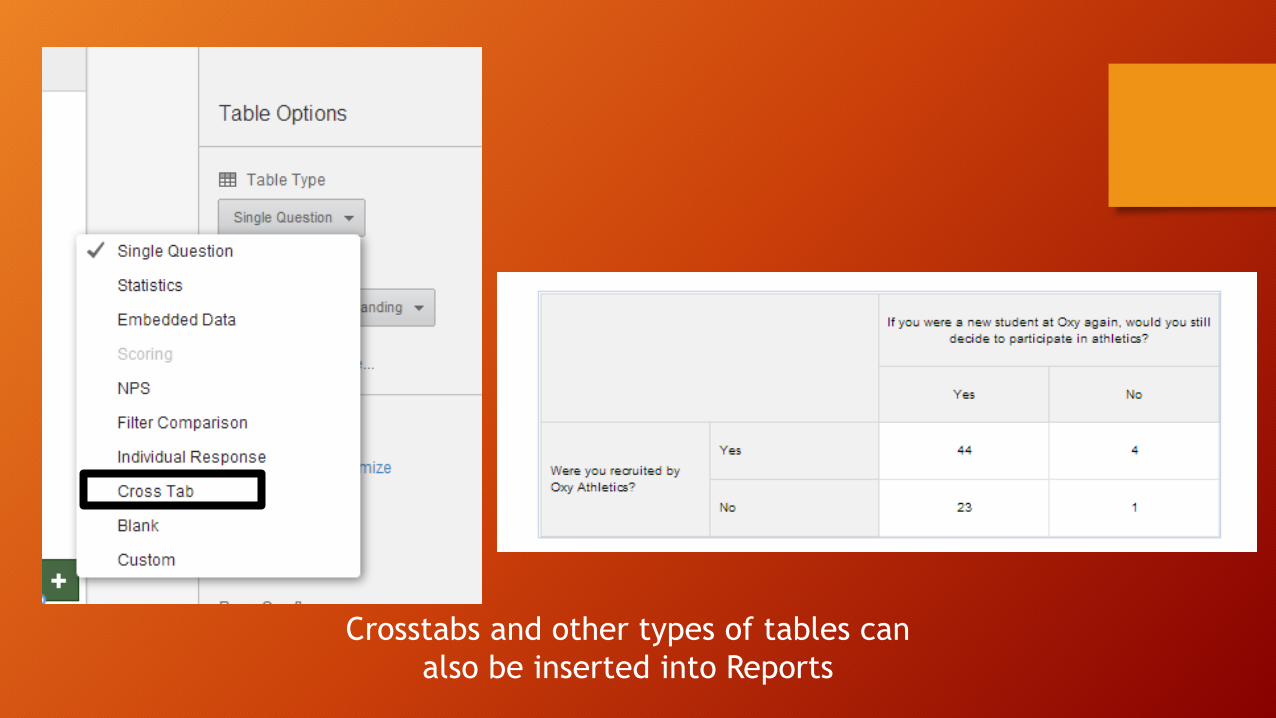
Crosstabs and other types of tables can
also be inserted into Reports
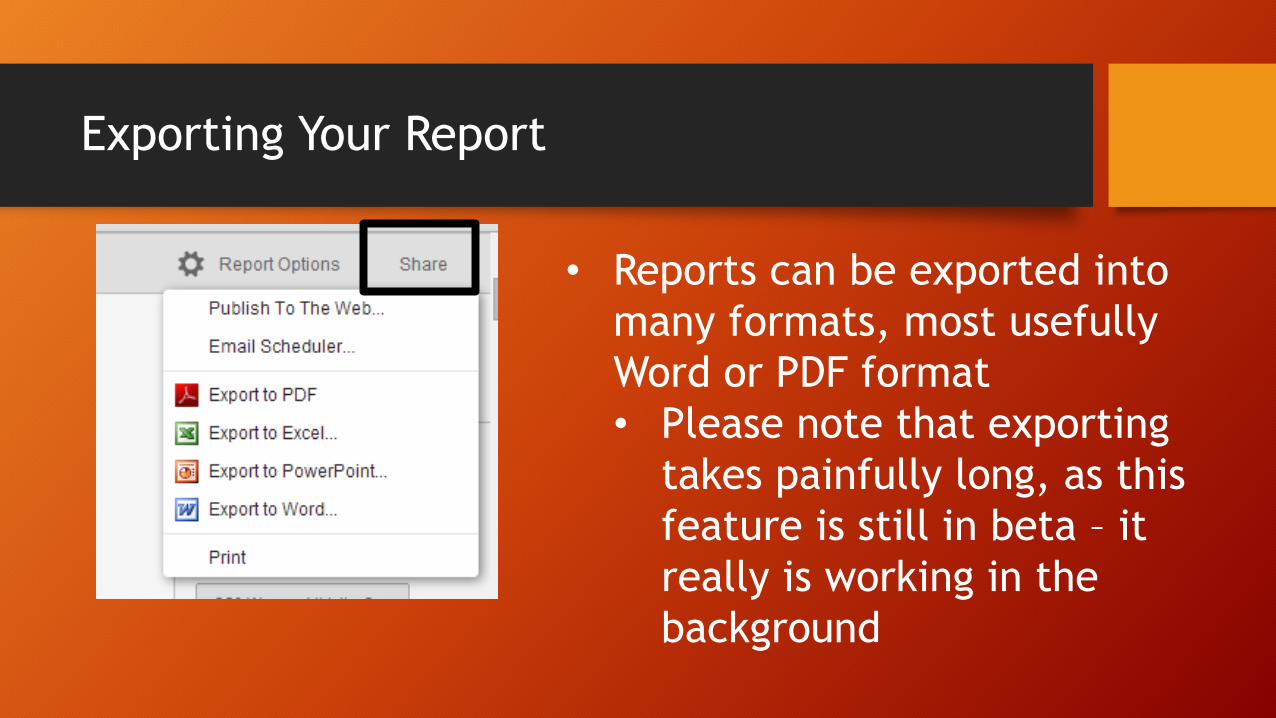
Exporting Your Report
• Reports can be exported into
many formats, most usefully
Word or PDF format
• Please note that exporting
takes painfully long, as this
feature is still in beta – it
really is working in the
background
Paths for Further Analysis
• Download data from Qualtrics – Excel, SPSS, etc. • Data cleanup
• Analysis for missingness • Subgroup weighting
• ANOVA, Regression, multi-level crosstabs, t-tests, correlations