surveillance report #87 apparent per … the presentation of significance tests, or confidence...
TRANSCRIPT
National Institute on Alcohol Abuse and Alcoholism Division of Epidemiology and Prevention Research Alcohol Epidemiologic Data System
SURVEILLANCE REPORT #87
APPARENT PER CAPITA ALCOHOL CONSUMPTION: NATIONAL, STATE, AND REGIONAL TRENDS, 1977–2007
Robin A. LaVallee, B.A. Gerald D. Williams, D.Ed. Hsiao-ye Yi, Ph.D.
CSR, Incorporated1
Suite 1000 2107 Wilson Boulevard Arlington, VA 22201
September 2009
U.S. Department of Health and Human Services Public Health Service National Institutes of Health
1 CSR, Incorporated, operates the Alcohol Epidemiologic Data System (AEDS) under Contract No. HHSN267200800023C for the Division of Epidemiology and Prevention Research, National Institute on Alcohol Abuse and Alcoholism (NIAAA). Dr. Rosalind A. Breslow serves as NIAAA Project Officer on the contract and oversaw the preparation of this report.

(Blank page)
HIGHLIGHTS
This surveillance report on 1977–2007 apparent per capita alcohol consumption in the United States is the 23rd in a series of consumption reports produced annually by the National Institute on Alcohol Abuse and Alcoholism (NIAAA). Findings are based on alcoholic beverage sales data, either collected directly by the Alcohol Epidemiologic Data System (AEDS) from the States or provided by beverage industry sources. Population data provided by the U.S. Census Bureau are used as denominators to calculate per capita rates.
The following are highlights from the current report, which updates consumption trends through 2007: • United States per capita consumption of ethanol from all alcoholic beverages combined in 2007 was
2.31 gallons, representing a 1.8 percent increase from 2.27 gallons in 2006. The increase is due to the increase in per capita consumption of spirits (from 0.71 to 0.73 gallons ethanol), beer (from 1.19 to 1.21 gallons ethanol), and wine (from 0.37 to 0.38 gallons ethanol).
• Between 2006 and 2007, changes in overall per capita consumption of ethanol included increases in 40 States and the District of Columbia, decreases in 8 States, and no change in 2 States.
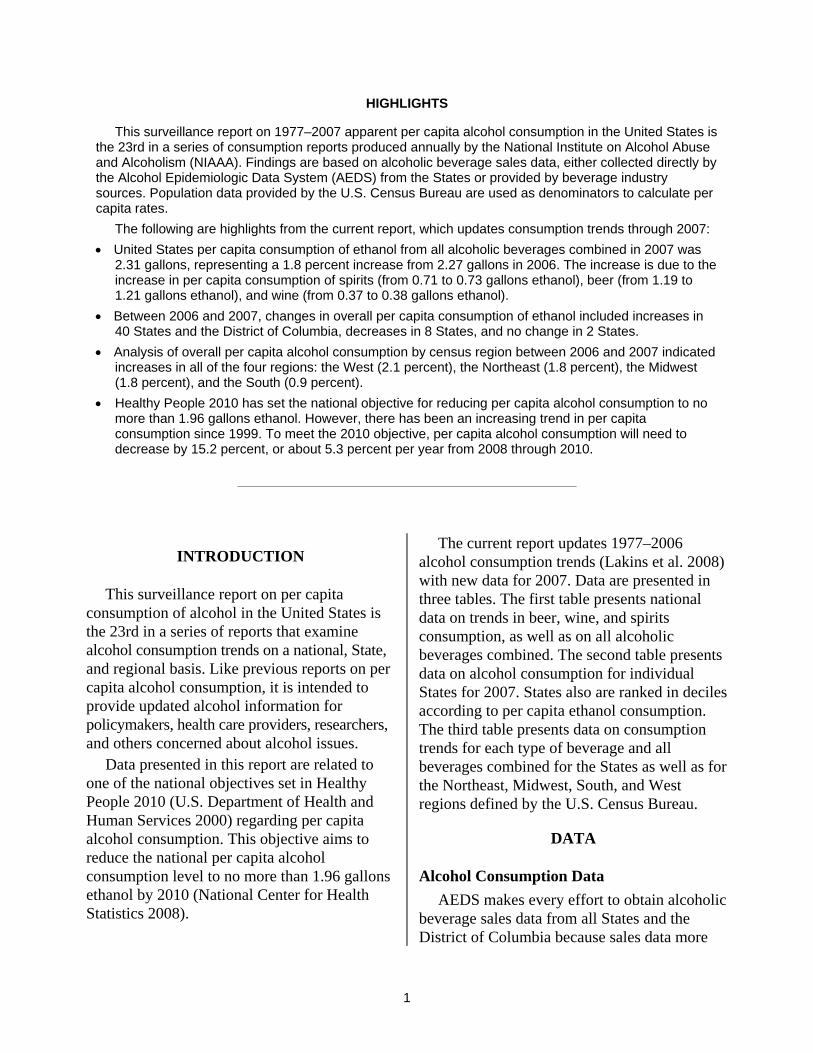
• Analysis of overall per capita alcohol consumption by census region between 2006 and 2007 indicated increases in all of the four regions: the West (2.1 percent), the Northeast (1.8 percent), the Midwest (1.8 percent), and the South (0.9 percent).
• Healthy People 2010 has set the national objective for reducing per capita alcohol consumption to no more than 1.96 gallons ethanol. However, there has been an increasing trend in per capita consumption since 1999. To meet the 2010 objective, per capita alcohol consumption will need to decrease by 15.2 percent, or about 5.3 percent per year from 2008 through 2010.
INTRODUCTION
This surveillance report on per capita consumption of alcohol in the United States is the 23rd in a series of reports that examine alcohol consumption trends on a national, State, and regional basis. Like previous reports on per capita alcohol consumption, it is intended to provide updated alcohol information for policymakers, health care providers, researchers, and others concerned about alcohol issues.
Data presented in this report are related to one of the national objectives set in Healthy People 2010 (U.S. Department of Health and Human Services 2000) regarding per capita alcohol consumption. This objective aims to reduce the national per capita alcohol consumption level to no more than 1.96 gallons ethanol by 2010 (National Center for Health Statistics 2008).
The current report updates 1977–2006 alcohol consumption trends (Lakins et al. 2008) with new data for 2007. Data are presented in three tables. The first table presents national data on trends in beer, wine, and spirits consumption, as well as on all alcoholic beverages combined. The second table presents data on alcohol consumption for individual States for 2007. States also are ranked in deciles according to per capita ethanol consumption. The third table presents data on consumption trends for each type of beverage and all beverages combined for the States as well as for the Northeast, Midwest, South, and West regions defined by the U.S. Census Bureau.
DATA
Alcohol Consumption Data AEDS makes every effort to obtain alcoholic
beverage sales data from all States and the District of Columbia because sales data more
1

accurately reflect actual consumption of alcoholic beverages than do production and shipments data from beverage industry sources. For 2007 AEDS received complete beverage sales and/or tax receipts reports from 29 States for beer, 29 States for wine, and 25 States for spirits.1
For the remaining States and the District of Columbia, shipments data from beverage industry sources (Beverage Information Group 2008a, b, c) were used for the numerator to calculate per capita consumption. Although sales and tax receipt data tend to provide slightly lower per capita estimates (about .01 to .02 points per capita), the mixed use of data from sales and shipments sources appears to have little effect on overall trends in per capita alcohol consumption (Campbell et al. 1994).
Population Data State population estimates for persons ages
14 and older were obtained from Internet releases by the U.S. Census Bureau (2009). These data are used as denominators to calculate the per capita consumption figures.
To make the trend data more precise, AEDS revises data published in previous reports when the Census Bureau makes major revisions to their population estimates. One such revision occurred in the report published in 2003 (Nephew et al, 2003). Beginning with that report, the 1990s population estimates used in the past were replaced with the reestimated intercensal population data that bridge the 1990 and 2000 censuses (U.S. Census Bureau 2002). Because the new population estimates were generally higher than the old estimates, this
1 The following 31 States provided alcoholic beverage
sales data for beer, wine, and/or, spirits for 2007: Alaska, Arizona, Colorado, Connecticut, Florida, Hawaii, Idaho, Illinois, Indiana, Kansas, Kentucky, Louisiana, Maryland, Massachusetts, Michigan, Minnesota, Missouri, Montana, Nevada, New Jersey, New Mexico, New York, North Carolina, North Dakota, Ohio, Pennsylvania, South Dakota, Texas, Utah, Virginia, Wyoming.
revision resulted in slight decreases in calculated per capita ethanol consumption for the 1990s (especially the later part of the decade). Although most of these changes are minor, one impact of the revision is the change to the baseline number cited by Healthy People 2010 (U.S. Department of Health and Human Services 2000) to set the national health objective for reducing per capita alcohol consumption. The baseline year was 1997, the latest data year available at the time when the document was prepared. The revised data changed the 1997 baseline number from 2.18 to 2.14 gallons ethanol per capita. Accordingly, the 2010 national health objective was adjusted from 2.00 to 1.96 gallons ethanol per capita in 2010 (National Center for Health Statistics 2008).
METHODS
Conversion of Ethanol Content AEDS uses an estimate of average ethanol
content in the alcoholic beverages to convert the gallons of sold or shipped beer, wine, and spirits into gallons of ethanol (pure alcohol) before calculating per capita consumption estimates. The ethanol conversion coefficients (ECC, i.e., proportion of pure alcohol for each beverage type) are 0.045 for beer, 0.129 for wine, and 0.411 for spirits (Doernberg and Stinson 1985).
AEDS has considered changes in the alcoholic beverage market which may affect the ECCs used in the current report. For instance the introduction of “light” beer, “light” wines, and coolers (both wine and spirits) may have slightly lowered the average ethanol content in some alcoholic beverages. Kling (1991, 1989) suggests that there were decreases in the ethanol content of spirits during the 1980s. However, such decreases may be offset by the increase in sales of drinks with higher ethanol content, such as premium brand liquors, fortified wines, malt liquors, and locally produced beers and ales (microbrews). “Ice” beers and “dry” beers, for example, both have higher ethanol content than
2

either premium or light beers (M. Shanken Communications, Inc. 1994). Therefore, changes in the average net ethanol content across all beverages have probably been minimal and not large enough to alter the trends in overall per capita consumption.
Recent studies by Kerr and colleagues (2006a, 2006b) estimated national average and State-specific ECCs for beer, wine, and spirits in each year. Their method derived ECCs for each beverage type based on three components of data: (1) market shares for subcategories within the beverage type (e.g., table wine, wine coolers, etc. within wine); (2) market shares for leading brands in each subcategory; and (3) ethanol contents of these leading brands. Their findings suggest that in 2002, the national average ethanol content was 0.0467 for beer, 0.1145 for wine, and 0.3690 for spirits. Their State-specific estimates indicate that ECCs for all beverage types varied by State and over time. AEDS compared per capita consumption estimates derived by Kerr and colleagues with data presented in this surveillance report. Results revealed that cross-State correlations between the two data sets are higher than 0.99 for all three beverage types. Similar patterns were also observed in national trends between the two sets of estimates, although some differences in absolute values existed and fluctuated over time. Given the fact that Kerr and colleagues applied their ECCs to the same AEDS beverage volume data to derive their per capita consumption estimates, it was concluded that consumption trends are mainly driven by beverage volumes rather than changes in the ECC estimates.
AEDS recently conducted a study to update the AEDS ECCs using the methods employed by Kerr and colleagues (2006a, 2006b). The results of this study are still under review, and thus the current ECCs remain unchanged.
Population Denominator AEDS uses a population of persons ages 14
and older to calculate per capita consumption
rates. Although age 14 is below the minimum legal age for the purchase of alcoholic beverages throughout the United States, most self-report surveys indicate that many 14-year-olds drink alcoholic beverages. For example, data from the NIAAA 2001–2002 National Epidemiologic Survey on Alcohol and Related Conditions indicate that 12.2 percent of current drinkers ages 18 and older in the United States began drinking at age 15 or younger (AEDS 2004). Results from the Monitoring the Future survey in 2008 (Johnston et al. 2009) indicate that 32.1 percent of eighth graders (13- to 14-year-olds) reported past-year use of alcohol (i.e., beyond a few sips). Also, using data from the National Survey on Drug Use and Health in 2007, Chen and colleagues (2009) found the median age of initiation of alcohol use among 12–20 year olds to be 14 years of age.
Limitations Individuals familiar with survey reports and
other scientific literature often are accustomed to the presentation of significance tests, or confidence intervals, on any data comparisons or trends. However, because data presented in this report are based on total actual sales and/or shipments, no measures of statistical significance are provided. Nonetheless, it is important to note that these data are still only estimates and may be subject to reporting error.
In addition to ECCs, many factors may result in inaccuracies in estimates of per capita alcohol consumption. For instance, per capita consumption estimates in some States can be inflated by such factors as cross-border sales to buyers from neighboring States. Other factors include: variation in State reporting practices for sales of alcoholic beverages; time-delay between State taxation records and actual consumption; exclusion of alcohol contained in medications and foods; unrecorded legal home production; and illicit production, importation, and sales. These factors are discussed in detail in the latest AEDS data reference manual (DRM) on per capita alcohol consumption
3

4
(Nephew et al. 2004). The DRM can be ordered on NIAAA’s Web site http://www.niaaa.nih.gov.
REFERENCES
Alcohol Epidemiologic Data System (AEDS). Unpublished data from the 2001–2002 National Epidemiologic Survey on Alcohol and Related Conditions, National Institute on Alcohol Abuse and Alcoholism, 2004.
Beverage Information Group. Beer Handbook, 2008. Norwalk, CT: Beverage Information Group, 2008a.
Beverage Information Group. Liquor Handbook, 2008. Norwalk, CT: Beverage Information Group, 2008b.
Beverage Information Group. Wine Handbook, 2008. Norwalk, CT: Beverage Information Group, 2008c.
Campbell, K.E.; Clem, D.; and Williams, G.D. Technical report: 1986–91 per capita ethanol consumption trends using beverage industry shipments data compared to combined sales/tax receipt and shipments data. Working paper prepared by the Alcohol Epidemiologic Data System, NIAAA, Washington, DC, August 1994.
Chen, C.M.; Yi, H.; Williams, G.D.; and Faden, V.B. Surveillance Report #86: Trends in Underage Drinking in the United States, 1991–2007. Rockville, MD: NIAAA, Division of Epidemiology and Prevention Research, Alcohol Epidemiologic Data System, January 2009.
Doernberg, D.; and Stinson, F.S. U.S. Alcohol Epidemiologic Data Reference Manual, Volume 1:U.S. Apparent Consumption of Alcoholic Beverages Based on State Sales, Taxation, or Receipt Data. Washington, DC: U.S. Government Printing Office, September 1985.
Hyman, M.; Zimmerman, M.; Gurioli, C.; and Helrich, A. Drinkers, Drinking and Alcohol-Related Mortality and Hospitalizations: A Statistical Compendium, 1980 Edition. New Brunswick, NJ: Rutgers University, 1980.
Jobson Publishing Corporation. Jobson’s Liquor Handbook 1992. New York: Jobson, 1992.
Johnston, L.D.; O’Malley, P.M.; Bachman, J.G.; and Schulenberg, J.E. Monitoring the Future, National Results on Adolescent Drug Use: Overview of Key Findings, 2008. (NIH Publication No. 09-7401). Bethesda, MD: National Institute on Drug Abuse, 2009.
Kerr, W.C.; Greenfield, T.K.; Tujague, J.; Brown, S.E. The Alcohol Content of Wine Consumed in the US and Per Capita Consumption: New Estimates Reveal Different Trends. Alcoholism: Clinical and Experimental Research 30(3):516-522, 2006a.
Kerr, W.C.; Greenfield, T.K; and Tujague, J. Estimates of the mean alcohol concentration of the spirits, wine, and beer sold in the United States and per capita consumption: 1950 to 2002. Alcoholism: Clinical and Experimental Research 30(9): 1583-1591, 2006b.
Kling, W. Errata: Measurement of ethanol consumed in distilled spirits. Journal of Studies on Alcohol 52:503–504, 1991.
Kling, W. Measurement of ethanol consumed in distilled spirits. Journal of Studies on Alcohol 50:456–460, 1989.
Lakins, N.E.; LaVallee, R.A.; Williams, G.D.; and Yi, H. Surveillance Report #85: Apparent Per Capita Alcohol Consumption: National, State, and Regional Trends, 1977–2006. Rockville, MD: NIAAA, Division of Epidemiology and Prevention Research, Alcohol Epidemiologic Data System, November 2008.
M. Shanken Communications, Inc. The U.S. Beer Market: Impact Databank Review and Forecast, 1994 Edition. New York: Shanken, 1994.
National Center for Health Statistics. (2008). Data2010: the Healthy People 2010 Database (May, 2008 Edition) [Interactive database]. Available from National Center for Health Statistics website, http://www.cdc.gov/nchs.
Nephew, T.M.; Williams, G.D.; Yi, H.; Hoy, A.K.; Stinson, F.S.; and Dufour, M. Surveillance Report #59: Apparent Per Capita Alcohol Consumption: National, State, and Regional Trends, 1977–2000. Rockville, MD: NIAAA, Division of Biometry and Epidemiology, Alcohol Epidemiologic Data System, September 2003.
Nephew, T.M.; Yi, H.; Williams, G.D.; Stinson, F.S.; and Dufour, M.C. Alcohol Epidemiologic Data Reference Manual, Vol. 1, 4th Edition, U.S. Apparent Consumption of Alcoholic Beverages Based on State Sales, Taxation, or Receipt Data. NIH Publication No. 04-5563. Bethesda, MD: National Institutes of Health, National Institute on Alcohol Abuse and Alcoholism, Alcohol Epidemiologic Data System, June, 2004.
U.S. Census Bureau, Population Division. Estimates and Projections Area Documentation: State and County Total Population Estimates, Washington, D.C.: U.S. Census Bureau, Internet release, December 2002.
U.S. Census Bureau, Population Division. Estimates of the Resident Population by Single-Year of Age and Sex for the United States and States: July 1, 2008 (SC-EST2008-AGESEX_RES). Washington, D.C.: U.S. Census Bureau, Internet release, May 14, 2009.
U.S. Department of Health and Human Services. Healthy People 2010. 2nd Ed. With Understanding and Improving Health and Objectives for Improving Health. 2 vols. Washington, DC: U.S. Government Printing Office, November 2000.

List of Figures
Page
Figure 1 Total per capita ethanol consumption, United States, 1935–2007.......................... 6
Figure 2 Per capita ethanol consumption by beverage type, United States, 1977–2007...............................................................................................................
6
Figure 3 Percent change in per capita ethanol consumption, United States, 1977–2007...............................................................................................................
7
Figure 4 Total per capita consumption in gallons of ethanol by State, United States, 2007 .................................................................................................
8
Figure 5 Percentage change in total per capita ethanol consumption by State, United States, 2006–2007 ...................................................................................................
8
Figure 6 Total per capita ethanol consumption by region, United States, 1977–2007...............................................................................................................
9
Figure 7 Per capita ethanol consumption from beer by region, United States, 1977–2007...............................................................................................................
9
Figure 8 Per capita ethanol consumption from wine by region, United States, 1977–2007...............................................................................................................
10
Figure 9 Per capita ethanol consumption from spirits by region, United States, 1977–2007...............................................................................................................
10
List of Tables
Page
Table 1 Apparent per capita ethanol consumption, United States, 1850–2007 ................... 11
Table 2 Apparent alcohol consumption for States, census regions, and the United States, 2007 ...........................................................................................
13
Table 3 Per capita ethanol consumption for States, census regions, and the United States, 1977–2007 .................................................................................
15
5

Figure 1. Total per capita ethanol consumption, United States, 1935–2007
1
1.2
1.4
1.6
1.8
2
2.2
2.4
2.6
2.8
1935 1940 1945 1950 1955 1960 1965 1970 1975 1980 1985 1990 1995 2000 2005
Gal
lons
of e
than
ol
Figure 2. Per capita ethanol consumption by beverage type, United States, 1977–2007.
0.0
0.2
0.4
0.6
0.8
1.0
1.2
1.4
'77 '79 '81 '83 '85 '87 '89 '91 '93 '95 '97 '99 '01 '03 '05 '07
Gal
lons
of e
than
ol (b
eer,
win
e, o
r spi
rits)
2.1
2.2
2.3
2.4
2.5
2.6
2.7
2.8
Gallons of ethanol (all beverages)
Beer Spirits Wine All Beverages
6

Figure 3. Percent change in per capita ethanol consumption, United States, 1977–2007
50
60
70
80
90
100
110
120
130
140
'77 '79 '81 '83 '85 '87 '89 '91 '93 '95 '97 '99 '01 '03 '05 '07
Per
cent
of 1
977
leve
l
Beer Wine Spirits All beverages
7

Figure 4. Total per capita consumption in gallons of ethanol by State, United States, 2007.
Figure 5. Percentage change in total per capita ethanol consumption by State, United States, 2006–2007.
8
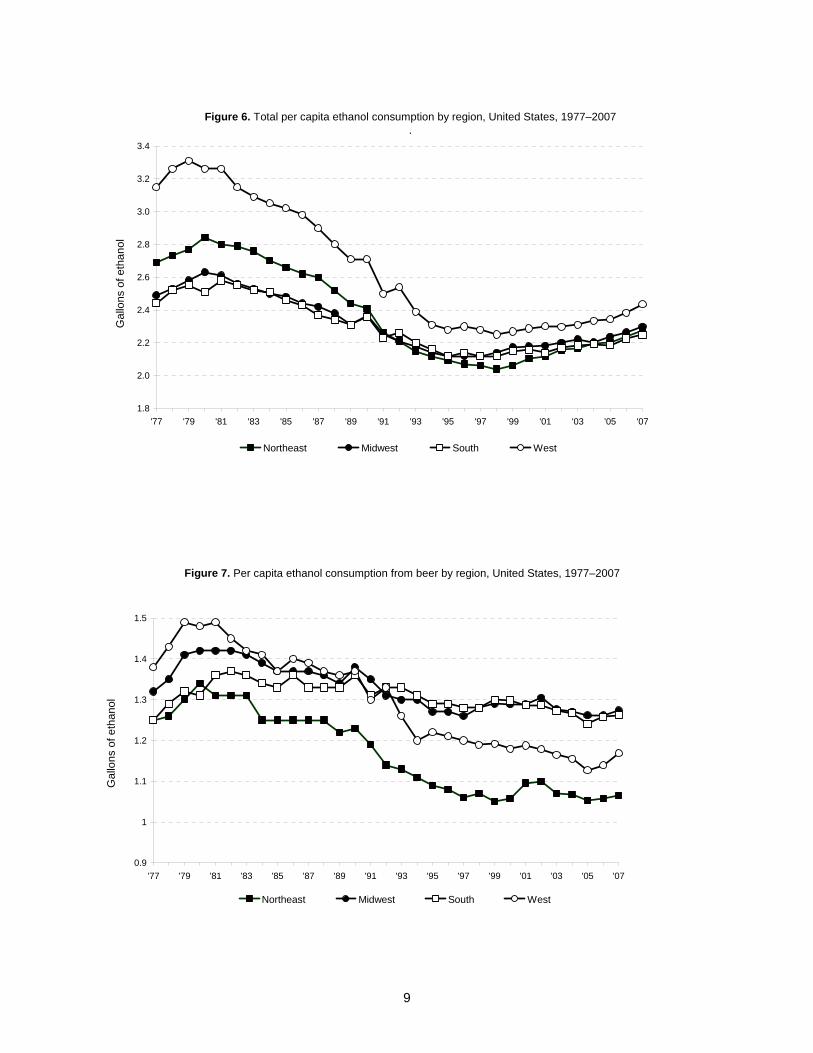
Figure 6. Total per capita ethanol consumption by region, United States, 1977–2007.
1.8
2.0
2.2
2.4
2.6
2.8
3.0
3.2
3.4
'77 '79 '81 '83 '85 '87 '89 '91 '93 '95 '97 '99 '01 '03 '05 '07
Gal
lons
of e
than
ol
Northeast Midwest South West
Figure 7. Per capita ethanol consumption from beer by region, United States, 1977–2007
0.9
1
1.1
1.2
1.3
1.4
1.5
'77 '79 '81 '83 '85 '87 '89 '91 '93 '95 '97 '99 '01 '03 '05 '07
Gal
lons
of e
than
ol
Northeast Midwest South West
9
Figure 8. Per capita ethanol consumption from wine by region, United States, 1977–2007
0
0.1
0.2
0.3
0.4
0.5
0.6
0.7
'77 '79 '81 '83 '85 '87 '89 '91 '93 '95 '97 '99 '01 '03 '05 '07
Gal
lons
of e
than
ol
Northeast Midwest South West
Figure 9. Per capita ethanol consumption from spirits by region, United States, 1977–2007
0.5
0.6
0.7
0.8
0.9
1.0
1.1
1.2
1.3
'77 '79 '81 '83 '85 '87 '89 '91 '93 '95 '97 '99 '01 '03 '05 '07
Gal
lons
of e
than
ol
Northeast Midwest South West
10
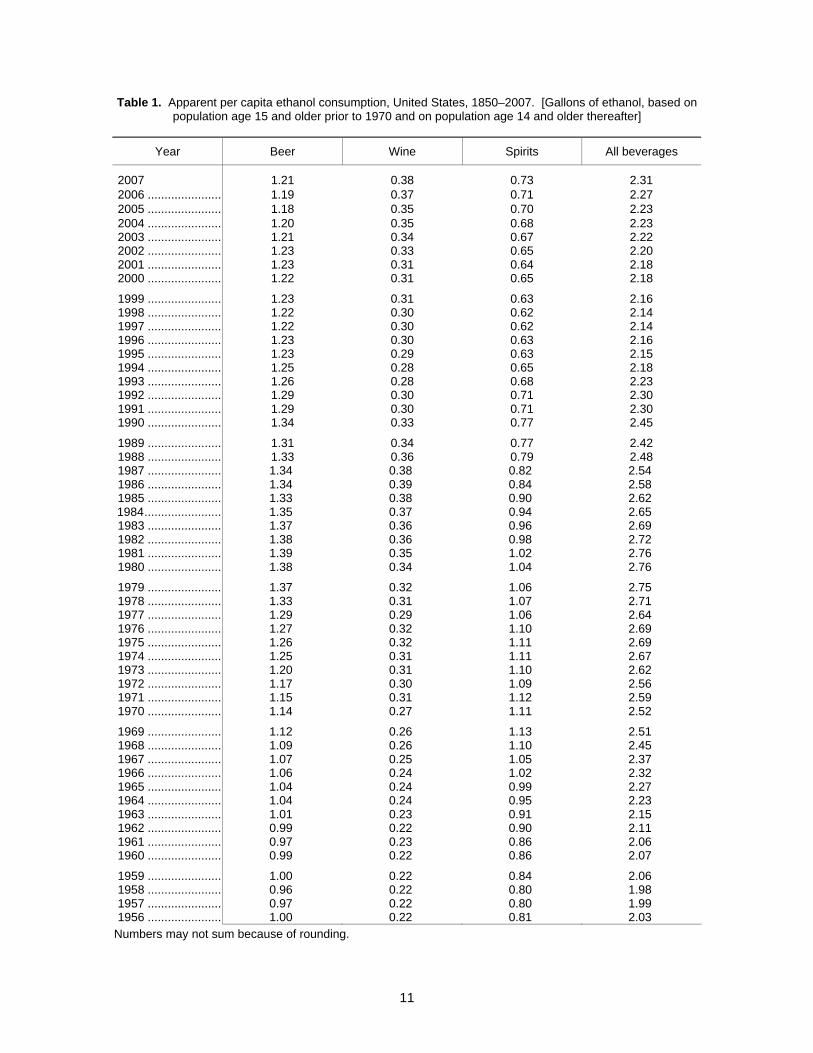
Table 1. Apparent per capita ethanol consumption, United States, 1850–2007. [Gallons of ethanol, based on population age 15 and older prior to 1970 and on population age 14 and older thereafter]
Year Beer Wine Spirits All beverages
2007 1.21 0.38 0.73 2.31 2006 ....................... 1.19 0.37 0.71 2.27 2005 ....................... 1.18 0.35 0.70 2.23 2004 ....................... 1.20 0.35 0.68 2.23 2003 ....................... 1.21 0.34 0.67 2.22 2002 ....................... 1.23 0.33 0.65 2.20 2001 ....................... 1.23 0.31 0.64 2.18 2000 ....................... 1.22 0.31 0.65 2.18
1999 ....................... 1.23 0.31 0.63 2.16 1998 ....................... 1.22 0.30 0.62 2.14 1997 ....................... 1.22 0.30 0.62 2.14 1996 ....................... 1.23 0.30 0.63 2.16 1995 ....................... 1.23 0.29 0.63 2.15 1994 ....................... 1.25 0.28 0.65 2.18 1993 ....................... 1.26 0.28 0.68 2.23 1992 ....................... 1.29 0.30 0.71 2.30 1991 ....................... 1.29 0.30 0.71 2.30 1990 ....................... 1.34 0.33 0.77 2.45
1989 ....................... 1.31 0.34 0.77 2.42 1988 ....................... 1.33 0.36 0.79 2.48 1987 ....................... 1.34 0.38 0.82 2.54 1986 ....................... 1.34 0.39 0.84 2.58 1985 ....................... 1.33 0.38 0.90 2.62
1984........................ 1.35 0.37 0.94 2.65 1983 ....................... 1.37 0.36 0.96 2.69 1982 ....................... 1.38 0.36 0.98 2.72 1981 ....................... 1.39 0.35 1.02 2.76 1980 ....................... 1.38 0.34 1.04 2.76
1979 ....................... 1.37 0.32 1.06 2.75 1978 ....................... 1.33 0.31 1.07 2.71 1977 ....................... 1.29 0.29 1.06 2.64 1976 ....................... 1.27 0.32 1.10 2.69 1975 ....................... 1.26 0.32 1.11 2.69 1974 ....................... 1.25 0.31 1.11 2.67 1973 ....................... 1.20 0.31 1.10 2.62 1972 ....................... 1.17 0.30 1.09 2.56 1971 ....................... 1.15 0.31 1.12 2.59 1970 ....................... 1.14 0.27 1.11 2.52
1969 ....................... 1.12 0.26 1.13 2.51 1968 ....................... 1.09 0.26 1.10 2.45 1967 ....................... 1.07 0.25 1.05 2.37 1966 ....................... 1.06 0.24 1.02 2.32 1965 ....................... 1.04 0.24 0.99 2.27 1964 ....................... 1.04 0.24 0.95 2.23 1963 ....................... 1.01 0.23 0.91 2.15 1962 ....................... 0.99 0.22 0.90 2.11 1961 ....................... 0.97 0.23 0.86 2.06 1960 ....................... 0.99 0.22 0.86 2.07
1959 ....................... 1.00 0.22 0.84 2.06 1958 ....................... 0.96 0.22 0.80 1.98 1957 ....................... 0.97 0.22 0.80 1.99 1956 ....................... 1.00 0.22 0.81 2.03
Numbers may not sum because of rounding.
11

12
Table 1. Apparent per capita ethanol consumption, United States, 1850–2007. [Gallons of ethanol, based on population age 15 and older prior to 1970 and on population age 14 and older thereafter] (Continued)
Year Beer Wine Spirits All beverages
1955 ....................... 1.01 0.22 0.77 2.00 1954 ....................... 1.01 0.21 0.74 1.96 1953 ....................... 1.04 0.20 0.77 2.01 1952 ....................... 1.04 0.21 0.73 1.98 1951 ....................... 1.03 0.20 0.78 2.01 1950 ....................... 1.04 0.23 0.77 2.04
1949 ....................... 1.06 0.22 0.70 1.98 1948 ....................... 1.07 0.20 0.70 1.97 1947 ....................... 1.11 0.16 0.76 2.03 1946 ....................... 1.07 0.24 0.99 2.30 1945 ....................... 1.17 0.20 0.88 2.25 1944 ....................... 1.13 0.18 0.76 2.07 1943 ....................... 1.00 0.17 0.66 1.83 1942 ....................... 0.90 0.22 0.85 1.97 1941 ....................... 0.81 0.18 0.71 1.70 1940 ....................... 0.73 0.16 0.67 1.56
1939 ....................... 0.75 0.14 0.62 1.51 1938 ....................... 0.75 0.13 0.59 1.47 1937 ....................... 0.82 0.13 0.64 1.59 1936 ....................... 0.79 0.12 0.59 1.50 1935 ....................... 0.68 0.09 0.43 1.20 1934 ....................... 0.61 0.07 0.29 0.97
(Prohibition)
1916–1919 ............. 1.08 0.12 0.76 1.96 1911–1915 ............. 1.48 0.14 0.94 2.56 1906–1910 ............. 1.47 0.17 0.96 2.60 1901–1905 ............. 1.31 0.13 0.95 2.39 1896–1900 ............. 1.19 0.10 0.77 2.06 1891–1895 ............. 1.17 0.11 0.95 2.23 1881–1890 ............. 0.90 0.14 0.95 1.99 1871–1880 ............. 0.56 0.14 1.02 1.72 1870 ....................... 0.44 0.10 1.53 2.07 1860 ....................... 0.27 0.10 2.16 2.53 1850 ....................... 0.14 0.08 1.88 2.10
Numbers may not sum because of rounding.
Note: Data prior to 1977 are from: Hyman, M.; Zimmerman, M.; Gurioli, C.; and Helrich, A. Drinkers, Drinking and Alcohol-Related Mortality and Hospitalizations: A Statistical Compendium, 1980 edition. New Brunswick, NJ: Rutgers University, 1980.

Table 2. Apparent alcohol consumption for States, census regions, and the United States, 2007. [Volume and ethanol in thousands of gallons, per capita ethanol consumption in gallons, based on population age 14 and older]
Beer Wine Spirits All beverages State or other
geographic area Volume Ethanol Per capita Volume Ethanol Per
capita Volume Ethanol Per capita Ethanol Per
capita U.S.
decile
Alabama .......... 103,905 4,676 1.24 6,381 823 0.22 5,117 2,103 0.56 7,602 2.02 9Alaska ............. 15,930 717 1.32 1,874 242 0.45 1,415 582 1.07 1,540 2.84 2Arizona ............ 152,116 6,845 1.36 13,032 1,681 0.33 9,341 3,839 0.76 12,366 2.45 5Arkansas ......... 54,473 2,451 1.07 3,008 388 0.17 3,320 1,365 0.60 4,204 1.84 10California ......... 694,575 31,256 1.07 125,250 16,157 0.55 51,001 20,961 0.72 68,375 2.34 6
Colorado.......... 112,196 5,049 1.29 14,120 1,822 0.47 9,535 3,919 1.00 10,789 2.75 2Connecticut ..... 59,186 2,663 0.93 12,827 1,655 0.58 5,909 2,429 0.85 6,747 2.35 6Delaware ......... 21,735 978 1.39 3,250 16,157 0.59 2,135 877 1.25 2,275 3.23 1Dist. of Columb. 15,053 677 1.35 3,836 495 0.99 1,967 808 1.61 1,981 3.95 1Florida ............. 436,764 19,654 1.30 57,313 7,393 0.49 34,186 14,050 0.93 41,098 2.72 3
Georgia ........... 195,525 8,799 1.16 14,995 1,934 0.26 11,784 4,843 0.64 15,576 2.06 8Hawaii ............. 31,358 1,411 1.34 4,008 517 0.49 2,046 841 0.80 2,769 2.62 3Idaho ............... 30,810 1,386 1.18 6,735 869 0.74 1,935 795 0.67 3,051 2.59 4Illinois .............. 282,149 12,697 1.22 32,742 4,224 0.41 18,455 7,585 0.73 24,506 2.36 6Indiana ............ 129,115 5,810 1.14 9,699 1,251 0.24 8,975 3,689 0.72 10,750 2.10 8
Iowa................. 75,735 3,408 1.40 3,220 415 0.17 3,992 1,641 0.67 5,464 2.24 7Kansas ............ 58,017 2,611 1.17 2,560 330 0.15 3,500 1,438 0.64 4,379 1.96 9Kentucky ......... 80,559 3,625 1.05 4,679 604 0.17 5,318 2,186 0.63 6,414 1.85 10Louisiana......... 122,963 5,533 1.57 7,531 971 0.28 6,959 2,860 0.81 9,365 2.65 3Maine .............. 31,275 1,407 1.27 3,668 473 0.43 2,149 883 0.80 2,764 2.49 4
Maryland ......... 103,401 4,653 1.01 12,738 1,643 0.36 9,418 3,871 0.84 10,167 2.21 7Massachusetts 121,219 5,455 1.01 25,546 3,295 0.61 11,210 4,607 0.86 13,357 2.48 4Michigan.......... 202,770 9,125 1.11 19,018 2,453 0.30 15,532 6,384 0.78 17,962 2.19 7Minnesota........ 108,608 4,887 1.16 10,520 1,357 0.32 9,999 4,110 0.97 10.354 2.45 5Mississippi ....... 75,600 3,402 1.46 2,171 280 0.12 3,876 1,593 0.68 5,275 2.26 7
Missouri ........... 141,305 6,359 1.33 11,017 1,421 0.30 9,118 3,748 0.78 11,528 2.41 5Montana .......... 27,900 1,256 1.59 2,165 279 0.35 1,652 679 0.86 2,214 2.80 2Nebraska......... 46,013 2,071 1.45 2,272 293 0.21 2,339 961 0.67 3,325 2.33 6Nevada............ 77,411 3,483 1.71 10,061 1,298 0.64 6,280 2,581 1.27 7,362 3.61 1New Hampshire 42,075 1,893 1.74 6,252 807 0.74 4,631 1,903 1.75 4,603 4.22 1Decile values (1 = highest) apply only to State-level data. Numbers may not sum because of rounding.
13

14
Table 2. Apparent alcohol consumption for States, census regions, and the United States, 2007. [Volume and ethanol in thousands of gallons, per capita ethanol consumption in gallons, based on population age 14 and older] (Continued)
Beer Wine Spirits All beverages State or other
geographic area Volume Ethanol Per capita Volume Ethanol Per
capita Volume Ethanol Per capita Ethanol Per
capita U.S.
decile
New Jersey ..... 145,932 6,567 0.93 30,240 3,901 0.55 14,754 6,064 0.86 16,532 2.34 6New Mexico..... 49,608 2,232 1.41 3,784 488 0.31 2,714 1,115 0.71 3,836 2.43 5New York......... 328,061 14,763 0.92 57,880 7,467 0.46 26,594 10,930 0.68 33,159 2.06 8North Carolina . 189,055 8,507 1.16 15,636 2,017 0.28 10,052 4,131 0.56 14,656 2.00 9North Dakota ... 18,427 829 1.57 959 124 0.23 1,394 573 1.08 1,526 2.88 2
Ohio................. 277,088 12,469 1.33 18,121 2,338 0.25 10,249 4,212 0.45 19,019 2.03 9Oklahoma........ 76,208 3,429 1.18 3,936 508 0.17 4,080 1,677 0.58 5,614 1.93 9Oregon ............ 88,380 3,977 1.29 11,794 1,521 0.49 6,045 2,484 0.81 7,983 2.59 3Pennsylvania ... 306,675 13,800 1.34 19,176 2,474 0.24 14,784 6,076 0.59 22,350 2.16 8Rhode Island ... 22,005 990 1.13 3,669 473 0.54 1,916 787 0.90 2,251 2.56 4
South Carolina 114,300 5,144 1.43 6,825 880 0.24 6,711 2,758 0.77 8,782 2.44 5South Dakota... 21,668 975 1.51 1,092 141 0.22 1,346 553 0.86 1,669 2.59 4Tennessee ...... 126,428 5,689 1.13 7,784 1,004 0.20 6,814 2,801 0.56 9,494 1.89 10Texas .............. 585,365 26,341 1.41 39,223 5,060 0.27 25,595 10,519 0.56 41,921 2.25 7Utah................. 33,615 1,513 0.75 2,490 321 0.16 2,097 862 0.43 2,665 1.33 10
Vermont........... 15,975 719 1.37 2,462 318 0.61 891 366 0.70 1,403 2.68 3Virginia ............ 158,732 7,143 1.13 20,053 2,587 0.41 8,897 3,657 0.58 13,386 2.13 8Washington ..... 130,388 5,867 1.11 20,435 2,636 0.50 9,488 3,900 0.74 12,403 2.35 6West Virginia ... 41,648 1,874 1.24 1,215 157 0.10 1,566 644 0.42 2,675 1.76 10Wisconsin........ 157,185 7,073 1.54 11,758 1,517 0.33 12,405 5,098 1.11 13,689 2.98 1Wyoming ......... 14,147 637 1.49 766 99 0.23 1,142 469 1.10 1,205 2.82 2
Regions Northeast......... 1,072,403 48,258 1.06 161,720 20,862 0.46 82,838 34,046 0.75 103,166 2.28Midwest ........... 1,518,080 68,314 1.27 122,978 15,864 0.29 97,305 39,992 0.74 124,170 2.30South............... 2,501,715 112,577 1.26 210,575 27,164 0.30 147,795 60,744 0.68 200,485 2.25West ................ 1,458,435 65,630 1.17 216,556 27,936 0.50 104,555 42,972 0.77 136,560 2.43
U.S. total ......... 6,550,633 294,778 1.21 711,788 91,821 0.38 432,629 177,810 0.73 564,410 2.31
Decile values (1 = highest) apply only to State-level data. Numbers may not sum because of rounding.

Table 3. Per capita ethanol consumption for States, census regions, and the United States, 1977-2007. [Gallons of ethanol, based on population age 14 and older]
State or other Geographic area Per capita consumption
Beer Wine Spirits All beverages
U.S. decile for all beverages
Alabama 2007.................. 1.24 0.22 0.56 2.02 9 2006.................. 1.22 0.21 0.55 1.97 9 2005.................. 1.18 0.20 0.53 1.91 9 2004.................. 1.19 0.20 0.52 1.90 9 2003.................. 1.18 0.19 0.52 1.89 9 2002.................. 1.18 0.21 0.53 1.92 9 2001.................. 1.16 0.17 0.53 1.86 9 2000.................. 1.19 0.18 0.51 1.88 9 1999.................. 1.18 0.17 0.51 1.87 9 1998.................. 1.16 0.17 0.51 1.85 9 1997.................. 1.14 0.15 0.52 1.81 9 1996.................. 1.17 0.15 0.53 1.86 9 1995.................. 1.14 0.15 0.53 1.81 9 1994.................. 1.16 0.17 0.54 1.87 9 1993.................. 1.14 0.17 0.56 1.86 9 1992.................. 1.02 0.19 0.59 1.79 10 1991.................. 1.00 0.17 0.59 1.76 10 1990.................. 1.12 0.18 0.61 1.92 9 1989.................. 1.10 0.17 0.60 1.87 9 1988.................. 1.10 0.18 0.61 1.89 9 1987.................. 1.10 0.18 0.61 1.89 9 1986.................. 1.09 0.18 0.64 1.90 9 1985.................. 1.06 0.17 0.67 1.90 9 1984.................. 1.02 0.19 0.69 1.90 10 1983.................. 1.01 0.17 0.71 1.89 10 1982.................. 1.00 0.18 0.72 1.89 10 1981.................. 1.00 0.19 0.73 1.92 10 1980.................. 0.96 0.16 0.74 1.86 10 1979.................. 0.98 0.12 0.84 1.94 10 1978.................. 0.98 0.12 0.88 1.97 9 1977.................. 0.99 0.13 0.84 1.96 9
Alaska 2007.................. 1.32 0.45 1.07 2.84 2 2006.................. 1.24 0.46 1.02 2.73 2 2005.................. 1.24 0.43 0.99 2.65 2 2004.................. 1.32 0.45 0.96 2.73 2 2003.................. 1.27 0.37 0.79 2.43 3 2002.................. 1.36 0.43 1.08 2.87 1 2001.................. 1.34 0.40 0.97 2.71 2 2000.................. 1.35 0.37 0.92 2.63 2 1999.................. 1.45 0.40 0.98 2.82 1 1998.................. 1.37 0.39 0.98 2.74 1 1997.................. 1.31 0.36 0.88 2.56 2 1996.................. 1.31 0.38 0.94 2.63 2 1995.................. 1.45 0.39 1.02 2.86 1 1994.................. 1.53 0.40 1.10 3.03 1 1993.................. 1.31 0.32 0.92 2.55 2 1992.................. 1.53 0.41 1.08 3.02 1 1991.................. 1.54 0.43 1.14 3.11 1 1990.................. 1.62 0.46 1.25 3.33 1 1989.................. 1.57 0.46 1.24 3.27 1
Decile values (1 = highest) apply only to State-level data. Numbers may not sum because of rounding.
15
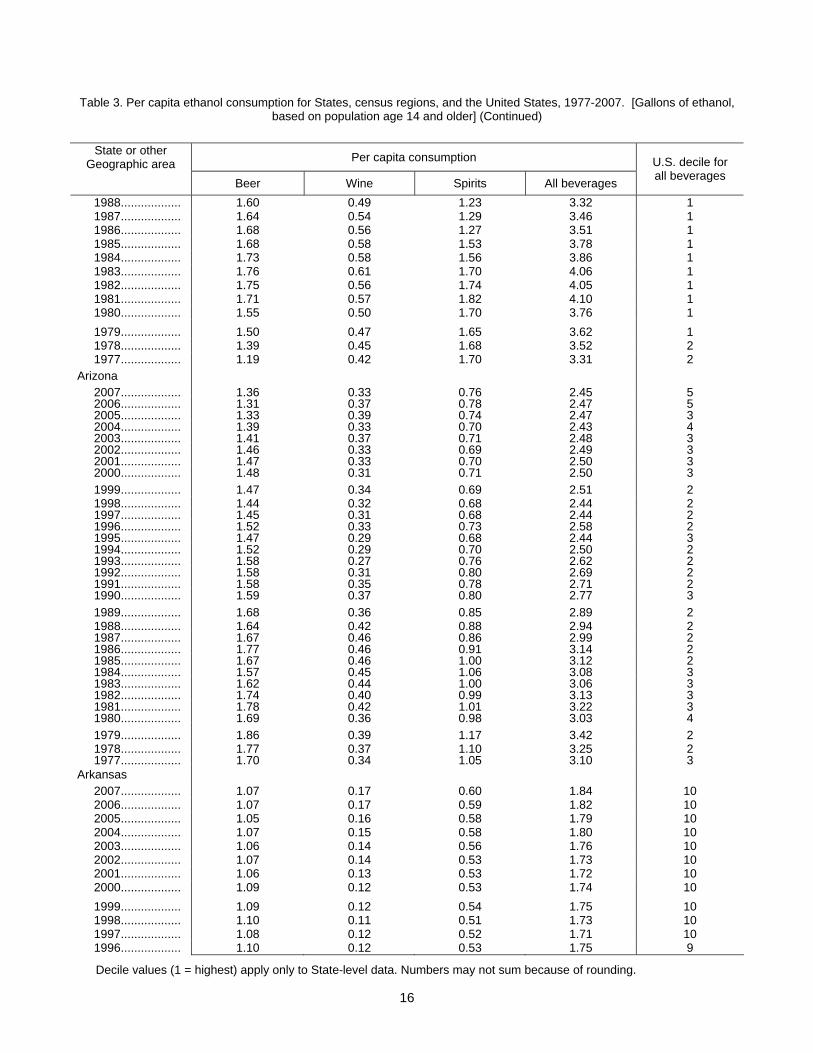
Table 3. Per capita ethanol consumption for States, census regions, and the United States, 1977-2007. [Gallons of ethanol, based on population age 14 and older] (Continued)
State or other Geographic area Per capita consumption
Beer Wine Spirits All beverages
U.S. decile for all beverages
1988.................. 1.60 0.49 1.23 3.32 1 1987.................. 1.64 0.54 1.29 3.46 1 1986.................. 1.68 0.56 1.27 3.51 1 1985.................. 1.68 0.58 1.53 3.78 1 1984.................. 1.73 0.58 1.56 3.86 1 1983.................. 1.76 0.61 1.70 4.06 1 1982.................. 1.75 0.56 1.74 4.05 1 1981.................. 1.71 0.57 1.82 4.10 1 1980.................. 1.55 0.50 1.70 3.76 1 1979.................. 1.50 0.47 1.65 3.62 1 1978.................. 1.39 0.45 1.68 3.52 2 1977.................. 1.19 0.42 1.70 3.31 2
Arizona 2007.................. 1.36 0.33 0.76 2.45 52006.................. 1.31 0.37 0.78 2.47 52005.................. 1.33 0.39 0.74 2.47 32004.................. 1.39 0.33 0.70 2.43 42003.................. 1.41 0.37 0.71 2.48 32002.................. 1.46 0.33 0.69 2.49 32001.................. 1.47 0.33 0.70 2.50 32000.................. 1.48 0.31 0.71 2.50 31999.................. 1.47 0.34 0.69 2.51 2 1998.................. 1.44 0.32 0.68 2.44 21997.................. 1.45 0.31 0.68 2.44 21996.................. 1.52 0.33 0.73 2.58 21995.................. 1.47 0.29 0.68 2.44 31994.................. 1.52 0.29 0.70 2.50 21993.................. 1.58 0.27 0.76 2.62 21992.................. 1.58 0.31 0.80 2.69 21991.................. 1.58 0.35 0.78 2.71 21990.................. 1.59 0.37 0.80 2.77 31989.................. 1.68 0.36 0.85 2.89 2 1988.................. 1.64 0.42 0.88 2.94 21987.................. 1.67 0.46 0.86 2.99 21986.................. 1.77 0.46 0.91 3.14 21985.................. 1.67 0.46 1.00 3.12 21984.................. 1.57 0.45 1.06 3.08 31983.................. 1.62 0.44 1.00 3.06 31982.................. 1.74 0.40 0.99 3.13 31981.................. 1.78 0.42 1.01 3.22 31980.................. 1.69 0.36 0.98 3.03 41979.................. 1.86 0.39 1.17 3.42 2 1978.................. 1.77 0.37 1.10 3.25 21977.................. 1.70 0.34 1.05 3.10 3
Arkansas 2007.................. 1.07 0.17 0.60 1.84 10 2006.................. 1.07 0.17 0.59 1.82 10 2005.................. 1.05 0.16 0.58 1.79 10 2004.................. 1.07 0.15 0.58 1.80 10 2003.................. 1.06 0.14 0.56 1.76 10 2002.................. 1.07 0.14 0.53 1.73 10 2001.................. 1.06 0.13 0.53 1.72 10 2000.................. 1.09 0.12 0.53 1.74 10 1999.................. 1.09 0.12 0.54 1.75 10 1998.................. 1.10 0.11 0.51 1.73 10 1997.................. 1.08 0.12 0.52 1.71 10 1996.................. 1.10 0.12 0.53 1.75 9
Decile values (1 = highest) apply only to State-level data. Numbers may not sum because of rounding.
16
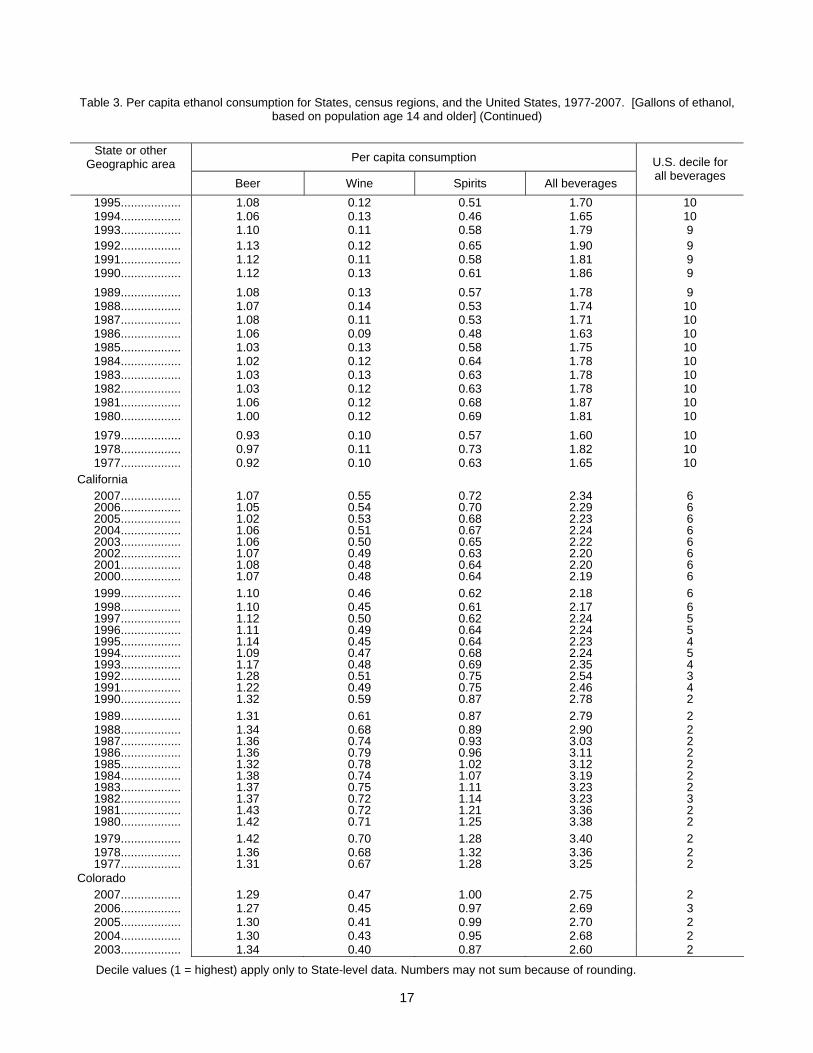
Table 3. Per capita ethanol consumption for States, census regions, and the United States, 1977-2007. [Gallons of ethanol, based on population age 14 and older] (Continued)
State or other Geographic area Per capita consumption
Beer Wine Spirits All beverages
U.S. decile for all beverages
1995.................. 1.08 0.12 0.51 1.70 10 1994.................. 1.06 0.13 0.46 1.65 10 1993.................. 1.10 0.11 0.58 1.79 9 1992.................. 1.13 0.12 0.65 1.90 9 1991.................. 1.12 0.11 0.58 1.81 9 1990.................. 1.12 0.13 0.61 1.86 9 1989.................. 1.08 0.13 0.57 1.78 9 1988.................. 1.07 0.14 0.53 1.74 10 1987.................. 1.08 0.11 0.53 1.71 10 1986.................. 1.06 0.09 0.48 1.63 10 1985.................. 1.03 0.13 0.58 1.75 10 1984.................. 1.02 0.12 0.64 1.78 10 1983.................. 1.03 0.13 0.63 1.78 10 1982.................. 1.03 0.12 0.63 1.78 10 1981.................. 1.06 0.12 0.68 1.87 10 1980.................. 1.00 0.12 0.69 1.81 10 1979.................. 0.93 0.10 0.57 1.60 10 1978.................. 0.97 0.11 0.73 1.82 10 1977.................. 0.92 0.10 0.63 1.65 10
California 2007.................. 1.07 0.55 0.72 2.34 62006.................. 1.05 0.54 0.70 2.29 62005.................. 1.02 0.53 0.68 2.23 62004.................. 1.06 0.51 0.67 2.24 62003.................. 1.06 0.50 0.65 2.22 62002.................. 1.07 0.49 0.63 2.20 62001.................. 1.08 0.48 0.64 2.20 62000.................. 1.07 0.48 0.64 2.19 61999.................. 1.10 0.46 0.62 2.18 6 1998.................. 1.10 0.45 0.61 2.17 61997.................. 1.12 0.50 0.62 2.24 51996.................. 1.11 0.49 0.64 2.24 51995.................. 1.14 0.45 0.64 2.23 41994.................. 1.09 0.47 0.68 2.24 51993.................. 1.17 0.48 0.69 2.35 41992.................. 1.28 0.51 0.75 2.54 31991.................. 1.22 0.49 0.75 2.46 41990.................. 1.32 0.59 0.87 2.78 21989.................. 1.31 0.61 0.87 2.79 2 1988.................. 1.34 0.68 0.89 2.90 21987.................. 1.36 0.74 0.93 3.03 21986.................. 1.36 0.79 0.96 3.11 21985.................. 1.32 0.78 1.02 3.12 21984.................. 1.38 0.74 1.07 3.19 21983.................. 1.37 0.75 1.11 3.23 21982.................. 1.37 0.72 1.14 3.23 31981.................. 1.43 0.72 1.21 3.36 21980.................. 1.42 0.71 1.25 3.38 21979.................. 1.42 0.70 1.28 3.40 2 1978.................. 1.36 0.68 1.32 3.36 21977.................. 1.31 0.67 1.28 3.25 2
Colorado 2007.................. 1.29 0.47 1.00 2.75 2 2006.................. 1.27 0.45 0.97 2.69 3 2005.................. 1.30 0.41 0.99 2.70 2 2004.................. 1.30 0.43 0.95 2.68 2 2003.................. 1.34 0.40 0.87 2.60 2
Decile values (1 = highest) apply only to State-level data. Numbers may not sum because of rounding.
17

Table 3. Per capita ethanol consumption for States, census regions, and the United States, 1977-2007. [Gallons of ethanol, based on population age 14 and older] (Continued)
State or other Geographic area Per capita consumption
Beer Wine Spirits All beverages
U.S. decile for all beverages
2002.................. 1.35 0.39 0.90 2.64 2 2001.................. 1.42 0.41 0.96 2.79 1 2000.................. 1.35 0.37 0.89 2.60 2 1999.................. 1.33 0.37 0.75 2.45 3 1998.................. 1.33 0.37 0.83 2.53 2 1997.................. 1.30 0.37 0.81 2.48 2 1996.................. 1.36 0.37 0.84 2.57 2 1995.................. 1.34 0.35 0.78 2.47 2 1994.................. 1.36 0.35 0.84 2.55 2 1993.................. 1.40 0.36 0.86 2.63 2 1992.................. 1.34 0.36 0.81 2.52 3 1991.................. 1.39 0.35 0.87 2.61 3 1990.................. 1.35 0.29 0.75 2.39 6 1989.................. 1.40 0.37 0.84 2.60 3 1988.................. 1.42 0.39 0.91 2.72 3 1987.................. 1.43 0.44 0.93 2.80 3 1986.................. 1.47 0.46 0.94 2.87 3 1985.................. 1.47 0.50 1.18 3.15 2 1984.................. 1.51 0.46 1.12 3.09 2 1983.................. 1.57 0.46 1.12 3.15 3 1982.................. 1.64 0.46 1.18 3.28 2 1981.................. 1.63 0.44 1.26 3.33 2 1980.................. 1.57 0.47 1.31 3.35 2 1979.................. 1.68 0.47 1.37 3.52 2 1978.................. 1.64 0.47 1.43 3.54 1 1977.................. 1.43 0.36 1.22 3.01 3
Connecticut 2007.................. 0.93 0.58 0.85 2.35 6 2006.................. 0.93 0.55 0.84 2.32 6 2005.................. 0.90 0.54 0.79 2.23 6 2004.................. 0.92 0.53 0.79 2.24 6 2003.................. 0.93 0.52 0.77 2.22 6 2002.................. 0.95 0.50 0.74 2.20 6 2001.................. 0.95 0.50 0.74 2.19 6 2000.................. 0.94 0.49 0.74 2.18 6 1999.................. 0.94 0.49 0.75 2.18 6 1998.................. 0.96 0.48 0.74 2.18 6 1997.................. 0.95 0.48 0.74 2.17 6 1996.................. 0.94 0.46 0.72 2.13 6 1995.................. 0.97 0.49 0.77 2.22 5 1994.................. 0.99 0.43 0.78 2.20 6 1993.................. 0.96 0.44 0.80 2.20 6 1992.................. 1.01 0.45 0.83 2.30 6 1991.................. 1.03 0.43 0.84 2.29 6 1990.................. 1.09 0.45 0.92 2.46 6 1989.................. 1.09 0.47 0.98 2.54 4 1988.................. 1.14 0.51 1.07 2.71 3 1987.................. 1.15 0.52 1.12 2.79 3 1986.................. 1.13 0.51 1.15 2.79 3 1985.................. 1.14 0.50 1.20 2.84 3 1984.................. 1.10 0.50 1.20 2.80 4 1983.................. 1.10 0.49 1.23 2.82 4
Decile values (1 = highest) apply only to State-level data. Numbers may not sum because of rounding.
18

Table 3. Per capita ethanol consumption for States, census regions, and the United States, 1977-2007. [Gallons of ethanol, based on population age 14 and older] (Continued)
State or other Geographic area Per capita consumption
Beer Wine Spirits All beverages
U.S. decile for all beverages
1982.................. 1.04 0.49 1.20 2.73 6 1981.................. 1.05 0.44 1.18 2.67 6 1980.................. 1.06 0.43 1.21 2.70 6 1979.................. 1.13 0.40 1.20 2.72 5 1978.................. 1.07 0.38 1.20 2.65 6 1977.................. 1.05 0.35 1.21 2.61 6
Delaware 2007.................. 1.39 0.59 1.25 3.23 1 2006.................. 1.43 0.60 1.28 3.30 1 2005.................. 1.43 0.59 1.25 3.27 1 2004.................. 1.41 0.57 1.28 3.26 1 2003.................. 1.37 0.56 1.17 3.11 1 2002.................. 1.39 0.52 1.10 3.01 1 2001.................. 1.38 0.49 1.06 2.93 1 2000.................. 1.36 0.48 1.05 2.89 1 1999.................. 1.40 0.48 1.03 2.90 1 1998.................. 1.36 0.47 0.98 2.82 1 1997.................. 1.37 0.46 0.99 2.81 1 1996.................. 1.39 0.45 0.94 2.78 1 1995.................. 1.30 0.40 0.92 2.62 2 1994.................. 1.43 0.38 0.95 2.76 1 1993.................. 1.46 0.35 0.95 2.76 1 1992.................. 1.40 0.36 0.97 2.73 2 1991.................. 1.40 0.35 0.95 2.70 2 1990.................. 1.44 0.37 1.14 2.95 2 1989.................. 1.40 0.38 1.13 2.91 2 1988.................. 1.44 0.40 1.19 3.03 1 1987.................. 1.44 0.42 1.22 3.08 2 1986.................. 1.45 0.44 1.23 3.13 2 1985.................. 1.46 0.41 1.30 3.16 2 1984.................. 1.51 0.38 1.28 3.17 2 1983.................. 1.53 0.35 1.34 3.22 2 1982.................. 1.53 0.34 1.36 3.23 3 1981.................. 1.51 0.32 1.39 3.23 3 1980.................. 1.45 0.29 1.38 3.12 3 1979.................. 1.38 0.27 1.34 2.99 4 1978.................. 1.33 0.25 1.33 2.91 4 1977.................. 1.32 0.24 1.35 2.91 4
District of Columbia 2007.................. 1.35 0.99 1.61 3.95 1 2006.................. 1.36 0.95 1.58 3.89 1 2005.................. 1.38 0.92 1.53 3.84 1 2004.................. 1.41 0.94 1.57 3.93 1 2003.................. 1.40 0.90 1.54 3.84 1 2002.................. 1.36 0.84 1.47 3.67 1 2001.................. 1.33 0.82 1.46 3.61 1 2000.................. 1.35 0.70 1.48 3.53 1 1999.................. 1.37 0.73 1.35 3.45 1 1998.................. 1.37 0.73 1.44 3.55 1 1997.................. 1.40 0.74 1.61 3.75 1 1996.................. 1.42 0.74 1.47 3.63 1 1995.................. 1.51 0.72 1.52 3.74 1
Decile values (1 = highest) apply only to State-level data. Numbers may not sum because of rounding.
19
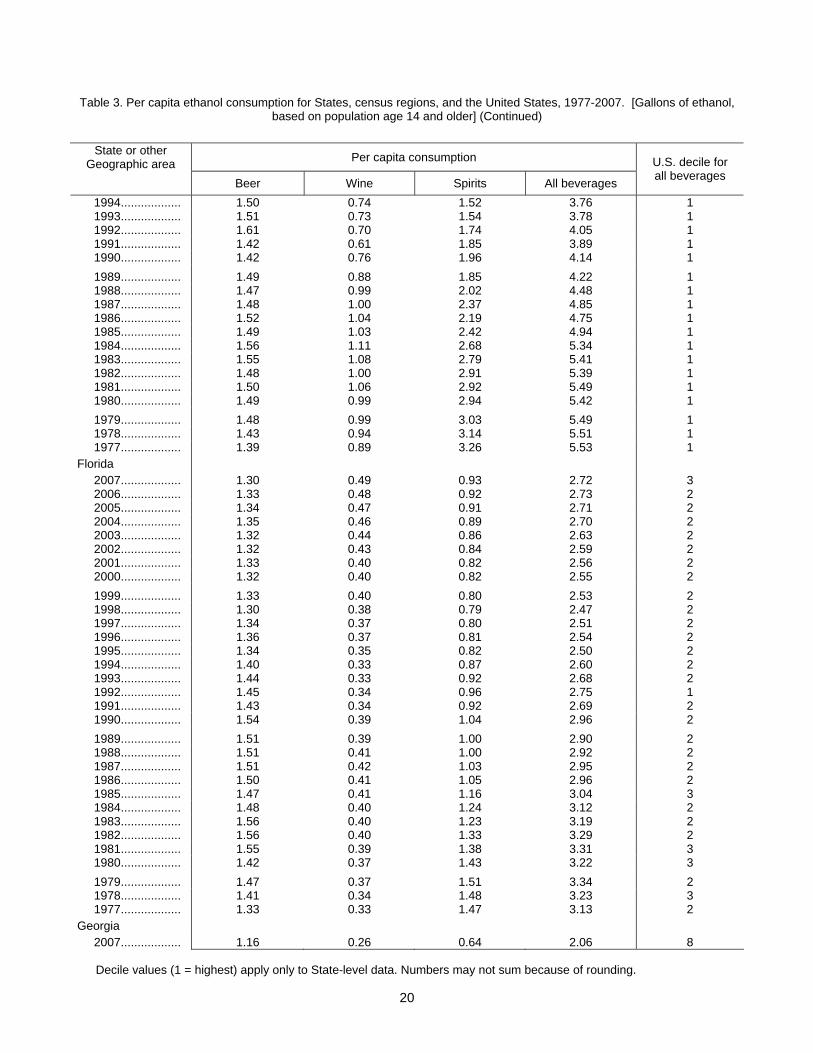
Table 3. Per capita ethanol consumption for States, census regions, and the United States, 1977-2007. [Gallons of ethanol, based on population age 14 and older] (Continued)
State or other Geographic area Per capita consumption
Beer Wine Spirits All beverages
U.S. decile for all beverages
1994.................. 1.50 0.74 1.52 3.76 1 1993.................. 1.51 0.73 1.54 3.78 1 1992.................. 1.61 0.70 1.74 4.05 1 1991.................. 1.42 0.61 1.85 3.89 1 1990.................. 1.42 0.76 1.96 4.14 1 1989.................. 1.49 0.88 1.85 4.22 1 1988.................. 1.47 0.99 2.02 4.48 1 1987.................. 1.48 1.00 2.37 4.85 1 1986.................. 1.52 1.04 2.19 4.75 1 1985.................. 1.49 1.03 2.42 4.94 1 1984.................. 1.56 1.11 2.68 5.34 1 1983.................. 1.55 1.08 2.79 5.41 1 1982.................. 1.48 1.00 2.91 5.39 1 1981.................. 1.50 1.06 2.92 5.49 1 1980.................. 1.49 0.99 2.94 5.42 1 1979.................. 1.48 0.99 3.03 5.49 1 1978.................. 1.43 0.94 3.14 5.51 1 1977.................. 1.39 0.89 3.26 5.53 1
Florida 2007.................. 1.30 0.49 0.93 2.72 3 2006.................. 1.33 0.48 0.92 2.73 2 2005.................. 1.34 0.47 0.91 2.71 2 2004.................. 1.35 0.46 0.89 2.70 2 2003.................. 1.32 0.44 0.86 2.63 2 2002.................. 1.32 0.43 0.84 2.59 2 2001.................. 1.33 0.40 0.82 2.56 2 2000.................. 1.32 0.40 0.82 2.55 2 1999.................. 1.33 0.40 0.80 2.53 2 1998.................. 1.30 0.38 0.79 2.47 2 1997.................. 1.34 0.37 0.80 2.51 2 1996.................. 1.36 0.37 0.81 2.54 2 1995.................. 1.34 0.35 0.82 2.50 2 1994.................. 1.40 0.33 0.87 2.60 2 1993.................. 1.44 0.33 0.92 2.68 2 1992.................. 1.45 0.34 0.96 2.75 1 1991.................. 1.43 0.34 0.92 2.69 2 1990.................. 1.54 0.39 1.04 2.96 2 1989.................. 1.51 0.39 1.00 2.90 2 1988.................. 1.51 0.41 1.00 2.92 2 1987.................. 1.51 0.42 1.03 2.95 2 1986.................. 1.50 0.41 1.05 2.96 2 1985.................. 1.47 0.41 1.16 3.04 3 1984.................. 1.48 0.40 1.24 3.12 2 1983.................. 1.56 0.40 1.23 3.19 2 1982.................. 1.56 0.40 1.33 3.29 2 1981.................. 1.55 0.39 1.38 3.31 3 1980.................. 1.42 0.37 1.43 3.22 3 1979.................. 1.47 0.37 1.51 3.34 2 1978.................. 1.41 0.34 1.48 3.23 3 1977.................. 1.33 0.33 1.47 3.13 2
Georgia 2007.................. 1.16 0.26 0.64 2.06 8
Decile values (1 = highest) apply only to State-level data. Numbers may not sum because of rounding.
20
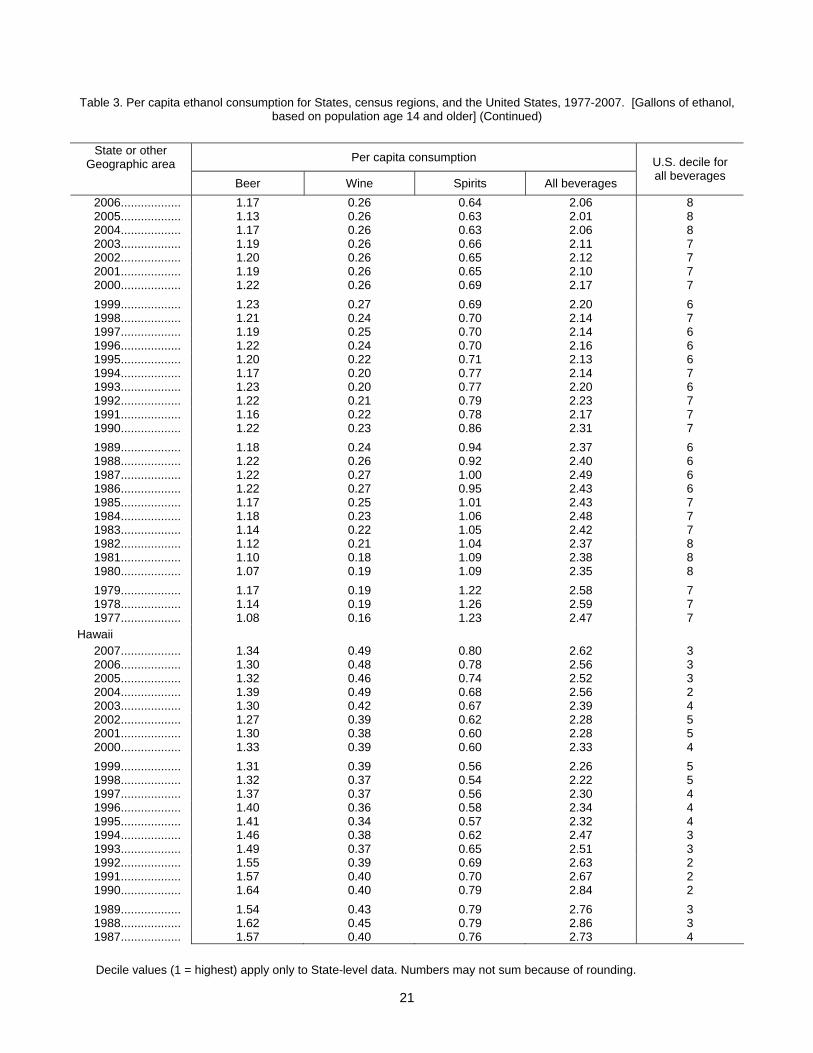
Table 3. Per capita ethanol consumption for States, census regions, and the United States, 1977-2007. [Gallons of ethanol, based on population age 14 and older] (Continued)
State or other Geographic area Per capita consumption
Beer Wine Spirits All beverages
U.S. decile for all beverages
2006.................. 1.17 0.26 0.64 2.06 8 2005.................. 1.13 0.26 0.63 2.01 8 2004.................. 1.17 0.26 0.63 2.06 8 2003.................. 1.19 0.26 0.66 2.11 7 2002.................. 1.20 0.26 0.65 2.12 7 2001.................. 1.19 0.26 0.65 2.10 7 2000.................. 1.22 0.26 0.69 2.17 7 1999.................. 1.23 0.27 0.69 2.20 6 1998.................. 1.21 0.24 0.70 2.14 7 1997.................. 1.19 0.25 0.70 2.14 6 1996.................. 1.22 0.24 0.70 2.16 6 1995.................. 1.20 0.22 0.71 2.13 6 1994.................. 1.17 0.20 0.77 2.14 7 1993.................. 1.23 0.20 0.77 2.20 6 1992.................. 1.22 0.21 0.79 2.23 7 1991.................. 1.16 0.22 0.78 2.17 7 1990.................. 1.22 0.23 0.86 2.31 7 1989.................. 1.18 0.24 0.94 2.37 6 1988.................. 1.22 0.26 0.92 2.40 6 1987.................. 1.22 0.27 1.00 2.49 6 1986.................. 1.22 0.27 0.95 2.43 6 1985.................. 1.17 0.25 1.01 2.43 7 1984.................. 1.18 0.23 1.06 2.48 7 1983.................. 1.14 0.22 1.05 2.42 7 1982.................. 1.12 0.21 1.04 2.37 8 1981.................. 1.10 0.18 1.09 2.38 8 1980.................. 1.07 0.19 1.09 2.35 8 1979.................. 1.17 0.19 1.22 2.58 7 1978.................. 1.14 0.19 1.26 2.59 7 1977.................. 1.08 0.16 1.23 2.47 7
Hawaii 2007.................. 1.34 0.49 0.80 2.62 3 2006.................. 1.30 0.48 0.78 2.56 3 2005.................. 1.32 0.46 0.74 2.52 3 2004.................. 1.39 0.49 0.68 2.56 2 2003.................. 1.30 0.42 0.67 2.39 4 2002.................. 1.27 0.39 0.62 2.28 5 2001.................. 1.30 0.38 0.60 2.28 5 2000.................. 1.33 0.39 0.60 2.33 4 1999.................. 1.31 0.39 0.56 2.26 5 1998.................. 1.32 0.37 0.54 2.22 5 1997.................. 1.37 0.37 0.56 2.30 4 1996.................. 1.40 0.36 0.58 2.34 4 1995.................. 1.41 0.34 0.57 2.32 4 1994.................. 1.46 0.38 0.62 2.47 3 1993.................. 1.49 0.37 0.65 2.51 3 1992.................. 1.55 0.39 0.69 2.63 2 1991.................. 1.57 0.40 0.70 2.67 2 1990.................. 1.64 0.40 0.79 2.84 2 1989.................. 1.54 0.43 0.79 2.76 3 1988.................. 1.62 0.45 0.79 2.86 3 1987.................. 1.57 0.40 0.76 2.73 4
Decile values (1 = highest) apply only to State-level data. Numbers may not sum because of rounding.
21
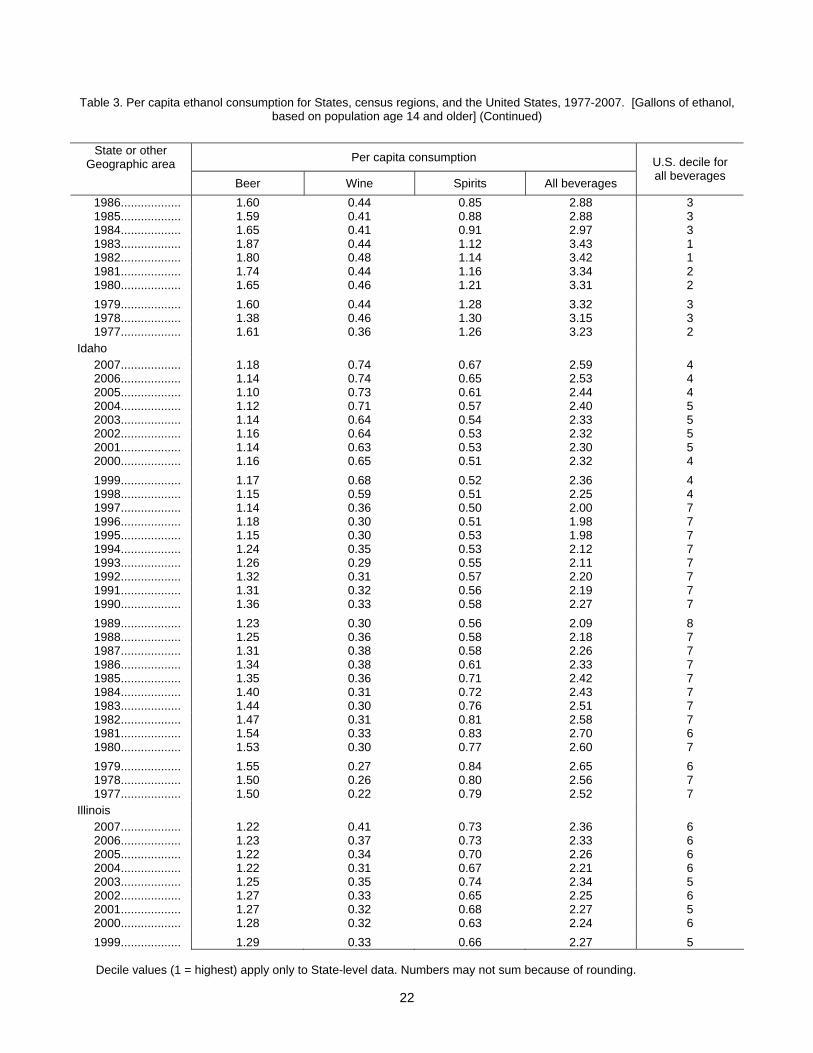
Table 3. Per capita ethanol consumption for States, census regions, and the United States, 1977-2007. [Gallons of ethanol, based on population age 14 and older] (Continued)
State or other Geographic area Per capita consumption
Beer Wine Spirits All beverages
U.S. decile for all beverages
1986.................. 1.60 0.44 0.85 2.88 3 1985.................. 1.59 0.41 0.88 2.88 3 1984.................. 1.65 0.41 0.91 2.97 3 1983.................. 1.87 0.44 1.12 3.43 1 1982.................. 1.80 0.48 1.14 3.42 1 1981.................. 1.74 0.44 1.16 3.34 2 1980.................. 1.65 0.46 1.21 3.31 2 1979.................. 1.60 0.44 1.28 3.32 3 1978.................. 1.38 0.46 1.30 3.15 3 1977.................. 1.61 0.36 1.26 3.23 2
Idaho 2007.................. 1.18 0.74 0.67 2.59 4 2006.................. 1.14 0.74 0.65 2.53 4 2005.................. 1.10 0.73 0.61 2.44 4 2004.................. 1.12 0.71 0.57 2.40 5 2003.................. 1.14 0.64 0.54 2.33 5 2002.................. 1.16 0.64 0.53 2.32 5 2001.................. 1.14 0.63 0.53 2.30 5 2000.................. 1.16 0.65 0.51 2.32 4 1999.................. 1.17 0.68 0.52 2.36 4 1998.................. 1.15 0.59 0.51 2.25 4 1997.................. 1.14 0.36 0.50 2.00 7 1996.................. 1.18 0.30 0.51 1.98 7 1995.................. 1.15 0.30 0.53 1.98 7 1994.................. 1.24 0.35 0.53 2.12 7 1993.................. 1.26 0.29 0.55 2.11 7 1992.................. 1.32 0.31 0.57 2.20 7 1991.................. 1.31 0.32 0.56 2.19 7 1990.................. 1.36 0.33 0.58 2.27 7 1989.................. 1.23 0.30 0.56 2.09 8 1988.................. 1.25 0.36 0.58 2.18 7 1987.................. 1.31 0.38 0.58 2.26 7 1986.................. 1.34 0.38 0.61 2.33 7 1985.................. 1.35 0.36 0.71 2.42 7 1984.................. 1.40 0.31 0.72 2.43 7 1983.................. 1.44 0.30 0.76 2.51 7 1982.................. 1.47 0.31 0.81 2.58 7 1981.................. 1.54 0.33 0.83 2.70 6 1980.................. 1.53 0.30 0.77 2.60 7 1979.................. 1.55 0.27 0.84 2.65 6 1978.................. 1.50 0.26 0.80 2.56 7 1977.................. 1.50 0.22 0.79 2.52 7
Illinois 2007.................. 1.22 0.41 0.73 2.36 6 2006.................. 1.23 0.37 0.73 2.33 6 2005.................. 1.22 0.34 0.70 2.26 6 2004.................. 1.22 0.31 0.67 2.21 6 2003.................. 1.25 0.35 0.74 2.34 5 2002.................. 1.27 0.33 0.65 2.25 6 2001.................. 1.27 0.32 0.68 2.27 5 2000.................. 1.28 0.32 0.63 2.24 6 1999.................. 1.29 0.33 0.66 2.27 5
Decile values (1 = highest) apply only to State-level data. Numbers may not sum because of rounding.
22
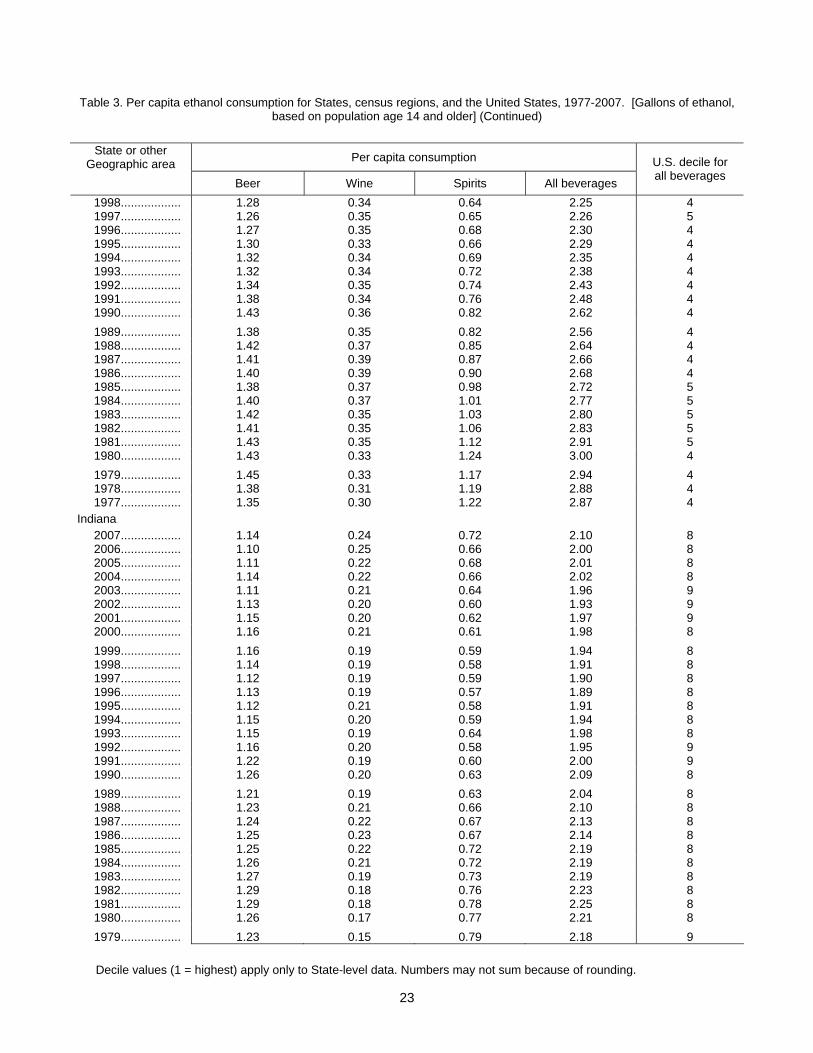
Table 3. Per capita ethanol consumption for States, census regions, and the United States, 1977-2007. [Gallons of ethanol, based on population age 14 and older] (Continued)
State or other Geographic area Per capita consumption
Beer Wine Spirits All beverages
U.S. decile for all beverages
1998.................. 1.28 0.34 0.64 2.25 4 1997.................. 1.26 0.35 0.65 2.26 5 1996.................. 1.27 0.35 0.68 2.30 4 1995.................. 1.30 0.33 0.66 2.29 4 1994.................. 1.32 0.34 0.69 2.35 4 1993.................. 1.32 0.34 0.72 2.38 4 1992.................. 1.34 0.35 0.74 2.43 4 1991.................. 1.38 0.34 0.76 2.48 4 1990.................. 1.43 0.36 0.82 2.62 4 1989.................. 1.38 0.35 0.82 2.56 4 1988.................. 1.42 0.37 0.85 2.64 4 1987.................. 1.41 0.39 0.87 2.66 4 1986.................. 1.40 0.39 0.90 2.68 4 1985.................. 1.38 0.37 0.98 2.72 5 1984.................. 1.40 0.37 1.01 2.77 5 1983.................. 1.42 0.35 1.03 2.80 5 1982.................. 1.41 0.35 1.06 2.83 5 1981.................. 1.43 0.35 1.12 2.91 5 1980.................. 1.43 0.33 1.24 3.00 4 1979.................. 1.45 0.33 1.17 2.94 4 1978.................. 1.38 0.31 1.19 2.88 4 1977.................. 1.35 0.30 1.22 2.87 4
Indiana 2007.................. 1.14 0.24 0.72 2.10 8 2006.................. 1.10 0.25 0.66 2.00 8 2005.................. 1.11 0.22 0.68 2.01 8 2004.................. 1.14 0.22 0.66 2.02 8 2003.................. 1.11 0.21 0.64 1.96 9 2002.................. 1.13 0.20 0.60 1.93 9 2001.................. 1.15 0.20 0.62 1.97 9 2000.................. 1.16 0.21 0.61 1.98 8 1999.................. 1.16 0.19 0.59 1.94 8 1998.................. 1.14 0.19 0.58 1.91 8 1997.................. 1.12 0.19 0.59 1.90 8 1996.................. 1.13 0.19 0.57 1.89 8 1995.................. 1.12 0.21 0.58 1.91 8 1994.................. 1.15 0.20 0.59 1.94 8 1993.................. 1.15 0.19 0.64 1.98 8 1992.................. 1.16 0.20 0.58 1.95 9 1991.................. 1.22 0.19 0.60 2.00 9 1990.................. 1.26 0.20 0.63 2.09 8 1989.................. 1.21 0.19 0.63 2.04 8 1988.................. 1.23 0.21 0.66 2.10 8 1987.................. 1.24 0.22 0.67 2.13 8 1986.................. 1.25 0.23 0.67 2.14 8 1985.................. 1.25 0.22 0.72 2.19 8 1984.................. 1.26 0.21 0.72 2.19 8 1983.................. 1.27 0.19 0.73 2.19 8 1982.................. 1.29 0.18 0.76 2.23 8 1981.................. 1.29 0.18 0.78 2.25 8 1980.................. 1.26 0.17 0.77 2.21 8 1979.................. 1.23 0.15 0.79 2.18 9
Decile values (1 = highest) apply only to State-level data. Numbers may not sum because of rounding.
23
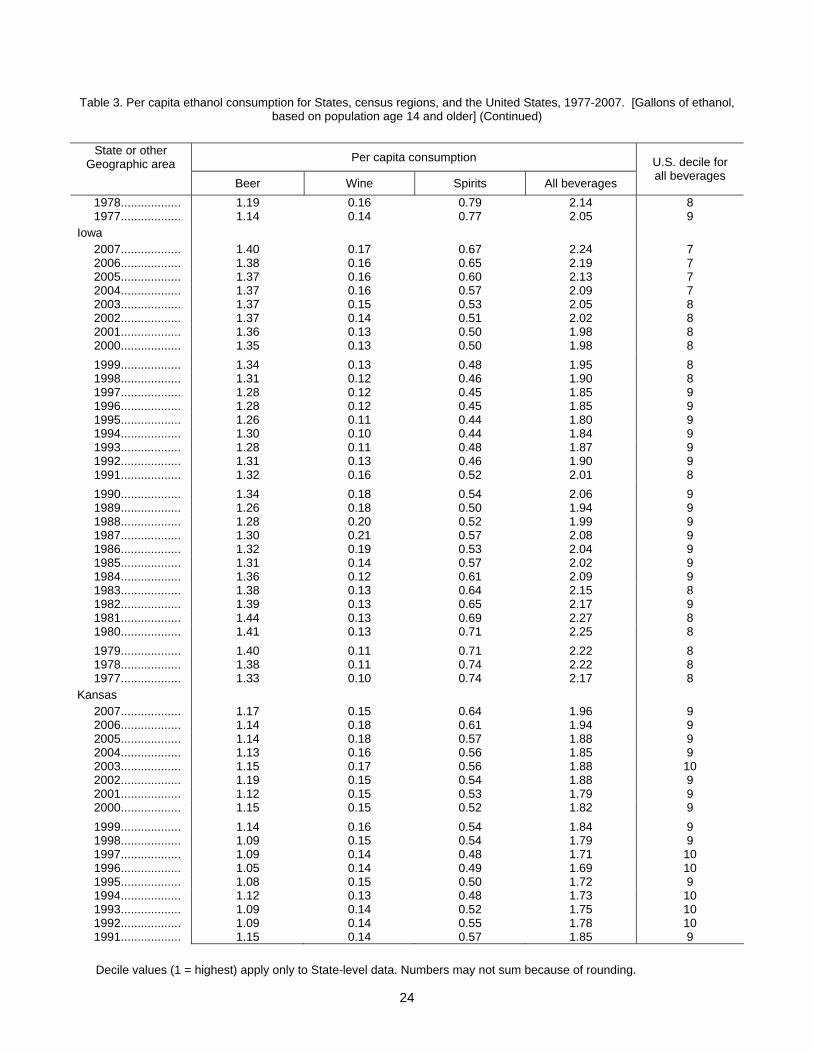
Table 3. Per capita ethanol consumption for States, census regions, and the United States, 1977-2007. [Gallons of ethanol, based on population age 14 and older] (Continued)
State or other Geographic area Per capita consumption
Beer Wine Spirits
U.S. decile for
All beverages all beverages
1978.................. 1.19 0.16 0.79 2.14 8 1977.................. 1.14 0.14 0.77 2.05 9
Iowa 2007.................. 1.40 0.17 0.67 2.24 7 2006.................. 1.38 0.16 0.65 2.19 7 2005.................. 1.37 0.16 0.60 2.13 7 2004.................. 1.37 0.16 0.57 2.09 7 2003.................. 1.37 0.15 0.53 2.05 8 2002.................. 1.37 0.14 0.51 2.02 8 2001.................. 1.36 0.13 0.50 1.98 8 2000.................. 1.35 0.13 0.50 1.98 8 1999.................. 1.34 0.13 0.48 1.95 8 1998.................. 1.31 0.12 0.46 1.90 8 1997.................. 1.28 0.12 0.45 1.85 9 1996.................. 1.28 0.12 0.45 1.85 9 1995.................. 1.26 0.11 0.44 1.80 9 1994.................. 1.30 0.10 0.44 1.84 9 1993.................. 1.28 0.11 0.48 1.87 9 1992.................. 1.31 0.13 0.46 1.90 9 1991.................. 1.32 0.16 0.52 2.01 8 1990.................. 1.34 0.18 0.54 2.06 9 1989.................. 1.26 0.18 0.50 1.94 9 1988.................. 1.28 0.20 0.52 1.99 9 1987.................. 1.30 0.21 0.57 2.08 9 1986.................. 1.32 0.19 0.53 2.04 9 1985.................. 1.31 0.14 0.57 2.02 9 1984.................. 1.36 0.12 0.61 2.09 9 1983.................. 1.38 0.13 0.64 2.15 8 1982.................. 1.39 0.13 0.65 2.17 9 1981.................. 1.44 0.13 0.69 2.27 8 1980.................. 1.41 0.13 0.71 2.25 8 1979.................. 1.40 0.11 0.71 2.22 8 1978.................. 1.38 0.11 0.74 2.22 8 1977.................. 1.33 0.10 0.74 2.17 8
Kansas 2007.................. 1.17 0.15 0.64 1.96 9 2006.................. 1.14 0.18 0.61 1.94 9 2005.................. 1.14 0.18 0.57 1.88 9 2004.................. 1.13 0.16 0.56 1.85 9 2003.................. 1.15 0.17 0.56 1.88 10 2002.................. 1.19 0.15 0.54 1.88 9 2001.................. 1.12 0.15 0.53 1.79 9 2000.................. 1.15 0.15 0.52 1.82 9 1999.................. 1.14 0.16 0.54 1.84 9 1998.................. 1.09 0.15 0.54 1.79 9 1997.................. 1.09 0.14 0.48 1.71 10 1996.................. 1.05 0.14 0.49 1.69 10 1995.................. 1.08 0.15 0.50 1.72 9 1994.................. 1.12 0.13 0.48 1.73 10 1993.................. 1.09 0.14 0.52 1.75 10 1992.................. 1.09 0.14 0.55 1.78 10 1991.................. 1.15 0.14 0.57 1.85 9
Decile values (1 = highest) apply only to State-level data. Numbers may not sum because of rounding.
24
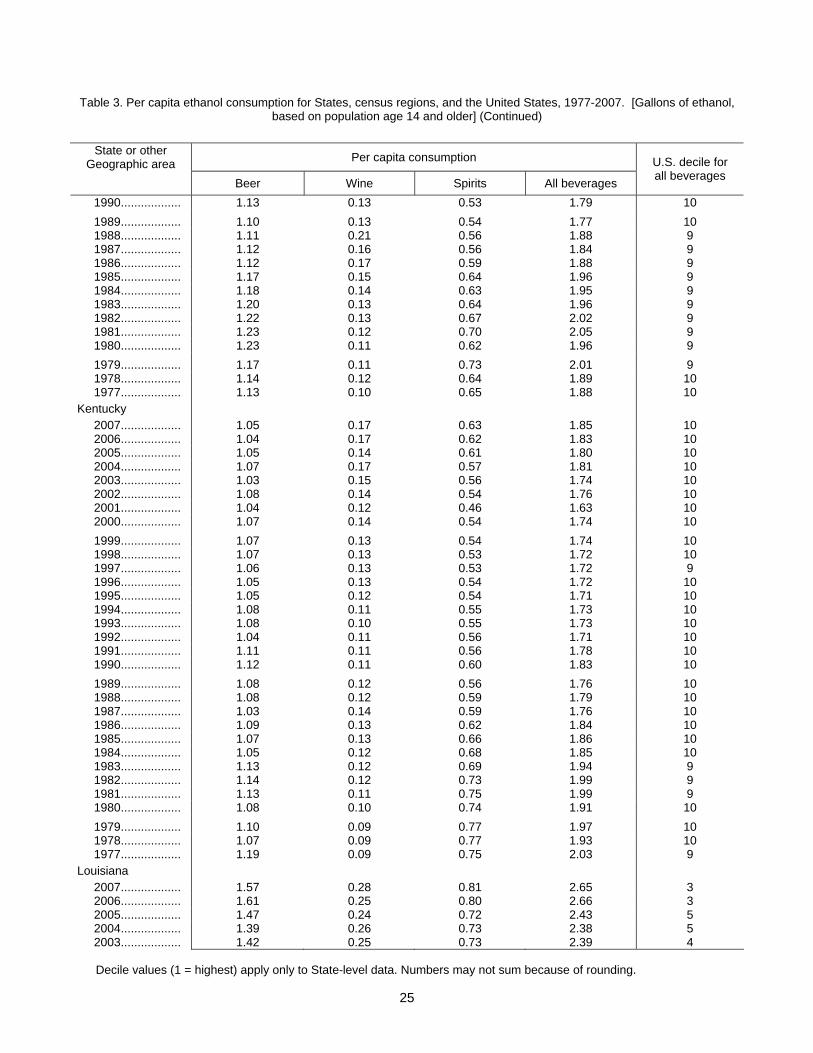
Table 3. Per capita ethanol consumption for States, census regions, and the United States, 1977-2007. [Gallons of ethanol, based on population age 14 and older] (Continued)
State or other Geographic area Per capita consumption
Beer Wine Spirits
U.S. decile for
All beverages all beverages
1990.................. 1.13 0.13 0.53 1.79 10 1989.................. 1.10 0.13 0.54 1.77 10 1988.................. 1.11 0.21 0.56 1.88 9 1987.................. 1.12 0.16 0.56 1.84 9 1986.................. 1.12 0.17 0.59 1.88 9 1985.................. 1.17 0.15 0.64 1.96 9 1984.................. 1.18 0.14 0.63 1.95 9 1983.................. 1.20 0.13 0.64 1.96 9 1982.................. 1.22 0.13 0.67 2.02 9 1981.................. 1.23 0.12 0.70 2.05 9 1980.................. 1.23 0.11 0.62 1.96 9 1979.................. 1.17 0.11 0.73 2.01 9 1978.................. 1.14 0.12 0.64 1.89 10 1977.................. 1.13 0.10 0.65 1.88 10
Kentucky 2007.................. 1.05 0.17 0.63 1.85 10 2006.................. 1.04 0.17 0.62 1.83 10 2005.................. 1.05 0.14 0.61 1.80 10 2004.................. 1.07 0.17 0.57 1.81 10 2003.................. 1.03 0.15 0.56 1.74 10 2002.................. 1.08 0.14 0.54 1.76 10 2001.................. 1.04 0.12 0.46 1.63 10 2000.................. 1.07 0.14 0.54 1.74 10 1999.................. 1.07 0.13 0.54 1.74 10 1998.................. 1.07 0.13 0.53 1.72 10 1997.................. 1.06 0.13 0.53 1.72 9 1996.................. 1.05 0.13 0.54 1.72 10 1995.................. 1.05 0.12 0.54 1.71 10 1994.................. 1.08 0.11 0.55 1.73 10 1993.................. 1.08 0.10 0.55 1.73 10 1992.................. 1.04 0.11 0.56 1.71 10 1991.................. 1.11 0.11 0.56 1.78 10 1990.................. 1.12 0.11 0.60 1.83 10 1989.................. 1.08 0.12 0.56 1.76 10 1988.................. 1.08 0.12 0.59 1.79 10 1987.................. 1.03 0.14 0.59 1.76 10 1986.................. 1.09 0.13 0.62 1.84 10 1985.................. 1.07 0.13 0.66 1.86 10 1984.................. 1.05 0.12 0.68 1.85 10 1983.................. 1.13 0.12 0.69 1.94 9 1982.................. 1.14 0.12 0.73 1.99 9 1981.................. 1.13 0.11 0.75 1.99 9 1980.................. 1.08 0.10 0.74 1.91 10 1979.................. 1.10 0.09 0.77 1.97 10 1978.................. 1.07 0.09 0.77 1.93 10 1977.................. 1.19 0.09 0.75 2.03 9
Louisiana 2007.................. 1.57 0.28 0.81 2.65 3 2006.................. 1.61 0.25 0.80 2.66 3 2005.................. 1.47 0.24 0.72 2.43 5 2004.................. 1.39 0.26 0.73 2.38 5 2003.................. 1.42 0.25 0.73 2.39 4
Decile values (1 = highest) apply only to State-level data. Numbers may not sum because of rounding.
25
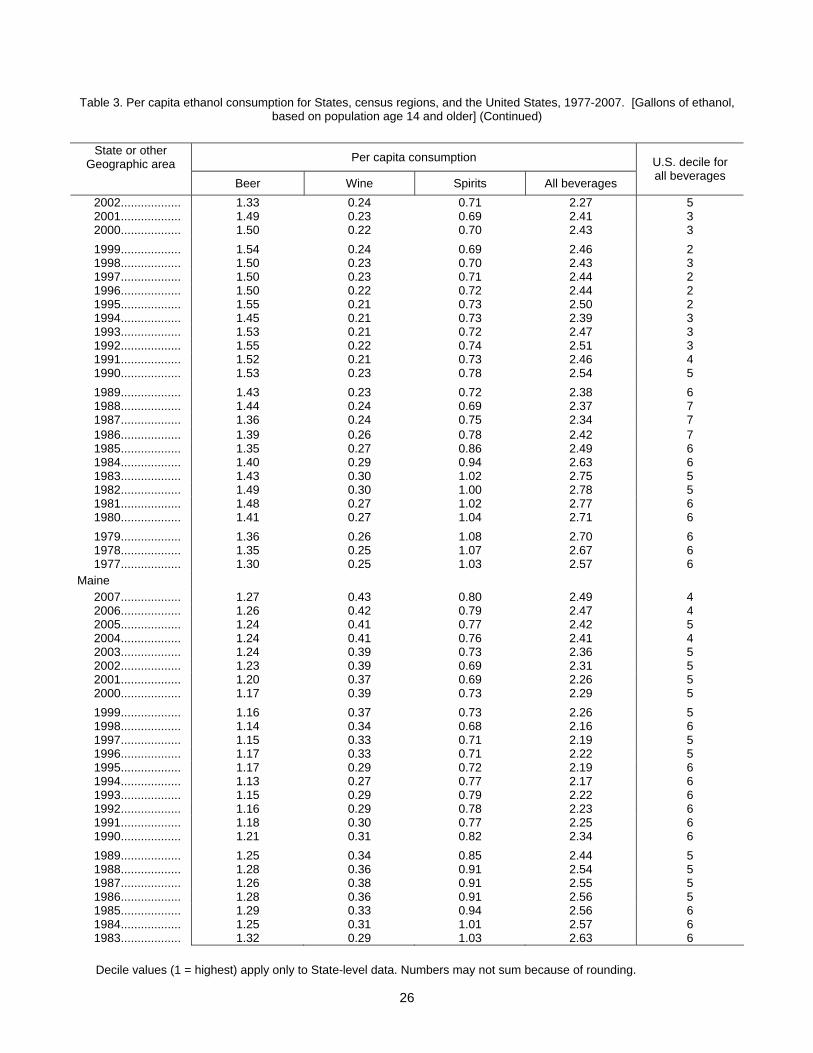
Table 3. Per capita ethanol consumption for States, census regions, and the United States, 1977-2007. [Gallons of ethanol, based on population age 14 and older] (Continued)
State or other Geographic area Per capita consumption
Beer Wine Spirits
U.S. decile for
All beverages all beverages
2002.................. 1.33 0.24 0.71 2.27 5 2001.................. 1.49 0.23 0.69 2.41 3 2000.................. 1.50 0.22 0.70 2.43 3 1999.................. 1.54 0.24 0.69 2.46 2 1998.................. 1.50 0.23 0.70 2.43 3 1997.................. 1.50 0.23 0.71 2.44 2 1996.................. 1.50 0.22 0.72 2.44 2 1995.................. 1.55 0.21 0.73 2.50 2 1994.................. 1.45 0.21 0.73 2.39 3 1993.................. 1.53 0.21 0.72 2.47 3 1992.................. 1.55 0.22 0.74 2.51 3 1991.................. 1.52 0.21 0.73 2.46 4 1990.................. 1.53 0.23 0.78 2.54 5 1989.................. 1.43 0.23 0.72 2.38 6 1988.................. 1.44 0.24 0.69 2.37 7 1987.................. 1.36 0.24 0.75 2.34 7 1986.................. 1.39 0.26 0.78 2.42 7 1985.................. 1.35 0.27 0.86 2.49 6 1984.................. 1.40 0.29 0.94 2.63 6 1983.................. 1.43 0.30 1.02 2.75 5 1982.................. 1.49 0.30 1.00 2.78 5 1981.................. 1.48 0.27 1.02 2.77 6 1980.................. 1.41 0.27 1.04 2.71 6 1979.................. 1.36 0.26 1.08 2.70 6 1978.................. 1.35 0.25 1.07 2.67 6 1977.................. 1.30 0.25 1.03 2.57 6
Maine 2007.................. 1.27 0.43 0.80 2.49 4 2006.................. 1.26 0.42 0.79 2.47 4 2005.................. 1.24 0.41 0.77 2.42 5 2004.................. 1.24 0.41 0.76 2.41 4 2003.................. 1.24 0.39 0.73 2.36 5 2002.................. 1.23 0.39 0.69 2.31 5 2001.................. 1.20 0.37 0.69 2.26 5 2000.................. 1.17 0.39 0.73 2.29 5 1999.................. 1.16 0.37 0.73 2.26 5 1998.................. 1.14 0.34 0.68 2.16 6 1997.................. 1.15 0.33 0.71 2.19 5 1996.................. 1.17 0.33 0.71 2.22 5 1995.................. 1.17 0.29 0.72 2.19 6 1994.................. 1.13 0.27 0.77 2.17 6 1993.................. 1.15 0.29 0.79 2.22 6 1992.................. 1.16 0.29 0.78 2.23 6 1991.................. 1.18 0.30 0.77 2.25 6 1990.................. 1.21 0.31 0.82 2.34 6 1989.................. 1.25 0.34 0.85 2.44 5 1988.................. 1.28 0.36 0.91 2.54 5 1987.................. 1.26 0.38 0.91 2.55 5 1986.................. 1.28 0.36 0.91 2.56 5 1985.................. 1.29 0.33 0.94 2.56 6 1984.................. 1.25 0.31 1.01 2.57 6 1983.................. 1.32 0.29 1.03 2.63 6
Decile values (1 = highest) apply only to State-level data. Numbers may not sum because of rounding.
26
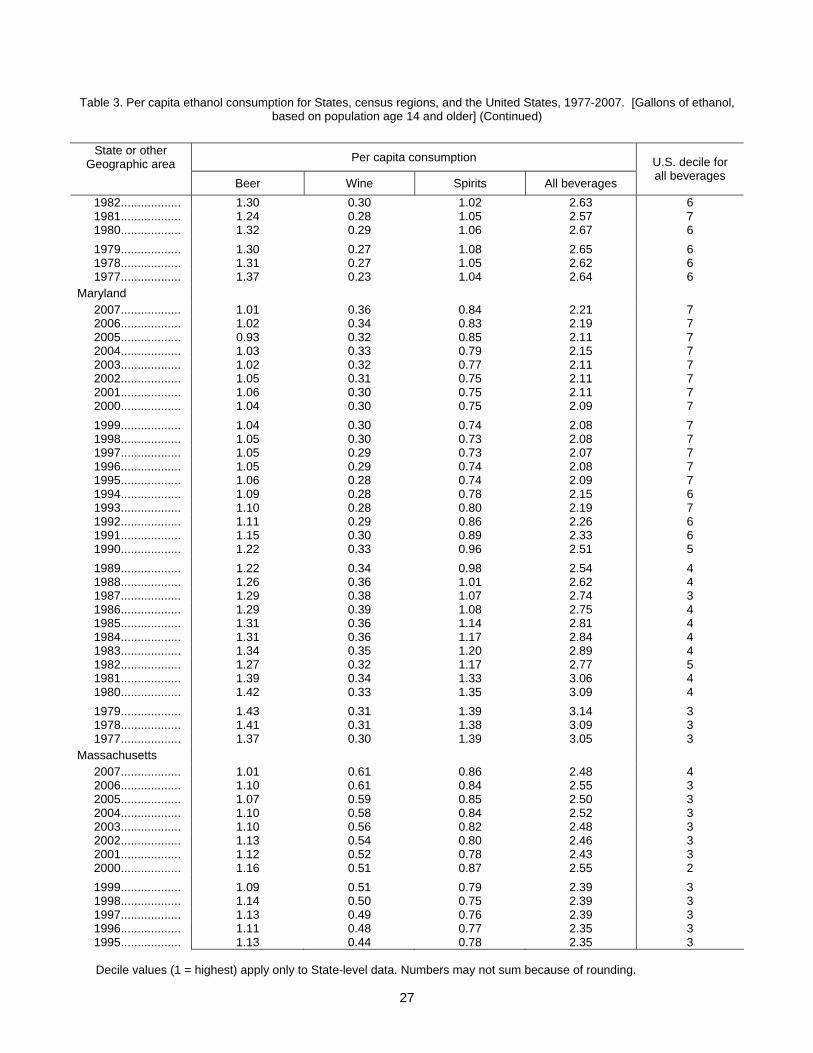
Table 3. Per capita ethanol consumption for States, census regions, and the United States, 1977-2007. [Gallons of ethanol, based on population age 14 and older] (Continued)
State or other Geographic area Per capita consumption
Beer Wine Spirits
U.S. decile for
All beverages all beverages
1982.................. 1.30 0.30 1.02 2.63 6 1981.................. 1.24 0.28 1.05 2.57 7 1980.................. 1.32 0.29 1.06 2.67 6 1979.................. 1.30 0.27 1.08 2.65 6 1978.................. 1.31 0.27 1.05 2.62 6 1977.................. 1.37 0.23 1.04 2.64 6
Maryland 2007.................. 1.01 0.36 0.84 2.21 7 2006.................. 1.02 0.34 0.83 2.19 7 2005.................. 0.93 0.32 0.85 2.11 7 2004.................. 1.03 0.33 0.79 2.15 7 2003.................. 1.02 0.32 0.77 2.11 7 2002.................. 1.05 0.31 0.75 2.11 7 2001.................. 1.06 0.30 0.75 2.11 7 2000.................. 1.04 0.30 0.75 2.09 7 1999.................. 1.04 0.30 0.74 2.08 7 1998.................. 1.05 0.30 0.73 2.08 7 1997.................. 1.05 0.29 0.73 2.07 7 1996.................. 1.05 0.29 0.74 2.08 7 1995.................. 1.06 0.28 0.74 2.09 7 1994.................. 1.09 0.28 0.78 2.15 6 1993.................. 1.10 0.28 0.80 2.19 7 1992.................. 1.11 0.29 0.86 2.26 6 1991.................. 1.15 0.30 0.89 2.33 6 1990.................. 1.22 0.33 0.96 2.51 5 1989.................. 1.22 0.34 0.98 2.54 4 1988.................. 1.26 0.36 1.01 2.62 4 1987.................. 1.29 0.38 1.07 2.74 3 1986.................. 1.29 0.39 1.08 2.75 4 1985.................. 1.31 0.36 1.14 2.81 4 1984.................. 1.31 0.36 1.17 2.84 4 1983.................. 1.34 0.35 1.20 2.89 4 1982.................. 1.27 0.32 1.17 2.77 5 1981.................. 1.39 0.34 1.33 3.06 4 1980.................. 1.42 0.33 1.35 3.09 4 1979.................. 1.43 0.31 1.39 3.14 3 1978.................. 1.41 0.31 1.38 3.09 3 1977.................. 1.37 0.30 1.39 3.05 3
Massachusetts 2007.................. 1.01 0.61 0.86 2.48 4 2006.................. 1.10 0.61 0.84 2.55 3 2005.................. 1.07 0.59 0.85 2.50 3 2004.................. 1.10 0.58 0.84 2.52 3 2003.................. 1.10 0.56 0.82 2.48 3 2002.................. 1.13 0.54 0.80 2.46 3 2001.................. 1.12 0.52 0.78 2.43 3 2000.................. 1.16 0.51 0.87 2.55 2 1999.................. 1.09 0.51 0.79 2.39 3 1998.................. 1.14 0.50 0.75 2.39 3 1997.................. 1.13 0.49 0.76 2.39 3 1996.................. 1.11 0.48 0.77 2.35 3 1995.................. 1.13 0.44 0.78 2.35 3
Decile values (1 = highest) apply only to State-level data. Numbers may not sum because of rounding.
27

Table 3. Per capita ethanol consumption for States, census regions, and the United States, 1977-2007. [Gallons of ethanol, based on population age 14 and older] (Continued)
State or other Geographic area Per capita consumption
Beer Wine Spirits
U.S. decile for
All beverages all beverages
1994.................. 1.14 0.44 0.80 2.38 3 1993.................. 1.14 0.44 0.80 2.38 4 1992.................. 1.12 0.44 0.82 2.38 5 1991.................. 1.19 0.43 0.87 2.49 3 1990.................. 1.22 0.45 0.97 2.63 3 1989.................. 1.26 0.47 1.02 2.75 3 1988.................. 1.29 0.50 1.07 2.86 3 1987.................. 1.29 0.51 1.12 2.93 3 1986.................. 1.31 0.53 1.12 2.96 3 1985.................. 1.30 0.51 1.21 3.01 3 1984.................. 1.30 0.51 1.24 3.04 3 1983.................. 1.36 0.50 1.21 3.07 3 1982.................. 1.35 0.49 1.22 3.07 3 1981.................. 1.44 0.49 1.24 3.17 3 1980.................. 1.47 0.45 1.27 3.19 3 1979.................. 1.39 0.42 1.23 3.04 4 1978.................. 1.37 0.40 1.25 3.02 4 1977.................. 1.34 0.37 1.24 2.95 3
Michigan 2007.................. 1.11 0.30 0.78 2.19 7 2006.................. 1.12 0.29 0.76 2.17 7 2005.................. 1.14 0.28 0.75 2.17 7 2004.................. 1.15 0.28 0.72 2.15 7 2003.................. 1.17 0.26 0.70 2.13 7 2002.................. 1.16 0.23 0.68 2.07 7 2001.................. 1.19 0.24 0.68 2.10 7 2000.................. 1.19 0.24 0.69 2.12 7 1999.................. 1.19 0.24 0.68 2.11 7 1998.................. 1.20 0.22 0.69 2.12 7 1997.................. 1.17 0.22 0.66 2.06 7 1996.................. 1.20 0.22 0.67 2.08 7 1995.................. 1.20 0.19 0.66 2.06 7 1994.................. 1.23 0.20 0.67 2.10 7 1993.................. 1.25 0.20 0.72 2.18 7 1992.................. 1.26 0.22 0.74 2.21 7 1991.................. 1.30 0.22 0.74 2.26 6 1990.................. 1.33 0.28 0.80 2.42 6 1989.................. 1.29 0.30 0.80 2.38 6 1988.................. 1.31 0.32 0.84 2.47 6 1987.................. 1.32 0.33 0.85 2.50 6 1986.................. 1.33 0.33 0.90 2.56 5 1985.................. 1.30 0.32 0.95 2.58 6 1984.................. 1.32 0.31 0.97 2.60 6 1983.................. 1.35 0.28 0.97 2.60 6 1982.................. 1.35 0.39 0.98 2.72 6 1981.................. 1.34 0.29 1.00 2.63 6 1980.................. 1.34 0.28 1.03 2.65 6 1979.................. 1.37 0.25 1.03 2.65 6 1978.................. 1.43 0.25 1.05 2.74 5 1977.................. 1.45 0.24 1.02 2.71 5
Minnesota 2007.................. 1.16 0.32 0.97 2.45 5
Decile values (1 = highest) apply only to State-level data. Numbers may not sum because of rounding.
28
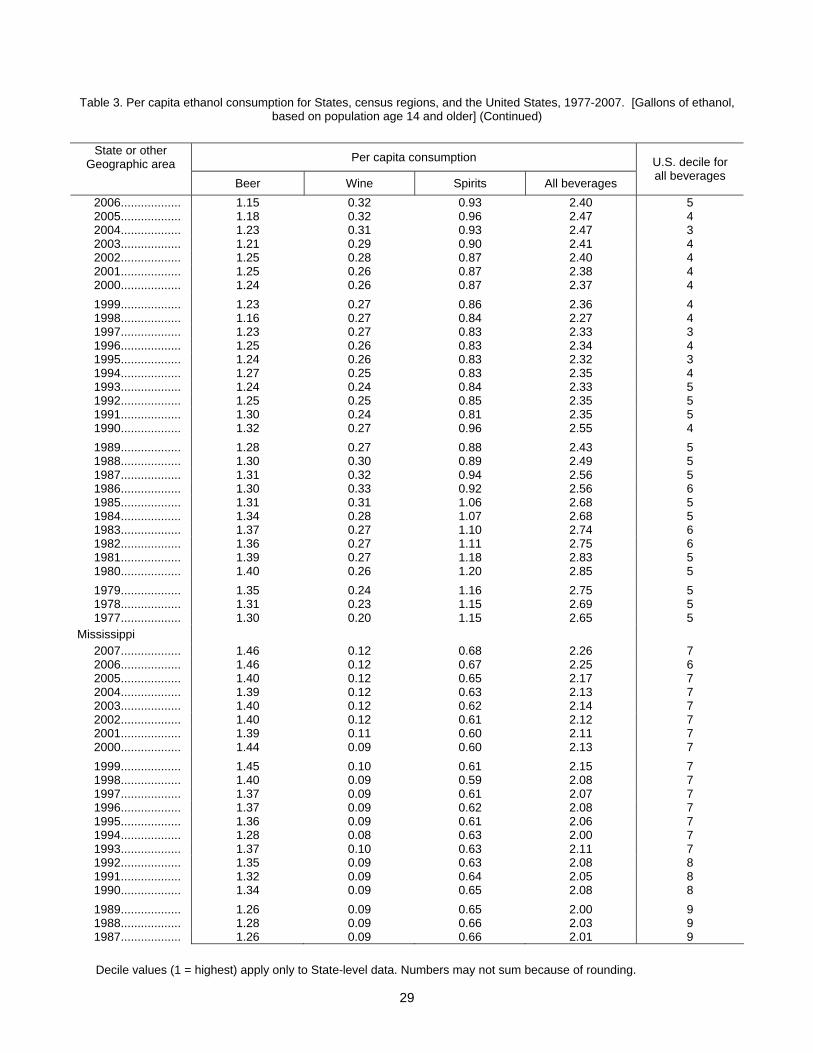
Table 3. Per capita ethanol consumption for States, census regions, and the United States, 1977-2007. [Gallons of ethanol, based on population age 14 and older] (Continued)
State or other Geographic area Per capita consumption
Beer Wine Spirits
U.S. decile for
All beverages all beverages
2006.................. 1.15 0.32 0.93 2.40 5 2005.................. 1.18 0.32 0.96 2.47 4 2004.................. 1.23 0.31 0.93 2.47 3 2003.................. 1.21 0.29 0.90 2.41 4 2002.................. 1.25 0.28 0.87 2.40 4 2001.................. 1.25 0.26 0.87 2.38 4 2000.................. 1.24 0.26 0.87 2.37 4 1999.................. 1.23 0.27 0.86 2.36 4 1998.................. 1.16 0.27 0.84 2.27 4 1997.................. 1.23 0.27 0.83 2.33 3 1996.................. 1.25 0.26 0.83 2.34 4 1995.................. 1.24 0.26 0.83 2.32 3 1994.................. 1.27 0.25 0.83 2.35 4 1993.................. 1.24 0.24 0.84 2.33 5 1992.................. 1.25 0.25 0.85 2.35 5 1991.................. 1.30 0.24 0.81 2.35 5 1990.................. 1.32 0.27 0.96 2.55 4 1989.................. 1.28 0.27 0.88 2.43 5 1988.................. 1.30 0.30 0.89 2.49 5 1987.................. 1.31 0.32 0.94 2.56 5 1986.................. 1.30 0.33 0.92 2.56 6 1985.................. 1.31 0.31 1.06 2.68 5 1984.................. 1.34 0.28 1.07 2.68 5 1983.................. 1.37 0.27 1.10 2.74 6 1982.................. 1.36 0.27 1.11 2.75 6 1981.................. 1.39 0.27 1.18 2.83 5 1980.................. 1.40 0.26 1.20 2.85 5 1979.................. 1.35 0.24 1.16 2.75 5 1978.................. 1.31 0.23 1.15 2.69 5 1977.................. 1.30 0.20 1.15 2.65 5
Mississippi 2007.................. 1.46 0.12 0.68 2.26 7 2006.................. 1.46 0.12 0.67 2.25 6 2005.................. 1.40 0.12 0.65 2.17 7 2004.................. 1.39 0.12 0.63 2.13 7 2003.................. 1.40 0.12 0.62 2.14 7 2002.................. 1.40 0.12 0.61 2.12 7 2001.................. 1.39 0.11 0.60 2.11 7 2000.................. 1.44 0.09 0.60 2.13 7 1999.................. 1.45 0.10 0.61 2.15 7 1998.................. 1.40 0.09 0.59 2.08 7 1997.................. 1.37 0.09 0.61 2.07 7 1996.................. 1.37 0.09 0.62 2.08 7 1995.................. 1.36 0.09 0.61 2.06 7 1994.................. 1.28 0.08 0.63 2.00 7 1993.................. 1.37 0.10 0.63 2.11 7 1992.................. 1.35 0.09 0.63 2.08 8 1991.................. 1.32 0.09 0.64 2.05 8 1990.................. 1.34 0.09 0.65 2.08 8 1989.................. 1.26 0.09 0.65 2.00 9 1988.................. 1.28 0.09 0.66 2.03 9 1987.................. 1.26 0.09 0.66 2.01 9
Decile values (1 = highest) apply only to State-level data. Numbers may not sum because of rounding.
29
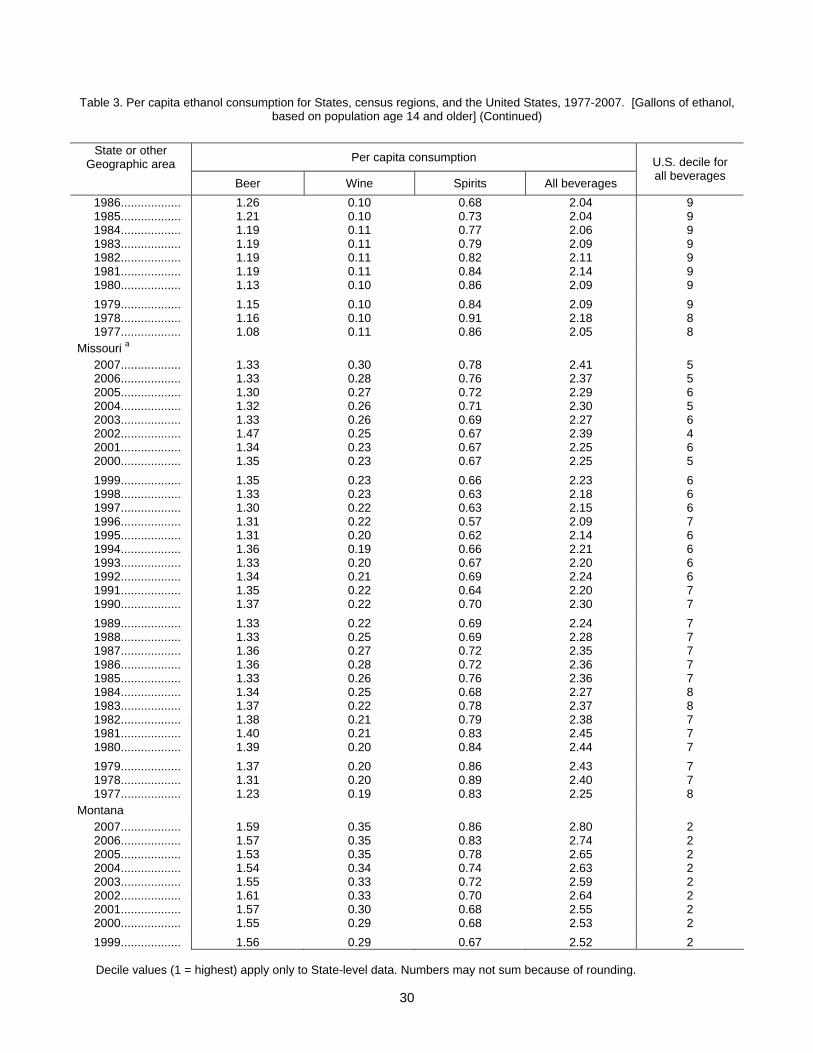
Table 3. Per capita ethanol consumption for States, census regions, and the United States, 1977-2007. [Gallons of ethanol, based on population age 14 and older] (Continued)
State or other Geographic area Per capita consumption
Beer Wine Spirits
U.S. decile for
All beverages all beverages
1986.................. 1.26 0.10 0.68 2.04 9 1985.................. 1.21 0.10 0.73 2.04 9 1984.................. 1.19 0.11 0.77 2.06 9 1983.................. 1.19 0.11 0.79 2.09 9 1982.................. 1.19 0.11 0.82 2.11 9 1981.................. 1.19 0.11 0.84 2.14 9 1980.................. 1.13 0.10 0.86 2.09 9 1979.................. 1.15 0.10 0.84 2.09 9 1978.................. 1.16 0.10 0.91 2.18 8 1977.................. 1.08 0.11 0.86 2.05 8
Missouri a 2007.................. 1.33 0.30 0.78 2.41 5 2006.................. 1.33 0.28 0.76 2.37 5 2005.................. 1.30 0.27 0.72 2.29 6 2004.................. 1.32 0.26 0.71 2.30 5 2003.................. 1.33 0.26 0.69 2.27 6 2002.................. 1.47 0.25 0.67 2.39 4 2001.................. 1.34 0.23 0.67 2.25 6 2000.................. 1.35 0.23 0.67 2.25 5 1999.................. 1.35 0.23 0.66 2.23 6 1998.................. 1.33 0.23 0.63 2.18 6 1997.................. 1.30 0.22 0.63 2.15 6 1996.................. 1.31 0.22 0.57 2.09 7 1995.................. 1.31 0.20 0.62 2.14 6 1994.................. 1.36 0.19 0.66 2.21 6 1993.................. 1.33 0.20 0.67 2.20 6 1992.................. 1.34 0.21 0.69 2.24 6 1991.................. 1.35 0.22 0.64 2.20 7 1990.................. 1.37 0.22 0.70 2.30 7 1989.................. 1.33 0.22 0.69 2.24 7 1988.................. 1.33 0.25 0.69 2.28 7 1987.................. 1.36 0.27 0.72 2.35 7 1986.................. 1.36 0.28 0.72 2.36 7 1985.................. 1.33 0.26 0.76 2.36 7 1984.................. 1.34 0.25 0.68 2.27 8 1983.................. 1.37 0.22 0.78 2.37 8 1982.................. 1.38 0.21 0.79 2.38 7 1981.................. 1.40 0.21 0.83 2.45 7 1980.................. 1.39 0.20 0.84 2.44 7 1979.................. 1.37 0.20 0.86 2.43 7 1978.................. 1.31 0.20 0.89 2.40 7 1977.................. 1.23 0.19 0.83 2.25 8
Montana 2007.................. 1.59 0.35 0.86 2.80 2 2006.................. 1.57 0.35 0.83 2.74 2 2005.................. 1.53 0.35 0.78 2.65 2 2004.................. 1.54 0.34 0.74 2.63 2 2003.................. 1.55 0.33 0.72 2.59 2 2002.................. 1.61 0.33 0.70 2.64 2 2001.................. 1.57 0.30 0.68 2.55 2 2000.................. 1.55 0.29 0.68 2.53 2 1999.................. 1.56 0.29 0.67 2.52 2
Decile values (1 = highest) apply only to State-level data. Numbers may not sum because of rounding.
30

Table 3. Per capita ethanol consumption for States, census regions, and the United States, 1977-2007. [Gallons of ethanol, based on population age 14 and older] (Continued)
State or other Geographic area Per capita consumption
Beer Wine Spirits All beverages
U.S. decile for all beverages
1998.................. 1.51 0.28 0.65 2.44 2 1997.................. 1.49 0.29 0.63 2.42 3 1996.................. 1.49 0.27 0.64 2.40 3 1995.................. 1.49 0.26 0.78 2.54 2 1994.................. 1.57 0.24 0.70 2.51 2 1993.................. 1.49 0.25 0.73 2.47 3 1992.................. 1.59 0.26 0.75 2.61 2 1991.................. 1.61 0.28 0.76 2.64 3 1990.................. 1.60 0.29 0.77 2.67 3 1989.................. 1.56 0.29 0.72 2.57 4 1988.................. 1.59 0.32 0.76 2.66 4 1987.................. 1.57 0.33 0.77 2.67 4 1986.................. 1.58 0.34 0.81 2.73 4 1985.................. 1.60 0.33 0.88 2.81 4 1984.................. 1.70 0.32 0.93 2.95 3 1983.................. 1.79 0.32 0.99 3.09 3 1982.................. 1.82 0.32 1.02 3.17 3 1981.................. 1.90 0.33 1.05 3.28 3 1980.................. 1.82 0.35 1.04 3.21 3 1979.................. 1.83 0.41 1.05 3.29 3 1978.................. 1.82 0.20 1.07 3.10 3 1977.................. 1.83 0.20 1.10 3.12 3
Nebraska 2007.................. 1.45 0.21 0.67 2.33 6 2006.................. 1.43 0.21 0.71 2.35 6 2005.................. 1.41 0.20 0.68 2.29 5 2004.................. 1.43 0.19 0.64 2.26 6 2003.................. 1.42 0.18 0.63 2.23 6 2002.................. 1.45 0.17 0.61 2.23 6 2001.................. 1.43 0.16 0.60 2.19 6 2000.................. 1.44 0.17 0.62 2.23 6 1999.................. 1.42 0.17 0.60 2.19 6 1998.................. 1.39 0.18 0.58 2.16 6 1997.................. 1.35 0.18 0.56 2.09 7 1996.................. 1.35 0.18 0.57 2.11 6 1995.................. 1.35 0.19 0.57 2.10 7 1994.................. 1.39 0.18 0.57 2.14 7 1993.................. 1.37 0.18 0.59 2.14 7 1992.................. 1.37 0.18 0.61 2.16 7 1991.................. 1.40 0.18 0.61 2.19 7 1990.................. 1.41 0.20 0.64 2.25 7 1989.................. 1.37 0.19 0.62 2.18 7 1988.................. 1.37 0.22 0.65 2.23 7 1987.................. 1.40 0.22 0.65 2.27 7 1986.................. 1.38 0.23 0.67 2.28 7 1985.................. 1.40 0.22 0.75 2.37 7 1984.................. 1.44 0.20 0.76 2.41 7 1983.................. 1.49 0.21 0.79 2.49 7 1982.................. 1.50 0.28 0.58 2.37 7 1981.................. 1.57 0.20 0.88 2.66 6 1980.................. 1.56 0.19 0.89 2.64 6 1979.................. 1.50 0.18 0.88 2.57 7
Decile values (1 = highest) apply only to State-level data. Numbers may not sum because of rounding.
31

Table 3. Per capita ethanol consumption for States, census regions, and the United States, 1977-2007. [Gallons of ethanol, based on population age 14 and older] (Continued)
State or other Geographic area Per capita consumption
Beer Wine Spirits All beverages
U.S. decile for all beverages
1978.................. 1.47 0.18 0.89 2.54 7 1977.................. 1.45 0.17 0.91 2.53 6
Nevada 2007.................. 1.71 0.64 1.27 3.61 1 2006.................. 1.74 0.66 1.30 3.70 1 2005.................. 1.71 0.62 1.23 3.56 1 2004.................. 1.75 0.64 1.26 3.66 1 2003.................. 1.76 0.62 1.25 3.63 1 2002.................. 1.75 0.61 1.24 3.60 1 2001.................. 1.81 0.60 1.22 3.63 1 2000.................. 1.79 0.62 1.26 3.67 1 1999.................. 1.82 0.63 1.29 3.74 1 1998.................. 1.80 0.58 1.23 3.62 1 1997.................. 1.84 0.58 1.30 3.72 1 1996.................. 1.91 0.59 1.39 3.89 1 1995.................. 1.87 0.58 1.39 3.84 1 1994.................. 1.93 0.57 1.51 4.00 1 1993.................. 1.95 0.58 1.54 4.06 1 1992.................. 2.02 0.62 1.61 4.25 1 1991.................. 2.05 0.63 1.63 4.31 1 1990.................. 2.17 0.69 1.92 4.78 1 1989.................. 2.18 0.73 1.92 4.83 1 1988.................. 2.13 0.78 2.00 4.91 1 1987.................. 2.05 0.84 2.09 4.99 1 1986.................. 2.07 0.88 2.11 5.05 1 1985.................. 1.96 0.84 2.18 4.99 1 1984.................. 2.01 0.82 2.36 5.19 1 1983.................. 1.98 0.79 2.45 5.22 1 1982.................. 1.99 0.77 2.50 5.25 1 1981.................. 2.08 0.80 2.71 5.59 1 1980.................. 2.09 0.79 2.94 5.82 1 1979.................. 2.28 0.88 3.28 6.44 1 1978.................. 2.20 0.85 3.65 6.69 1 1977.................. 2.15 0.83 3.85 6.84 1
New Hampshire 2007.................. 1.74 0.74 1.75 4.22 1 2006.................. 1.73 0.72 1.76 4.21 1 2005.................. 1.72 0.71 1.68 4.11 1 2004.................. 1.71 0.70 1.65 4.07 1 2003.................. 1.72 0.70 1.61 4.03 1 2002.................. 1.73 0.69 1.63 4.05 1 2001.................. 1.74 0.65 1.61 4.00 1 2000.................. 1.75 0.56 1.69 4.00 1 1999.................. 1.75 0.56 1.70 4.01 1 1998.................. 1.72 0.54 1.73 3.98 1 1997.................. 1.73 0.55 1.76 4.04 1 1996.................. 1.73 0.55 1.85 4.13 1 1995.................. 1.74 0.51 1.87 4.12 1 1994.................. 1.75 0.48 1.90 4.13 1 1993.................. 1.83 0.54 2.01 4.38 1 1992.................. 1.81 0.52 1.96 4.30 1 1991.................. 1.85 0.49 1.96 4.30 1
Decile values (1 = highest) apply only to State-level data. Numbers may not sum because of rounding.
32

Table 3. Per capita ethanol consumption for States, census regions, and the United States, 1977-2007. [Gallons of ethanol, based on population age 14 and older] (Continued)
State or other Geographic area Per capita consumption
Beer Wine Spirits All beverages
U.S. decile for all beverages
1990.................. 1.85 0.49 1.97 4.30 1 1989.................. 1.87 0.50 1.99 4.37 1 1988.................. 1.91 0.49 1.94 4.33 1 1987.................. 1.93 0.50 1.98 4.41 1 1986.................. 1.93 0.52 2.06 4.51 1 1985.................. 1.99 0.53 2.21 4.73 1 1984.................. 1.99 0.59 2.33 4.91 1 1983.................. 2.17 0.56 2.35 5.08 1 1982.................. 1.89 0.58 2.34 4.81 1 1981.................. 1.89 0.59 2.44 4.92 1 1980.................. 2.21 0.69 2.86 5.76 1 1979.................. 1.98 0.62 2.61 5.20 1 1978.................. 1.99 0.54 2.94 5.46 1 1977.................. 1.89 0.50 2.93 5.32 1
New Jersey 2007.................. 0.93 0.55 0.86 2.34 6 2006.................. 0.94 0.53 0.84 2.32 6 2005.................. 0.95 0.51 0.82 2.28 6 2004.................. 0.96 0.52 0.82 2.29 6 2003.................. 0.95 0.50 0.79 2.24 6 2002.................. 0.98 0.49 0.77 2.24 6 2001.................. 0.99 0.47 0.75 2.20 6 2000.................. 0.96 0.47 0.77 2.19 6 1999.................. 0.97 0.46 0.71 2.14 7 1998.................. 0.98 0.46 0.69 2.12 7 1997.................. 0.98 0.42 0.74 2.15 6 1996.................. 1.00 0.44 0.76 2.20 6 1995.................. 1.03 0.44 0.75 2.22 5 1994.................. 1.04 0.43 0.79 2.27 5 1993.................. 1.07 0.42 0.79 2.29 5 1992.................. 1.07 0.44 0.83 2.34 5 1991.................. 1.09 0.43 0.82 2.34 6 1990.................. 1.15 0.48 0.95 2.58 4 1989.................. 1.13 0.50 0.96 2.59 3 1988.................. 1.15 0.51 0.93 2.58 4 1987.................. 1.18 0.54 1.01 2.72 4 1986.................. 1.18 0.56 1.03 2.77 4 1985.................. 1.18 0.55 1.08 2.81 4 1984.................. 1.19 0.55 1.10 2.83 4 1983.................. 1.21 0.52 1.13 2.86 4 1982.................. 1.22 0.52 1.13 2.87 4 1981.................. 1.22 0.51 1.15 2.87 5 1980.................. 1.23 0.47 1.13 2.83 5 1979.................. 1.18 0.43 1.10 2.71 6 1978.................. 1.17 0.42 1.10 2.69 6 1977.................. 1.16 0.40 1.13 2.69 5
New Mexico 2007.................. 1.41 0.31 0.71 2.43 5 2006.................. 1.38 0.31 0.70 2.39 5 2005.................. 1.48 0.29 0.67 2.44 4 2004.................. 1.45 0.25 0.66 2.35 5 2003.................. 1.52 0.27 0.61 2.40 4
Decile values (1 = highest) apply only to State-level data. Numbers may not sum because of rounding.
33

Table 3. Per capita ethanol consumption for States, census regions, and the United States, 1977-2007. [Gallons of ethanol, based on population age 14 and older] (Continued)
State or other Geographic area Per capita consumption
Beer Wine Spirits All beverages
U.S. decile for all beverages
2002.................. 1.53 0.26 0.61 2.40 3 2001.................. 1.54 0.25 0.61 2.39 3 2000.................. 1.53 0.25 0.61 2.38 3 1999.................. 1.53 0.25 0.59 2.36 4 1998.................. 1.49 0.24 0.58 2.31 4 1997.................. 1.51 0.24 0.58 2.33 3 1996.................. 1.55 0.24 0.59 2.38 3 1995.................. 1.56 0.24 0.60 2.40 3 1994.................. 1.46 0.19 0.60 2.25 5 1993.................. 1.53 0.23 0.63 2.39 3 1992.................. 1.56 0.25 0.66 2.47 4 1991.................. 1.64 0.26 0.64 2.54 3 1990.................. 1.68 0.28 0.68 2.64 3 1989.................. 1.64 0.29 0.65 2.58 4 1988.................. 1.63 0.33 0.67 2.64 4 1987.................. 1.63 0.35 0.67 2.65 4 1986.................. 1.64 0.35 0.70 2.70 4 1985.................. 1.70 0.36 0.77 2.83 4 1984.................. 1.71 0.28 0.76 2.75 5 1983.................. 1.72 0.31 0.98 3.00 4 1982.................. 1.72 0.34 0.94 3.00 4 1981.................. 1.74 0.32 0.95 3.01 4 1980.................. 1.66 0.32 1.00 2.99 4 1979.................. 1.71 0.30 1.01 3.02 4 1978.................. 1.68 0.32 0.98 2.99 4 1977.................. 1.65 0.32 0.96 2.93 4
New York 2007.................. 0.92 0.46 0.68 2.06 8 2006.................. 0.88 0.45 0.65 1.99 9 2005.................. 0.90 0.43 0.64 1.97 8 2004.................. 0.91 0.41 0.62 1.95 9 2003.................. 0.93 0.40 0.61 1.93 9 2002.................. 0.95 0.38 0.59 1.91 9 2001.................. 0.96 0.37 0.56 1.88 9 2000.................. 0.92 0.38 0.58 1.88 9 1999.................. 0.93 0.37 0.56 1.85 9 1998.................. 0.95 0.38 0.51 1.84 9 1997.................. 0.94 0.37 0.57 1.87 8 1996.................. 0.97 0.36 0.57 1.90 8 1995.................. 0.98 0.38 0.57 1.93 8 1994.................. 0.98 0.35 0.60 1.93 8 1993.................. 1.00 0.35 0.62 1.98 8 1992.................. 1.04 0.37 0.68 2.09 8 1991.................. 1.09 0.37 0.69 2.14 7 1990.................. 1.13 0.41 0.76 2.30 7 1989.................. 1.12 0.42 0.82 2.36 7 1988.................. 1.15 0.45 0.87 2.47 6 1987.................. 1.15 0.48 0.90 2.53 5 1986.................. 1.13 0.50 0.92 2.55 6 1985.................. 1.14 0.49 0.98 2.62 5 1984.................. 1.15 0.49 1.03 2.67 5 1983.................. 1.23 0.49 1.05 2.77 5
Decile values (1 = highest) apply only to State-level data. Numbers may not sum because of rounding.
34

Table 3. Per capita ethanol consumption for States, census regions, and the United States, 1977-2007. [Gallons of ethanol, based on population age 14 and older] (Continued)
State or other Geographic area Per capita consumption
Beer Wine Spirits All beverages
U.S. decile for all beverages
1982.................. 1.26 0.48 1.10 2.84 5 1981.................. 1.25 0.46 1.12 2.83 5 1980.................. 1.28 0.46 1.18 2.91 5 1979.................. 1.21 0.44 1.17 2.82 5 1978.................. 1.18 0.42 1.17 2.77 5 1977.................. 1.18 0.38 1.17 2.74 5
North Carolina 2007.................. 1.16 0.28 0.56 2.00 9 2006.................. 1.15 0.27 0.55 1.97 9 2005.................. 1.13 0.27 0.54 1.94 9 2004.................. 1.17 0.27 0.53 1.97 8 2003.................. 1.21 0.27 0.52 2.00 8 2002.................. 1.25 0.27 0.50 2.02 8 2001.................. 1.23 0.25 0.51 2.00 8 2000.................. 1.19 0.23 0.52 1.94 8 1999.................. 1.16 0.24 0.51 1.90 8 1998.................. 1.13 0.23 0.50 1.87 8 1997.................. 1.15 0.23 0.51 1.89 8 1996.................. 1.14 0.24 0.52 1.90 8 1995.................. 1.12 0.22 0.53 1.86 8 1994.................. 1.14 0.21 0.54 1.89 8 1993.................. 1.14 0.22 0.56 1.92 9 1992.................. 1.14 0.23 0.59 1.96 8 1991.................. 1.11 0.24 0.60 1.96 9 1990.................. 1.16 0.27 0.65 2.08 9 1989.................. 1.13 0.27 0.66 2.06 8 1988.................. 1.12 0.28 0.68 2.09 8 1987.................. 1.11 0.28 0.71 2.10 8 1986.................. 1.12 0.30 0.74 2.15 8 1985.................. 1.09 0.27 0.76 2.13 8 1984.................. 1.11 0.24 0.78 2.13 8 1983.................. 1.10 0.22 0.80 2.12 9 1982.................. 1.07 0.21 0.85 2.13 9 1981.................. 1.10 0.21 0.86 2.17 9 1980.................. 1.11 0.20 0.86 2.17 9 1979.................. 1.08 0.22 0.88 2.18 8 1978.................. 1.06 0.20 0.86 2.12 9 1977.................. 1.01 0.20 0.84 2.05 8
North Dakotab 2007.................. 1.57 0.23 1.08 2.88 2 2006.................. 1.52 0.21 1.01 2.74 2 2005.................. 1.51 0.19 0.95 2.65 2 2004.................. 1.50 0.18 0.83 2.50 3 2003.................. 1.54 0.17 0.86 2.56 2 2002.................. 1.51 0.16 0.84 2.51 3 2001.................. 1.46 0.15 0.80 2.41 3 2000.................. 1.47 0.15 0.79 2.41 3 1999.................. 1.49 0.15 0.78 2.42 3 1998.................. 1.45 0.13 0.76 2.35 3 1997.................. 1.40 0.13 0.77 2.30 4 1996.................. 1.40 0.13 0.77 2.29 4 1995.................. 1.35 0.16 0.77 2.28 4
Decile values (1 = highest) apply only to State-level data. Numbers may not sum because of rounding.
35

Table 3. Per capita ethanol consumption for States, census regions, and the United States, 1977-2007. [Gallons of ethanol, based on population age 14 and older] (Continued)
State or other Geographic area Per capita consumption
Beer Wine Spirits All beverages
U.S. decile for all beverages
1994.................. 1.39 0.15 0.78 2.32 4 1993.................. 1.37 0.15 0.84 2.36 4 1992.................. 1.38 0.15 0.85 2.39 5 1991.................. 1.43 0.16 0.86 2.44 4 1990.................. 1.47 0.17 0.93 2.56 4 1989.................. 1.38 0.17 0.84 2.38 6 1988.................. 1.38 0.19 0.86 2.43 6 1987.................. 1.35 0.20 0.87 2.42 6 1986.................. 1.32 0.22 0.86 2.40 7 1985.................. 1.33 0.19 0.96 2.48 7 1984.................. 1.40 0.17 0.98 2.55 6 1983.................. 1.48 0.17 1.05 2.71 6 1982.................. 1.52 0.18 1.09 2.79 5 1981.................. 1.53 0.18 1.14 2.85 5 1980.................. 1.53 0.17 1.14 2.83 5 1979.................. 1.45 0.16 1.10 2.71 6 1978.................. 1.45 0.16 1.15 2.76 5 1977.................. 1.35 0.15 1.12 2.62 6
Ohio 2007.................. 1.33 0.25 0.45 2.03 9 2006.................. 1.32 0.24 0.44 2.00 8 2005.................. 1.31 0.23 0.43 1.97 9 2004.................. 1.33 0.22 0.41 1.96 9 2003.................. 1.33 0.22 0.48 2.03 8 2002.................. 1.34 0.21 0.47 2.02 8 2001.................. 1.33 0.21 0.47 2.00 8 2000.................. 1.30 0.19 0.50 1.99 8 1999.................. 1.32 0.20 0.48 2.00 8 1998.................. 1.31 0.19 0.47 1.97 8 1997.................. 1.28 0.18 0.46 1.91 8 1996.................. 1.30 0.18 0.45 1.93 8 1995.................. 1.28 0.17 0.46 1.90 8 1994.................. 1.31 0.16 0.37 1.85 9 1993.................. 1.29 0.16 0.50 1.95 8 1992.................. 1.32 0.17 0.50 1.98 8 1991.................. 1.33 0.18 0.51 2.03 8 1990.................. 1.34 0.22 0.53 2.09 8 1989.................. 1.35 0.22 0.50 2.07 8 1988.................. 1.34 0.24 0.54 2.11 8 1987.................. 1.35 0.24 0.59 2.17 8 1986.................. 1.32 0.25 0.60 2.17 8 1985.................. 1.37 0.25 0.59 2.20 8 1984.................. 1.41 0.25 0.61 2.26 8 1983.................. 1.36 0.22 0.65 2.22 8 1982.................. 1.40 0.22 0.66 2.28 8 1981.................. 1.35 0.22 0.68 2.25 8 1980.................. 1.39 0.22 0.72 2.33 8 1979.................. 1.36 0.20 0.71 2.26 8 1978.................. 1.19 0.20 0.70 2.09 9 1977.................. 1.17 0.18 0.70 2.04 9
Oklahoma 2007.................. 1.18 0.17 0.58 1.93 9
Decile values (1 = highest) apply only to State-level data. Numbers may not sum because of rounding.
36

Table 3. Per capita ethanol consumption for States, census regions, and the United States, 1977-2007. [Gallons of ethanol, based on population age 14 and older] (Continued)
State or other Geographic area Per capita consumption
Beer Wine Spirits All beverages
U.S. decile for all beverages
2006.................. 0.78 0.17 0.57 1.51 10 2005.................. 0.78 0.16 0.55 1.50 10 2004.................. 0.94 0.13 0.45 1.53 10 2003.................. 1.06 0.13 0.73 1.93 9 2002.................. 1.11 0.13 0.58 1.82 10 2001.................. 1.11 0.12 0.43 1.65 10 2000.................. 1.13 0.12 0.44 1.69 10 1999.................. 1.11 0.12 0.44 1.68 10 1998.................. 1.12 0.12 0.43 1.68 10 1997.................. 1.10 0.12 0.43 1.65 10 1996.................. 1.09 0.12 0.45 1.66 10 1995.................. 1.10 0.12 0.44 1.66 10 1994.................. 1.15 0.13 0.50 1.78 9 1993.................. 1.11 0.11 0.48 1.70 10 1992.................. 1.13 0.13 0.55 1.81 9 1991.................. 1.09 0.13 0.54 1.76 10 1990.................. 1.12 0.14 0.55 1.81 10 1989.................. 1.05 0.13 0.53 1.70 10 1988.................. 1.05 0.14 0.50 1.69 10 1987.................. 1.04 0.15 0.57 1.76 10 1986.................. 1.04 0.15 0.61 1.80 10 1985.................. 1.04 0.15 0.68 1.87 10 1984.................. 1.01 0.16 0.74 1.91 9 1983.................. 1.05 0.16 0.77 1.98 9 1982.................. 1.17 0.16 0.83 2.17 8 1981.................. 1.14 0.16 0.83 2.13 9 1980.................. 1.08 0.16 0.71 1.95 9 1979.................. 1.05 0.13 0.80 1.98 9 1978.................. 1.08 0.14 0.82 2.04 9 1977.................. 1.07 0.14 0.78 1.98 9
Oregon 2007.................. 1.29 0.49 0.81 2.59 3 2006.................. 1.26 0.49 0.78 2.53 4 2005.................. 1.23 0.48 0.74 2.46 4 2004.................. 1.22 0.49 0.71 2.42 4 2003.................. 1.20 0.47 0.68 2.35 5 2002.................. 1.22 0.46 0.66 2.34 5 2001.................. 1.22 0.43 0.65 2.30 5 2000.................. 1.20 0.44 0.64 2.28 5 1999.................. 1.21 0.43 0.63 2.27 5 1998.................. 1.20 0.43 0.61 2.25 5 1997.................. 1.19 0.44 0.60 2.24 5 1996.................. 1.23 0.44 0.61 2.27 5 1995.................. 1.21 0.42 0.59 2.23 5 1994.................. 1.23 0.37 0.62 2.21 6 1993.................. 1.24 0.43 0.64 2.31 5 1992.................. 1.29 0.46 0.67 2.41 4 1991.................. 1.28 0.44 0.67 2.38 5 1990.................. 1.32 0.47 0.73 2.51 5 1989.................. 1.26 0.46 0.69 2.41 6 1988.................. 1.27 0.51 0.71 2.48 5 1987.................. 1.26 0.53 0.72 2.50 6
Decile values (1 = highest) apply only to State-level data. Numbers may not sum because of rounding.
37

Table 3. Per capita ethanol consumption for States, census regions, and the United States, 1977-2007. [Gallons of ethanol, based on population age 14 and older] (Continued)
State or other Geographic area Per capita consumption
Beer Wine Spirits All beverages
U.S. decile for all beverages
1986.................. 1.26 0.54 0.73 2.54 6 1985.................. 1.25 0.55 0.77 2.57 6 1984.................. 1.28 0.53 0.82 2.63 6 1983.................. 1.31 0.53 0.85 2.69 6 1982.................. 1.33 0.53 0.88 2.74 6 1981.................. 1.38 0.50 0.92 2.80 6 1980.................. 1.37 0.51 0.94 2.82 5 1979.................. 1.39 0.47 0.96 2.82 5 1978.................. 1.34 0.47 0.98 2.79 5 1977.................. 1.33 0.46 0.96 2.74 5
Pennsylvania 2007.................. 1.34 0.24 0.59 2.16 8 2006.................. 1.30 0.24 0.57 2.12 8 2005.................. 1.29 0.24 0.55 2.08 8 2004.................. 1.30 0.24 0.54 2.08 8 2003.................. 1.30 0.23 0.51 2.04 8 2002.................. 1.35 0.22 0.49 2.06 8 2001.................. 1.32 0.20 0.48 2.00 8 2000.................. 1.21 0.21 0.47 1.90 9 1999.................. 1.20 0.21 0.46 1.87 9 1998.................. 1.21 0.19 0.45 1.86 9 1997.................. 1.20 0.19 0.44 1.84 9 1996.................. 1.22 0.19 0.45 1.86 9 1995.................. 1.23 0.18 0.45 1.86 9 1994.................. 1.28 0.18 0.47 1.93 8 1993.................. 1.31 0.17 0.48 1.96 8 1992.................. 1.30 0.18 0.51 1.99 8 1991.................. 1.36 0.17 0.52 2.05 8 1990.................. 1.42 0.18 0.55 2.15 8 1989.................. 1.36 0.18 0.56 2.10 7 1988.................. 1.39 0.19 0.53 2.11 8 1987.................. 1.38 0.20 0.61 2.20 8 1986.................. 1.38 0.21 0.64 2.23 8 1985.................. 1.37 0.21 0.65 2.22 8 1984.................. 1.37 0.21 0.66 2.25 8 1983.................. 1.41 0.22 0.67 2.29 8 1982.................. 1.44 0.23 0.70 2.36 8 1981.................. 1.42 0.23 0.72 2.37 8 1980.................. 1.45 0.22 0.71 2.39 7 1979.................. 1.42 0.22 0.73 2.37 8 1978.................. 1.36 0.21 0.74 2.32 8 1977.................. 1.35 0.20 0.74 2.29 8
Rhode Island 2007.................. 1.13 0.54 0.90 2.56 4 2006.................. 1.13 0.53 0.86 2.52 4 2005.................. 1.13 0.51 0.81 2.45 4 2004.................. 1.12 0.49 0.79 2.40 5 2003.................. 1.12 0.51 0.79 2.42 3 2002.................. 1.17 0.48 0.73 2.38 4 2001.................. 1.19 0.46 0.70 2.35 4 2000.................. 1.15 0.46 0.70 2.31 5 1999.................. 1.14 0.45 0.69 2.28 4
Decile values (1 = highest) apply only to State-level data. Numbers may not sum because of rounding.
38
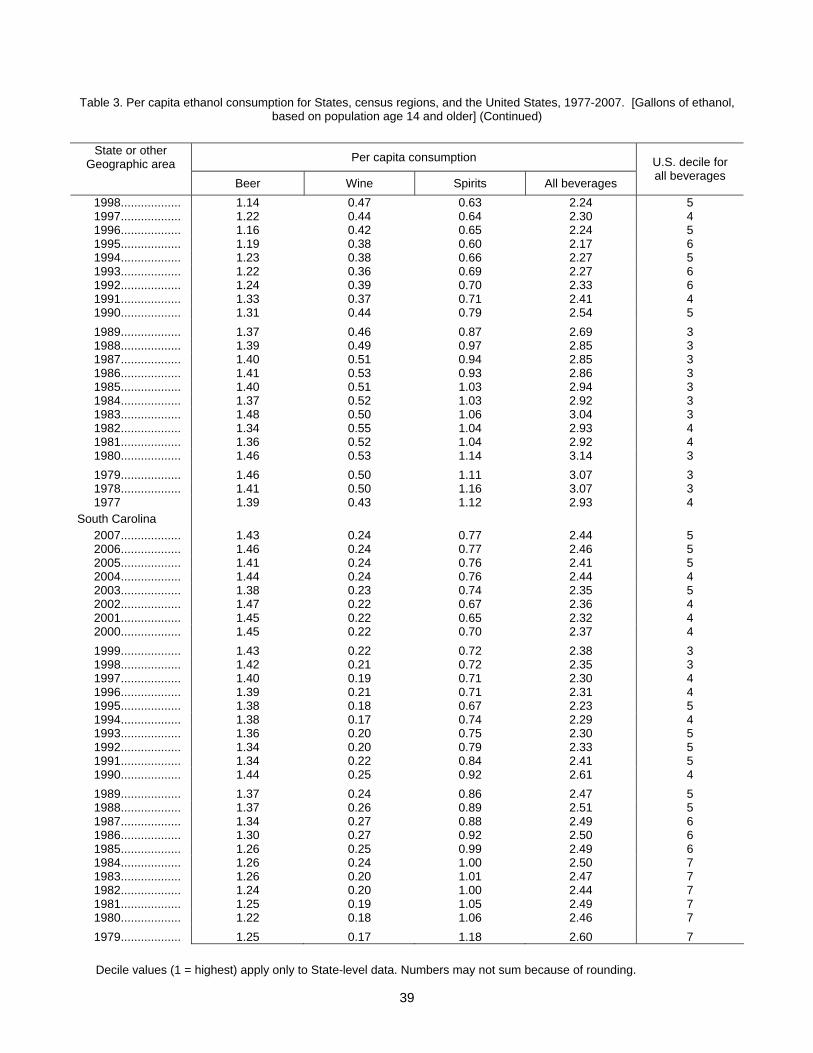
Table 3. Per capita ethanol consumption for States, census regions, and the United States, 1977-2007. [Gallons of ethanol, based on population age 14 and older] (Continued)
State or other Geographic area Per capita consumption
Beer Wine Spirits All beverages
U.S. decile for all beverages
1998.................. 1.14 0.47 0.63 2.24 5 1997.................. 1.22 0.44 0.64 2.30 4 1996.................. 1.16 0.42 0.65 2.24 5 1995.................. 1.19 0.38 0.60 2.17 6 1994.................. 1.23 0.38 0.66 2.27 5 1993.................. 1.22 0.36 0.69 2.27 6 1992.................. 1.24 0.39 0.70 2.33 6 1991.................. 1.33 0.37 0.71 2.41 4 1990.................. 1.31 0.44 0.79 2.54 5 1989.................. 1.37 0.46 0.87 2.69 3 1988.................. 1.39 0.49 0.97 2.85 3 1987.................. 1.40 0.51 0.94 2.85 3 1986.................. 1.41 0.53 0.93 2.86 3 1985.................. 1.40 0.51 1.03 2.94 3 1984.................. 1.37 0.52 1.03 2.92 3 1983.................. 1.48 0.50 1.06 3.04 3 1982.................. 1.34 0.55 1.04 2.93 4 1981.................. 1.36 0.52 1.04 2.92 4 1980.................. 1.46 0.53 1.14 3.14 3 1979.................. 1.46 0.50 1.11 3.07 3 1978.................. 1.41 0.50 1.16 3.07 3 1977 1.39 0.43 1.12 2.93 4
South Carolina 2007.................. 1.43 0.24 0.77 2.44 5 2006.................. 1.46 0.24 0.77 2.46 5 2005.................. 1.41 0.24 0.76 2.41 5 2004.................. 1.44 0.24 0.76 2.44 4 2003.................. 1.38 0.23 0.74 2.35 5 2002.................. 1.47 0.22 0.67 2.36 4 2001.................. 1.45 0.22 0.65 2.32 4 2000.................. 1.45 0.22 0.70 2.37 4 1999.................. 1.43 0.22 0.72 2.38 3 1998.................. 1.42 0.21 0.72 2.35 3 1997.................. 1.40 0.19 0.71 2.30 4 1996.................. 1.39 0.21 0.71 2.31 4 1995.................. 1.38 0.18 0.67 2.23 5 1994.................. 1.38 0.17 0.74 2.29 4 1993.................. 1.36 0.20 0.75 2.30 5 1992.................. 1.34 0.20 0.79 2.33 5 1991.................. 1.34 0.22 0.84 2.41 5 1990.................. 1.44 0.25 0.92 2.61 4 1989.................. 1.37 0.24 0.86 2.47 5 1988.................. 1.37 0.26 0.89 2.51 5 1987.................. 1.34 0.27 0.88 2.49 6 1986.................. 1.30 0.27 0.92 2.50 6 1985.................. 1.26 0.25 0.99 2.49 6 1984.................. 1.26 0.24 1.00 2.50 7 1983.................. 1.26 0.20 1.01 2.47 7 1982.................. 1.24 0.20 1.00 2.44 7 1981.................. 1.25 0.19 1.05 2.49 7 1980.................. 1.22 0.18 1.06 2.46 7 1979.................. 1.25 0.17 1.18 2.60 7
Decile values (1 = highest) apply only to State-level data. Numbers may not sum because of rounding.
39

Table 3. Per capita ethanol consumption for States, census regions, and the United States, 1977-2007. [Gallons of ethanol, based on population age 14 and older] (Continued)
State or other Geographic area Per capita consumption
Beer Wine Spirits All beverages
U.S. decile for all beverages
1978.................. 1.20 0.17 1.21 2.59 7 1977.................. 1.17 0.17 1.14 2.49 7
South Dakota 2007.................. 1.51 0.22 0.86 2.59 4 2006.................. 1.51 0.19 0.79 2.48 4 2005.................. 1.50 0.19 0.83 2.52 3 2004.................. 1.50 0.18 0.76 2.43 4 2003.................. 1.51 0.16 0.73 2.40 4 2002.................. 1.51 0.16 0.70 2.37 4 2001.................. 1.46 0.15 0.71 2.31 4 2000.................. 1.44 0.15 0.68 2.27 5 1999.................. 1.43 0.14 0.70 2.27 5 1998.................. 1.42 0.13 0.68 2.24 5 1997.................. 1.36 0.13 0.69 2.18 6 1996.................. 1.36 0.13 0.68 2.18 6 1995.................. 1.34 0.12 0.73 2.20 6 1994.................. 1.38 0.12 0.73 2.24 5 1993.................. 1.35 0.12 0.73 2.20 6 1992.................. 1.37 0.15 0.74 2.26 6 1991.................. 1.37 0.15 0.76 2.27 6 1990.................. 1.36 0.18 0.80 2.34 6 1989.................. 1.25 0.15 0.70 2.09 8 1988.................. 1.21 0.16 0.76 2.13 8 1987.................. 1.24 0.19 0.79 2.22 8 1986.................. 1.22 0.19 0.81 2.23 8 1985.................. 1.22 0.18 0.94 2.34 8 1984.................. 1.27 0.17 0.89 2.33 7 1983.................. 1.30 0.17 0.95 2.43 7 1982.................. 1.29 0.18 0.98 2.45 7 1981.................. 1.32 0.19 1.05 2.56 7 1980.................. 1.30 0.18 1.07 2.56 7 1979.................. 1.23 0.17 1.04 2.44 7 1978.................. 1.19 0.17 1.05 2.42 7 1977.................. 1.15 0.17 1.06 2.38 7
Tennessee 2007.................. 1.13 0.20 0.56 1.89 10 2006.................. 1.14 0.19 0.56 1.89 9 2005.................. 1.19 0.19 0.55 1.93 9 2004.................. 1.21 0.18 0.53 1.92 9 2003.................. 1.26 0.18 0.52 1.96 9 2002.................. 1.17 0.17 0.51 1.85 9 2001.................. 1.13 0.16 0.50 1.79 9 2000.................. 1.21 0.15 0.50 1.86 9 1999.................. 1.21 0.15 0.49 1.86 9 1998.................. 1.19 0.15 0.50 1.84 9 1997.................. 1.16 0.16 0.50 1.82 9 1996.................. 1.18 0.15 0.51 1.84 9 1995.................. 1.18 0.15 0.52 1.84 9 1994.................. 1.18 0.15 0.53 1.86 9 1993.................. 1.20 0.14 0.54 1.87 9 1992.................. 1.21 0.14 0.56 1.90 9 1991.................. 1.19 0.13 0.54 1.87 9
Decile values (1 = highest) apply only to State-level data. Numbers may not sum because of rounding.
40
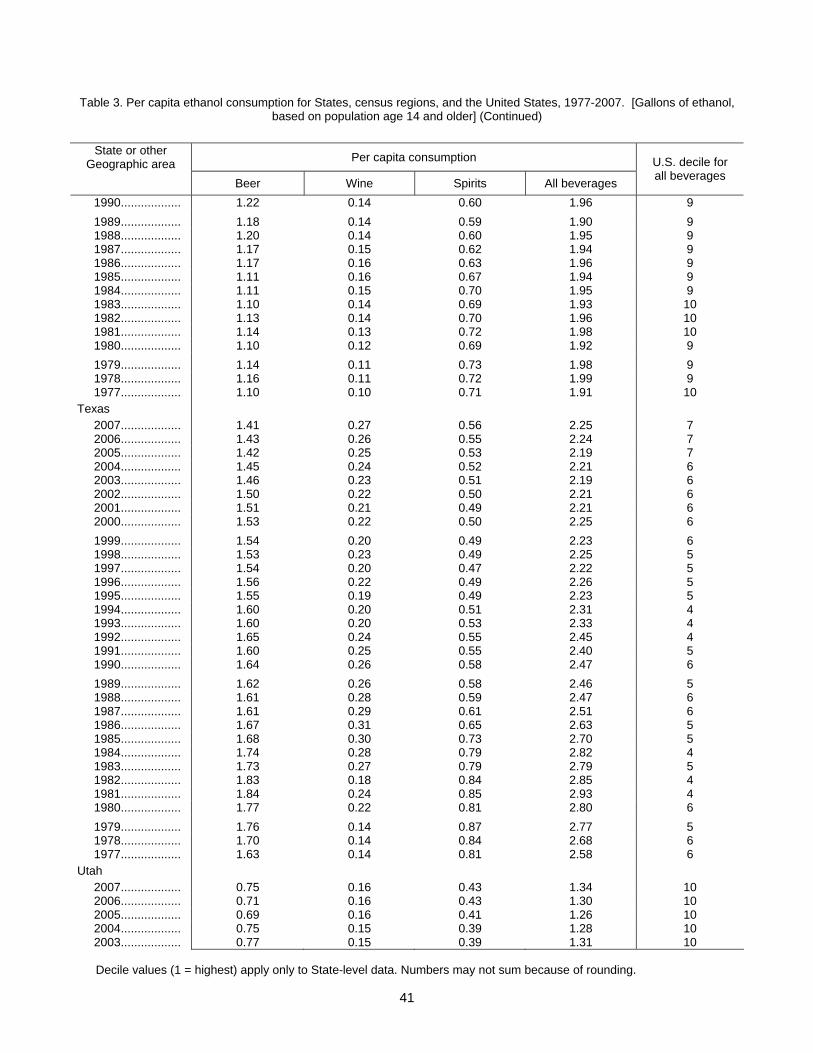
Table 3. Per capita ethanol consumption for States, census regions, and the United States, 1977-2007. [Gallons of ethanol, based on population age 14 and older] (Continued)
State or other Geographic area Per capita consumption
Beer Wine Spirits All beverages
U.S. decile for all beverages
1990.................. 1.22 0.14 0.60 1.96 9 1989.................. 1.18 0.14 0.59 1.90 9 1988.................. 1.20 0.14 0.60 1.95 9 1987.................. 1.17 0.15 0.62 1.94 9 1986.................. 1.17 0.16 0.63 1.96 9 1985.................. 1.11 0.16 0.67 1.94 9 1984.................. 1.11 0.15 0.70 1.95 9 1983.................. 1.10 0.14 0.69 1.93 10 1982.................. 1.13 0.14 0.70 1.96 10 1981.................. 1.14 0.13 0.72 1.98 10 1980.................. 1.10 0.12 0.69 1.92 9 1979.................. 1.14 0.11 0.73 1.98 9 1978.................. 1.16 0.11 0.72 1.99 9 1977.................. 1.10 0.10 0.71 1.91 10
Texas 2007.................. 1.41 0.27 0.56 2.25 7 2006.................. 1.43 0.26 0.55 2.24 7 2005.................. 1.42 0.25 0.53 2.19 7 2004.................. 1.45 0.24 0.52 2.21 6 2003.................. 1.46 0.23 0.51 2.19 6 2002.................. 1.50 0.22 0.50 2.21 6 2001.................. 1.51 0.21 0.49 2.21 6 2000.................. 1.53 0.22 0.50 2.25 6 1999.................. 1.54 0.20 0.49 2.23 6 1998.................. 1.53 0.23 0.49 2.25 5 1997.................. 1.54 0.20 0.47 2.22 5 1996.................. 1.56 0.22 0.49 2.26 5 1995.................. 1.55 0.19 0.49 2.23 5 1994.................. 1.60 0.20 0.51 2.31 4 1993.................. 1.60 0.20 0.53 2.33 4 1992.................. 1.65 0.24 0.55 2.45 4 1991.................. 1.60 0.25 0.55 2.40 5 1990.................. 1.64 0.26 0.58 2.47 6 1989.................. 1.62 0.26 0.58 2.46 5 1988.................. 1.61 0.28 0.59 2.47 6 1987.................. 1.61 0.29 0.61 2.51 6 1986.................. 1.67 0.31 0.65 2.63 5 1985.................. 1.68 0.30 0.73 2.70 5 1984.................. 1.74 0.28 0.79 2.82 4 1983.................. 1.73 0.27 0.79 2.79 5 1982.................. 1.83 0.18 0.84 2.85 4 1981.................. 1.84 0.24 0.85 2.93 4 1980.................. 1.77 0.22 0.81 2.80 6 1979.................. 1.76 0.14 0.87 2.77 5 1978.................. 1.70 0.14 0.84 2.68 6 1977.................. 1.63 0.14 0.81 2.58 6
Utah 2007.................. 0.75 0.16 0.43 1.34 10 2006.................. 0.71 0.16 0.43 1.30 10 2005.................. 0.69 0.16 0.41 1.26 10 2004.................. 0.75 0.15 0.39 1.28 10 2003.................. 0.77 0.15 0.39 1.31 10
Decile values (1 = highest) apply only to State-level data. Numbers may not sum because of rounding.
41
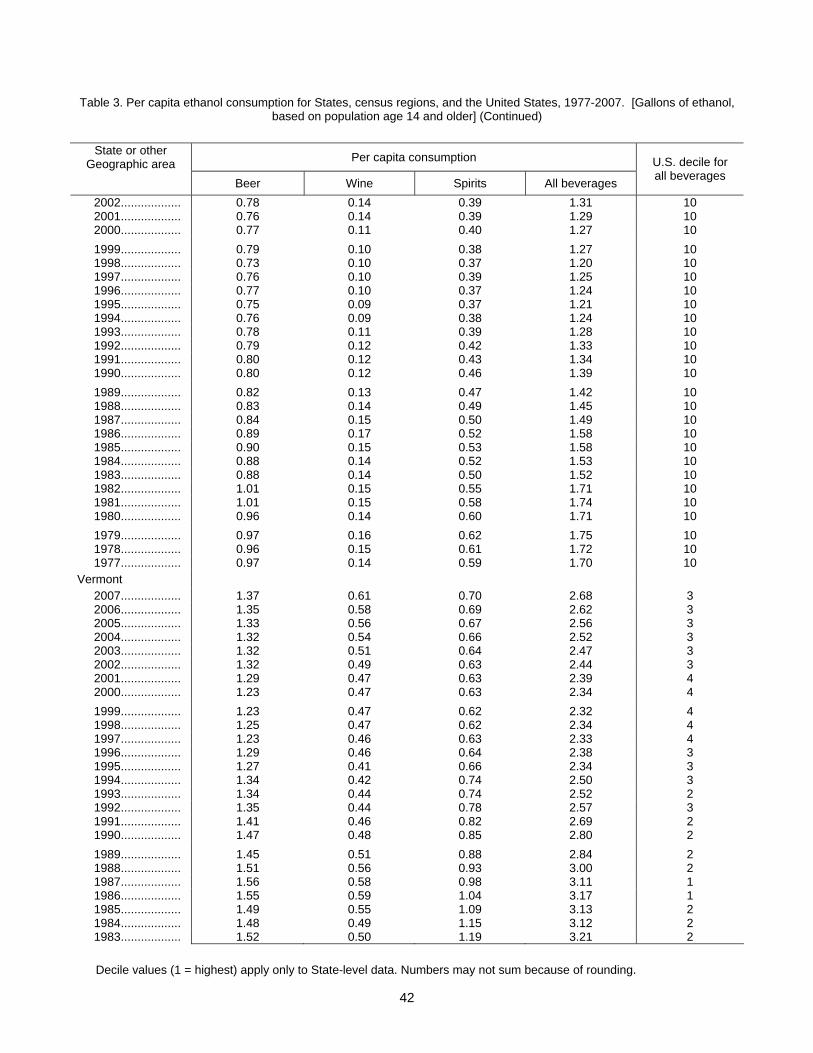
Table 3. Per capita ethanol consumption for States, census regions, and the United States, 1977-2007. [Gallons of ethanol, based on population age 14 and older] (Continued)
State or other Geographic area Per capita consumption
Beer Wine Spirits All beverages
U.S. decile for all beverages
2002.................. 0.78 0.14 0.39 1.31 10 2001.................. 0.76 0.14 0.39 1.29 10 2000.................. 0.77 0.11 0.40 1.27 10 1999.................. 0.79 0.10 0.38 1.27 10 1998.................. 0.73 0.10 0.37 1.20 10 1997.................. 0.76 0.10 0.39 1.25 10 1996.................. 0.77 0.10 0.37 1.24 10 1995.................. 0.75 0.09 0.37 1.21 10 1994.................. 0.76 0.09 0.38 1.24 10 1993.................. 0.78 0.11 0.39 1.28 10 1992.................. 0.79 0.12 0.42 1.33 10 1991.................. 0.80 0.12 0.43 1.34 10 1990.................. 0.80 0.12 0.46 1.39 10 1989.................. 0.82 0.13 0.47 1.42 10 1988.................. 0.83 0.14 0.49 1.45 10 1987.................. 0.84 0.15 0.50 1.49 10 1986.................. 0.89 0.17 0.52 1.58 10 1985.................. 0.90 0.15 0.53 1.58 10 1984.................. 0.88 0.14 0.52 1.53 10 1983.................. 0.88 0.14 0.50 1.52 10 1982.................. 1.01 0.15 0.55 1.71 10 1981.................. 1.01 0.15 0.58 1.74 10 1980.................. 0.96 0.14 0.60 1.71 10 1979.................. 0.97 0.16 0.62 1.75 10 1978.................. 0.96 0.15 0.61 1.72 10 1977.................. 0.97 0.14 0.59 1.70 10
Vermont 2007.................. 1.37 0.61 0.70 2.68 3 2006.................. 1.35 0.58 0.69 2.62 3 2005.................. 1.33 0.56 0.67 2.56 3 2004.................. 1.32 0.54 0.66 2.52 3 2003.................. 1.32 0.51 0.64 2.47 3 2002.................. 1.32 0.49 0.63 2.44 3 2001.................. 1.29 0.47 0.63 2.39 4 2000.................. 1.23 0.47 0.63 2.34 4 1999.................. 1.23 0.47 0.62 2.32 4 1998.................. 1.25 0.47 0.62 2.34 4 1997.................. 1.23 0.46 0.63 2.33 4 1996.................. 1.29 0.46 0.64 2.38 3 1995.................. 1.27 0.41 0.66 2.34 3 1994.................. 1.34 0.42 0.74 2.50 3 1993.................. 1.34 0.44 0.74 2.52 2 1992.................. 1.35 0.44 0.78 2.57 3 1991.................. 1.41 0.46 0.82 2.69 2 1990.................. 1.47 0.48 0.85 2.80 2 1989.................. 1.45 0.51 0.88 2.84 2 1988.................. 1.51 0.56 0.93 3.00 2 1987.................. 1.56 0.58 0.98 3.11 1 1986.................. 1.55 0.59 1.04 3.17 1 1985.................. 1.49 0.55 1.09 3.13 2 1984.................. 1.48 0.49 1.15 3.12 2 1983.................. 1.52 0.50 1.19 3.21 2
Decile values (1 = highest) apply only to State-level data. Numbers may not sum because of rounding.
42
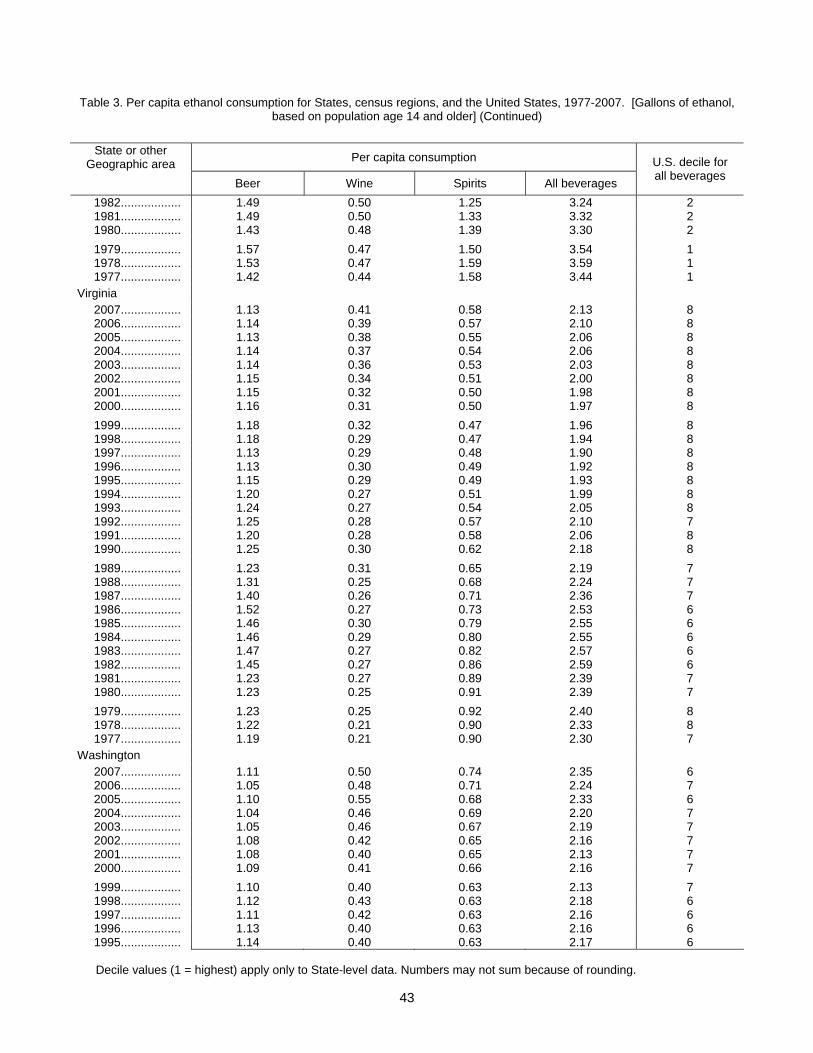
Table 3. Per capita ethanol consumption for States, census regions, and the United States, 1977-2007. [Gallons of ethanol, based on population age 14 and older] (Continued)
State or other Geographic area Per capita consumption
Beer Wine Spirits All beverages
U.S. decile for all beverages
1982.................. 1.49 0.50 1.25 3.24 2 1981.................. 1.49 0.50 1.33 3.32 2 1980.................. 1.43 0.48 1.39 3.30 2 1979.................. 1.57 0.47 1.50 3.54 1 1978.................. 1.53 0.47 1.59 3.59 1 1977.................. 1.42 0.44 1.58 3.44 1
Virginia 2007.................. 1.13 0.41 0.58 2.13 8 2006.................. 1.14 0.39 0.57 2.10 8 2005.................. 1.13 0.38 0.55 2.06 8 2004.................. 1.14 0.37 0.54 2.06 8 2003.................. 1.14 0.36 0.53 2.03 8 2002.................. 1.15 0.34 0.51 2.00 8 2001.................. 1.15 0.32 0.50 1.98 8 2000.................. 1.16 0.31 0.50 1.97 8 1999.................. 1.18 0.32 0.47 1.96 8 1998.................. 1.18 0.29 0.47 1.94 8 1997.................. 1.13 0.29 0.48 1.90 8 1996.................. 1.13 0.30 0.49 1.92 8 1995.................. 1.15 0.29 0.49 1.93 8 1994.................. 1.20 0.27 0.51 1.99 8 1993.................. 1.24 0.27 0.54 2.05 8 1992.................. 1.25 0.28 0.57 2.10 7 1991.................. 1.20 0.28 0.58 2.06 8 1990.................. 1.25 0.30 0.62 2.18 8 1989.................. 1.23 0.31 0.65 2.19 7 1988.................. 1.31 0.25 0.68 2.24 7 1987.................. 1.40 0.26 0.71 2.36 7 1986.................. 1.52 0.27 0.73 2.53 6 1985.................. 1.46 0.30 0.79 2.55 6 1984.................. 1.46 0.29 0.80 2.55 6 1983.................. 1.47 0.27 0.82 2.57 6 1982.................. 1.45 0.27 0.86 2.59 6 1981.................. 1.23 0.27 0.89 2.39 7 1980.................. 1.23 0.25 0.91 2.39 7 1979.................. 1.23 0.25 0.92 2.40 8 1978.................. 1.22 0.21 0.90 2.33 8 1977.................. 1.19 0.21 0.90 2.30 7
Washington 2007.................. 1.11 0.50 0.74 2.35 6 2006.................. 1.05 0.48 0.71 2.24 7 2005.................. 1.10 0.55 0.68 2.33 6 2004.................. 1.04 0.46 0.69 2.20 7 2003.................. 1.05 0.46 0.67 2.19 7 2002.................. 1.08 0.42 0.65 2.16 7 2001.................. 1.08 0.40 0.65 2.13 7 2000.................. 1.09 0.41 0.66 2.16 7 1999.................. 1.10 0.40 0.63 2.13 7 1998.................. 1.12 0.43 0.63 2.18 6 1997.................. 1.11 0.42 0.63 2.16 6 1996.................. 1.13 0.40 0.63 2.16 6 1995.................. 1.14 0.40 0.63 2.17 6
Decile values (1 = highest) apply only to State-level data. Numbers may not sum because of rounding.
43
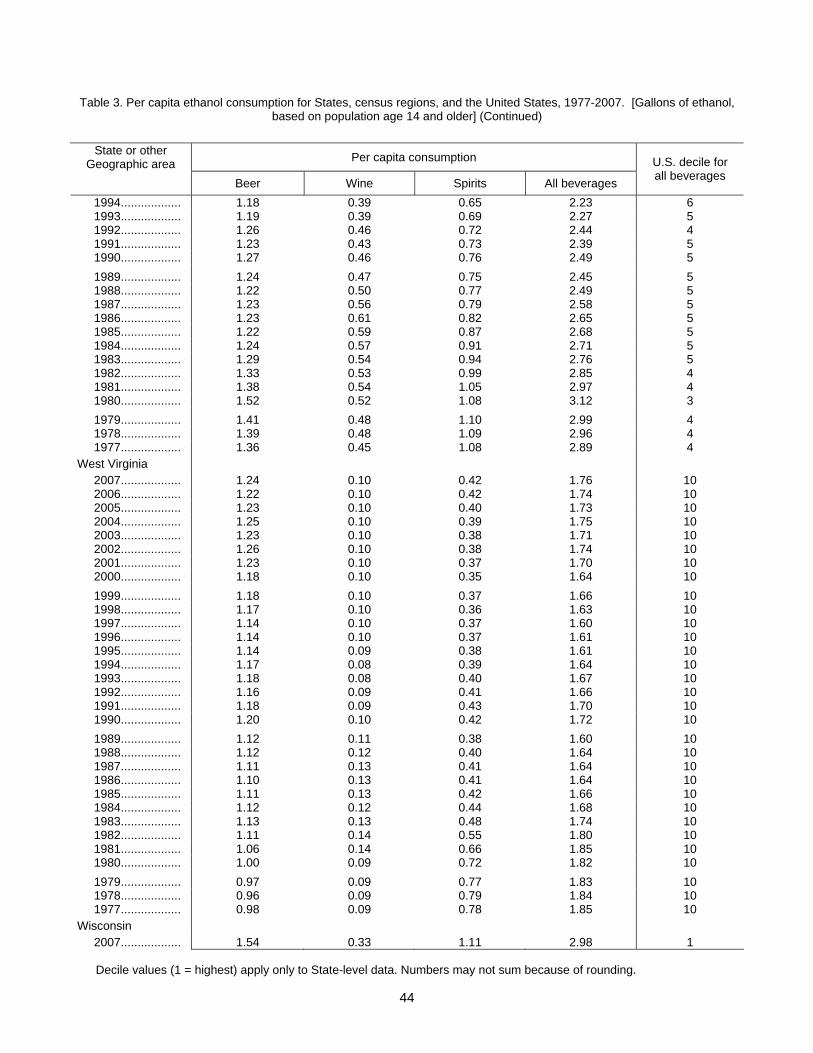
Table 3. Per capita ethanol consumption for States, census regions, and the United States, 1977-2007. [Gallons of ethanol, based on population age 14 and older] (Continued)
State or other Geographic area Per capita consumption
Beer Wine Spirits All beverages
U.S. decile for all beverages
1994.................. 1.18 0.39 0.65 2.23 6 1993.................. 1.19 0.39 0.69 2.27 5 1992.................. 1.26 0.46 0.72 2.44 4 1991.................. 1.23 0.43 0.73 2.39 5 1990.................. 1.27 0.46 0.76 2.49 5 1989.................. 1.24 0.47 0.75 2.45 5 1988.................. 1.22 0.50 0.77 2.49 5 1987.................. 1.23 0.56 0.79 2.58 5 1986.................. 1.23 0.61 0.82 2.65 5 1985.................. 1.22 0.59 0.87 2.68 5 1984.................. 1.24 0.57 0.91 2.71 5 1983.................. 1.29 0.54 0.94 2.76 5 1982.................. 1.33 0.53 0.99 2.85 4 1981.................. 1.38 0.54 1.05 2.97 4 1980.................. 1.52 0.52 1.08 3.12 3 1979.................. 1.41 0.48 1.10 2.99 4 1978.................. 1.39 0.48 1.09 2.96 4 1977.................. 1.36 0.45 1.08 2.89 4
West Virginia 2007.................. 1.24 0.10 0.42 1.76 10 2006.................. 1.22 0.10 0.42 1.74 10 2005.................. 1.23 0.10 0.40 1.73 10 2004.................. 1.25 0.10 0.39 1.75 10 2003.................. 1.23 0.10 0.38 1.71 10 2002.................. 1.26 0.10 0.38 1.74 10 2001.................. 1.23 0.10 0.37 1.70 10 2000.................. 1.18 0.10 0.35 1.64 10 1999.................. 1.18 0.10 0.37 1.66 10 1998.................. 1.17 0.10 0.36 1.63 10 1997.................. 1.14 0.10 0.37 1.60 10 1996.................. 1.14 0.10 0.37 1.61 10 1995.................. 1.14 0.09 0.38 1.61 10 1994.................. 1.17 0.08 0.39 1.64 10 1993.................. 1.18 0.08 0.40 1.67 10 1992.................. 1.16 0.09 0.41 1.66 10 1991.................. 1.18 0.09 0.43 1.70 10 1990.................. 1.20 0.10 0.42 1.72 10 1989.................. 1.12 0.11 0.38 1.60 10 1988.................. 1.12 0.12 0.40 1.64 10 1987.................. 1.11 0.13 0.41 1.64 10 1986.................. 1.10 0.13 0.41 1.64 10 1985.................. 1.11 0.13 0.42 1.66 10 1984.................. 1.12 0.12 0.44 1.68 10 1983.................. 1.13 0.13 0.48 1.74 10 1982.................. 1.11 0.14 0.55 1.80 10 1981.................. 1.06 0.14 0.66 1.85 10 1980.................. 1.00 0.09 0.72 1.82 10 1979.................. 0.97 0.09 0.77 1.83 10 1978.................. 0.96 0.09 0.79 1.84 10 1977.................. 0.98 0.09 0.78 1.85 10
Wisconsin 2007.................. 1.54 0.33 1.11 2.98 1
Decile values (1 = highest) apply only to State-level data. Numbers may not sum because of rounding.
44
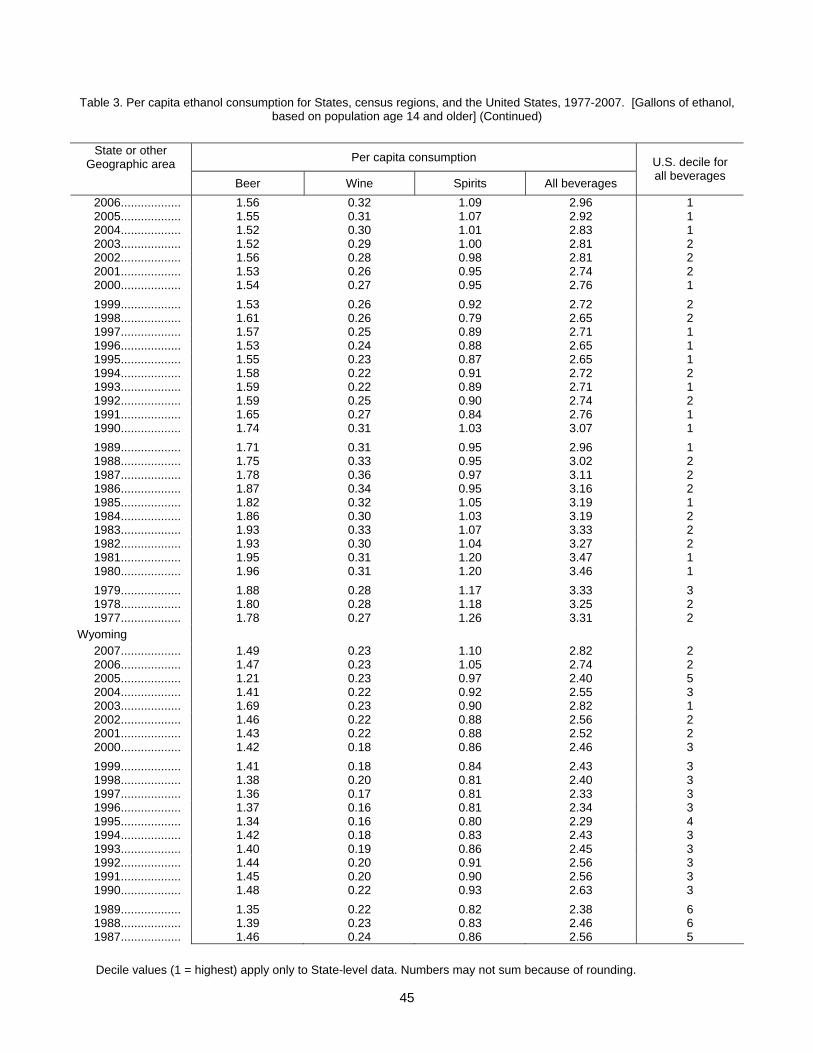
Table 3. Per capita ethanol consumption for States, census regions, and the United States, 1977-2007. [Gallons of ethanol, based on population age 14 and older] (Continued)
State or other Geographic area Per capita consumption
Beer Wine Spirits All beverages
U.S. decile for all beverages
2006.................. 1.56 0.32 1.09 2.96 1 2005.................. 1.55 0.31 1.07 2.92 1 2004.................. 1.52 0.30 1.01 2.83 1 2003.................. 1.52 0.29 1.00 2.81 2 2002.................. 1.56 0.28 0.98 2.81 2 2001.................. 1.53 0.26 0.95 2.74 2 2000.................. 1.54 0.27 0.95 2.76 1 1999.................. 1.53 0.26 0.92 2.72 2 1998.................. 1.61 0.26 0.79 2.65 2 1997.................. 1.57 0.25 0.89 2.71 1 1996.................. 1.53 0.24 0.88 2.65 1 1995.................. 1.55 0.23 0.87 2.65 1 1994.................. 1.58 0.22 0.91 2.72 2 1993.................. 1.59 0.22 0.89 2.71 1 1992.................. 1.59 0.25 0.90 2.74 2 1991.................. 1.65 0.27 0.84 2.76 1 1990.................. 1.74 0.31 1.03 3.07 1 1989.................. 1.71 0.31 0.95 2.96 1 1988.................. 1.75 0.33 0.95 3.02 2 1987.................. 1.78 0.36 0.97 3.11 2 1986.................. 1.87 0.34 0.95 3.16 2 1985.................. 1.82 0.32 1.05 3.19 1 1984.................. 1.86 0.30 1.03 3.19 2 1983.................. 1.93 0.33 1.07 3.33 2 1982.................. 1.93 0.30 1.04 3.27 2 1981.................. 1.95 0.31 1.20 3.47 1 1980.................. 1.96 0.31 1.20 3.46 1 1979.................. 1.88 0.28 1.17 3.33 3 1978.................. 1.80 0.28 1.18 3.25 2 1977.................. 1.78 0.27 1.26 3.31 2
Wyoming 2007.................. 1.49 0.23 1.10 2.82 2 2006.................. 1.47 0.23 1.05 2.74 2 2005.................. 1.21 0.23 0.97 2.40 5 2004.................. 1.41 0.22 0.92 2.55 3 2003.................. 1.69 0.23 0.90 2.82 1 2002.................. 1.46 0.22 0.88 2.56 2 2001.................. 1.43 0.22 0.88 2.52 2 2000.................. 1.42 0.18 0.86 2.46 3 1999.................. 1.41 0.18 0.84 2.43 3 1998.................. 1.38 0.20 0.81 2.40 3 1997.................. 1.36 0.17 0.81 2.33 3 1996.................. 1.37 0.16 0.81 2.34 3 1995.................. 1.34 0.16 0.80 2.29 4 1994.................. 1.42 0.18 0.83 2.43 3 1993.................. 1.40 0.19 0.86 2.45 3 1992.................. 1.44 0.20 0.91 2.56 3 1991.................. 1.45 0.20 0.90 2.56 3 1990.................. 1.48 0.22 0.93 2.63 3 1989.................. 1.35 0.22 0.82 2.38 6 1988.................. 1.39 0.23 0.83 2.46 6 1987.................. 1.46 0.24 0.86 2.56 5
Decile values (1 = highest) apply only to State-level data. Numbers may not sum because of rounding.
45

Table 3. Per capita ethanol consumption for States, census regions, and the United States, 1977-2007. [Gallons of ethanol, based on population age 14 and older] (Continued)
State or other Geographic area Per capita consumption
Beer Wine Spirits All beverages
U.S. decile for all beverages
1986.................. 1.46 0.26 0.92 2.64 5 1985.................. 1.56 0.25 1.03 2.84 3 1984.................. 1.58 0.22 1.05 2.86 4 1983.................. 1.66 0.22 1.09 2.98 4 1982.................. 1.80 0.24 1.21 3.25 2 1981.................. 1.91 0.24 1.27 3.42 2 1980.................. 1.85 0.24 1.32 3.42 2 1979.................. 1.86 0.22 1.30 3.38 2 1978.................. 1.82 0.22 1.36 3.41 2 1977.................. 1.79 0.21 1.32 3.31 2
Northeast region 2007.................. 1.06 0.46 0.75 2.28 2006.................. 1.06 0.45 0.73 2.24 2005.................. 1.05 0.43 0.72 2.20 2004.................. 1.07 0.43 0.70 2.19 2003.................. 1.07 0.41 0.68 2.17 2002.................. 1.10 0.40 0.66 2.16 2001.................. 1.10 0.38 0.64 2.12 2000.................. 1.06 0.38 0.66 2.10 1999.................. 1.05 0.38 0.63 2.06 1998.................. 1.07 0.37 0.60 2.04 1997.................. 1.06 0.36 0.63 2.06 1996.................. 1.08 0.36 0.64 2.07 1995.................. 1.09 0.36 0.64 2.09 1994.................. 1.11 0.34 0.67 2.12 1993.................. 1.13 0.34 0.68 2.15 1992.................. 1.14 0.35 0.72 2.21 1991.................. 1.19 0.34 0.73 2.26 1990.................. 1.23 0.38 0.80 2.41 1989.................. 1.22 0.39 0.84 2.44 1988.................. 1.25 0.40 0.86 2.52 1987.................. 1.25 0.43 0.91 2.60 1986.................. 1.25 0.44 0.93 2.62 1985.................. 1.25 0.43 0.98 2.66 1984.................. 1.25 0.43 1.01 2.70 1983.................. 1.31 0.43 1.03 2.76 1982.................. 1.31 0.43 1.05 2.79 1981.................. 1.31 0.41 1.07 2.80 1980.................. 1.34 0.40 1.10 2.84 1979.................. 1.30 0.38 1.09 2.77 1978.................. 1.26 0.36 1.10 2.73 1977.................. 1.25 0.34 1.10 2.69
Midwest region 2007.................. 1.27 0.29 0.74 2.30 2006.................. 1.26 0.28 0.72 2.26 2005.................. 1.26 0.27 0.71 2.23 2004.................. 1.27 0.26 0.68 2.20 2003.................. 1.28 0.26 0.69 2.22 2002.................. 1.30 0.24 0.65 2.20 2001.................. 1.29 0.24 0.66 2.18 2000.................. 1.29 0.23 0.66 2.18 1999.................. 1.29 0.24 0.65 2.17
Decile values (1 = highest) apply only to State-level data. Numbers may not sum because of rounding.
46

Table 3. Per capita ethanol consumption for States, census regions, and the United States, 1977-2007. [Gallons of ethanol, based on population age 14 and older] (Continued)
State or other Geographic area Per capita consumption
Beer Wine Spirits All beverages
U.S. decile for all beverages
1998.................. 1.28 0.23 0.63 2.14 1997.................. 1.26 0.23 0.63 2.12 1996.................. 1.27 0.23 0.62 2.12 1995.................. 1.27 0.22 0.63 2.12 1994.................. 1.30 0.22 0.63 2.14 1993.................. 1.30 0.22 0.67 2.18 1992.................. 1.31 0.23 0.68 2.21 1991.................. 1.35 0.23 0.67 2.25 1990.................. 1.38 0.26 0.74 2.37 1989.................. 1.34 0.26 0.71 2.31 1988.................. 1.36 0.28 0.74 2.38 1987.................. 1.37 0.29 0.76 2.42 1986.................. 1.37 0.30 0.78 2.44 1985.................. 1.37 0.28 0.83 2.48 1984.................. 1.39 0.27 0.84 2.50 1983.................. 1.41 0.25 0.87 2.53 1982.................. 1.42 0.27 0.88 2.56 1981.................. 1.42 0.26 0.93 2.61 1980.................. 1.42 0.24 0.96 2.63 1979.................. 1.41 0.23 0.95 2.58 1978.................. 1.35 0.22 0.96 2.53 1977.................. 1.32 0.21 0.96 2.49
South region 2007.................. 1.26 0.30 0.68 2.25 2006.................. 1.26 0.30 0.67 2.23 2005.................. 1.24 0.29 0.66 2.18 2004.................. 1.27 0.28 0.64 2.19 2003.................. 1.27 0.27 0.64 2.18 2002.................. 1.29 0.26 0.62 2.17 2001.................. 1.29 0.25 0.60 2.14 2000.................. 1.30 0.25 0.61 2.16 1999.................. 1.30 0.25 0.60 2.15 1998.................. 1.28 0.24 0.60 2.12 1997.................. 1.28 0.23 0.60 2.12 1996.................. 1.29 0.24 0.61 2.14 1995.................. 1.29 0.22 0.61 2.12 1994.................. 1.31 0.22 0.64 2.16 1993.................. 1.33 0.22 0.66 2.20 1992.................. 1.33 0.23 0.69 2.26 1991.................. 1.31 0.23 0.69 2.23 1990.................. 1.36 0.26 0.74 2.36 1989.................. 1.33 0.26 0.73 2.31 1988.................. 1.33 0.27 0.74 2.34 1987.................. 1.33 0.27 0.77 2.37 1986.................. 1.35 0.28 0.79 2.42 1985.................. 1.33 0.27 0.85 2.46 1984.................. 1.34 0.27 0.90 2.51 1983.................. 1.36 0.25 0.91 2.52 1982.................. 1.37 0.23 0.95 2.55 1981.................. 1.36 0.24 0.98 2.58 1980.................. 1.31 0.23 0.98 2.51 1979.................. 1.32 0.21 1.03 2.55
Decile values (1 = highest) apply only to State-level data. Numbers may not sum because of rounding.
47

Table 3. Per capita ethanol consumption for States, census regions, and the United States, 1977-2007. [Gallons of ethanol, based on population age 14 and older] (Continued)
State or other Geographic area Per capita consumption
Beer Wine Spirits All beverages
U.S. decile for all beverages
1978.................. 1.29 0.20 1.03 2.52 1977.................. 1.25 0.19 1.01 2.44
West region 2007.................. 1.17 0.50 0.77 2.43 2006.................. 1.14 0.49 0.75 2.38 2005.................. 1.12 0.48 0.73 2.33 2004.................. 1.15 0.47 0.71 2.33 2003.................. 1.16 0.46 0.69 2.31 2002.................. 1.18 0.44 0.68 2.30 2001.................. 1.19 0.43 0.68 2.30 2000.................. 1.18 0.43 0.67 2.29 1999.................. 1.19 0.42 0.65 2.27 1998.................. 1.19 0.42 0.65 2.25 1997.................. 1.20 0.43 0.65 2.28 1996.................. 1.21 0.43 0.67 2.30 1995.................. 1.22 0.40 0.66 2.28 1994.................. 1.20 0.41 0.70 2.31 1993.................. 1.26 0.42 0.72 2.39 1992.................. 1.33 0.45 0.76 2.54 1991.................. 1.30 0.44 0.76 2.50 1990.................. 1.37 0.50 0.84 2.71 1989.................. 1.36 0.51 0.84 2.71 1988.................. 1.37 0.57 0.87 2.80 1987.................. 1.39 0.62 0.89 2.90 1986.................. 1.40 0.65 0.92 2.98 1985.................. 1.37 0.65 1.00 3.02 1984.................. 1.41 0.61 1.04 3.05 1983.................. 1.42 0.61 1.07 3.11 1982.................. 1.45 0.60 1.11 3.15 1981.................. 1.49 0.60 1.16 3.26 1980.................. 1.48 0.59 1.20 3.26 1979.................. 1.49 0.58 1.24 3.31 1978.................. 1.43 0.56 1.27 3.26 1977.................. 1.38 0.54 1.22 3.15
U.S. total 2007.................. 1.21 0.38 0.73 2.31 2006.................. 1.19 0.37 0.71 2.27 2005.................. 1.18 0.35 0.70 2.23 2004.................. 1.20 0.35 0.68 2.23 2003.................. 1.21 0.34 0.67 2.22 2002.................. 1.23 0.33 0.65 2.20 2001.................. 1.23 0.31 0.64 2.18 2000.................. 1.22 0.31 0.65 2.18 1999.................. 1.23 0.31 0.63 2.16 1998.................. 1.22 0.30 0.62 2.14 1997.................. 1.22 0.30 0.62 2.14 1996.................. 1.23 0.30 0.63 2.16 1995.................. 1.23 0.29 0.63 2.15 1994.................. 1.25 0.28 0.65 2.18 1993.................. 1.26 0.28 0.68 2.23 1992.................. 1.29 0.30 0.71 2.30 1991.................. 1.29 0.30 0.71 2.30
Decile values (1 = highest) apply only to State-level data. Numbers may not sum because of rounding.
48
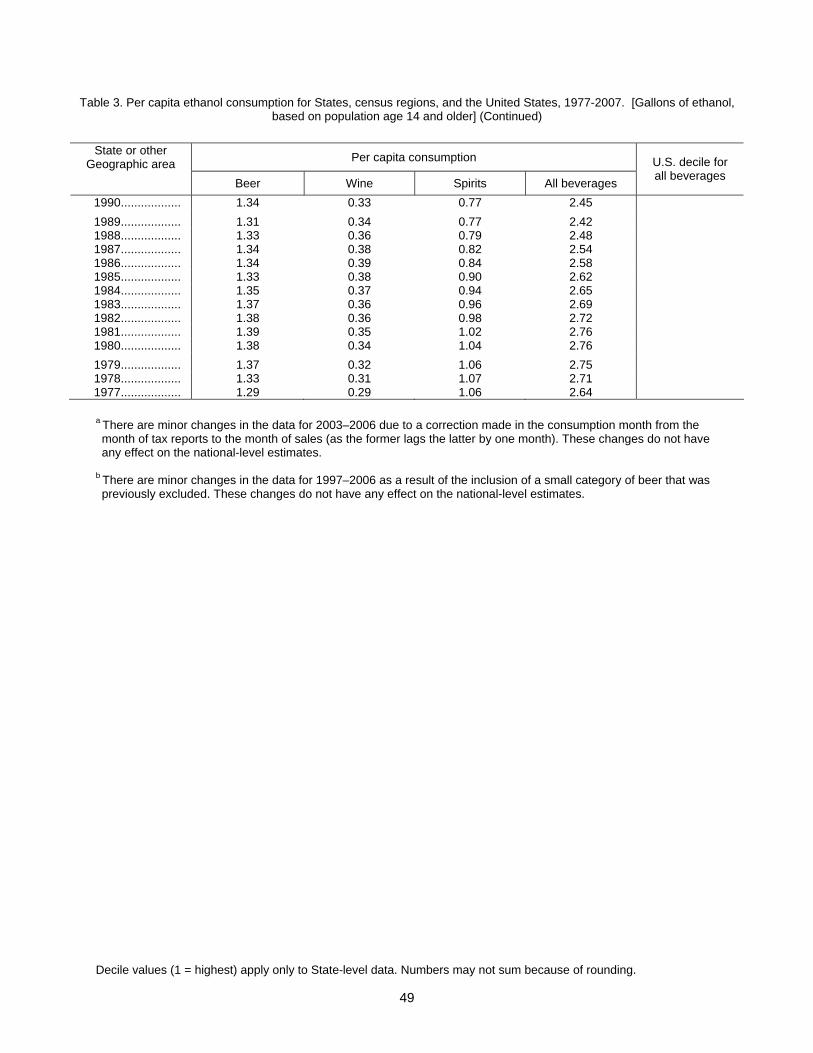
Decile values (1 = highest) apply only to State-level data. Numbers may not sum because of rounding.
49
Table 3. Per capita ethanol consumption for States, census regions, and the United States, 1977-2007. [Gallons of ethanol, based on population age 14 and older] (Continued)
State or other Geographic area Per capita consumption
Beer Wine Spirits All beverages
U.S. decile for all beverages
1990.................. 1.34 0.33 0.77 2.45 1989.................. 1.31 0.34 0.77 2.42 1988.................. 1.33 0.36 0.79 2.48 1987.................. 1.34 0.38 0.82 2.54 1986.................. 1.34 0.39 0.84 2.58 1985.................. 1.33 0.38 0.90 2.62 1984.................. 1.35 0.37 0.94 2.65 1983.................. 1.37 0.36 0.96 2.69 1982.................. 1.38 0.36 0.98 2.72 1981.................. 1.39 0.35 1.02 2.76 1980.................. 1.38 0.34 1.04 2.76 1979.................. 1.37 0.32 1.06 2.75 1978.................. 1.33 0.31 1.07 2.71 1977.................. 1.29 0.29 1.06 2.64 a There are minor changes in the data for 2003–2006 due to a correction made in the consumption month from the month of tax reports to the month of sales (as the former lags the latter by one month). These changes do not have any effect on the national-level estimates.
b There are minor changes in the data for 1997–2006 as a result of the inclusion of a small category of beer that was previously excluded. These changes do not have any effect on the national-level estimates.