surpro 3500 r13 · std dev (m/km) 0.0012 std dev (%) 0.10% ride quality (iri) longitudinal...
TRANSCRIPT

surpro.comsurpro.comsurpro.comsurpro.comsurpro.comsurpro.comsurpro.comsurpro.com
1

Introducing SurPRO 3500Introducing SurPRO 3500Introducing SurPRO 3500Introducing SurPRO 3500Introducing SurPRO 3500Introducing SurPRO 3500Introducing SurPRO 3500Introducing SurPRO 3500
SurPRO comes from words “Surface” & “Profiler”SurPRO comes from words “Surface” & “Profiler”
Used on roads, structures, runways and floorsUsed on roads, structures, runways and floors
22 years of R&D and continuous improvement22 years of R&D and continuous improvement
US & Can patentsUS & Can patents--inertial stabilizer & geometryinertial stabilizer & geometryUS & Can patentsUS & Can patents--inertial stabilizer & geometryinertial stabilizer & geometry
SurPRO 3000 developed under FHWA contract:SurPRO 3000 developed under FHWA contract:“Improving the Quality of Pavement Profile “Improving the Quality of Pavement Profile MeasurementMeasurement--Priority Number One: Reference Priority Number One: Reference Device”Device”
SurPRO 3500 available nowSurPRO 3500 available nowIncludes all features of SurPRO 3000+ tested at Includes all features of SurPRO 3000+ tested at MnRoadMnRoad / / Wisconsin in 2010 plus USB port for file download to flash driveWisconsin in 2010 plus USB port for file download to flash drive
Upgrades from 2000 or 3000 to 3500 model availableUpgrades from 2000 or 3000 to 3500 model available
2
FeaturesFeaturesFeaturesFeaturesFeaturesFeaturesFeaturesFeatures
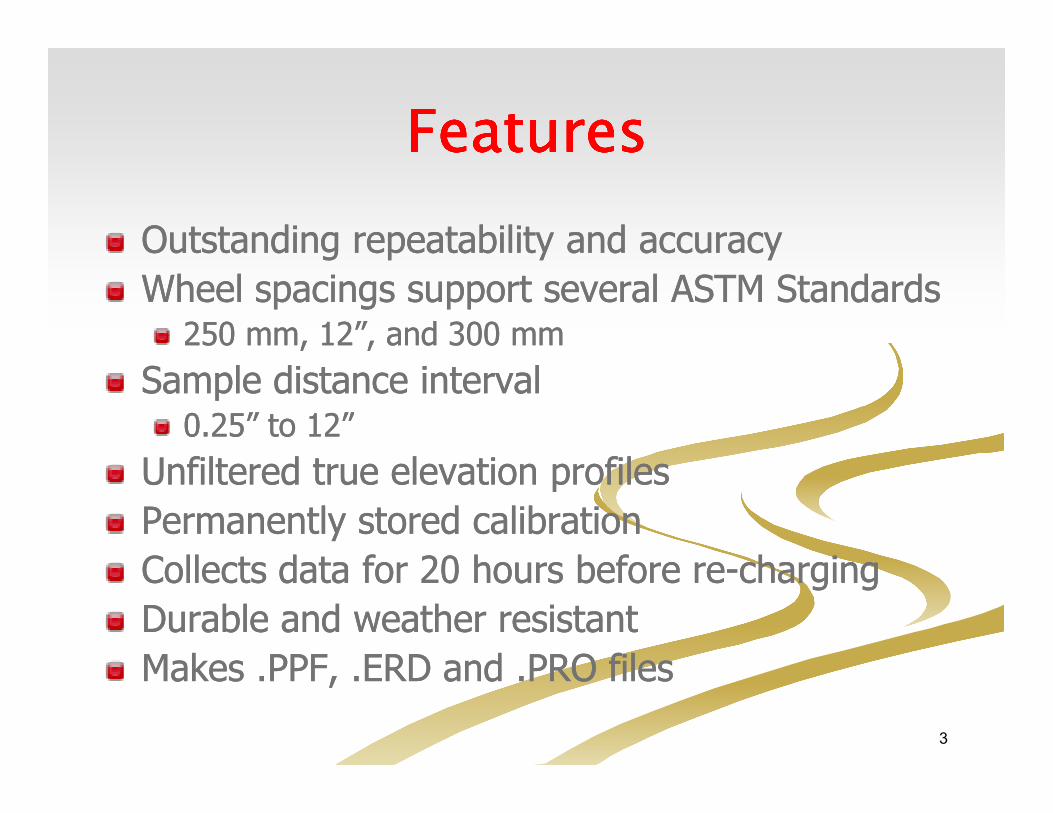
Outstanding repeatability and accuracyOutstanding repeatability and accuracy
Wheel Wheel spacingsspacings support several ASTM Standardssupport several ASTM Standards250 mm, 12”, and 300 mm250 mm, 12”, and 300 mm
Sample distance interval Sample distance interval 0.25” to 12”0.25” to 12”0.25” to 12”0.25” to 12”
Unfiltered true elevation profilesUnfiltered true elevation profiles
Permanently stored calibrationPermanently stored calibration
Collects data for 20 hours before reCollects data for 20 hours before re--chargingcharging
Durable and weather resistantDurable and weather resistant
Makes .PPF, .ERD and .PRO filesMakes .PPF, .ERD and .PRO files
3

CoCoCoCoCoCoCoCo--------linear Wheelslinear Wheelslinear Wheelslinear Wheelslinear Wheelslinear Wheelslinear Wheelslinear Wheels
CoCo--linear wheels (no side wheels or outrigger) linear wheels (no side wheels or outrigger) enable easy, accurate profiling in wheel rutsenable easy, accurate profiling in wheel ruts
Easier to steer & precisely follow chalk lineEasier to steer & precisely follow chalk line
Transverse tilting is compensatedTransverse tilting is compensated
4

Transport to site, weighs only 20.4 kg (42 lb)Transport to site, weighs only 20.4 kg (42 lb)
Assemble in about 5 to 10 minutes Assemble in about 5 to 10 minutes
Permanently stored calibrationPermanently stored calibrationCheck level by closed loop profileCheck level by closed loop profile
Check gain by putting block under wheel Check gain by putting block under wheel
OperationOperationOperationOperationOperationOperationOperationOperation
Check gain by putting block under wheel Check gain by putting block under wheel
Set up SurPRO using keypad, LCDSet up SurPRO using keypad, LCD
Easy to operateEasy to operatePress RUNPress RUN
Push SurPROPush SurPRO
Press STOP and SAVE filePress STOP and SAVE file
5

FHWA Reference ProfilerFHWA Reference ProfilerFHWA Reference ProfilerFHWA Reference ProfilerFHWA Reference ProfilerFHWA Reference ProfilerFHWA Reference ProfilerFHWA Reference ProfilerBuilding Building Building Building Building Building Building Building SurPROSurPROSurPROSurPROSurPROSurPROSurPROSurPRO 3000+3000+3000+3000+3000+3000+3000+3000+
Added Added 3rd accelerometer3rd accelerometer
High resolution V2 hardwareHigh resolution V2 hardware
DMI temperature comp.DMI temperature comp.
Precision pointerPrecision pointer
6
Precision pointerPrecision pointer
OptimizedOptimizedOther compensation systemsOther compensation systems
MathMath
SoftwareSoftware
Field tested and achievedField tested and achievedvery high repeatabilityvery high repeatability

FHWA Reference ProfilerFHWA Reference ProfilerFHWA Reference ProfilerFHWA Reference ProfilerFHWA Reference ProfilerFHWA Reference ProfilerFHWA Reference ProfilerFHWA Reference ProfilerData Collection 13Data Collection 13Data Collection 13Data Collection 13Data Collection 13Data Collection 13Data Collection 13Data Collection 13--------17 Sept 201017 Sept 201017 Sept 201017 Sept 201017 Sept 201017 Sept 201017 Sept 201017 Sept 2010Checked out unit & ran test profile of DMI siteChecked out unit & ran test profile of DMI site
Calibrated DMI on full 528’ asphalt sectionCalibrated DMI on full 528’ asphalt section
Defined & carefully followed proceduresDefined & carefully followed proceduresPrecisely marked offsets and snapped chalk linePrecisely marked offsets and snapped chalk line
Used precision pointer to accurately follow chalk lineUsed precision pointer to accurately follow chalk lineUsed precision pointer to accurately follow chalk lineUsed precision pointer to accurately follow chalk line
Only aligned using center of profilerOnly aligned using center of profiler——never an offsetnever an offset
Alternated operators to minimize fatigueAlternated operators to minimize fatigue
Weather was generally warm and dry Weather was generally warm and dry Rained during runs 2 to 5 of Transverse Rained during runs 2 to 5 of Transverse TiningTining
All data was collected in daylightAll data was collected in daylight
7

Chip SealChip SealChip SealChip SealChip SealChip SealChip SealChip Seal
Count 10
Passing 98% 100.0%
Mean 99.3%
Min 99.0%
Max 99.7%
Repeatability (IRI)
8
Max 99.7%
Std Dev 0.24%
Mean (m/km) 1.50
Min (m/km) 1.49
Max (m/km) 1.51
Std Dev (m/km) 0.0069
Std Dev (%) 0.46%
Ride Quality (IRI)
Mean (m/km) 1.50
Min (m/km) 1.49
Max (m/km) 1.51
Std Dev (m/km) 0.0069
Std Dev (%) 0.46%
Ride Quality (IRI)

Chip SealChip SealChip SealChip SealChip SealChip SealChip SealChip Seal5 Runs Unfiltered
5 Runs BW Highpass filtered @ 30m
9
2 Runs Cross Correlated in ProVAL using IRI filter99.7% Repeatability

Dense Graded ACDense Graded ACDense Graded ACDense Graded ACDense Graded ACDense Graded ACDense Graded ACDense Graded AC
Count 10
Passing 98% 100.0%
Mean 99.3%
Min 98.9%
Max 99.7%
Repeatability (IRI)
Count 10
Passing 98% 100.0%
Mean 99.3%
Min 98.9%
Max 99.7%
Repeatability (IRI)
10
Max 99.7%
Std Dev 0.30%
Max 99.7%
Std Dev 0.30%
Mean (m/km) 1.50
Min (m/km) 1.50
Max (m/km) 1.50
Std Dev (m/km) 0.0013
Std Dev (%) 0.08%
Ride Quality (IRI)
Mean (m/km) 1.50
Min (m/km) 1.50
Max (m/km) 1.50
Std Dev (m/km) 0.0013
Std Dev (%) 0.08%
Ride Quality (IRI)

Dense Graded ACDense Graded ACDense Graded ACDense Graded ACDense Graded ACDense Graded ACDense Graded ACDense Graded AC
5 Runs Unfiltered
5 Runs BW Highpass filtered @ 30m
11
2 Runs Cross Correlated in ProVAL using IRI filter99.7% Repeatability

Diamond Grinding*Diamond Grinding*Diamond Grinding*Diamond Grinding*Diamond Grinding*Diamond Grinding*Diamond Grinding*Diamond Grinding*
Count 10
Passing 98% 100.0%
Mean 99.2%
Min 98.7%
Max 99.6%
Repeatability (IRI)
Count 10
Passing 98% 100.0%
Mean 99.2%
Min 98.7%
Max 99.6%
Repeatability (IRI)
12
Max 99.6%
Std Dev 0.32%
Max 99.6%
Std Dev 0.32%
Mean (m/km) 0.88
Min (m/km) 0.88
Max (m/km) 0.89
Std Dev (m/km) 0.0042
Std Dev (%) 0.48%
Ride Quality (IRI)
Mean (m/km) 0.88
Min (m/km) 0.88
Max (m/km) 0.89
Std Dev (m/km) 0.0042
Std Dev (%) 0.48%
Ride Quality (IRI)
*Note: Using data from 2nd visit to Diamond Grinding section

Diamond GrindingDiamond GrindingDiamond GrindingDiamond GrindingDiamond GrindingDiamond GrindingDiamond GrindingDiamond Grinding5 Runs Unfiltered
5 Runs BW Highpass filtered @ 30mVery small diamond
grinder bumps
13
2 Runs Cross Correlated in ProVAL using IRI filter99.6% Repeatability
0.5 mm peak to peak.
Need 0.005 mm elevation
resolution to resolve to 1%
grinder bumps

Diamond GrindingDiamond GrindingDiamond GrindingDiamond GrindingDiamond GrindingDiamond GrindingDiamond GrindingDiamond GrindingVery small diamond
grinder bumps
14

Longitudinal Longitudinal Longitudinal Longitudinal Longitudinal Longitudinal Longitudinal Longitudinal TiningTiningTiningTiningTiningTiningTiningTining
Count 10
Passing 98% 100.0%
Mean 99.7%
Min 99.6%
Max 99.9%
Repeatability (IRI)
Count 10
Passing 98% 100.0%
Mean 99.7%
Min 99.6%
Max 99.9%
Repeatability (IRI)
15
Max 99.9%
Std Dev 0.11%
Max 99.9%
Std Dev 0.11%
Mean (m/km) 1.25
Min (m/km) 1.25
Max (m/km) 1.25
Std Dev (m/km) 0.0012
Std Dev (%) 0.10%
Ride Quality (IRI)
Mean (m/km) 1.25
Min (m/km) 1.25
Max (m/km) 1.25
Std Dev (m/km) 0.0012
Std Dev (%) 0.10%
Ride Quality (IRI)
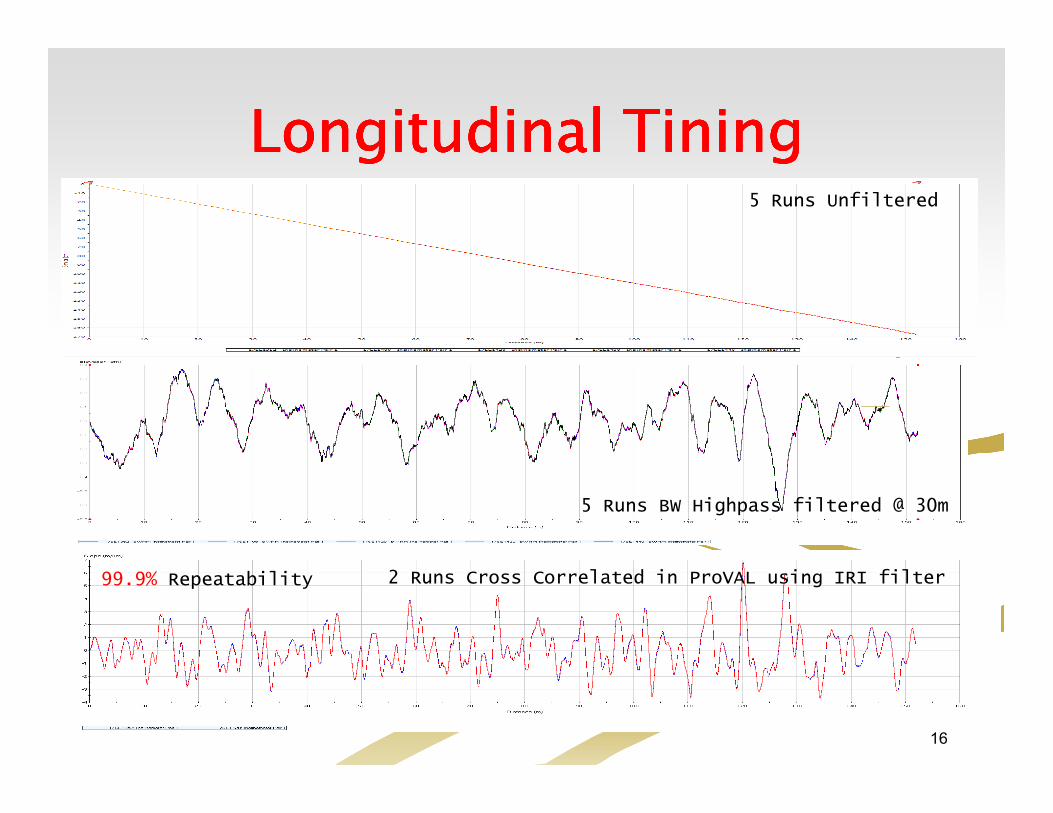
Longitudinal Longitudinal Longitudinal Longitudinal Longitudinal Longitudinal Longitudinal Longitudinal TiningTiningTiningTiningTiningTiningTiningTining5 Runs Unfiltered
16
5 Runs BW Highpass filtered @ 30m
2 Runs Cross Correlated in ProVAL using IRI filter99.9% Repeatability

12.5mm SMA12.5mm SMA12.5mm SMA12.5mm SMA12.5mm SMA12.5mm SMA12.5mm SMA12.5mm SMA
Count 10
Passing 98% 100.0%
Mean 99.7%
Min 99.4%
Max 99.9%
Repeatability (IRI)
Count 10
Passing 98% 100.0%
Mean 99.7%
Min 99.4%
Max 99.9%
Repeatability (IRI)
17
Max 99.9%
Std Dev 0.16%
Max 99.9%
Std Dev 0.16%
Mean (m/km) 1.93
Min (m/km) 1.93
Max (m/km) 1.94
Std Dev (m/km) 0.0039
Std Dev (%) 0.20%
Ride Quality (IRI)
Mean (m/km) 1.93
Min (m/km) 1.93
Max (m/km) 1.94
Std Dev (m/km) 0.0039
Std Dev (%) 0.20%
Ride Quality (IRI)

12.5mm SMA12.5mm SMA12.5mm SMA12.5mm SMA12.5mm SMA12.5mm SMA12.5mm SMA12.5mm SMA5 Runs Unfiltered
5 Runs BW Highpass filtered @ 30m
18
2 Runs Cross Correlated in ProVAL using IRI filter99.9% Repeatability

Transverse Transverse Transverse Transverse Transverse Transverse Transverse Transverse TiningTiningTiningTiningTiningTiningTiningTining
Count 10
Passing 98% 100.0%
Mean 99.8%
Min 99.6%
Max 99.9%
Repeatability (IRI)
Count 10
Passing 98% 100.0%
Mean 99.8%
Min 99.6%
Max 99.9%
Repeatability (IRI)
19
Max 99.9%
Std Dev 0.09%
Max 99.9%
Std Dev 0.09%
Mean (m/km) 1.21
Min (m/km) 1.21
Max (m/km) 1.21
Std Dev (m/km) 0.0017
Std Dev (%) 0.14%
Ride Quality (IRI)
Mean (m/km) 1.21
Min (m/km) 1.21
Max (m/km) 1.21
Std Dev (m/km) 0.0017
Std Dev (%) 0.14%
Ride Quality (IRI)

Transverse Transverse Transverse Transverse Transverse Transverse Transverse Transverse TiningTiningTiningTiningTiningTiningTiningTining5 Runs Unfiltered
5 Runs BW Highpass filtered @ 30m
20
2 Runs Cross Correlated in ProVAL using IRI filter99.9% Repeatability

Specification ComparisonSpecification ComparisonSpecification ComparisonSpecification ComparisonSpecification ComparisonSpecification ComparisonSpecification ComparisonSpecification ComparisonSpecification Note Benchmark Note SurPRO
1 Repeatability (tested) 1 0.987 1 0.996
2 Elevation Accuracy (calculated) ? 2 0.993
3 Elevation Resolution (mm) 3 <0.3 using line slope or 0.08 4 0.002
4 Distance Resolution (mm) 5 0.23 6 0.038
5 Wavelength Response (m) 7 0.03 to ∞ 8 0.25 to ∞
6 Speed for reference quality (km/h) 9 0.55 10 1.5
7 Sample Acquisition Rate (sample/sec) 11 5 12 1000
8 Sample Acquisition Distance Interval (mm) 13 30.48 14 0.417
9 Sample Storage Distance Interval (mm) Programmable Programmable
10 Roll Correction (transverse tilt) Yes (tilt screens) Yes (accelerometer)
11 Pitch Correction (longitudinal tilt) Yes Not applicable
21
Note
1 average of six pavements using IRI, long and medium filters (source UMTRI).
2 see SurPRO accuacy calculation
3 0.3 mm is pixel height in worst case of horizontal (zero slope) line or 0.08 mm is laser jitter
4 Resolution of accelerometer and ADC
5 146mm wheel and 2000 pulse/rev encoder
6 6" wheel and 12,500 pulse/rev encoder
7 limited by sample acquisition distance
8 limited by geometry, esp. wheel spacing
9 152.4 mm/sec
10 limited by choice to achieve highest quality reference data
11 laser sweep rate
12 data acquisition sampling rate
13 152.4 mm/sec and 5 sweeps/sec laser
14 1.5 km/hr and 1000 samples/sec
Comment Sources
1 Final Benchmark Testing Plan September 2009
2 SurPRO Specification
3 FHWA Benchmark Test Results September 2010
11 Pitch Correction (longitudinal tilt) Yes Not applicable
12 Primary Device Reference Plane of sweeping laser Direction of gravity
13 Crew Size (after setting line) 2 1
14 Sections per 528' profile 3 to 4 1
15 Time to collect 528' profile (min) 60 6.5
16 Price about $500k call for pricing
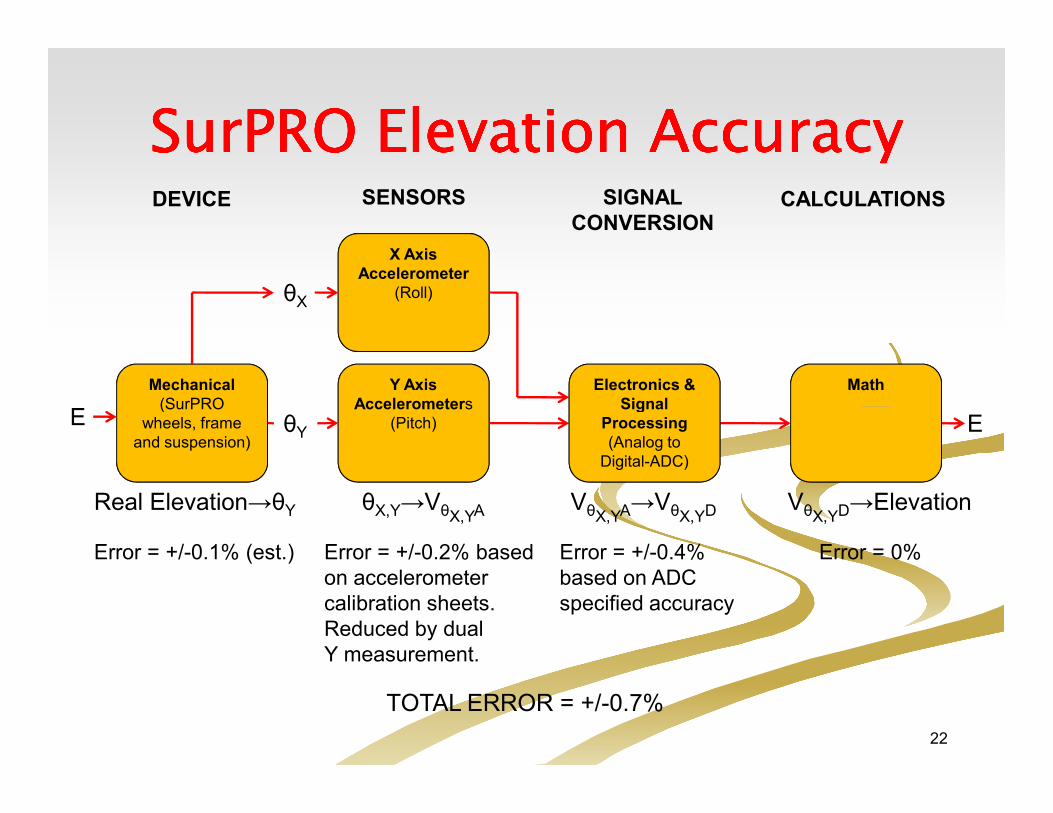
SurPRO Elevation AccuracySurPRO Elevation AccuracySurPRO Elevation AccuracySurPRO Elevation AccuracySurPRO Elevation AccuracySurPRO Elevation AccuracySurPRO Elevation AccuracySurPRO Elevation Accuracy
Mechanical(SurPRO
Y AxisAccelerometers
X AxisAccelerometer
(Roll)θX
E
DEVICE SENSORS SIGNALCONVERSION
CALCULATIONS
Electronics & Signal
Math
22
(SurPRO
wheels, frame
and suspension)
Accelerometers(Pitch)θY
E
Real Elevation→θY θX,Y→VθX,YA VθX,YA→VθX,YD VθX,YD→Elevation
E
Error = +/-0.1% (est.) Error = +/-0.2% based
on accelerometer
calibration sheets.
Reduced by dual
Y measurement.
Error = +/-0.4%
based on ADC
specified accuracy
Error = 0%
TOTAL ERROR = +/-0.7%
Signal Processing(Analog to
Digital-ADC)

RepeatabilityRepeatabilityRepeatabilityRepeatabilityRepeatabilityRepeatabilityRepeatabilityRepeatabilityLong, IRI and Medium WavebandsLong, IRI and Medium WavebandsLong, IRI and Medium WavebandsLong, IRI and Medium WavebandsLong, IRI and Medium WavebandsLong, IRI and Medium WavebandsLong, IRI and Medium WavebandsLong, IRI and Medium Wavebands
Long
IRI
Medium0.970
0.975
0.980
0.985
0.990
0.995
1.000
0.995-1.000
0.990-0.995
0.985-0.990
0.980-0.985
0.975-0.980
0.970-0.975
Long
IRI
Medium0.970
0.975
0.980
0.985
0.990
0.995
1.000
0.995-1.000
0.990-0.995
0.985-0.990
0.980-0.985
0.975-0.980
0.970-0.975
Pass level = 0.98
Test Section Long IRI Medium
Dense Graded AC 1.000 0.997 0.996
12.5 mm SMA 0.999 0.997 0.996
Chip Seal 0.999 0.994 0.991
Transverse Tining 0.997 0.997 0.992
Longitudinal Tining 0.998 0.997 0.997
Diamond Grinding 2 1.000 0.993 0.980
Average
SurP
RO
0.996
23
Long
IRI
Medium0.970
0.975
0.980
0.985
0.990
0.995
1.000
0.995-1.000
0.990-0.995
0.985-0.990
0.980-0.985
0.975-0.980
0.970-0.975
Long
IRI
Medium0.970
0.975
0.980
0.985
0.990
0.995
1.000
0.995-1.000
0.990-0.995
0.985-0.990
0.980-0.985
0.975-0.980
0.970-0.975
SurPRO
Benchmark
Pass level = 0.98
Test Section Long IRI Medium
Dense Graded AC 0.990 0.979 0.985
12.5 mm SMA 0.996 0.978 0.980
Chip Seal 0.996 0.991 0.995
Transverse Tining 0.986 0.971 0.978
Longitudinal Tining 0.990 0.994 0.996
Diamond Grinding 2 0.998 0.978 0.980
Average
Ben
chm
ark
0.987

0.750
0.800
0.850
0.900
0.950
1.000
SurPRO
Benchmark
Pass
0.750
0.800
0.850
0.900
0.950
1.000
SurPRO
Benchmark
Pass
RepeatabilityRepeatabilityRepeatabilityRepeatabilityRepeatabilityRepeatabilityRepeatabilityRepeatabilityShort WavebandShort WavebandShort WavebandShort WavebandShort WavebandShort WavebandShort WavebandShort Waveband
Pass level = 0.94
Test Section SurPRO Benchmark
Dense Graded AC 0.922 0.770
12.5 mm SMA 0.952 0.961
Chip Seal 0.905 0.969
Transverse Tining 0.925 0.832
Longitudinal Tining 0.945 0.881
Diamond Grinding 2 0.921 0.759
Average 0.928 0.862
Sh
ort
Sh
ort
Sh
ort
Sh
ort
0.7500.750
24
Short
Waveband Short Wavelength Long Wavelength
1.25 m (4 ft)
Usually filtered using moving
average to 0.25 m (0.82ft)
Long Waveband 8 m (25 ft) 40 m (125 ft)
Medium Waveband 1.6 m (5 ft) 8 m (25 ft)
Short Waveband 0.32 m (1 ft) 1.6 m (5 ft)
Certification Wavebands
IRI Filter Output 30 m (98.4 ft)
Waveband Short Wavelength Long Wavelength
1.25 m (4 ft)
Usually filtered using moving
average to 0.25 m (0.82ft)
Long Waveband 8 m (25 ft) 40 m (125 ft)
Medium Waveband 1.6 m (5 ft) 8 m (25 ft)
Short Waveband 0.32 m (1 ft) 1.6 m (5 ft)
Certification Wavebands
IRI Filter Output 30 m (98.4 ft)

AccuracyAccuracyAccuracyAccuracyAccuracyAccuracyAccuracyAccuracyCompared to Benchmark DeviceCompared to Benchmark DeviceCompared to Benchmark DeviceCompared to Benchmark DeviceCompared to Benchmark DeviceCompared to Benchmark DeviceCompared to Benchmark DeviceCompared to Benchmark Device
Test Section Result Comment
Dense Graded AC √ *Passed 2010
12.5mm SMA √ High correlation 2010 (test conditions didn't match BMD)
Chip Seal √ *Passed 2010
Transverse Tining √ *Passed 2009 (slabs curled when BMD tested in sunlight in 2010)
Diamond Grinding 2 √ High correlation 2009 (test conditions didn't match BMD in 2010)
Longitudinal Tining √ High correlation 2009 (test conditions didn't match BMD in 2010)
25
*Note: several filters
Benchmark Device (BMD) and SurPRO at MnRoad in September 2010

FHWA Reference Profiler FHWA Reference Profiler FHWA Reference Profiler FHWA Reference Profiler FHWA Reference Profiler FHWA Reference Profiler FHWA Reference Profiler FHWA Reference Profiler Benchmark Testing RecapBenchmark Testing RecapBenchmark Testing RecapBenchmark Testing RecapBenchmark Testing RecapBenchmark Testing RecapBenchmark Testing RecapBenchmark Testing Recap
Mean repeatability cross correlation for all six Mean repeatability cross correlation for all six sections (IRI, long & medium filter) was *99.6%sections (IRI, long & medium filter) was *99.6%
Individual cross correlations of 99.9% and 100.0%. Individual cross correlations of 99.9% and 100.0%.
Accuracy cross correlation to Benchmark Device Accuracy cross correlation to Benchmark Device was very goodwas very goodwas very goodwas very good
IRI standard deviation <0.5% on all six sectionsIRI standard deviation <0.5% on all six sections0.08% on dense graded AC, 0.1% on long. 0.08% on dense graded AC, 0.1% on long. tiningtining
SurPROSurPRO was insensitive to operator bias such as was insensitive to operator bias such as acceleration and transverse tilting motionacceleration and transverse tilting motion
Up to 99.9% repeatability using different operatorsUp to 99.9% repeatability using different operators
26*Note: Using data from 2nd visit to Diamond Grinding section

# # # # Feature Feature Feature Feature SurPROSurPROSurPROSurPRO2000200020002000
SurPROSurPROSurPROSurPRO3000300030003000
SurPROSurPROSurPROSurPRO3500350035003500
1 70mm (2.94") Wheels √ √ √ √ √√√√2 Tire Bridging Software Filter √ √ √ √ √√√√3 Other Software Upgrades
-ProVAL .PPF and TxDOT .PRO Files-Flexible File Naming-Alarms when profiling too fast or on high texture pavements
√ √ √ √ √ √ √ √
SurPROSurPROSurPROSurPROSurPROSurPROSurPROSurPRO ModelsModelsModelsModelsModelsModelsModelsModels
-Alarms when profiling too fast or on high texture pavements
4 Accelerometers 2 2 33335 New V2 Hardware for
High Resolution Data Acquisition √√√√
6 Math Optimizations √√√√7 Operator Aids for High Repeatability √√√√8 USB Port for Quick Download to Flash Drive √√√√
-Alarms when profiling too fast or on high texture pavements
4 Accelerometers 2 2 33335 New V2 Hardware for
High Resolution Data Acquisition √√√√
6 Math Optimizations √√√√7 Operator Aids for High Repeatability √√√√8 USB Port for Quick Download to Flash Drive √√√√
27
Model “3000+” Tested at MnRoad/WisconsinTable 1.

Pricing of New SurPRO 3500Pricing of New SurPRO 3500Pricing of New SurPRO 3500Pricing of New SurPRO 3500Pricing of New SurPRO 3500Pricing of New SurPRO 3500Pricing of New SurPRO 3500Pricing of New SurPRO 3500and Upgradesand Upgradesand Upgradesand Upgradesand Upgradesand Upgradesand Upgradesand Upgrades
New SurPRO 3500 and UpgradesNew SurPRO 3500 and UpgradesNew SurPRO 3500 and UpgradesNew SurPRO 3500 and Upgrades PricePricePricePriceSurPRO 3500 Profiler with All Features in Table 1.-Case, accessories, firmware and software-On site training
New SurPRO 3500 and UpgradesNew SurPRO 3500 and UpgradesNew SurPRO 3500 and UpgradesNew SurPRO 3500 and Upgrades PricePricePricePriceSurPRO 3500 Profiler with All Features in Table 1.-Case, accessories, firmware and software-On site training
28
-On site training-Maintenance and support
Upgrade SurPRO 2000 to SurPRO 3500Upgrade SurPRO 3000 to SurPRO 3500
-On site training-Maintenance and support
Upgrade SurPRO 2000 to SurPRO 3500Upgrade SurPRO 3000 to SurPRO 3500

Thanks!Thanks!Thanks!Thanks!Thanks!Thanks!Thanks!Thanks!
For more information including a copy For more information including a copy of this presentation please go to:of this presentation please go to:
��surpro.comsurpro.com
internationalcybernetics.cominternationalcybernetics.com
For more information including a copy For more information including a copy of this presentation please go to:of this presentation please go to:
��surpro.comsurpro.com
internationalcybernetics.cominternationalcybernetics.com��internationalcybernetics.cominternationalcybernetics.com��internationalcybernetics.cominternationalcybernetics.com
29