surkesnas 2001 national household health … hapsari introduction the world health organization...
TRANSCRIPT

SURKESNAS 2001
National Household Health Survey Morbidity Study
NCD RISK FACTORS IN INDONESIA
By
S. Soemantri Julianty Pradono
Dwi Hapsari

Introduction The World Health Organization (WHO) is pursuing surveillance as part of a global strategy for preventing and controlling NCDs and the major risk factors that predict them. The WHO’s STEPwise approach to surveillance for NCD risk factors is based on standardized data collection and a methodology that can be adapted to a variety of country settings. The STEPwise approach encourages the development of an increasingly comprehensive surveillance system that meets local needs. Moreover, for sustainable surveillance, the STEPwise approach emphasizes small amounts of good quality data over large amounts of poor quality data.
Indonesia Health Survey known as Survei Kesehatan Nasional (Surkesnas) is an attempt to integrate all national-scope health surveys (National Household Health Survey (NHHS), National Socio-Economic Survey (NSES) and Indonesia Demographic Health Survey (IDHS)). The integration focuses on the use of common sampling design, format of instruments, collaboration on survey preparation, training, field operation and data utilization. The spirit of survey integration would not only lead towards cost effective data collection but also avoid redundancy and extend the data availability. Surkesnas can be considered as an approach of integrating various existing data collection system to provide sustainable and optimal information for evidence (survey) based programming. Sustainability of the surveys inspire the possibility rearranging system into surveillance system.
SURKESNAS 2001 was integrated surveys of NHHS 2001 (mortality study, morbidity study, MCH study and pregnant women follow up study), NSES 2001 (health module) and IDHS 2002 (MCH module). NHHS 2001 has incorporated STEPS approach within one of its component study: Morbidity Study.
Scope of STEPS within Morbidity Study
One component of NHHS 2001 is Morbidity Survey which Steps was incorporated within the study instrument. Scope of Steps within this study includes Step one, questions on smoking, alcohol consumption and physical activity. First version of Step one questionnaire was adapted with some modification (see attachment 1). Step two includes measurement on height, weight, waist, hip and blood pressure. Microtoise was used to measure body height, digital uniscale to measure body weight, and mercury sphygmomanometer to measure blood pressure. Steps three includes measurement of blood glucose and total cholesterol (for specific area only: Java and Bali) and Accutrend GC (dry chemistry) was used to collect blood glucose and total cholesterol.

Data collection of morbidity survey was executed by 78 field teams of NHHS 2001, each team consists of 2 medical doctors (male, female), one midwife, one laboratory technician and one field coordinator (supervisor).
NHHS 2001 sampling design.
Sampling scheme of NSES 2001 was used for NHHS 2001. NSES 2001 employed principle of multi stages sampling design. For urban areas, census blocks (CB’s) were selected systematically, and 16 households were drawn in each selected CB also systematically. For rural areas firstly sub-districts were selected with PPS, secondly two CBs selected randomly in each selected sub-district and finally 16 households were drawn systematically in each selected CB. NSES 2001 has sample size of 220,896 HH (13,806 CB) for Core and 65,280 HH (4,080 CB) for Module. Core sample of NSES 2001 was also used for the sample of Mortality Study of NHHS 2001. Forty percent of module sample of NSES 2001 was allocated for sample of NHHS 2001: MCH and Pregnant women FU Studies, and 25% of HHs within this sample was allocated for NHHS 2001: Morbidity Survey.
Morbidity survey was able to cover 98% of sampled census blocks, but only 84% of households within the covered census blocks could be visited and 97% of household members of those visited households were successfully interviewed/examined.
Findings
Total sample of 13,131 persons aged 15 years + for Indonesia was analysed descriptively for NCD risk factors (Step 1 and Step 2), and only 4,081 persons aged 25 years + in Java-Bali included for blood glucose and total cholesterol descriptive analysis (steps 3). Table 1 shows distribution of sampled persons aged 15 years+ by age group and gender for Indonesia, and Table 2 shows distribution of sampled persons aged 25 years+ by age group and gender for Java and Bali. Sampling design of NSES provides weight for each household selected in the sample, and this weight was used to calculate the sample distribution (weighted n).
Table 3 shows prevalence rates of various NCD risk factors by age group, gender and residence. 31% of sampled population aged 25 years + are current daily smoker. Current daily smoker increases by age group except for the oldest. Smoking is more prevalent for male and in rural. Alcohol consumption was reported very low only 3%, more prevalent for male and in rural. Physical inactivity is very high (63%), more prevalent in urban area than in rural area, and more prevalent for female than male. High blood pressure was reported for 28% sampled population, increasing by age group, more

prevalent in urban and for female. Indication of obesity (21%) is shown by prevalence rates of persons with WHR >1 for male and >0.85 for female, which is more prevalent for women and for those live in urban. Similar pattern is also shown by percentage of BMI ≥ 25kg/m2,16% of persons aged 25 years+ have BMI ≥ 25 kg/m2. Prevalence of hyperglycemia (capillary blood glucose ≥ 110mg%) is 8% and prevalence of those with total cholesterol above 200mg% is 7%.
Mean and prevalence rates for each risk factor by age group and gender are shown
in Tables 4-14.
Table 1 Weighted n (sample) distribution of persons aged 15 years+ by age and gender.
Morbidity Study (NHHS) 2001
Age (years) Male
Weighted n Female
Weighted n Both sexes Weighted n
15-24 1444 1658 3102 25-34 1326 1728 3054 35-44 1266 1471 2737 45-54 943 1002 1945 55-64 645 629 1274 65+ 506 515 1021
Total 6130 7003 13133
Table 2. Weighted n (sample) distribution of persons aged 25 years+ by age and gender
in Java-Bali, Morbidity Study (NHHS) 2001
Male Female Both sexes Age (years) Weighted n Weighted n Weighted n
25 – 34 572 739 1311 35 – 44 522 597 1119 45 – 54 372 417 789 55 – 64 252 244 496
65 + 177 189 366 Total 1895 2186 4081

Table 3
Prevalence of NCD risk factors for persons aged 25 years and above by age group, gender, and residence, Morbidity Study (NHHS) 2001
Characteristic
Current daily smokers
Current alcohol drink
In-
active
Tension ≥140/≥90 mmHg
WHR risk (M>1.0; F>0.85)
BMI≥ 25 kg/m2
Capillary blood
glucose ≥ 110 mg%
Total choles- terol
>200mg%
Weighted n
Age group(yr) 25-34 27.7 3.3 64.6 10.8 17.2 13.2 5.0 3.6 3,054 35-44 31.8 3.8 60.6 22.2 19.6 21.3 7.3 7.7 2,737 45-54 33.7 2.7 60.6 35.0 23.4 20.8 9.5 8.7 1,945 55-64 37.3 2.5 61.5 47.4 23.3 12.9 10.7 10.6 1,274 65+ 30.2 2.5 73.0 55.3 27.0 6.9 9.7 6.2 1,021
Sex Male 63.5 5.8 56.7 26.5 2.1 10.2 8.9 5.8 4,686 Female 3.3 0.8 68.9 28.9 37.4 21.4 6.9 7.9 5,345 Residence Urban 29.7 2.4 74.7 29.9 22.5 22.8 8.9 8.9 4,082 Rural 32.7 3.7 55.3 26.4 19.8 11.7 6.9 5.2 5,949
Total 31.4 3.2 63.2 27.8 20.9 16.2 7.8 6.9 10,031
Tables 4a and 4b show prevalence of tobacco use by age group for male and female. Prevalence for male is much higher than for female. For male 78% is ever smokers, 58% is current daily smokers and the figures for female are 6% and 3% respectively. Both male and female current daily smokers have similar median age at start of daily smoking i.e. 19 years old.
Table 4a Prevalence of tobacco use for male by age group,
Morbidity Study (NHHS) 2001
Age group (years)
Ever smokers
(%)
Current daily
smokers (%)
Ex-daily smokers
(%)
Median age at start (yrs) for current daily
smoker
Weighted n
15-24 60.9 41.3 4.9 16.0 1444 25-34 79.6 61.5 14.3 18.0 1326 35-44 82.1 65.1 21.8 20.0 1266 45-54 83.8 64.9 27.5 20.0 943 55-64 88.9 68.1 44.6 20.0 645 65+ 89.1 56.5 52.8 20.0 506
Total 78.1 58.3 20.3 19.0 6130

Table 4b Prevalence of tobacco use for female by age group
Morbidity Study (NHHS) 2001
Age
(years)
Ever smokers
(%)
Current daily
smokers (%)
Ex-daily smokers
(%)
Median age at start (yrs) for current daily
smoker
Weighted n
15-24 3.9 1.5 0.4 14.0 1658 25-34 4.3 1.7 0.4 17.0 1728 35-44 5.7 3.1 0.6 23.9 1471 45-54 8.6 4.3 0.9 21.0 1002 55-64 7.6 5.6 1.0 19.0 629 65+ 9.5 4.3 2.5 20.0 515
Total 5.8 2.9 0.7 19.0 7003
Alcohol consumption was reported very low in the community. Only 6% among
male respondents reported as current alcohol consumer, and 22% reported as ever consumer. Lower percentages were reported by female respondents, i.e., 1% and 2% respectively (Tables 5a and b).
Table 5a
Prevalence of alcohol consumption for male by age group, Morbidity Study (NHHS) 2001
Age (years)
Ever consumed alcohol (%)
Current alco-hol use (%)
Abstainers (%) Weighted n
15-24 19.6 5.3 80.4 1444 25-34 28.6 6.9 71.4 1326 35-44 27.4 6.7 72.6 1266 45-54 19.7 5.1 80.3 943 55-64 17.9 4.0 82.1 645 65+ 16.1 4.0 83.9 506
Total 22.7 5.7 77.3 6130
Table 5b Prevalence of alcohol consumption for female by age group
Morbidity Study (NHHS) 2001
Age (years)
Ever consumed alcohol
(%)
Current alcohol use
(%)
Abstainers (%)
Weighted n
15-24 1.4 0.6 98.6 1658 25-34 1.5 0.6 98.5 1728 35-44 2.3 1.3 97.7 1471 45-54 2.3 0.6 97.7 1002 55-64 1.4 0.8 98.6 629 65+ 2.2 1 97.8 515
Total 1.8 0.8 98.2 7003

Tables 6a and 6b show mean of percentages of time (hours) of respondent’s physical activity classified as “inactive” (see questionnaire: mean of percentages of total physical activity falling in categories c11 or c14 or c17). Mean of percentages inactive time is 59% for male and 64% for female. Age groups of 45-64 for male and 35-54 for female are relatively more active than other age groups.
Table 6a
Mean of percentages inactive time for male by age groups, Morbidity Study (NHHS) 2001
Male Age
(years) Weightedn Mean (95% CI)
15-24 1444 63.5 62.3-64.7 25-34 1326 58.5 57.2-59.8 35-44 1266 57.8 56.4-59.2 45-54 943 56.2 54.6-57.8 55-64 645 55.6 53.7-57.5 65+ 506 62.2 59.8-64.6
Total 6130 59.2 58.6-59.8
Missing: male 74 (1.2%)
Table 6b
Percent distribution of mean inactive time for female by age groups, Morbidity Study (NHHS) 2001
Female Age (years) Weighted
n Mean (95% CI)
15-24 1658 66.7 65.6-67.8 25-34 1728 62.7 61.6-63.8 35-44 1471 60.3 59.1-61.5 45-54 1002 60.4 59.0-61.8 55-64 629 64.5 62.6-66.4 65+ 515 71.0 68.9-73.0
Total 7003 63.6 63.1-64.1
Missing female: 83 (1.2%)
Tables 6c and d show prevalence of respondent classified as inactive. i.e., those respodents that more 50% of their physical activities are classified as “inactive” (see questionnaire: falling in categories c11, c14 or c17). 59% for male and 70% for female

are inactive. Age groups of 45-64 for male and 35-54 for female are relatively more active than other age groups.
Table 6c Prevalence of inactive time for male by age group,
Morbidity Study (NHHS) 2001
Male Age (years) Weighted n % (95% CI)
15-24 1444 68.1 68.08 – 68.12 25-34 1326 58.8 58.77 – 58.83 35-44 1266 55.4 55.37 – 55.43 45-54 943 53.4 53.37 – 53.43 55-64 645 53.1 53.06 – 53.14 65+ 506 65.1 65.06 – 65.14
Total 6130
59.4 59.39 – 59.41
Missing: male 74 (1.2%)
Table 6d
Prevalence of inactive time for female by age group, Morbidity Study (NHHS) 2001
Female Age
(years) Weighted n % (95% CI)
15-24 1658 75.4 75.38 – 75.42 25-34 1728 69.2 69.18 – 69.22 35-44 1471 65.1 65.08 – 65.12 45-54 1002 67.4 67.37 – 67.43 55-64 629 70.3 70.26 – 70.34 65+ 515 81.1 81.06 – 81.14
Total 7003 70.5 70.49 – 70.51
Missing: Female 83 (1.2%)
Mean of weight for female (48 kg) is lower than mean of weight for male (51 kg). Tables 7a and 7b. The highest weight for both male and female is for age group 35-44. Mean of height for male is 158cm, 9 cm higher than for female (149 cm). Younger age group is generally higher than older age group (Table 8a, 8b).

Table 7 a Mean of weight for male by age group,
Morbidity Study (NHHS) 2001
Male Age (years) Weighted n Mean (95%CI)
15-24 1444 51.5 51.1-51.9 25-34 1326 56.1 55.7-56.5 35-44 1266 57.0 56.3-57.5 45-54 943 55.9 55.3-56.5 55-64 645 52.6 51.8-53.4 65+ 506 49.5 48.7-50.3
Total 6130 51.3 51.1-51.5 Missing: male 158 (2.6%)
Table 7b Mean of weight for female by age group,
Morbidity Study (NHHS) 2001
Female Age (years) Weighted n Mean (95%CI)
15-24 1658 47.2 46.8-47.6 25-34 1728 50.6 50.2-51.0 35-44 1471 52.9 52.3-53.5 45-54 1002 51.5 50.9-52.1 55-64 629 48.1 47.3-48.9 65+ 515 43.8 43.0-44.6
Total 7003 47.7 47.5-47.9 Missing: female 131 (1.9%)
Table 8a Mean of height in male by age group,
Morbidity Study (NHHS) 2001
Male Age (years) Weighted n Mean (95%CI)
15-24 1444 160.5 160.1-160.9 25-34 1326 162.0 161.6-162.4 35-44 1266 161.3 160.9-161.7 45-54 943 160.6 160.2-161.0 55-64 645 159.0 158.3-159.5 65+ 506 157.5 156.9-158.1
Total 6130 157.6 157.4-157.8
Missing: male 158 (2.6%)

Table 8b Mean of height in female by age group,
Morbidity Study (NHHS) 2001
Female Age (years) Weighted n Mean (95%CI)
15-24 1658 151.4 151.2-151.6 25-34 1728 151.3 151.1-151.5 35-44 1471 151.0 150.6-151.4 45-54 1002 149.9 149.5-150.3 55-64 629 148.8 148.4-149.2 65+ 515 146.9 146.3-147.5
Total 7003 149.2 149.0-149.4
Missing: female 131 (1.9%)
Mean of body mass index (BMI) for male is 20, a little bit lower than BMI for female (21). Proportion of male respondents with BMI ≥ 25 is 8%, and for female more than double (17%) falls in this category. Both for male and female age group 35-54 tend to fall in the category compared to other age groups (Tables 9a, 9b, 10a, and 10b). Only 1 % of male respondents fall in the category BMI ≥ 30, and for female respondents the percentage is 4% (Tables 10c and 10d).
Table 9a Mean of body mass index for male by age group,
Morbidity Study (NHHS) 2001
Male Age (years) Weighted n Mean (95%CI)
15-24 1444 19.9 19.8-20.0 25-34 1326 21.4 21.2-21.6 35-44 1266 21.9 21.7-22.1 45-54 943 21.7 21.5-21.9 55-64 645 20.8 20.6-21.0 65+ 506 19.9 19.7-20.1
Total 6130 20.4 20.3-20.5
Missing: male 158 (2.6%)

Table 9b Mean of body mass index for female by age group.
Morbidity Study (NHHS) 2001
Female Age (years) Weighted n Mean (95%CI)
15-24 1658 20.5 20.4-20.6 25-34 1728 22.1 21.9-22.3 35-44 1471 23.2 22.9-23.4 45-54 1002 22.9 22.6-23.2 55-64 629 21.6 21.3-21.9 65+ 515 20.3 19.9-20.7
Total 7003 21.3 21.2-21.4
Missing: female 131 (1.9%)
Table 10a
Prevalence of BMI ≥ 25 kg/m2 for male by age group, Morbidity Study (NHHS) 2001
Male Age
(years) % Weighted n 15-24 2.1 1444 25-34 7.6 1326 35-44 13.1 1266 45-54 13.7 943 55-64 7.3 645 65+ 4.2 506 Total 8.1 6130
Missing: male 158 (2.6%)
Table 10b Prevalence of BMI ≥ 25 kg/m2 for female by age group,
Morbidity Study (NHHS) 2001
Female Age (years) % Weighted n
15-24 5.5 1658 25-34 16.6 1728 35-44 27.4 1471 45-54 26.4 1002 55-64 18.4 629 65+ 9.2 515 Total 17.3 7003
Missing: female 131 (1.9%)

Table 10c Prevalence of BMI ≥ 30 kg/m2 for male by age group,
Morbidity Study (NHHS) 2001
Male Age (years) % Weighted n
15-24 0.3 1444 25-34 0.8 1326 35-44 1.2 1266 45-54 2.3 943 55-64 0.9 645 65+ 1.2 506 Total 1.1 6130
Missing: male 158 (2.6%)
Table 10d Prevalence of BMI ≥ 30 kg/m2 for female by age group,
Morbidity Study (NHHS) 2001
Female Age (years) % Weighted n
15-24 0.9 1658 25-34 3.2 1728 35-44 6.9 1471 45-54 4.9 1002 55-64 2.9 629 65+ 2.6 515 Total 3.6 7003
Missing: female 131 (1.9%)
There is no significant difference between male and female mean of waist to hip
ratio (WHR), 0.86 for male and 0.83 for female (Tables 11a and 11b). However when we look at prevalence of central obesity (WHR >1.0 for male and WHR>0.85for female) there is huge difference between male (2%) and female (38%). Difficulty to measure waist and hip for female respondents by interviewer may be one reason for the difference. Prevalence of central obesity increases by age group for female (Tables 11c and d).

Table 11a Mean of waist to hip ratio for male by age group,
Morbidity Study (NHHS) 2001
Male Age (years) Weighted n Mean (95%CI)
25-34 1326 0.85 0.81-0.89 35-44 1266 0.86 0.82-0.9 45-54 943 0.87 0.83-0.91 55-64 645 0.87 0.81-0.93 65+ 506 0.86 0.8-0.92
Total 4686 0.86 0.84-0.88 Mising: male 344 (7.3%)
Table 11b
Mean of waist to hip ratio for female by age group. Morbidity Study (NHHS) 2001
Female Age
(years) Weighted n Mean (95%CI)
25-34 1728 0.81 0.78-0.86 35-44 1471 0.83 0.79-0.87 45-54 1002 0.84 0.78-0.9 55-64 629 0.85 0.79-0.91 65+ 515 0.85 0.79-0.91
Total 5345 0.83 0.81-0.85 Missing: female 241 (4.5%)
Table 11c Prevalence of high risk of waist to hip ratio for male by age group.
Morbidity Study (NHHS) 2001
Male Age
(years) Weighted n % (95%CI) 25-34 1326 1.3 1.24 – 1.36 35-44 1266 1.5 1.44 – 1.56 45-54 943 4.1 3.93 – 4.17 55-64 645 2.5 2.52 – 2.68 65+ 506 1.5 1.41 – 1.59
Total 4686 2.1 2.07 – 2.13 Mising: male 344 (7.3%)
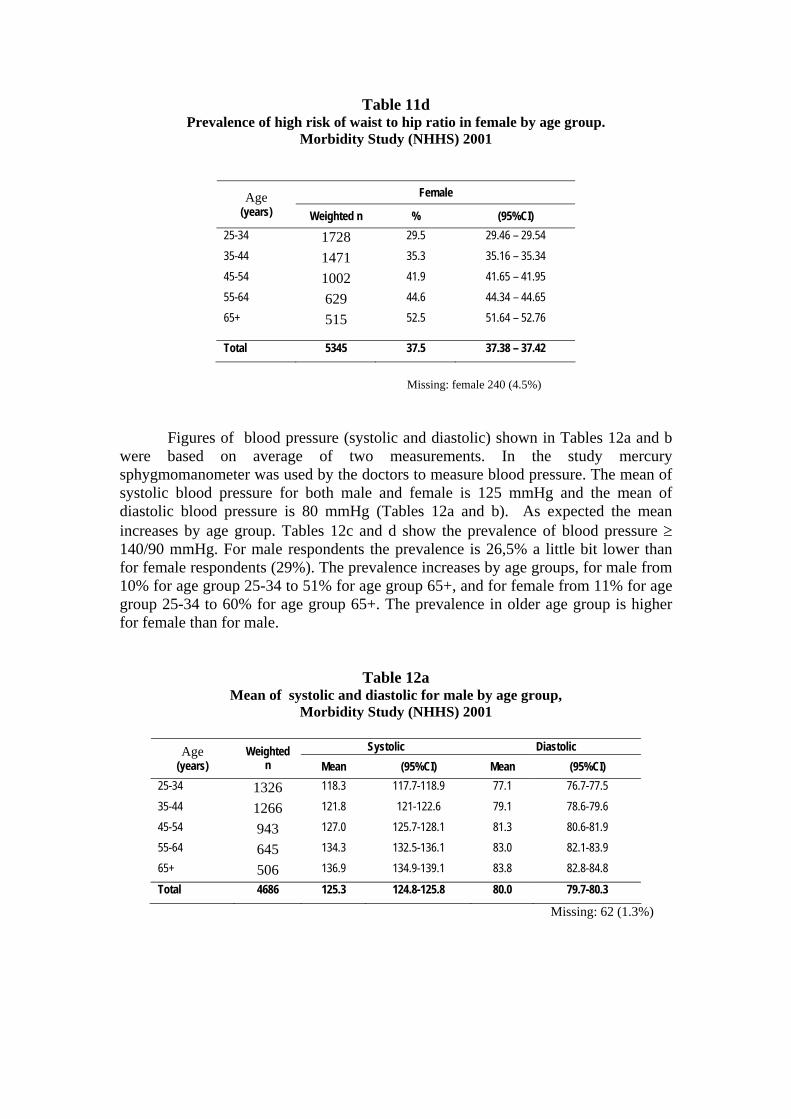
Table 11d Prevalence of high risk of waist to hip ratio in female by age group.
Morbidity Study (NHHS) 2001
Female Age
(years) Weighted n % (95%CI) 25-34 1728 29.5 29.46 – 29.54 35-44 1471 35.3 35.16 – 35.34 45-54 1002 41.9 41.65 – 41.95 55-64 629 44.6 44.34 – 44.65 65+ 515 52.5 51.64 – 52.76
Total 5345 37.5 37.38 – 37.42
Missing: female 240 (4.5%)
Figures of blood pressure (systolic and diastolic) shown in Tables 12a and b were based on average of two measurements. In the study mercury sphygmomanometer was used by the doctors to measure blood pressure. The mean of systolic blood pressure for both male and female is 125 mmHg and the mean of diastolic blood pressure is 80 mmHg (Tables 12a and b). As expected the mean increases by age group. Tables 12c and d show the prevalence of blood pressure ≥ 140/90 mmHg. For male respondents the prevalence is 26,5% a little bit lower than for female respondents (29%). The prevalence increases by age groups, for male from 10% for age group 25-34 to 51% for age group 65+, and for female from 11% for age group 25-34 to 60% for age group 65+. The prevalence in older age group is higher for female than for male.
Table 12a Mean of systolic and diastolic for male by age group,
Morbidity Study (NHHS) 2001
Systolic Diastolic Age (years)
Weighted n Mean (95%CI) Mean (95%CI)
25-34 1326 118.3 117.7-118.9 77.1 76.7-77.5 35-44 1266 121.8 121-122.6 79.1 78.6-79.6 45-54 943 127.0 125.7-128.1 81.3 80.6-81.9 55-64 645 134.3 132.5-136.1 83.0 82.1-83.9 65+ 506 136.9 134.9-139.1 83.8 82.8-84.8
Total 4686 125.3 124.8-125.8 80.0 79.7-80.3
Missing: 62 (1.3%)

Table 12b Mean of systolic and diastolic for female by age group,
Morbidity Study (NHHS) 2001
Systolic Diastolic Age (years) Weighted n
Mean (95%CI) Mean (95%CI)
25-34 1728 115.0 114.3-115.5 76.0 75.6-76.4 35-44 1471 122.1 121.3-123.1 79.4 78.8-79.9 45-54 1002 129.7 129.3-130.1 82.1 81.3-82.9 55-64 629 138.3 136.2-140.4 84.8 83.8-85.8 65+ 515 142.7 140.3-145.1 84.9 83.8-86.0
Total 5345 125.2 122.6-127.8 80.0 79.7-80.3
Missing: 47 (0.9%)
Table 12c Prevalence of blood pressure ≥ 140/90 mmHg for male by age group,
Morbidity Study (NHHS) 2001
Male Age (years) Weighted
n % (95%CI)
25-34 1326 10.4 10.35 – 10.45 35-44 1266 20.8 20.75 – 20.85 45-54 943 31.6 31.45 – 31.65 55-64 645 43.9 43.84 – 43.96 65+ 506 50.9 50.84 – 50.96
Total 4686 26.6 26.47 – 26.63 Missing: male 62 (1.3%)
Table 12d Prevalence of blood pressure ≥ 140/90 mmHg in female by age group,
Morbidity Study (NHHS) 2001
Female Age (years) Weighted n % (95%CI)
25-34 1728 11.1 11.05 – 11.15 35-44 1471 23.4 23.45 – 23.55 45-54 1002 38.2 38.15 – 38.25 55-64 629 51.0 50.94 – 51.06 65+ 515 59.6 59.64 – 59.76
Total 5345 28.9 28.98 – 29.02 Missing: female 47 (0.9%)

Accutrend GC (dry chemistry) was used to examine blood glucose and total cholesterol. The instrument used makes possible the field team observes the result immediately. The examination was only done in Java Bali.
Tables 13a-13b show mean of capillary fasting blood glucose for male and
female in Java and Bali. The mean for male is 85mg% and for female is 82mg%. Tables 13c depict the prevalence of fasting capillary glucose ≥ 110 mg% (hyperglycemia) for male (9%) and for female (7%). The prevalence increase by age group. If the criteria of ≥ 126mg% is used, the prevalence for male is 4% and for female is 3% (Table 13d).
Table 13a Mean of capillary fasting blood glucose (mg%) for male by age group,
Morbidity Study, Java-Bali (NHHS) 2001
Male Age (years) Weighted n Mean (95%CI) 25-34 572 81.9 79.9-83.9 35-44 522 83.9 81.1-86.7 45-54 372 86.2 83.0-89.4 55-64 252 84.8 82.0-87.6 65+ 177 91.4 85.0-97.8
Total 1895 84.9 83.5-86.3 Missing: male 365 (11.7%)
Table 13b Mean of fasting blood glucose (mg%) for female by age group,
Morbidity Study, Java-Bali (NHHS) 2001
Female Age (years) Weighted n Mean (95%CI) 25-34 739 75.8 74.2-77.4 35-44 597 81.6 79.2-84.0 45-54 417 86.3 82.7-89.9 55-64 244 86.8 82.6-91.0 65+ 189 83.7 79.7-87.7
Total 2186 81.6 80.3-82.9 Missing: female 432 (11.9%)

Table 13c Prevalence of capillary fasting blood glucose ≥ 110 mg% for male and female by
age group Morbidity Study, Java-Bali (NHHS) 2001
Male Female Age (years) Weighted n % Weighted n % 25-34 572 7.0 739 3.6 35-44 522 8.7 597 6.2 45-54 372 9.4 417 9.5 55-64 252 9.9 244 11.5 65+ 177 10.9 189 8.4
Total 1895 8.9 2186 6.9 Missing: male 365 (11.7%), female 432 (11.9%)
Table 13d Prevalence of capillary fasting blood glucose ≥ 126mg% by sex and age groups
Morbidity Study, Java-Bali (NHHS) 2001
Male Female Age (years) ≥ 126mg%
(%) N (weight) ≥ 126mg%
(%) N (weight)
25-34 2.8 572 0.8 739
35-44 3.9 522 3.6 597
45-54 4.4 372 5.1 417
55-64 4.8 252 5.3 244
65+ 7.3 177 3.9 189
Total 4.2 1895 3.3 2186
Missing: male 365 (11.7%); female 432 (11.9%) Tables 14a and b show mean of total cholesterol for male and female respondents in Java Bali. The mean for male is 171mg% and mean for female is 173mg%. Prevalence of total cholesterol > 200 mg% for male and female are 6% and 8% respectively (Tables 14c). Prevalence of hypercholesterolemia using cut off point total cholesterol ≥ 193.5 mg/dl is 9% for male and 11% for female (Table 14d).

Table 14a Mean of total cholesterol (mg%) for male by age group
Morbidity Study, Java-Bali (NHHS) 2001
Male Age (years) Weighted n Mean (95%CI) 25-34 572 165.9 164.1-167.7 35-44 522 171.1 168.9-173.3 45-54 372 175.5 172.7-178.3 55-64 252 173.5 170.5-176.5 65+ 177 168.9 165.9-171.9
Total 1895 170.8 169.6-172.0 Missing: male 390 (12.5%)
Table 14b Mean of total cholesterol (mg%) for female by age group
Morbidity Study, Java-Bali (NHHS) 2001
Female Age (years) Weighted n Mean (95%CI) 25-34 739 165.2 163.8-166.6 35-44 597 172.6 170.8-174.4 45-54 417 178.5 175.7-181.3 55-64 244 182.6 179.0-186.2 65+ 189 175.8 172.0-179.6
Total 2186 172.8 171.6-174.0 Missing: female 432 (11.9%)
Table 14c Prevalence of total cholesterol > 200 mg% for male and female by age group
Morbidity Study, Java-Bali (NHHS) 2001
Male Female Age (years) Weighted n % Weighted n % 25-34 572 3.9 739 3.4 35-44 522 7.4 597 8.1 45-54 372 6.1 417 11.2 55-64 252 6.6 244 14.8 65+ 177 5.2 189 7.2
Total 1895 5.8 2186 8.0 Missing: male 390 (12.5%), female 432 (11.9%)

Table 14d Prevalence of total cholesterol ≥ 193.5 mg/dl by sex and age groups
Morbidity Study, Java-Bali (NHHS) 2001
Male Female Age (years) ≥ 193.5 mg/ dl
(%) Weighted n ≥ 193.5 mg/ dl
(%) Weighted n
25-34 6.4 572 5.4 739
35-44 11.3 522 11.3 597
45-54 10.4 372 15.3 417
55-64 9.0 252 18.8 244
65+ 8.9 177 10.1 189
Total 9.2 1895 11.1 2186
Missing: male 391 (12.5%); female 432 (11.9%)
Obesity (BMI ≥30kg/m2)
0
1
2
3
4
5
6
7
8
15-24 25-35 35-44 45-54 55-64 65+
Age range
Per
cent Male
Female
Definition: BMI ≥ 30 kg/m2
Survey Population: National, both urban dan rural populations
Source: Ministry of Health; Indonesia Health Survey (Surkesnas)2001

Body Mass Index (mean)
18
19
20
21
22
23
24
15-24 25-34 35-44 45-54 55-64 65+
Age range
Mea
n (k
g/m
2 )
MaleFemale
Definition: kg/m2
Survey Population: National, both urban dan rural populationsSource: Ministry of Health; Indonesia Health Survey (Surkesnas)2001
Raised Blood Pressure (≥140/90 mmHg)
0
10
20
30
40
50
60
70
25-34 35-44 45-54 55-64 65+
Age range
Perc
ent
MaleFemale
Definition: SBP ≥140 mmHg /DBP>90 mmHgSurvey Population: National, both urban dan rural populationsSource: Ministry of Health; Indonesia Health Survey (Surkesnas)2001
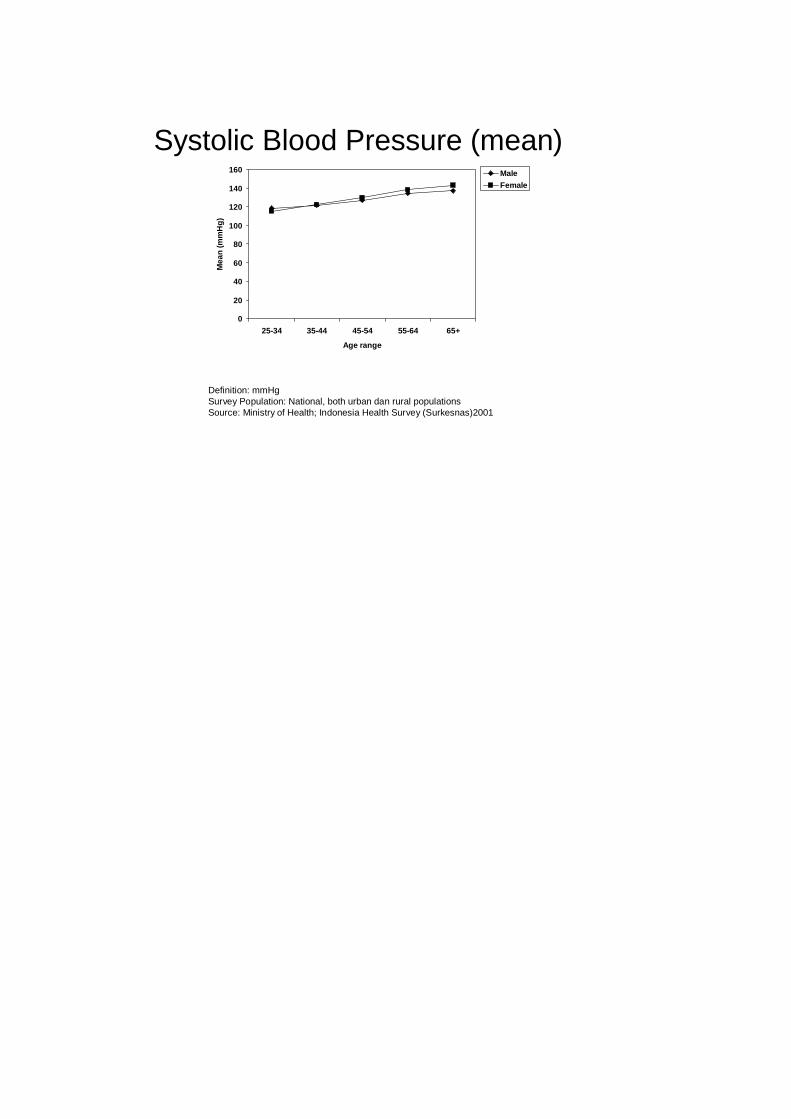
Systolic Blood Pressure (mean)
0
20
40
60
80
100
120
140
160
25-34 35-44 45-54 55-64 65+
Age range
Mea
n (m
mH
g)
MaleFemale
Definition: mmHgSurvey Population: National, both urban dan rural populationsSource: Ministry of Health; Indonesia Health Survey (Surkesnas)2001