surgically replacing the list: a roadmap for prostheses
TRANSCRIPT

Surgically Replacing the List: a Roadmap for Prostheses List Reform
Confidential Report | December 2020
PRIVATE HEALTHCARE AUSTRALIA

i
Table of Contents 1 Executive Summary .................................................................................................................... 1
2 Still costing an arm and a leg: challenges facing the current Prostheses List ................................. 7
2.1 The price challenge ..................................................................................................................... 8
2.2 The utilisation challenge ........................................................................................................... 11
2.3 The clinical challenge ................................................................................................................ 13
2.4 The administration challenge ................................................................................................... 15
3 Current distribution of value from prostheses reimbursement .................................................. 17
4 Segmentation of the Prostheses List ......................................................................................... 22
5 Summary of suggested reform package .................................................................................... 24
6 Detail on the suggested reform package ................................................................................... 29
6.1 Determination of what is included on the Prostheses List ........................................................ 29
6.2 Approach to funding items remaining on the Prostheses list ................................................... 31 6.2.1 The form of payment ...................................................................................................... 33 6.2.2 Responsibility for administration of fund flows and pricing ........................................... 36 6.2.3 Ownership over bundled payment .................................................................................. 37 6.2.4 Role of patient gap payments ......................................................................................... 38 6.2.5 Determination of the minimum benefit amount ............................................................ 39 6.2.6 Price adjustment mechanism and frequency .................................................................. 40 6.2.7 Determination of incentives for Superior Clinical Performance ...................................... 41 6.2.8 Allowance for clinically necessary circumstances ........................................................... 44
6.3 Cross-cutting changes to governance and administration ....................................................... 46 6.3.1 Governance ..................................................................................................................... 47 6.3.2 Mechanism for clinical input and HTA ............................................................................ 47 6.3.3 Level of supply chain transparency ................................................................................. 48
7 Proposed roadmap to deliver reforms ...................................................................................... 51
7.1 Phased implementation plan .................................................................................................... 51 7.1.1 Solution design ................................................................................................................ 52 7.1.2 Technical implementation plan....................................................................................... 54 7.1.3 Roll-out of key changes ................................................................................................... 56
7.2 Evolution of value chain impacts .............................................................................................. 57
7.3 Risks for consideration .............................................................................................................. 60
8 Conclusion ............................................................................................................................... 65
9 Appendix ................................................................................................................................. 66
9.1 Further context on inefficiencies in the existing system ........................................................... 66 9.1.1 Case examples: prostheses with clinical registry data .................................................... 66 9.1.2 Case examples: prostheses without clinical registry data .............................................. 67

ii
9.1.3 Case examples: items that are not prostheses ............................................................... 68
9.2 Overview of segmentation process ........................................................................................... 71 9.2.1 Proposed list of Prostheses with clinical registry data .................................................... 72 9.2.2 Proposed list of non-prostheses ...................................................................................... 74
9.3 Revised Prosthesis definition ..................................................................................................... 77
9.4 International case examples of funding models ....................................................................... 79
9.5 Summary of high priority DRG 9.0 codes .................................................................................. 81
9.6 Required business process changes .......................................................................................... 82 9.6.1 Changes for device manufacturers ................................................................................. 82 9.6.2 Changes for hospitals ...................................................................................................... 82 9.6.3 Changes for private health insurers ................................................................................ 83
9.7 Notes on financial impact modelling methodology .................................................................. 85 9.7.1 First-order effects ............................................................................................................ 85 9.7.2 Second-order effects ....................................................................................................... 86 9.7.3 Third-order effects .......................................................................................................... 87

1
1 Executive Summary The Prostheses List (PL) defines the minimum benefits private health insurers must pay for individual items associated with a surgical procedure. The PL, which is updated three times per year, now contains ~11,000 items, with over 1,700 different pricing variations. These prices are set centrally and not exposed to any market-based price competition. When an item is used in a hospital, the benefit amount for the item is charged directly to the private health insurer, with no incentive for the hospital to manage price or volume.
Despite successive efforts, the Prostheses List as it currently stands remains a significant driver of unsustainability in the private healthcare system in Australia. The consequences of this extend to consumers, who, as a result of the Prostheses List, face increased premiums, as well as the experience of an opaque system where quality and clinical outcomes are not routinely incentivised. Over the last ten years, the PL has grown from $1.3bn to $2.1bn1. This growth in expenditure is a significant component of the costs that have threatened the sustainability of the broader healthcare system in Australia. Moreover, changes to both price and volume have become uncoupled from the value of goods provided to the patient, with several examples of pricing and utilisation not in line with best clinical practice or prudent resource management.
The current Prostheses List is specifically challenged in four ways:
■ Price: comparing the top billing codes in the Australian PL to benchmarks, Australia offers a ~40-110% premium on the cost of prostheses2. These premiums are variable across items, and the lack of consistency indicates they are not driven solely by systemic factors unique to the Australian market. In addition, the Australian private sector pays a premium for prostheses relative to the public sector. When comparing prostheses-level costing data published as part of the National Hospital Cost Data Collection, public sector costs for prostheses within equivalent episodes of care are ~45% lower than private sector costs3.
■ Utilisation: growth in utilisation of prostheses has consistently exceeded recorded growth in procedure volume (for example, plastic and reconstructive prosthesis volume has grown at ~8% p.a. in the last three years, versus ~2% p.a. growth in procedure volume4). Overall growth is being especially driven by ‘general & miscellaneous’ prostheses, such as closure devices, that are commoditised and do not necessarily meet the definition of a prosthesis.
■ Clinical outcomes: the Prostheses List fails to incentivise use of devices that deliver higher quality long-term clinical outcomes for patients. This can be observed through the consistently increased
1 Australian Prudential Regulation Authority (APRA), Private Health Insurance Prostheses, September 2020. Available from:
www.apra.gov.au/quarterly-private-health-insurance-statistics. 2 Evaluate, “The Prostheses List: Is it cost effective and what recommendations could improve its quality as a tool for
reimbursement?”, March 2020. Unpublished. Comparing specifically to France, the UK and New Zealand. 3 Weighted average incremental difference between public and private sector prostheses cost calculated per DRG code
(9.0). Using two data sources: 1) Department of Health, Private Hospital Data Bureau: Annual Report (2018-19), June 2019 and 2) IHPA, National Hospital Cost Data Collection Report, Public Sector, Round 22 (Financial year 2017-18), February 2020.
4 Australian Institute of Health and Welfare. Admitted patient care 2017-18. May 2019. and previous editions of the same report. Referring to overall growth of privately insured procedural separations.

2
use of prostheses with higher than average revision rates in private hospitals compared to public hospitals (with use of such prostheses in 8.8% of total knee replacements in private hospitals versus 3.1% in public5). Other specific examples where the PL reimbursement schedule is not adequately tied to clinical outcomes include the premium offered for uncemented femoral components and for drug-eluting stents. The current system tends to favour complexity, overuse and rebate arrangements, rather than the selection of items with the best long-term clinical outcomes for patients.
■ Administration: the current listing and pricing mechanism is complex to administer centrally and creates significant administrative burden, with PLAC needing to manage over 1,700 individual pricing combinations in a list of 11,000 items, as well as needing to capture large numbers of (~300-700) new additions to the PL three times per year. It is also challenging for stakeholders operating within the system, including payors and providers, to regularly adapt to, as the PL changes and invariably becomes more complex.
In the context of these challenges, the PL disproportionately distributes value to medical device manufacturers at the expense of consumers and taxpayers. Under current policy settings, and based on momentum growth of prostheses utilisation6, up to ~$10bn of value is expected to accrue to device manufacturers’ gross margins over the next five years. In addition, at least $250m is likely to accrue to private hospitals given the application of rebates to prostheses sales. This will be a significant contributor to ongoing growth in private hospital treatment benefit outlays at ~4% p.a. Whilst growth in costs (and in turn, premiums) continues to exceed wage growth, it is likely that the private health insurance industry will continue to remain challenged, in turn driving increased demand for budget-constrained public hospital services. As will be shown, it is believed a feasible reform pathway could help even this balance, by directly returning ~$2bn of value to consumers cumulatively over the next five years through reform of the Prostheses List, and driving ~$240m of savings in the public hospital system cumulatively over that time period by supporting increased PHI participation. Within this system, there would still be opportunities for private hospitals to reach a net positive outcome, and for competitive device manufacturers to accelerate market share gain.
The Prostheses List can be subdivided into three segments for the purpose of reform. These three segments are defined based on a) whether they meet the definition of a prosthesis, including their status as a permanent implant, and b) whether the Product Group contains examples of prostheses that have readily available high-quality data suggesting differential longer-term clinical outcomes.
■ 305 Product Groups (as well as Part B of the List) consist of prostheses with limited (or no) registry-level comparison data for differential long-term clinical outcomes within the Product Group. Within this segment, challenges include the proliferation of price differentials through over-engineered product groups, ‘suffixes’ being allocated to various items7, and uninhibited volume growth misaligned with clinical practice, including ‘off label’ usage. For example, the current PL mechanism has driven wider use of overpriced Drug-Eluting Stents, even when
5 Harris I. et al., “Outcomes of hip and knee replacement surgery in private and public hospitals in Australia,” ANZ Journal of
Surgery, 89:11, May 2019 6 Please see Appendix for details on momentum growth calculation methodology 7 In the current PL, a range of different ‘suffixes’ are applied to items in order to differentiate certain items from others.
These ‘suffixes’ can then be used to guide differences in pricing. For example: a metal acetabular insert/liner typically attracts a $1,762 benefit per the November 2020 PL, but one item has the suffix ‘sandwich’ which increases the benefit to $1,931

3
evidence suggests Bare Metal Stents are able to deliver similar mortality and major cardiovascular event outcomes8.
■ Up to 56 Product Groups consist of prostheses where registry-level data does exist to differentiate between those that perform well over the long-term, and those that are clinically inferior. These Product Groups primarily relate to joint replacement, and assessment to determine which prostheses are clinically superior would rely on the Australian National Joint Replacement Registry dataset (where this dataset is sufficient to form an evidence-based view on long-term clinical outcomes). Within this group there are several challenges currently, including higher-priced prostheses that are associated with poor revision rates, and differences in reimbursement costs between prosthesis types that are not evidence based.
■ 67 Product Groups consist of items which do not meet the definition of a prosthesis (e.g., adhesives, sponges, foam, intra-ocular fluids). These Product Groups have been a significant driver of both volume and benefits growth in the PL, representing an estimated ~$290m of benefits and growing at ~11% p.a9.
With this segmentation in mind, the proposed reform has three components. In determining this approach several alternatives were assessed, and detail behind the choices made has been provided in the body of this paper. The chosen approach will have a meaningful impact on price, utilisation, clinical outcomes and the administrative burden of the PL. It will also help improve the quality of prostheses delivered to consumers. The detail of the reform is as follows:
■ Firstly, it is proposed that non-prostheses are removed entirely from the Prostheses List reimbursement mechanism. These are items that do not meet the definition of a prosthesis and are more appropriately reimbursed within existing theatre or accommodation payments. In other jurisdictions, it is atypical for such costs to accrue separately to payors. This should be accompanied by returning a greater level of clarity on the definition of a prosthesis, specifically with respect to permanence (being implanted for >24 months and/or serving an ongoing and continuous function) and medical necessity.
■ Secondly, for the remaining segments, a phased transition should occur to an episodic DRG-based prosthesis funding model, where DRG-based reimbursement amounts are defined specifically for the bundled prosthesis component of spend in a procedural separation. Governance for pricing should be transitioned to an independent body with experience in complex data-driven episodic pricing (e.g., the Independent Hospital Pricing Authority). This model appropriately captures a balance between driving improved clinical and citizen outcomes, and limiting immediate disruption to the value chain. It is also proven – with similar bundled
8 Bonaa K. et al. “Drug-Eluting or Bare-Metal Stents for Coronary Artery Disease”, N Engl J Med, 375:1242-1252, September
2016. Note: Coronary stents are inserted during percutaneous coronary intervention into blocked coronary vessels, in order to keep the coronary arteries open and allow blood flow to the heart. Drug-eluting stents are a type of coronary stent that aim to prevent re-blockage through release of a drug which allows immunosuppression (e.g. sirolimus or everolimus).
9 Hospital Casemix Protocol-1 (HCP1), Prosthesis Utilisation Report, December 2020. Proprietary data, unpublished. Due to an acknowledged mis-match between a small subset of categories, and reporting lag, HCP1 data under-reports prostheses utilisation relative to APRA statistics; however, HCP1 data offers significantly greater granularity. Therefore, in this and in subsequent analyses, where appropriate, HCP1 data have been used and adjusted such that totals are consistent with the reported volume and benefits data from APRA.

4
models already in place in several comparable countries including France, the UK and the US, as well as the public system in Australia.
■ For the segment of prostheses where there is strong evidence of differential long-term clinical outcomes, an adapted model should be implemented to appropriately incentivise choice of prostheses which deliver improved long-term outcomes (e.g., lower revision rates). This can take the form of an adjustment to the DRG bundle base payment when the most clinically effective prosthesis is selected, and a requirement for patient informed consent when a less effective prosthesis is selected.
■ Finally, complementary to the changes to funding model, the ongoing role of PLAC should be reviewed with a view to engineering a smoother process by which TGA approved prostheses can be attached to an MBS code and a DRG-based bundled payment without double handling. Attachment to both MBS and DRG codes will facilitate cost transparency and prevent off-label use. The Medical Services Advisory Committee (MSAC) or an equivalent clinically-led body could substitute for the existing Clinical Advisory Groups in providing Health Technology Assessment and clinical input, based on data from expanded Clinical Quality Registries. Finally, wherever possible, a greater degree of transparency in the supply chain should be mandated, particularly where it comes to the total volume of rebates and price discounts, and to verifying the use of items within the scope of their TGA-approved indication.
In establishing a DRG-based funding model, several design choices need to be made. The selected choices allow for the future system to continue to encourage innovation while also allowing market forces to appropriately manage price and volume. Among some of these choices, it is proposed that:
■ The choice for clinicians to ensure they have access to the best device for the patient is vital. While in the vast majority of cases the hospital would operate the bundle, we recommend that clinicians have the option of controlling the bundle. This option is included as a failsafe should a hospital not allow a clinician choice of device. Unless the clinician opts to manage the bundle, the payment defaults to the hospital where the procedure is occurring. This then leaves either the clinician or the hospital, or both, the responsibility of prudently managing resources, and will help create normal competitive tension in the market, therefore driving a long-term equilibrium in distribution of value between participants. This approach will also naturally lead to greater collaboration between clinicians and hospital providers, and by extension a sharing of the value generated from the procedure.
■ The initial DRG pricing is set based on a combination of public sector reference pricing and international benchmarks, and by an independent body with experience in defining bundled prices (e.g., the Independent Hospital Pricing Authority). It is also proposed that the pricing is then reviewed annually based on a price disclosure mechanism similar to the current Pharmaceutical Benefits Scheme, as well as through repeat reference pricing, allowing any disproportionate elevation of the DRG bundle price relative to the price paid by hospitals to be understood and addressed through adjustment of the bundle. This combination of price disclosure and repeated reference pricing will offer sufficient information to ensure a fair market price is being set for the bundle, and will overcome any issues that could arise from reliance on one method alone.
■ There are no permitted gap payments for prostheses for consumers. The bundled price should be set with reference to a fair market price, leveraging benchmarks as previously mentioned. Once

5
set at this level, there will be no need for additional gap payments. Of course, clinically complex cases that require higher prosthesis spend may exist. In these instances, the principle is to ensure neither clinician, hospital nor patient is left managing the cost of a complex case. Rather, the proposed approach is to allow for a capped increase in funding when a clinically necessary high cost case occurs, with retrospective peer review to confirm that the additional cost is reasonable and necessary, and cyclical auditing to confirm this mechanism is being appropriately used.
■ An adjusted base payment mechanism is developed, underpinned by clinical quality registry data, that provides incentive for providers and clinicians to procure devices that yield improved longer-term clinical outcomes. This will apply where long-term clinical quality registry outcomes data exists to demonstrate the superior clinical performance of some items over others. It may, in future, apply to other technologies that MSAC or an equivalent body assesses, where those technologies drive a meaningful improvement in long-term clinical outcomes. Importantly, the focus would be on incentivising use of items that improve long-term outcomes, not simply rewarding items for additional complexity (as has occurred in the current PL). In this mechanism, MSAC, or an equivalent, would define which items merit an adjusted base payment, and IHPA would set the adjusted bundled price where required. Informed consent would also be required when an inferior prosthesis is selected, noting that there may be appropriate reasons for an alternative to be selected for a specific patient.
Government could implement these reforms over a two-year period through a process consisting of three components: 1) solution design, 2) technical implementation and 3) roll-out of the reform. This process should commence immediately, in Q1 2021. The current MTAA agreement expires in January 202210, and the process should be timed such that the transition to a DRG-based model for prostheses would commence immediately after the expiry of the agreement.
To summarise the implementation plan:
■ Solution design would initially involve establishing an execution-focused clinician-led taskforce. Importantly, this taskforce should be guided by clinical evidence, health economics and clear policy intentions, with the aim of developing a deeper view on the implementation of a bundled prosthesis funding model in Australia. It is recommended this taskforce is launched in Q1 2021 to deliver its final recommendations by the start of Q3 2021.
■ The technical implementation plan would largely be led by IHPA, and involve establishing the infrastructure to launch and then sustain a bundled pricing model. It is recommended that IHPA commence the critical path of technical implementation as soon as the taskforce’s recommendations are delivered in Q3 2021.
■ Roll-out of the reform would involve removal of non-prostheses from the PL before February 2022, at the latest, and transition of items from the PL to bundled models over the course of 2022 and 2023, commencing with high value areas. The transition to bundled payment models should be accompanied by an upfront price adjustment in accordance with public sector and international benchmarking.
10 Australian Government Department of Health. Agreement between the Government and the Medical Technology
Association of Australia. October 2017.

6
Within 5 years this plan should drive ~$500m of value shift in the system out of the total $2.1bn in current prostheses spend (in 2020 terms). If captured, this will enable the reduction of premium growth for consumers, but will also enable increased margins for hospitals who are, in this new model, able to capture procurement efficiencies in their negotiation with device manufacturers. Hospitals could also be further supported through a one year transitional safety net, that will ensure providers do not bear significant short-term downside risk from the removal of non-prostheses from the PL and have time to improve their procurement practices.
The proposed reform approach has been carefully considered and refined to limit disruption in the industry. While there is clearly a shift in value away from medical device manufacturers to consumers and taxpayers, the model presented is likely to maintain manufacturer margins in Australia at an acceptable level (through benchmarking against comparable countries like New Zealand, and through comparison with Australian public sector pricing). There will also be a shift in business model for some large private hospital groups that attract rebates from device manufacturers. However, in the proposed model it is anticipated private hospitals would be able to generate ~$100m of net potential upside (in 2020 terms) through better managing procurement of devices as part of bundled payments and by better controlling the current trend for over-utilisation.
Capturing this value will require some business process change, but this level of change is not prohibitive and is unlikely to affect clinical processes at any time. Over the longer-term, the removal of complex administration through PLAC will help reduce the burden of centralised administration for Government, while also easing the imposition on hospitals and device manufacturers and improving the time to market for new devices. Importantly, it will deliver savings directly to consumers, improve clinical outcomes and help ensure the sustainability of Australia’s healthcare system.

7
2 Still costing an arm and a leg: challenges facing the current Prostheses List
Since its inception in 1985, the Prostheses List has experienced a steady sequence of reform. However, many of the interventions have only further distorted market signals, and increased the complexity of the list. The most recent challenges are a result of pricing set in 2005, at which point Australia was ‘locked’ into purchasing prostheses at a higher price than international benchmarks. Despite the recent MTAA Agreement11, the PL continues to be a problematic and unsustainable expenditure area for private health insurers, with flow-on consequences for premium-paying consumers and taxpaying citizens. The current structure of the market encourages volume growth with no repercussions, and in fact drives increased prosthesis utilisation through the provision of rebates to providers. To illustrate this point: In 2019-20, despite the impact of COVID-19 on reducing elective surgery, prostheses spend has increased by 1.1% per Hospital Treatment member, compared to a 0.9% decrease for all other Hospital Treatment Benefit Outlays12.
Prostheses currently comprise $2.1bn of expenditure, or ~14% of total Hospital Treatment benefit outlays13. This $2.1bn of expenditure is not subject to market forces – with the fixed prices for items set within a list of ~11,000 billing codes with over 1,700 different combinations for the purpose of pricing. Items on the Prostheses List range from components critical to significant surgical procedures (e.g., Total Hip Replacements and Total Knee Replacements) to high-volume specialty-agnostic items such as sponges, adhesives and haemostatic matrix. In most cases, items on the list can be considered commoditised in the global market.
Improved control over prostheses spend would enable reductions in premium growth, which would in turn encourage higher participation in private health insurance. This would alleviate the burden on the public hospital system, which will be an increasingly important objective in the fiscally constrained post-COVID environment.
There are four fundamental challenges with the current PL mechanism that this section will summarise.
1. Price: the minimum benefit amounts on the Prostheses List were set in 2005 following a period of rapid price inflation, and have consistently remained above international price benchmarks. In addition, the prices have not been naturally exposed to global market forces that have seen the reduction in prices of certain products internationally (e.g., drug eluting stents14).
2. Volume: the Prostheses List does not provide incentive for providers or clinicians to limit volume. In fact, with many providers receiving volume-based rebates from manufacturers for the purchase of products, there is financial upside created from system wastage and inefficiency.
11 Australian Government Department of Health. Agreement between the Government and the Medical Technology
Association of Australia. October 2017. Note that this agreement commenced 15 October 2017 and expires 31 January 2022. The agreement can be accessed on: https://www.health.gov.au/resources/publications/agreement-between-the-government-and-the-medical-technology-association-of-australia
12 Australian Prudential Regulation Authority. Quarterly Private Health Insurance Statistics [Dataset], 2019-20. 13 ibid 14 Wenzl M and Mossialos E. “Prices for Cardiac Implant Devices May Be Up To Six Times Higher In The US Than In Some
European Countries”, Health Affairs, 37(10):1570-7. 2018.

8
3. Clinical outcomes: the Prostheses List does not necessarily incentivise use of prostheses that deliver long-term clinical outcomes. Instead, premiums are provided for prostheses that are able to list an additional feature (in the form of a ‘suffix’15), and there is no price signal for selection of the prostheses that have the best clinical quality registry data, with lack of rigorous HTA to determine clinical benefit.
4. Administration: the PL is a list of ~11,000 items with over 1,700 combinations of product sub-group and suffix, each resulting in a different price. This creates significant administrative burden for the Prostheses List Advisory Committee, which manages a significant volume of listing requests, as well as requests for clarification and adjustments.
Many of these challenges have been detailed previously in PHA’s Costing an Arm and a Leg report published in 2015. The intent of this report is not just to repeat the issues identified in that report, although they will be referenced in this section. The intent instead is more broadly to understand the drivers of each of the above challenges, and to define reform that can sufficiently address these drivers to yield the best possible outcome for consumers and taxpayers, while limiting disruption in the sector.
2.1 THE PRICE CHALLENGE
Evaluate recently completed a comparison of the Australian Prostheses List pricing to comparable data from three other geographies (France, New Zealand and the United Kingdom). This analysis utilised 68 of the top billing codes on the PL that could be matched across each of the geographies, which together represent ~18% of the PL by value. The comparison, depicted below, suggested that Australians consistently pay a ~40-110% premium for equivalent prostheses16.
15 In the current PL, a range of different ‘suffixes’ are applied to items in order to differentiate certain items from others.
These ‘suffixes’ can then be used to guide differences in pricing. For example: a metal acetabular insert/liner typically attracts a $1,762 benefit per the November 2020 PL, but one item has the suffix ‘sandwich’ which increases the benefit to $1,931
16 Evaluate, “The Prostheses List: Is it cost effective and what recommendations could improve its quality as a tool for reimbursement?”, March 2020. Unpublished.

9
EXHIBIT 1
Several factors have driven this artificial price inflation, including:
■ Pricing being ‘locked’ at elevated levels in 2005, following a period of rapid price inflation. This rapid price inflation occurred as a result of a regulated environment in which funds were put in a position to directly negotiate on the price of individual items, but had no influence on the choice of items procured, and had no option to cap the offered price during negotiations. This regulatory approach resulted in a severely imbalanced market. In this market, funds were forced to pay the asking price from device manufacturers and had little option to negotiate.
■ Subsequent lack of exposure to market forces. While Prostheses List prices remained flat for over a decade following their initial establishment, global prices of many devices declined significantly17. Despite the recent MTAA agreement mandating price reduction across several categories, this still falls short of enabling market-based pricing and exposure to competitive market forces.
■ Lack of ability and incentive for any sponsor, particular new sponsors, to price below the current minimum benefit amount, given a sponsor must have >25% market share before listing below the minimum benefit amount on the PL18.
It should be noted there is no evidence to suggest that the Australian market is systematically more challenging to access than a market such as New Zealand. In fact, when comparing the price difference of items at an individual level, a significant degree of variation can be observed, implying a lack of consistent rationale between items.
17 For example, drug eluting stents. Wenzl M and Mossialos E. “Prices for Cardiac Implant Devices May Be Up To Six Times
Higher In The US Than In Some European Countries”, Health Affairs, 37(10):1570-7. 2018. 18 The market share guidance is noted in: Australian Government. Response to the Senate Community Affairs References
Committee Report: Pricing regulation associated with the Prostheses List framework. September 2017.
Comparing common top billing codes to benchmarks, Australia offers a ~40-110% premium on the cost of prostheses
Source: Evaluate analysis, 27 March 2020
Australia UK NZ France
282.2
202.5 193.2
133.5
+111.3%
1. Exchange rates used: 1 pound = AUD 1.82, 1 euro = AUD 1.58, 1 NZD = 0.94 AUD
39% 46% 111%
Analysis of 68 of 283 top billing codes that were matched across multiple international jurisdictions1 (representing 17.5% of FY18 PL value)Utilisation-matched value for these billing codes, $m
Premium for Australian prostheses

10
EXHIBIT 2
Finally, prices are higher in the Australian private sector versus the Australian public sector. When comparing prostheses-level costing data published as part of the National Hospital Cost Data Collection (NHCDC), administered by the Independent Hospital Pricing Authority (IHPA), public sector costs for prostheses within equivalent DRGs are ~45% lower19. These lower costs in the public system are driven by lack of exposure to the PL, use of central procurement processes and better control of volume and mix. Compared to the private sector, public hospitals are incentivised to more prudently use consumables and more carefully consider the mix of prostheses procured within an episode of care. As will be shown, there is no evidence that prosthesis-related outcomes following public sector surgeries are poorer than those in the private sector, suggesting this premium in the private sector does not translate into true clinical benefit.
19 Weighted average incremental difference between public and private sector prostheses cost calculated per DRG code
(9.0). Using two data sources: 1) Department of Health, Private Hospital Data Bureau: Annual Report (2018-19), June 2019 and 2) IHPA, National Hospital Cost Data Collection Report, Public Sector, Round 22 (Financial year 2017-18), February 2020.
Australia’s elevated prices are not based on a consistent rationale – with the degree of premium variably allocated across devicesComparison of PL price to benchmarks across a selection of items
Source: Evaluate analysis, 27 March 2020
MI259 Cardiac Medtronic Medtronic CoreValveTM
EvolutTM R transcatheter aortic valve
$22,932.00 -23% -11%
SJ374 Neuro Abbott Medical Prodigy IPG $24,700.00 0% -5%
AS246 Gen/Misc Medtronic Absorbatack $509.00 -7% 30%
CO069 ENT Cochlear CochlearTM
Nucleus CP910 Sound Processor
$10,925.00 17% 15%
MC755 Urogenital Medtronic Interstim Il $9,072.00 -32% 7%
MC933 Cardiac Medtronic Advisa DR MRI Surescan $8,482.00 74%
SN857 Knee Smith & Nephew Genesis Il Tibial base plate $1,923.00 111% 67%
DY464 Hip Johnson & Johnson Depuy Delta Ceramic head
$2,022.00 20% 282%
BT193 Cardiac Biotronik Edora 8 DR-T $8,482.00 82%
BX258 Gen/Misc Baxter Floseal $665.00 73% 73%
Billing code Clinical Group Supplier Item PL price $AUD Premium to NHS Premium to France

11
EXHIBIT 3
It should be noted that the public sector has been able to achieve these lower costs even despite device manufacturers having access to a local benchmark for pricing through the PL. It is possible that revising or reducing the price on the PL would flow through to even better outcomes for the public sector.
2.2 THE UTILISATION CHALLENGE
The volume of prostheses has been consistently increasing year-on-year from 2014-15 to 2018-19 at 6% p.a.20, with growth in prostheses utilisation far in excess of overall procedural growth across most categories, as shown in Exhibit 4.
20 Australian Prudential Regulation Authority. Private Health Insurance Prostheses Report. June 2020.
Private sector prostheses prices are higher than public sector prices across the highest volume DRG codesAcross all DRGs, as a weighted average, public sector prices are 45% lower than private sector
19.4
Spinal Fusion (Moderate Cx)
11.5
AICD (Minor Cx)Knee replacement (Minor Cx)
Back/Neck (Minor Cx)
Spinal Fusion (Minor Cx)
Hip replacement (Minor Cx)
PPM (Minor Cx)Lens Procedure PCI (Minor Cx) Bilateral lower limb joint surgery
(Minor Cx)
7.4 6.29.7
6.93.7
14.3
7.8 6.6
1.0
41.5
14.912.5
0.64.1
0.3
9.9
1.3
12.7
Private sector Public sector
1. Prostheses costs per separation compared using IHPA (2017/2018) and PHDB (2018/2019) data sources
Comparison of public vs. private sector prostheses pricing per separation1
$ Thousands
84% 72% 55% 15% 30% 55% 32% 51% 32% 85%
Public sector as a % of private

12
EXHIBIT 4
Within these categories, growth has been differentially driven by accessories to the main prosthesis, further suggesting a decoupling of prosthesis volume from procedure growth. For example, use of prosthesis accessories21 in knees has grown at ~7% p.a., versus ~4% p.a. for remaining sub-categories within the Knee category22.
EXHIBIT 5
21 Examples of knee accessories include: connectors, axles, bolts, screws, end caps and stems 22 Hospital Casemix Protocol-1 (HCP1), Prosthesis Utilisation Report, December 2020. Proprietary data, unpublished.
Adjustment then applied as previously described, given HCP1 data under-reports prostheses utilisation relative to APRA statistics
Volume growth in prostheses has been in excess of actual elective surgery admissions
12.8%
Hip
Knee
Plastic and Reconstructive
Specialist Orthopaedic
5.5%
Cardiac
Neurosurgical
Ophthalmic
3.4%
9.7%
1.7%7.0%
7.7%
5.7%
1.4%
1.7%4.7%
3.6%
5.7%-1.2%
7.3%6.1%
2.9%4.6%
-1.2%4.5%
-1.2%
2013/14-2018/19 ProsthesisVolume Growth CAGR2015/16-2018/19 ProsthesisVolume Growth CAGR2014/15-2017/18 Growth in electiveadmissions in private hospitalsfor most relevantMajor Diagnostic Category1
1. Based on elective admissions involving surgery by Major Diagnostic Category as published by AIHW. MDCs used included Diseases of the Circulatory System (cardiac), Diseases of the skin, subcutaneous tissue and breast (plastic and reconstructive), Diseases of the musculoskeletal system and connective tissue (specialist orthopaedic, knee and hip), Diseases of the nervous system (neurosurgical), Diseases of the eye (ophthalmic)
Source: AIHW Admitted Patient Care 2014-15 to 2017-18, APRA Private Health Insurance Prosthesis Report June 2020
Comparative growth rate for prostheses and corresponding elective surgical admissions in private hospitals, % growth p.a.
109 137
8 10
102 126
Use of prostheses accessories has been outpacing volume growth for the prostheses they support
Accessories All other sub-categoriesVolume of prostheses from selected categories, by sub-categoryThousands
Source: Hospital Casemix Protocol data for proportionate division of category into sub-categories, and APRA Prosthesis Report June 2020 for the total data. As HCP1 and APRA data is not a complete match, but HCP1 data offers greater granularity – a combination of the two was used for this analysis.
Knee
Hip
Spinal
121
2176
2018-19
94
2013-14
2797
7461
139128
189 213
CAGR
6.7%
4.4%
CAGR
4.9%
4.4%
CAGR
3.9%
1.7%
13
Utilisation growth has also been driven by growth in the General & Miscellaneous category, which accounts for a significant proportion of prostheses volume. Within this category, growth has been predominantly in closure devices and haemostats23. Causes of this significant increase in utilisation include the relatively commoditised nature of the category, the ease by which usage can increase and the potential for multiple quantities of an item being used in each procedure.
The underlying drivers of ongoing volume-based growth far in excess of procedure growth include the lack of incentive for providers and clinicians to control volume and in fact, through rebates, the perverse incentive for providers to increase prostheses utilisation. This does not encourage value-driven care and can lead to use of devices outside of their intended or approved purpose. In recent years, volume growth has continued to accelerate, suggesting that despite the recent MTAA agreement, the lack of a price signal to purchasers has only led to the value of the agreement being recouped through increased utilisation of prostheses.
2.3 THE CLINICAL CHALLENGE
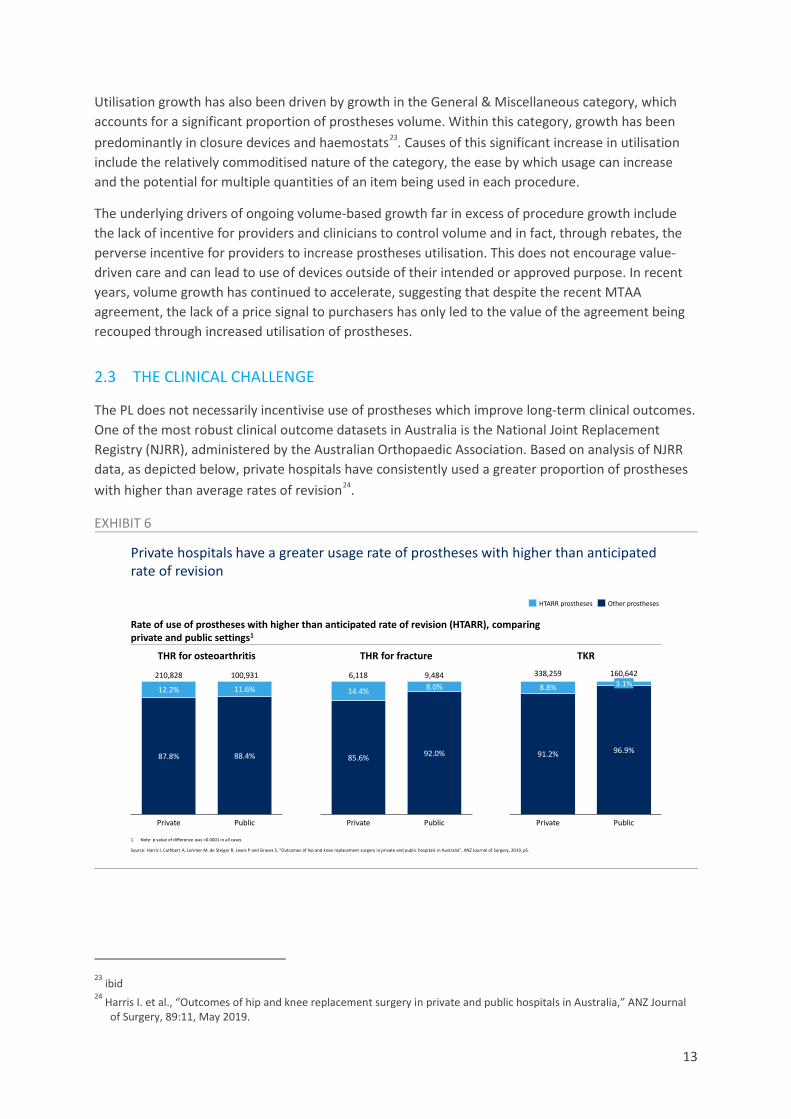
The PL does not necessarily incentivise use of prostheses which improve long-term clinical outcomes. One of the most robust clinical outcome datasets in Australia is the National Joint Replacement Registry (NJRR), administered by the Australian Orthopaedic Association. Based on analysis of NJRR data, as depicted below, private hospitals have consistently used a greater proportion of prostheses with higher than average rates of revision24.
EXHIBIT 6
23 ibid 24 Harris I. et al., “Outcomes of hip and knee replacement surgery in private and public hospitals in Australia,” ANZ Journal
of Surgery, 89:11, May 2019.
Private hospitals have a greater usage rate of prostheses with higher than anticipated rate of revision
87.8% 88.4%
12.2% 11.6%
Private Public
210,828 100,931
HTARR prostheses Other prostheses
85.6% 92.0%
14.4% 8.0%6,118
Private Public
9,484
91.2% 96.9%
8.8%
160,6423.1%
Private Public
338,259
THR for osteoarthritis THR for fracture TKR
Source: Harris I, Cuthbert A, Lorimer M, de Steiger R, Lewis P and Graves S, “Outcomes of hip and knee replacement surgery in private and public hospitals in Australia”, ANZ Journal of Surgery, 2019, p5.
1. Note: p value of difference was <0.0001 in all cases
Rate of use of prostheses with higher than anticipated rate of revision (HTARR), comparing private and public settings1

14
The current Prostheses List does not effectively leverage data from the NJRR and does not appropriately reward those prostheses with the best revision rates. Instead, choice of prostheses is currently influenced by factors including:
■ Existing relationships between device companies and clinicians
■ Ability for hospitals to gain greater rebates on more expensive devices
■ Device sales representative influence
These incentives do not encourage best clinical practice and prices on the PL are not justified by evidence of clinical superiority. Patients are also often not given the opportunity to provide informed consent when an option that could be considered clinically inferior is selected.
There are several other examples where the PL does not incentivise best clinical practice, as detailed below.
Example Clinical evidence Treatment on the PL25
Cemented vs uncemented femoral components for hip fracture surgery
For patients undergoing surgery for hip fracture26:
■ Uncemented fixation associated with higher revision risk (3% vs 1%)
■ No difference in in-hospital or overall mortality
Cemented femoral component: $1,552 - $1,762 Uncemented femoral component: $3,248 - $4,196 PL prices do not encourage selection of clinically superior prosthesis, for the indication of hip fracture where cemented femoral components have a lower revision rate
Drug-eluting vs bare metal stents (general purpose) for acute coronary syndrome
Cochrane review 201727:
■ No significant difference in all-cause mortality or major cardiovascular events between drug-eluting and bare metal stents
■ Lower rates of adverse event in drug-eluting stents (18% vs 23%)
NEJM Bonaa et al 201628:
Drug-eluting stents: $2,298 Bare metal stents: $831 Despite no difference in mortality or major cardiovascular event rate, the PL offers a 2.5x premium for drug eluting stents compared to bare metal HTA would be required to determine whether this price difference is justified by
25 Australian Government Department of Health. Prostheses List. November 2020. Available from:
www.health.gov.au/resources/publications/prostheses-list 26 Okike, K. et al. “Association Between Uncemented vs Cemented Hemiarthroplasty and Revision Surgery Among Patients
With Hip Fracture,” JAMA, 323(11), March 2020. 27 Feinberg J.et al. “Drug-eluting stents versus bare-metal stents for acute coronary syndrome,” Cochrane Database Syst
Review, 23;8(8), August 2017. 28 Bonaa K. et al. “Drug-Eluting or Bare-Metal Stents for Coronary Artery Disease”, N Engl J Med, 375:1242-1252, September
2016.

15
■ No significant difference in death and non-fatal spontaneous MI
■ Higher 6-year revascularization rate in bare metal stents (19.8% vs 16.5%)
differences in revascularization and adverse event rates
Hydroxyapatite-coated cementless vs cemented tibial tray for primary total knee arthroplasty
Based on a prospective RCT29:
■ Slightly more pain in hydroxyapatite cementless tibial fixation at 6 months
■ No differences in function, radiographic findings or complications
Cementless hydroxyapatite coated tibial tray: $2,356 Cemented tibial tray: $1,875 The $481 price difference does not appear to reflect clinical evidence, and HTA would again be required
2.4 THE ADMINISTRATION CHALLENGE
The exhibit below depicts several of the key processes currently in place in administering the PL. This applies to the administration of ~11,000 items, in over 1,700 pricing combinations, and with over 1,000 submissions per year.
EXHIBIT 7
There are several pain points in the current system beyond its complexity. These specific pain points include:
29 Beaupre L. et al. “Hydroxyapatite-coated tibial implants compared with cemented tibial fixation in primary total knee
arthroplasty. A randomized trial of outcomes at five years,” J Bone Joint Surg Am, 89(10), October 2020.
The current system is challenging to administer, for PLAC and other stakeholders in the system
Pain points
Clinical Advisory Groups (CAGs)
Minister for Health
PLAC
Medical Services Advisory Committee (MSAC)
Sponsor (Device manufacturer)
TGA
PHI
Hospitals
Clinical Advisory Groups assess clinical
effectiveness
Minister approves application
Receives >1,000 submissions per year. Admin checks completeness
and eligibility
PLAC decides on listing suitability and pricing based on consensus
PL reviewed three times a year
MSAC may provide input for ‘breakthrough’ technology
through HTA
Manufacturer (sponsor) applies through Prostheses List Management System
Submits evidence on clinical and cost effectiveness, and
current comparators
Sponsor can comment on
clinician assessment
Sponsor can comment on
PLAC assessment
Sponsor can apply to increase benefit with evidence of
superiority, or to change listing details
Sponsor may be requested to provide
further evidence
TGA grants approval (takes
up to 24 months)
Update billing codes and reimbursement lists
Application Assessment Refinement Review

16
■ The listing process: there are a high volume of new submissions, many of which contain data that are sponsor-specific. For sponsors, the listing process on the Prostheses List adds another layer of approval beyond what is already provided by the TGA and can delay time to market. The process of listing on the PL can also delay market entry for innovative products, which can have a material commercial impact given the short lifecycle of many products.
■ The assessment process is opaque with minimal communication to both providers and payors. It may also be unpredictable for sponsors. There is no consistent use of Health Technology Assessment within the current structure, as Clinical Advisory Groups or Panels of Clinical Experts determine suitability of listing and pricing through consensus mechanisms.
■ The lack of refinement and review: with sponsors having to wait until the next round of reviews to achieve changes should they be required, and no routine process for removal of items from the PL.
This is not only challenging to administer, but a significant expense for device sponsors. Currently sponsors must pay application fees of $800 per application, and ongoing listing fees of $200 per year per billing code30. Across an estimated 600 new listings per year, and ~11,000 billing codes, the ongoing cost to industry is excess of $2m per year.
In addition, the frequency of regular changes to the PL (3 times per year) leads to additional administrative burden for other stakeholders in the system, including hospitals, who must adapt their individual processes to accommodate these changes.
30 Department of Health, “Prostheses List - Guide to listing and setting benefits for prostheses,” Available from:
https://www.health.gov.au/sites/default/files/documents/2020/06/prostheses-list-guide.pdf, accessed: December 2020
17
3 Current distribution of value from prostheses reimbursement
Currently, the medical device value chain is a significant expenditure for consumers, health insurers and Government (through the private health insurance rebate), and directly flows into gross margins for device manufacturers and, to a smaller extent, rebates for private hospitals.
As depicted in the exhibit below, the PL in FY20 was funded by $2.1bn of benefit outlays, of which the source of funds were private health insurance premiums for ~75% of the value (~$1.6bn) and the Commonwealth Government for ~25% of the value through the PHI rebate. Of this, it is estimated at least ~$40m accrued to private hospitals in the form of rebates31, and the remainder directly flowed to device manufacturers.
Analysis conducted by Evaluate on the nature of sponsors within the PL suggests ~60% of the margin flows to seven large multinational companies, while an additional ~20% flows to mid-tier multinationals32. Assuming a similar cost of goods between markets like the US and Australia, it is estimated for constructs like a hip implant, multinational device manufacturers are able to achieve a ~280% gross mark-up on cost of goods sold in Australia, versus a ~120% mark-up in the US33. The lack of competitive forces in the market (including the inability for new entrants to compete on price due to the 25% minimum market share restriction for pricing below the benefit amount) makes it difficult for new entrants to challenge the incumbents and gain meaningful market share.
31 Based on a nominal assumption that private hospitals earn rebates equivalent to 2% of current PL value. Note rebates
have been opaque to the industry, and these values may differ between hospital groups. It is expected in some cases the rebates exceed 2% in value
32 Evaluate. The implantable device (prostheses) market; A workforce contribution and review. April 2020. Unpublished. 33 See: Mendenhall S. et al. (eds) “The 2020 WW Hip & Knee Implant Market”, Orthopedic Network News, 31(3):6-8. 2020.
Also uses analysis from: Evaluate. The Prostheses List: Is it cost effective and what recommendations could improve its quality as a tool for reimbursement? March 2020. Unpublished.
18
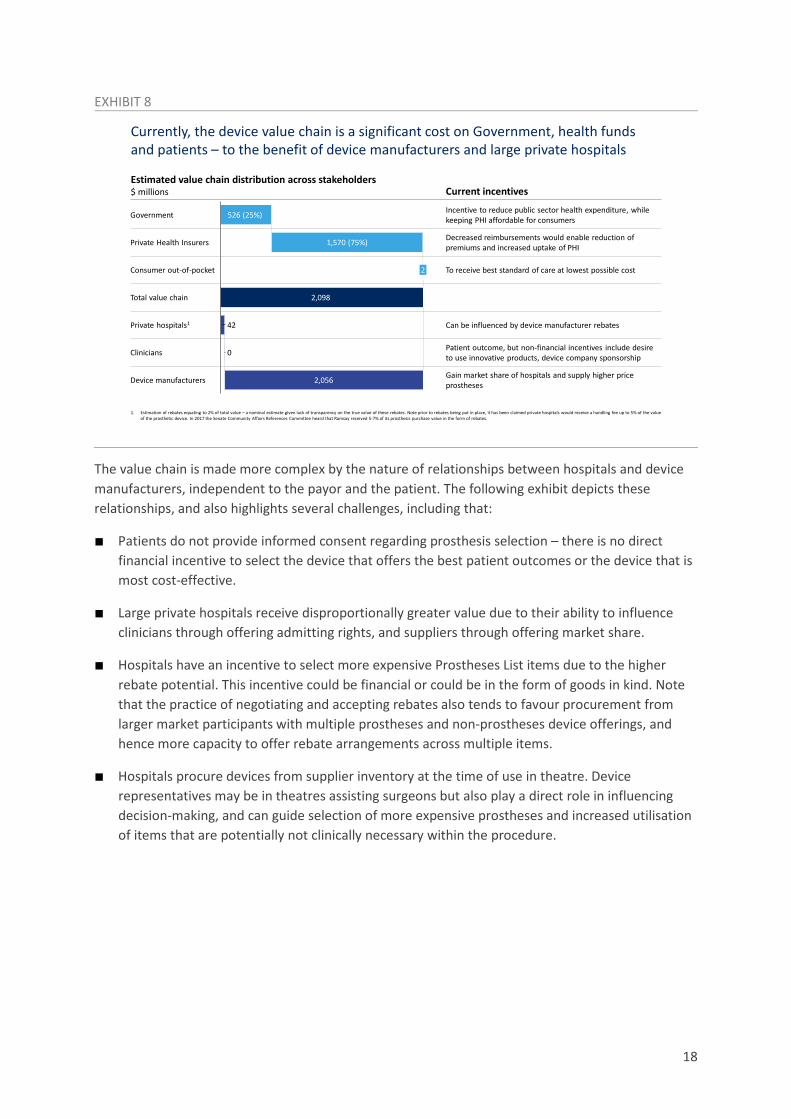
EXHIBIT 8
The value chain is made more complex by the nature of relationships between hospitals and device manufacturers, independent to the payor and the patient. The following exhibit depicts these relationships, and also highlights several challenges, including that:
■ Patients do not provide informed consent regarding prosthesis selection – there is no direct financial incentive to select the device that offers the best patient outcomes or the device that is most cost-effective.
■ Large private hospitals receive disproportionally greater value due to their ability to influence clinicians through offering admitting rights, and suppliers through offering market share.
■ Hospitals have an incentive to select more expensive Prostheses List items due to the higher rebate potential. This incentive could be financial or could be in the form of goods in kind. Note that the practice of negotiating and accepting rebates also tends to favour procurement from larger market participants with multiple prostheses and non-prostheses device offerings, and hence more capacity to offer rebate arrangements across multiple items.
■ Hospitals procure devices from supplier inventory at the time of use in theatre. Device representatives may be in theatres assisting surgeons but also play a direct role in influencing decision-making, and can guide selection of more expensive prostheses and increased utilisation of items that are potentially not clinically necessary within the procedure.
Currently, the device value chain is a significant cost on Government, health funds and patients – to the benefit of device manufacturers and large private hospitals
1. Estimation of rebates equating to 2% of total value – a nominal estimate given lack of transparency on the true value of these rebates. Note prior to rebates being put in place, it has been claimed private hospitals would receive a handling fee up to 5% of the value of the prosthetic device. In 2017 the Senate Community Affairs References Committee heard that Ramsay received 5-7% of its prosthesis purchase value in the form of rebates.
Government
2,098
526 (25%)
1,570 (75%)
Consumer out-of-pocket
Private Health Insurers
2
Total value chain
42Private hospitals1
0Clinicians
2,056Device manufacturers
Current incentives
Incentive to reduce public sector health expenditure, while keeping PHI affordable for consumers
Decreased reimbursements would enable reduction of premiums and increased uptake of PHI
To receive best standard of care at lowest possible cost
Can be influenced by device manufacturer rebates
Patient outcome, but non-financial incentives include desire to use innovative products, device company sponsorship
Gain market share of hospitals and supply higher price prostheses
Estimated value chain distribution across stakeholders$ millions

19
EXHIBIT 9
When considering the momentum growth of the Prostheses List, it should be noted that with the expiry of the MTAA agreement, the recent trend for price reduction will pause. Without further deliberate intervention, the Prostheses List will return to being entirely unresponsive to market changes in pricing. It is anticipated that volume increases will continue, given without intervention there will continue to be an incentive for the overuse of prostheses, particularly in the General & Miscellaneous categories. It should be noted these volume increases continued in 2019-20, despite pauses in elective surgery throughout Australia.
Under these conditions, it is estimated the spend in the PL could rise to $2.8bn by 2025, resulting in the cumulative flow of $9.5bn of value from Government, consumers and private health insurers towards device manufacturers over the next five years.
Hospitals do not have an incentive to negotiate lower prices or control volume, given the current industry structure and resulting procurement processes
Limited transparency to payor
Define need Category strategy Supplier selection Negotiation Reimbursement
Clinician
Device company
Hospital
PHI
Patient
NO
YESClinicians intend to perform procedure Clinicians use device
during procedure
Procurement negotiates with supplier(s)
Device reps can influence selection of prosthesis
Device reps may build relationships with clinicians by supporting training, research,
fellowships etc.
Device procured
Hospital needs prosthesis
Procurement issues competitive
tenders for multiple suppliers
Device company offers rebate and/or additional free goods in
exchange for market share
Hospitals receive FFS reimbursement for device at PL prices
PHI pays FFS amount set by prostheses list
Patients pay premium to PHI
Patient requires and is consented
for procedure
YES
NO
Patient receives device
Can the hospital persuade brand
flexibility in clinicians?
Does the hospital have sufficient
buying power to attract rebates?

20
EXHIBIT 10
Beyond these first order impacts, growth of benefit outlays associated with the Prostheses List has a flow-on impact on premiums, and on the transfer of patients from the private system to the public system. Under current trends, it is estimated PHI participation could reach ~42% by June 2025 – a net decrease in ~200,000 people compared to if participation had stayed at current rates. The average growth in prostheses costs per member (at 4.5-5% p.a.) is estimated to exceed the average growth in benefit outlays per member (at 3-3.5% p.a.), and therefore disproportionately contribute to this decline.
EXHIBIT 11
This decrease in participation rates represents a relative transfer of spend from the private hospital sector to the public hospital sector, compared to a scenario where participation rates were stable.
First order impacts: Without change and at current growth rates, it is estimated ~$10bn of value would continue to accrue to device manufacturers by 2025
Key drivers Momentum growth of PL, $ million
647
FY
36
2025
1,645
47
419
2,104
2020
44
1,697
452
21
1,808
498
22
50
1,905
544
23
53
2,005
594
24
2,500 56
2,100 2,1932,354
2,6522,807+6% p.a.
Value accruing to private hospitalsValue accruing to clinicians Value accruing to device manufacturers
COGS
Cumulative $9.5bn of value accrued over five years (not including FY20) to device manufacturer gross margin
Source: APRA Prostheses List reporting June 2020, AIHW Admitted Patient Care (2014-15 to 2017-18)
Key momentum drivers in growth of the PL assumed to be: Falling PHI coverage offset by population
growth, leading to ~1% p.a. rise in absolute membership
~1% p.a. annual growth in procedures per PHI member, in line with historical trend due to ageing membership base
Prostheses volume per-procedure grows at current trends (~1.5-3.5% p.a. for prostheses, and initially ~10% p.a. for non-prostheses but tapering over time)
Zero benefits per item growth – assume prices remain stable at conclusion of MTAA agreement
Zero gap payment per item growth Average COGS per procedure inflated at
2.1% p.a. (CPI) Ongoing rebates to private hospitals for
prostheses (not publicly disclosed –assumed to be 2% of expenditure)
Second order impacts: at current momentum, participation rates will continue to drop, with coverage estimated to fall to ~42% by June 2025
Assumes ~3.4% p.a. annual premium increases, in line with increases in benefit outlays
This, combined with reducing government rebates (due to annual rebate adjustments), leads to effective premium increases of ~3.9% p.a.
Based on estimated price elasticity of demand, this leads to ~0.2% p.a. absolute annual reduction in PHI coverage
Key drivers
13
41%
2010 1411 2112 15 16 17 18 19 20
43%
22 23 24 25
47%
20260%
1%
42%
44%
45%
46%
48%
Australian Hospital Treatment coverage ratesPrivately insured people as % of population
Historical Projected
Source: Historical data from APRA “Private Health Insurance Membership Trends” (Sep, 2020)

21
This in turn impacts the overall size and viability of the private hospital sector, particularly affecting those smaller hospitals that are not currently the main beneficiaries of rebates in the current system. Ultimately, over the long-term, this reduces the capacity of this part of the sector to invest in increasing spend on medical care.

22
4 Segmentation of the Prostheses List The ~11,000 items on the PL are not homogenous. In fact, many do not meet the definition of a prosthesis. Accordingly, when considering these items for the purposes of reform, there are broadly three segments:
■ Non-prostheses: items that do not meet the definition of a prosthesis (further detail to follow on this definition), and therefore should be not be funded through a separate mechanism.
This segment comprises 67 Product Groups, ~$290m of benefits paid, and has been growing at ~11% p.a., driven primarily by volume growth at ~9% p.a.34 Most benefits in this segment are in the ‘General & Miscellaneous’ category of the PL, and key sub-categories include closure devices (e.g., adhesives) and haemostatic devices (e.g., sponges and foam).
■ Prostheses with evidence of differential clinical outcomes: referring to Product Groups where there is evidence, in the form of registry-level data, that suggests certain prostheses deliver improved outcomes (e.g., revision rates) over the long-term.
This segment includes up to 56 Product Groups, ~$510m of benefits paid, and has been growing at ~1% p.a., with volume growth at ~4% p.a.35 (indicating significant potential for escalating benefit growth once the MTAA agreement ends). The segment is primarily comprised of the Hip and Knee categories of the PL. Note the adequacy of registry data in defining differential long-term clinical outcomes within each of these Product Groups will need to be further assessed by an appropriate clinically-led body.
■ All remaining prostheses: Notably, this includes high volume cardiac prostheses (stents, pacemakers, ICDs) and ophthalmic prostheses (lenses), where registry-level data does not exist to differentiate between prostheses that deliver improved longer-term outcomes.
This segment comprises 305 Product Groups as well as Part B, ~$1.3bn of benefits paid, and has been growing at 3% p.a.36 (with price controlled through the recent MTAA agreement, but volume growing well in excess of procedure growth at 4.4% p.a.).
The exhibit below demonstrates the relative growth of benefits and volume across each of these three segments. Please note these growth rates include FY20, when procedure volume was significantly impacted by the COVID-19 pandemic.
34 Hospital Casemix Protocol-1 (HCP1), Prosthesis Utilisation Report, December 2020. Proprietary data, unpublished.
Adjustment then applied as previously described, given HCP1 data under-reports prostheses utilisation relative to APRA statistics
35 ibid 36 ibid

23
EXHIBIT 12
To arrive at this segmentation, multiple tags were applied to each Product Group in the Prostheses List, with the most relevant axes then defined for segmentation purposes. Further details on other potential axes for segmentation of the PL are presented in the Appendix. The Appendix also contains detail on specific examples of inefficiency within each segment.
All segments have been growing in volume and benefits, with non-prostheses usage and cost outpacing growth in other segments
Non-prostheses
Prostheses with registry data
Prostheses without registry data
15 2020
692
2014 16 17 18 19
836517 559 575 622 858
+8.8% p.a.
202015
157
2014 16 1917 18
172 188 215 233 261 291
+10.8% p.a.
152014 181716 19 2020
186 202 213 224 230 234 230
+3.6% p.a.
162014 202015 1817 19
488 522 557 570 549 527 507
+0.6% p.a.
1916
2,029
152014 17 202018
1,569 1,680 1,740 1,853 1,936 2,034
+4.4% p.a.
1,2941,252
192014
1,202
1715 16 202018
1,099 1,309 1,315 1,302
+2.9% p.a.
Volume, 000’s Total benefits, A$m
Source: Overall prostheses item volume and benefits from APRA Prostheses Statistics (June 2020); segmentation performed using Hospital Casemix Protocol 1 data, which is more granular than APRA data but less complete, and extrapolated by prosthesis category to align with APRA reported figures
24
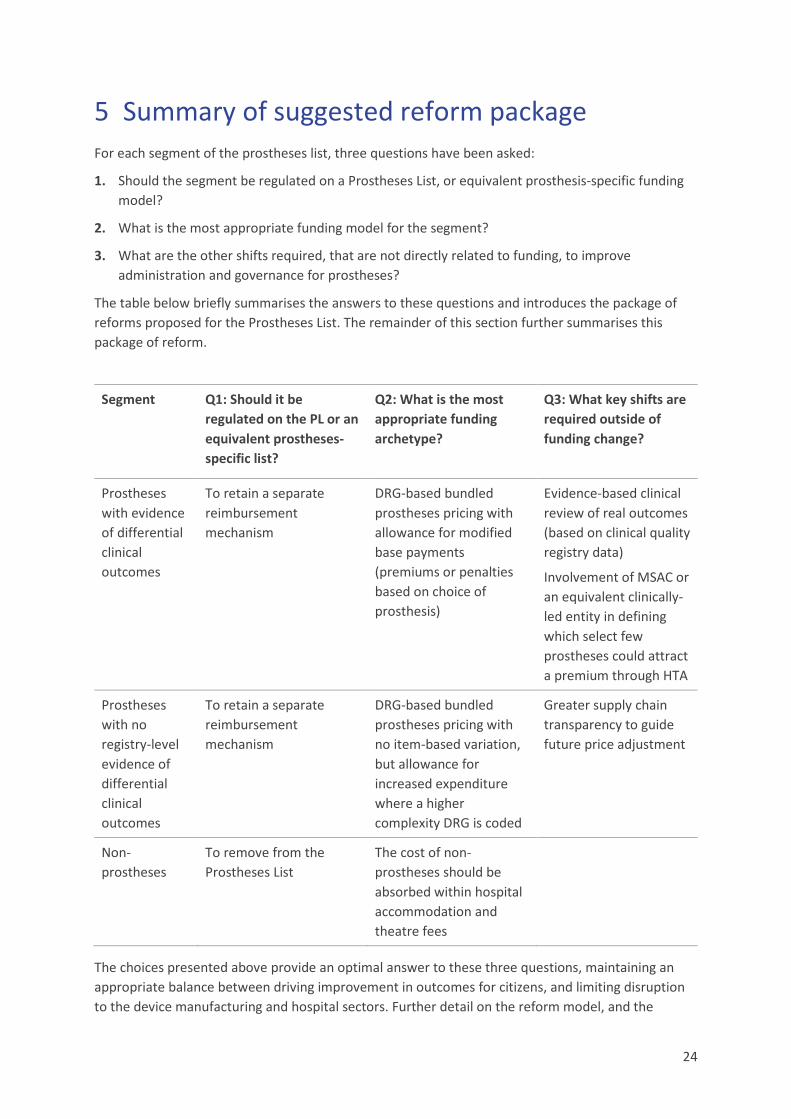
5 Summary of suggested reform package For each segment of the prostheses list, three questions have been asked:
1. Should the segment be regulated on a Prostheses List, or equivalent prosthesis-specific funding model?
2. What is the most appropriate funding model for the segment?
3. What are the other shifts required, that are not directly related to funding, to improve administration and governance for prostheses?
The table below briefly summarises the answers to these questions and introduces the package of reforms proposed for the Prostheses List. The remainder of this section further summarises this package of reform.
Segment Q1: Should it be regulated on the PL or an equivalent prostheses-specific list?
Q2: What is the most appropriate funding archetype?
Q3: What key shifts are required outside of funding change?
Prostheses with evidence of differential clinical outcomes
To retain a separate reimbursement mechanism
DRG-based bundled prostheses pricing with allowance for modified base payments (premiums or penalties based on choice of prosthesis)
Evidence-based clinical review of real outcomes (based on clinical quality registry data)
Involvement of MSAC or an equivalent clinically-led entity in defining which select few prostheses could attract a premium through HTA
Prostheses with no registry-level evidence of differential clinical outcomes
To retain a separate reimbursement mechanism
DRG-based bundled prostheses pricing with no item-based variation, but allowance for increased expenditure where a higher complexity DRG is coded
Greater supply chain transparency to guide future price adjustment
Non-prostheses
To remove from the Prostheses List
The cost of non-prostheses should be absorbed within hospital accommodation and theatre fees
The choices presented above provide an optimal answer to these three questions, maintaining an appropriate balance between driving improvement in outcomes for citizens, and limiting disruption to the device manufacturing and hospital sectors. Further detail on the reform model, and the
25
choices inherent within it, are detailed in Section 6. To briefly summarise, the reform includes the following key components:
■ It is proposed that the bundled payment model be administered and priced by the Independent Hospital Pricing Authority (IHPA), which is an entity that has existing capability, experience and proprietary data to position it well in pricing and delivering bundled payments. IHPA currently manages activity based funding for public hospitals by collecting data from the National Minimum Dataset and the National Hospital Cost Data Collection, determining the nationally efficient price for services, translating ICD-10-AM classifications submitted from hospitals to AR-DRG codes, and then developing cost weights for these AR-DRG codes.
■ The bundled payments would be delivered to either the clinician (on an ‘opt in’ basis) or the hospital provider, who can then negotiate directly with device manufacturers and earn a margin on sales. This will create competitive tension and a free market environment that has, so far, been absent from the system.
■ The initial price for the bundled payment would be set based on a combination of public sector and international benchmarks. Subsequently, a price disclosure mechanism, similar to the Pharmaceutical Benefits Scheme, could be used to transparently deliver information on pricing and volume to IHPA, enabling future adjustment of bundled payments if required.
■ Adjustments to the base payment amount (including both premiums and penalties) could be based on Health Technology Assessment conducted by MSAC or an equivalent body, with a view to using clinical quality registry data to determine superiority or inferiority of certain items.
■ There would be no scope for patient out-of-pocket gap payments. If prostheses prices exceed the bundled amount, there would be allowance for coding to higher complexity DRGs (if clinically accurate) or for claiming a clinically necessary circumstance.
■ Within this model, the existing PLAC would be decommissioned following a transition of the Prostheses List to bundled payments.
Transitioning to a bundled payment model for prostheses spend, with modifications, is a considered mechanism to address the challenges of price, volume, clinical outcomes alignment and administrative burden. The proposed approach will ensure:
■ Pricing of prostheses begins to more closely approach an appropriate market price through negotiations between hospitals, who receive the bundled payment, and device manufacturers. In these procurement negotiations, hospitals will have an incentive to drive competition between manufacturers and secure price reduction. The potential impact of such a model can be significant even in markets with lower prices than Australia. When Horizon Blue Cross Blue Shield of New Jersey commenced providing bundled payments at an orthopaedic group practice, joint implant costs per procedure reduced by 21%37. Similarly, Baptist Health were able to reduce joint implant costs by 29% in the pilot of the Bundled Payments for Care Improvement (BPCI) model launched in 201338, and providers in Stockholm County in Sweden negotiated a 10-15% reduction
37 Barnett et al. Two-Year Evaluation of Mandatory Bundled Payments for Joint Replacement. N Engl J Med 2019; 380:252-
262 38 Navathe et al. Cost of Joint Replacement Using Bundled Payment Models. JAMA Intern Med 2017; 177(2):214-222

26
in prostheses costs following implementation of a bundled and partially outcomes-driven payment model39. If private hospitals were to consistently reduce the price paid for prostheses, flow-on effects could include reducing local reference prices for the public hospital system, enabling more effective public hospital procurement and delivering further reduced costs for Commonwealth and State Governments.
■ Volume growth of prostheses will be curtailed, as hospitals now have an incentive to limit items used to only those that are relevant and required for the surgery. With this incentive in place, it is expected that volume growth of prostheses could reduce to a rate that is closer to overall procedure growth, declining from 6% p.a. to ~2-3% p.a40.
■ Clinical outcomes can be incentivised through a range of potential modifications to the bundled payment, in order to align payment to outcomes. The proposed approach would be to, where a sufficiently high bar on evidence has been met (e.g., where there is long-term clinical outcomes data in a clinical quality registry), identify prostheses that deliver superior clinical performance. In these instances, the base bundled payment could be modified upwards when a prosthesis is chosen that delivers superior clinical performance, and modified downwards when a clearly inferior prosthesis is selected.
■ From an administrative perspective, it is proposed that bundled payments be priced and administered by the Independent Hospital Pricing Authority, which is an entity with well-recognised capability in this space. Assignment of this role to IHPA could allow for the decommissioning of PLAC, and the streamlining of processes that are currently in place to support maintenance of a list of ~11,000 items. Instead of this list of ~11,000 items, the role of IHPA would be to monitor a list of DRG codes, which it already manages in the public sector context, and TGA-approved items that meet the definition of a prosthesis would simply need be attributed by hospitals for use within these DRG codes.
In short, a bundled payment model will address many of the woes of the current system by introducing market-like conditions. From a patient perspective, this means more incentive for clinicians to select the best performing prosthesis, reduced growth in private health insurance premiums and ultimately greater access in the Australian healthcare system to elective surgery.
The following exhibit contains a summary of the impacts this model could have on the medical device value chain. It is estimated that the reduction in pricing and volume associated with removal of non-prostheses from the PL could deliver over $300m of value (in today’s terms, with value calculated in FY25, then re-baselined to FY20) to PHI members. Private hospitals would incur additional cost because of this change, but this cost to private hospitals would likely be more than offset by the ability to drive margins on prostheses spend within a bundled payment model. Hospitals would also be able to improve their net position by reducing utilisation of accessory prostheses (e.g., screws) within the bundled payment.
The estimated outcome of such a system is a return of ~$508m to consumers and taxpayers and a net positive position for private hospitals, as shown in Exhibit 13.
39 Porter et al. OrthoChoice: Bundled Payments in the County of Stockholm. Harvard Business School. 9-714-515 40 Historical trends for procedure growth among privately admitted patients have been calculated from: Australian Institute
of Health and Welfare. Admitted patient care 2017-18. May 2019. and previous editions of the same report

27
EXHIBIT 13
Should these benefits be captured in their entirety as depicted, and passed back to the consumer in the form of reduced premium increases, it is estimated that PHI participation by the start of the 2025 financial year could rise by ~72,000 people, and by the start of the 2026 financial year could rise by ~105,000 people41.
EXHIBIT 14
41 The price elasticity of demand has been estimated using data from: Australian Government Department of Health.
Average Annual Increases in Private Health Insurance Premiums. December 2019; and: Australian Regulation Prudential Authority. Private Health Insurance Membership and Coverage [Dataset]. June 2020. Further notes on modelling methodology are contained in the Appendix.
First order impacts: the treatment of non-prostheses results in a different pattern of value chain disruption, compared to the other two segmentsValue shifts relative to momentum as a result of first order changes, by segment, A$m
Non-prostheses
Prostheses with registry data
Prostheses without registry data
Items removed from PL in FY22 (~50% of impact captured within FY22, and remainder in FY23). This shifts costs to hospitals2, but also provides incentive for upfront and ongoing price and volume reduction
Upfront price reduction: 10% price reduction applied over FY22 and FY23 as items are transitioned to DRG bundles
Providers assumed to be able to reach a ~20% margin on by FY25; 95% of which will be captured by hospitals, and 5% by clinicians
No secondary price adjustment currently assumed
278 565 638 679 508
Value transfer to consumers and funds, A$m
1. COGS reduction as a result of reduced volume growth2. Note there is some risk that growth in expenditure for non-prostheses will be partially returned to funds through renegotiation of contracting, however no such shift has currently been assumed
-42228
-17
FY25
-128
-84
-163FY22
385
-197 0-152 -360
415
-2080
FY24
-165
444
-2180-176-49
332
FY25 in FY20 terms
0 -132-37
FY23
Consumers (incl. relative reduction in premiums) Manufacturer gross marginHospitals Clinicians COGS1
14 17
FY22
5551 46
-104
FY23
448
89
-159-153
FY24
59 61-31
936
FY25 in FY20 terms
0
FY25
69
-119
-340
FY22
136 44
-82
1321504
164-286
FY23
24915
-428
FY24
174264
16
-454
FY25
130198
12
FY25 in FY20 terms
Second order impacts: while PHI participation will likely remain challenged, containing PL growth could improve participation rates by ~0.4% in FY25
2026242021 22
43.5
23 250
42.5
43.0
44.0
% of total population
+0.4%
Momentum case Reform scenario
PHI with Hospital Treatment participation rate at the start of the Financial Year, %
PHI with Hospital Treatment membership at the start of the Financial Year
Source: Historical data from APRA Private Health Insurance Membership and Coverage (June 2020)
250
11,200
11,400
11,600
11,800
12,000
12,200
242021 22 23 2026
Thousands
+105
+72

28
Assuming a similar age distribution to the current privately insured membership base, the shift of these participants from public hospitals to private hospitals could reduce costs to Government by ~$135m in 2025, and by ~$240m cumulatively over the next five years42.
EXHIBIT 15
The following section contains further detail on the specific decision points that sit within the design of the proposed reform model.
42 Cost savings have been using data from: Australian Government Department of Health. Hospital Casemix Protocol Annual
Report 2018-19 [Dataset]. Further notes on modelling methodology are contained in the Appendix.
Third order impacts: 72k additional PHI members would transfer ~$135m of costs from Government to private healthcare in FY25
2025
-23 -211
-125
15
2023
-70-7
3344
24
-1259
78
Value shifts relative to momentum as a result of third order impacts, A$mFunds Consumers1 State Government Cth Government2
1. Negative value to consumers driven by OOP costs from shift out of public system2. Ratio of savings between Commonwealth and State government estimated from current proportion of health expenditure (AIHW, 2016-7)
Cumulative incremental PHI members by the start of the financial year (000’s)
XXCumulative value to FY25, A$m
136
103
-20
-219
14 42 72
Source: Historical data for costs and benefits from HCP Annual Report (2018-19)
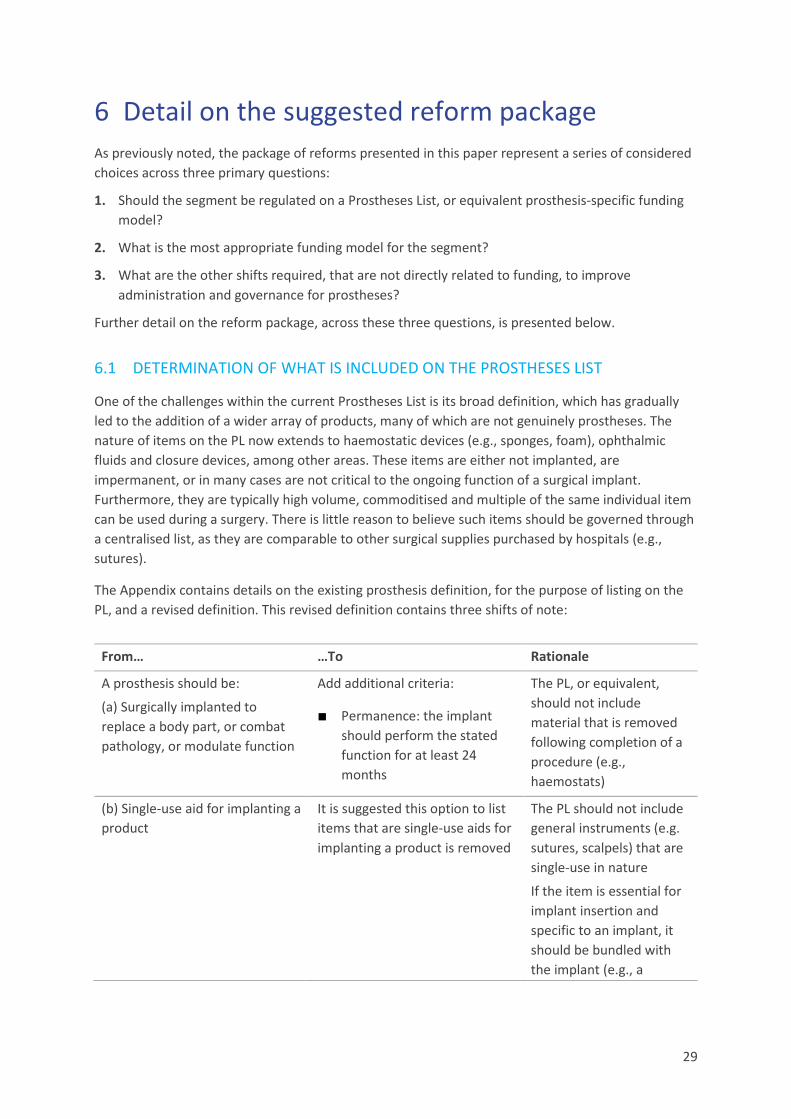
29
6 Detail on the suggested reform package As previously noted, the package of reforms presented in this paper represent a series of considered choices across three primary questions:
1. Should the segment be regulated on a Prostheses List, or equivalent prosthesis-specific funding model?
2. What is the most appropriate funding model for the segment?
3. What are the other shifts required, that are not directly related to funding, to improve administration and governance for prostheses?
Further detail on the reform package, across these three questions, is presented below.
6.1 DETERMINATION OF WHAT IS INCLUDED ON THE PROSTHESES LIST
One of the challenges within the current Prostheses List is its broad definition, which has gradually led to the addition of a wider array of products, many of which are not genuinely prostheses. The nature of items on the PL now extends to haemostatic devices (e.g., sponges, foam), ophthalmic fluids and closure devices, among other areas. These items are either not implanted, are impermanent, or in many cases are not critical to the ongoing function of a surgical implant. Furthermore, they are typically high volume, commoditised and multiple of the same individual item can be used during a surgery. There is little reason to believe such items should be governed through a centralised list, as they are comparable to other surgical supplies purchased by hospitals (e.g., sutures).
The Appendix contains details on the existing prosthesis definition, for the purpose of listing on the PL, and a revised definition. This revised definition contains three shifts of note:
From… …To Rationale
A prosthesis should be:
(a) Surgically implanted to replace a body part, or combat pathology, or modulate function
Add additional criteria:
■ Permanence: the implant should perform the stated function for at least 24 months
The PL, or equivalent, should not include material that is removed following completion of a procedure (e.g., haemostats)
(b) Single-use aid for implanting a product
It is suggested this option to list items that are single-use aids for implanting a product is removed
The PL should not include general instruments (e.g. sutures, scalpels) that are single-use in nature
If the item is essential for implant insertion and specific to an implant, it should be bundled with the implant (e.g., a

30
balloon catheter with pre-loaded coronary stent)
(c) Critical to continuing function for patient with implant
Add additional criteria:
■ Permanence: item should continuously contribute to ongoing function of permanent implant
■ Medically necessary: item should be medically necessary
The PL should not include items that only serve a function temporarily (e.g., glues and haemostats)
Only items that are essential and deemed medically necessary should be reimbursed and included on the list
As depicted in the exhibit below, items that are not considered prostheses typically lack permanence or are not critical to the ongoing function of an implant. The intent of the PL, and a bundled prosthesis price, should be to cover the cost of high value devices that are not commoditised and serve a significant therapeutic function. It is therefore proposed that these non-prostheses items are removed from the PL. A complete list of Product Groups proposed for removal is provided in the Appendix.
EXHIBIT 16
These items currently constitute an estimated ~$290m of spend and growth has been disproportionately outpacing the remainder of the PL. Removal of these items will help provide appropriate incentives for hospitals to prudently manage these commoditised resources, while still maintaining clinician choice.
Based on these criteria, non-prostheses should no longer be managed through a Prostheses List mechanism1
1. High value examples from current PL chosen, not an exhaustive list
Non-prosthesis product group
03.08.02 – Internal Adhesives
06.03.15 – Bone Graft Substitute
03.05.05 – Matrix (Haemostatic devices)
01.03.01 – Viscoelastic (Intraocular fluids)
10.07.01 – Arterial Closure Devices
03.02.03 – Infusion Pumps, Battery Powered
03.02.02 – Infusion Pumps, Balloon Based
03.08.01 – Adhesion Barriers
10.09.04 – Infuser Ports, Single Chamber
03.05.04 – Pliable patches (Haemostatic devices)
Rationale for exclusion based on criteria
PermanenceSurgical implant OR critical to ongoing function of implant
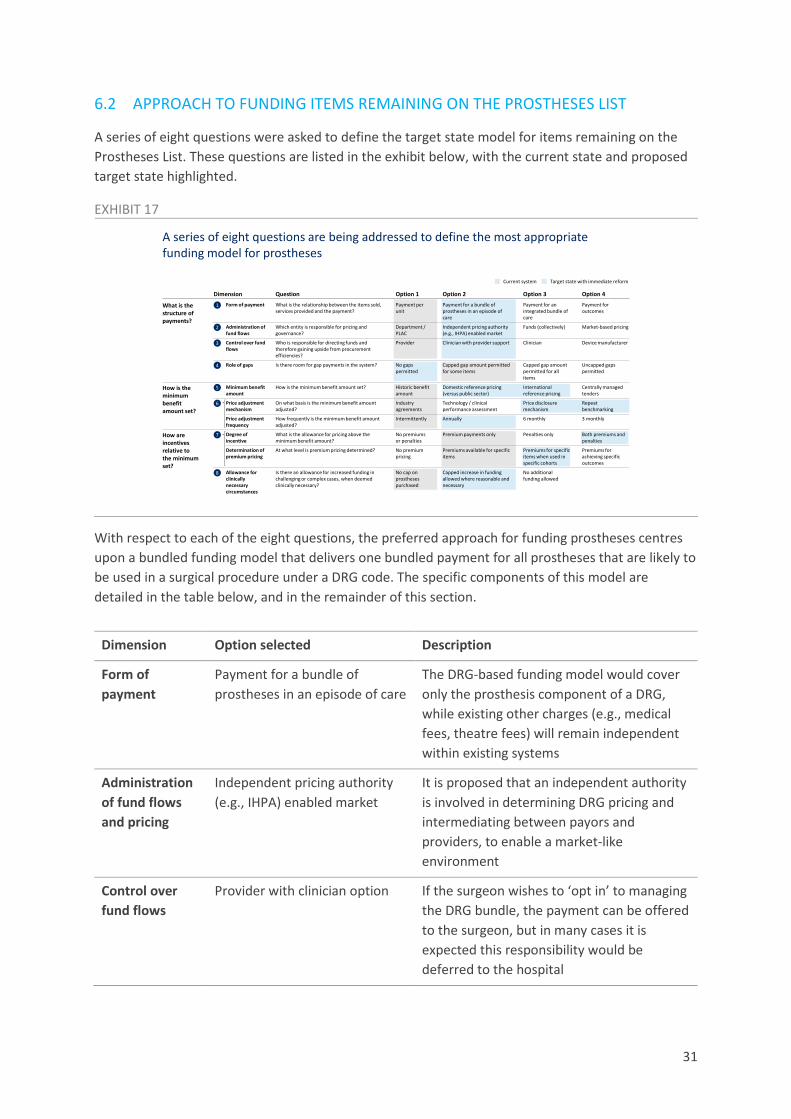
31
6.2 APPROACH TO FUNDING ITEMS REMAINING ON THE PROSTHESES LIST
A series of eight questions were asked to define the target state model for items remaining on the Prostheses List. These questions are listed in the exhibit below, with the current state and proposed target state highlighted.
EXHIBIT 17
With respect to each of the eight questions, the preferred approach for funding prostheses centres upon a bundled funding model that delivers one bundled payment for all prostheses that are likely to be used in a surgical procedure under a DRG code. The specific components of this model are detailed in the table below, and in the remainder of this section.
Dimension Option selected Description
Form of payment
Payment for a bundle of prostheses in an episode of care
The DRG-based funding model would cover only the prosthesis component of a DRG, while existing other charges (e.g., medical fees, theatre fees) will remain independent within existing systems
Administration of fund flows and pricing
Independent pricing authority (e.g., IHPA) enabled market
It is proposed that an independent authority is involved in determining DRG pricing and intermediating between payors and providers, to enable a market-like environment
Control over fund flows
Provider with clinician option If the surgeon wishes to ‘opt in’ to managing the DRG bundle, the payment can be offered to the surgeon, but in many cases it is expected this responsibility would be deferred to the hospital
A series of eight questions are being addressed to define the most appropriate funding model for prostheses
What is the structure of payments?
Dimension
8 Allowance for clinically necessary circumstances
No additional funding allowed
Capped increase in funding allowed where reasonable and necessary
No cap on prostheses purchased
Is there an allowance for increased funding in challenging or complex cases, when deemed clinically necessary?
Role of gaps4 Capped gap amount permitted for all items
Capped gap amount permitted for some items
No gaps permitted
Is there room for gap payments in the system? Uncapped gaps permitted
Option 3Option 2Option 1Question Option 4
Price adjustment frequency
6 monthlyAnnuallyIntermittentlyHow frequently is the minimum benefit amount adjusted?
3 monthly
How is the minimum benefit amount set?
Minimum benefit amount
5 International reference pricing
Domestic reference pricing (versus public sector)
Historic benefit amount
How is the minimum benefit amount set? Centrally managed tenders
6 Price adjustment mechanism
Price disclosure mechanism
Technology / clinical performance assessment
Industry agreements
On what basis is the minimum benefit amount adjusted?
Repeat benchmarking
How are incentives relative to the minimum set?
7 Degree of incentive
Penalties onlyPremium payments onlyNo premiums or penalties
What is the allowance for pricing above the minimum benefit amount?
Both premiums and penalties
Determination of premium pricing
Premiums for specific items when used in specific cohorts
Premiums available for specific items
No premium pricing
At what level is premium pricing determined? Premiums for achieving specific outcomes
Administration of fund flows
2 Funds (collectively)Independent pricing authority (e.g., IHPA) enabled market
Department / PLAC
Which entity is responsible for pricing and governance?
Market-based pricing
Control over fund flows
3 ClinicianClinician with provider supportProviderWho is responsible for directing funds and therefore gaining upside from procurement efficiencies?
Device manufacturer
Current system Target state with immediate reform
Form of payment Payment for an integrated bundle of care
Payment for a bundle of prostheses in an episode of care
Payment per unit
What is the relationship between the items sold, services provided and the payment?
Payment for outcomes
1

32
Role of gaps No gaps permitted It is proposed that the DRG price level would be set at an appropriate figure such that gaps for prostheses need not be charged
Minimum benefit amount
Both domestic and international reference pricing
DRG-level benefits will need to be re-defined by a body like IHPA, based on a mix of domestic benchmarking (versus the public sector) and international reference pricing where there is sufficient data availability
Price adjustment mechanism and frequency
Annual price disclosure mechanism with repeat benchmarking
On an annual basis, price adjustments could be made based on transparent reporting of prostheses costs, allowing the DRG benefit to be adjusted to deliver a fair distribution of value in the system. Where international pricing has significantly changed, this could also be taken into account to update bundle pricing
Degree of incentive and determination of pricing
Both premiums and penalties, applied for specific items when used in specific cohorts
A mechanism can be introduced, through MSAC and using clinical quality registry data, to allow for a consistent premium payment for items with Superior Clinical Performance, and a reduction to the DRG payment when inferior items are used. It is proposed the determination of premiums or penalties also account for the patient demographic, where there is evidence of certain devices producing superior outcomes in certain cohorts only. Note other types of financial upside from innovation (e.g., improving surgeon procedure time) would already be captured by providers through a shift to a bundled payment model.
Allowance for clinically necessary circumstances
Capped increase in funding allowed for clinically necessary circumstances
It is proposed that a limited retrospective peer review process is in place, but that surgeons and hospitals can be directly compensated by payors for clinically necessary circumstances without pre-approval. In addition, for certain DRGs, variation in complexity should be captured in the definition of bundled prices for more complex DRG codes.
An example of the process that could therefore eventuate in the future state, with these design choices in place, is shown below:

33
EXHIBIT 18
6.2.1 The form of payment
The proposed model for delivering reimbursement for prostheses is one that provides a bundled payment for all prostheses that are likely to be used in a single procedure. This approach appropriately brings Australia more in line with international comparators and drives competition in the market, while limiting the degree of disruption in the industry.
In assessing the various options available, it should be noted firstly that Australia’s fee per item pricing on a centrally managed list is an anomaly in the global landscape. A scan of other countries suggested episode-based payments are more the norm than the exception.
EXHIBIT 19
Design of modelBase case example of total hip replacement
Prostheses selection Procurement Payment Review
Device manufacturer Device manufacturer enters supply
arrangement with provider
Manufacturer can apply to MSAC for additional benefit amount if product provides superior clinical outcomes
IHPAUses price disclosure mechanism to review DRG benefit amount over time
Price disclosure mechanism provides supply chain transparency regarding procurement agreements to assist in centralised annual price-setting
Payor Payor delivers minimum benefit amount for DRG-bundle, using price set by IHPA (based on international and domestic benchmarks)
Clinical complexity of episode considered via stratified DRG-code
Starting point
Patient Patient presents requiring THR No gap payments permitted
ClinicianClinician selects the required set of prostheses needed to perform procedure
In some cases, clinician may choose to manage the bundled payment and engage with the provider on procurement
ProviderProvider manages procurement of necessary prostheses
In most cases provider will receive and manage the DRG bundle, if clinician chooses not to manage it
Australia’s approach to pricing prostheses is an anomaly in the global landscape
1. Prostheses included as part of Part III Section H of PHARMAC Pharmaceutical Schedule, which includes non-prostheses2. No prostheses list for payors due to episode-of-care based payments
Does premium pricing incentivise innovation for manufacturers?
Country Australian – private SwedenFranceUK (NHS)USA –Medicare CJR NZ – public
Are there gap payments permitted?
Is there a mechanism for price adjustment (e.g., HTA assessment, international benchmarking, centralisedtenders or price disclosure)
NZ – private
Are general non-prostheses items included on the list of prostheses?
N/A
2
N/A
2 2
N/A N/A
21
Is there bundling of prostheses payments?
Combination of models, including outcomes-based OrthoChoice model
By episode-of-careBy episode-of-care By episode-of-careBy prostheses (e.g. for a hip replacement)

34
With this global context in mind, six funding archetypes were considered for Australia, ranging from maintaining the status quo, to developing an outcomes-based reimbursement model akin to what is used for joint replacements in Sweden. These funding archetypes are described below.
EXHIBIT 20
A range of factors were considered in determining the relative merits and challenges of each funding archetype. These can be broadly divided into:
■ The ability to drive improved citizen outcomes: by driving clinical outcomes and by shifting value to consumers and Government, through providing more affordable private health insurance and reduced out-of-pocket costs, and resulting in more prudent use of taxpayer resources.
■ The level of disruption caused by change, considering shifts in value from hospitals and manufacturers, and the degree of business process disruption.
Considering these criteria, a model which bundles the costs of prostheses into one payment captures the appropriate balance between driving value back to consumers, and minimising disruption. Some of the strengths of this model include:
■ Active support for clinician choice. As will be detailed, this can be further enhanced by providing clinicians with ownership of the DRG bundled payment should they choose to accept it.
■ Creating sufficient competitive tension in the market to reduce the overall cost of prostheses, including by providing an incentive to contain growth in volume of ancillary prostheses used per procedure. This would limit the overall inflationary risk within the system.
■ Sufficient flexibility to allow for incentives to be engineered which promote use of prostheses with the best long-term clinical outcomes.
■ Integration of the funding model in existing governance (through IHPA) and using existing methodology, without disrupting contracts between private payors and providers (as would occur if transitioning to a full episode or outcomes-based model). This will also likely be a more
Six funding archetypes were explored that are potential options for future management of prostheses funding
Funding model archetype
Episodic DRG-based bundled prosthesis pricing
Episodic DRG-based pricing for entire episode of careExisting PL model Re-priced PL model GPO-led market pricing
Outcomes-based reimbursement
Description of funding approach
Mapping of prostheses to the most appropriate DRG, and providing bundled payments for the DRG within which providers will need to optimiseprostheses costs
Integrated bundled payment for entire episode of care, of which prostheses form one component, allowing benefit to be captured for prostheses which reduce overall cost of care
Maintenance of existing Prostheses List pricing mechanism, with minimum prices adjusted based on intermittent industry agreements
Pricing of prostheses relative to benchmark price based on international benchmarks and/or technology assessment on evidence of effectiveness (e.g., in reducing revisions)
Pricing based on industry-level negotiations directly between payors and device manufacturers, with no caps on gap charges for prostheses
For applicable categories, defining rules to incentivisehigh value care and reduction in system level costs (e.g., provider coverage for revisions)
Standalone item pricingIntegrated item pricing Episodic pricing Risk-sharing
21 3 4 5 6
Private
Preferred option
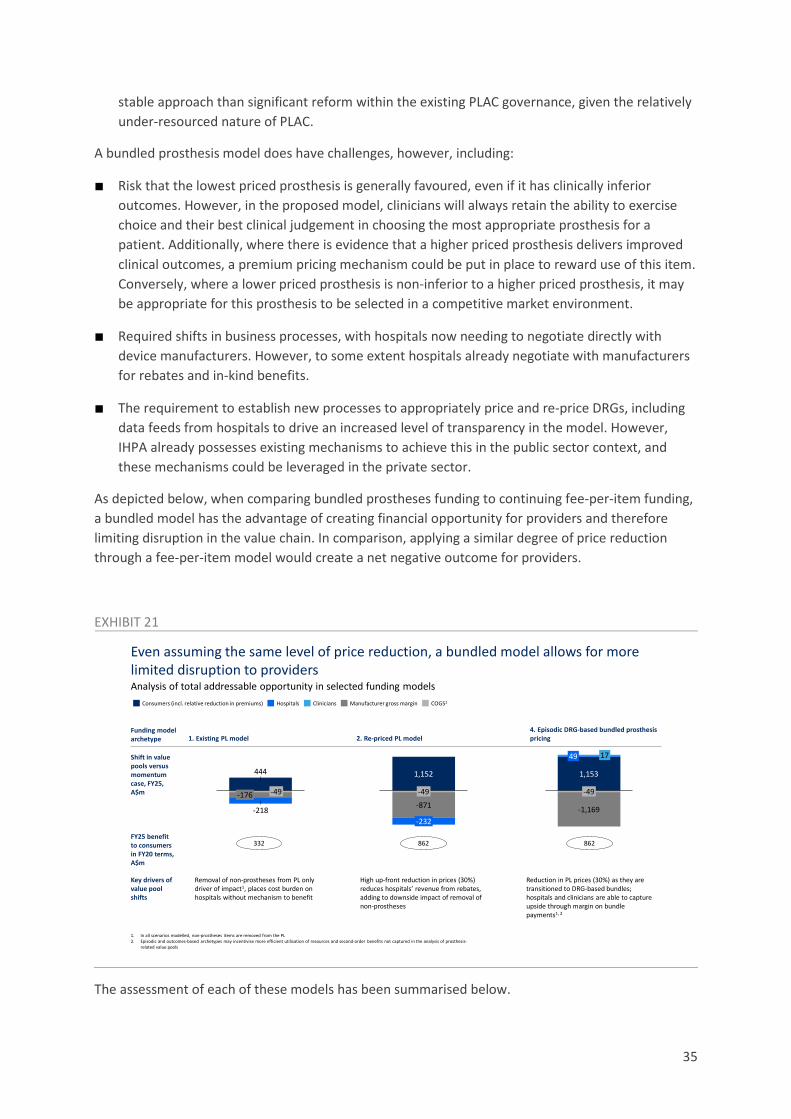
35
stable approach than significant reform within the existing PLAC governance, given the relatively under-resourced nature of PLAC.
A bundled prosthesis model does have challenges, however, including:
■ Risk that the lowest priced prosthesis is generally favoured, even if it has clinically inferior outcomes. However, in the proposed model, clinicians will always retain the ability to exercise choice and their best clinical judgement in choosing the most appropriate prosthesis for a patient. Additionally, where there is evidence that a higher priced prosthesis delivers improved clinical outcomes, a premium pricing mechanism could be put in place to reward use of this item. Conversely, where a lower priced prosthesis is non-inferior to a higher priced prosthesis, it may be appropriate for this prosthesis to be selected in a competitive market environment.
■ Required shifts in business processes, with hospitals now needing to negotiate directly with device manufacturers. However, to some extent hospitals already negotiate with manufacturers for rebates and in-kind benefits.
■ The requirement to establish new processes to appropriately price and re-price DRGs, including data feeds from hospitals to drive an increased level of transparency in the model. However, IHPA already possesses existing mechanisms to achieve this in the public sector context, and these mechanisms could be leveraged in the private sector.
As depicted below, when comparing bundled prostheses funding to continuing fee-per-item funding, a bundled model has the advantage of creating financial opportunity for providers and therefore limiting disruption in the value chain. In comparison, applying a similar degree of price reduction through a fee-per-item model would create a net negative outcome for providers.
EXHIBIT 21
The assessment of each of these models has been summarised below.
Even assuming the same level of price reduction, a bundled model allows for more limited disruption to providersAnalysis of total addressable opportunity in selected funding models
-49
1,153
49 17
-1,169
Consumers (incl. relative reduction in premiums) Manufacturer gross marginHospitals COGS1Clinicians
Funding model archetype
Shift in value pools versus momentum case, FY25, A$m
FY25 benefit to consumers in FY20 terms, A$m
1,152
-232
-871
-49
-218
444
-176 -49
Key drivers of value pool shifts
1. In all scenarios modelled, non-prostheses items are removed from the PL2. Episodic and outcomes-based archetypes may incentivise more efficient utilisation of resources and second-order benefits not captured in the analysis of prosthesis-
related value pools
4. Episodic DRG-based bundled prosthesis pricing2. Re-priced PL model1. Existing PL model
862332 862
Removal of non-prostheses from PL only driver of impact1, places cost burden on hospitals without mechanism to benefit
High up-front reduction in prices (30%) reduces hospitals’ revenue from rebates, adding to downside impact of removal of non-prostheses
Reduction in PL prices (30%) as they are transitioned to DRG-based bundles; hospitals and clinicians are able to capture upside through margin on bundle payments1, 2

36
EXHIBIT 22
As the above exhibit depicts, there is further opportunity to improve citizen outcomes by transitioning, over time, to outcomes-based reimbursement. Precedent for more advanced payment models exists when it comes to high value surgeries like joint replacement. The OrthoChoice model in Sweden is an example of this43, which initially with-holds 3% of provider reimbursement pending achievement of outcomes, such as patient pain assessments. A transition to basic prosthesis-based bundled payments, with allowance for appropriately increased pricing where there is evidence for long-term clinical outcomes, could be a precursor to longer-term outcomes-based reimbursement. With this in mind, while not a fundamental component of this proposal, any opportunities to further develop clinical registries or build comprehensive datasets based on linked patient outcomes data should be explored alongside implementation of this model.
6.2.2 Responsibility for administration of fund flows and pricing
It is proposed pricing of the DRG bundle is conducted centrally and independently, by the Independent Hospital Pricing Authority (IHPA), which already bears the responsibility of managing the Nationally Efficient Price of activity in public hospitals. This model would be a key step in developing competitive conditions in the prostheses market in Australia.
IHPA is well-placed to both set and refine pricing of DRG bundles given it has significant in-house capability and access to public sector data, enabling domestic reference pricing. Furthermore, it has the ability to collect costing data regularly from hospitals, and established governance around completing this activity, which can help guide re-pricing. IHPA also possesses existing audit and review processes which could be readily translated to allow assessment of reimbursement for clinically complex circumstances.
These attributes position IHPA well to be a market enabler. Compared to alternative models:
43 Porter et al. OrthoChoice: Bundled Payments in the County of Stockholm. Harvard Business School. 9-714-515
A DRG-based bundled prosthesis pricing model likely captures the appropriate balance between citizen impact and disruption
ILLUSTRATIVE
Leve
l of c
itize
n ou
tcom
e im
prov
emen
t Highbenefit
Lowbenefit
1
2
3
4 5 6
Low disruption High disruption
Level of disruption
6 Outcomes-based reimbursement
1 Existing PL model
2 Re-priced PL model
3 GPO-led market pricing
4 DRG-based bundled prosthesis pricing
5 DRG-based pricing for entire episode of care
Opportunity listing

37
■ IHPA has capability and experience in bundled price setting, versus a model in which the Department or PLAC is setting the bundled price. IHPA also has established data feeds and processes for price adjustment based on costing data from within the market.
■ While a purely market-based solution could be an alternative option, whereby funds individually negotiate prices with providers, IHPA’s access to public sector reference data and ability to facilitate price disclosure again places it in an advantageous position in the short-term. Alignment on a central price also limits the potential for smaller funds to be exposed to heavily skewed negotiations versus larger funds.
Note the nature of the model proposed also ensures that active contracting arrangements between funds and hospitals for other components of the hospital stay (e.g., accommodation, theatre fees) are not impacted. Such contracts are already in place between private hospitals and private health insurers and vary significantly in their nature. It is proposed IHPA would not be involved in management of these broader contracts.
6.2.3 Ownership over bundled payment
It is proposed that the DRG bundle is distributed to either the surgeon requesting the prosthesis, or the hospital managing the procedure. If the clinician were to opt in to receiving the payment, the payment could be delivered directly to them as the decision-maker. This would be an appropriate solution, given the clinician would then have the ability and incentive to prudently manage both choice of prostheses and volume of prostheses in accordance with clinical necessity. The intent of this solution is to facilitate greater collaboration between hospitals and clinicians in addressing all levers that could generate value within this system. Over time, gain sharing arrangements may emerge to appropriately distribute value between clinicians and hospitals.
In many instances, it is expected clinicians will not choose to adopt management of the bundled payment. In these instances, the approach would be for hospitals to directly manage the bundle, with hospitals receiving the appropriate bundled reimbursement from payors and benefiting from any savings achieved through procurement-related efficiency. This model is depicted below.

38
EXHIBIT 23
Over time, it may become possible for clinicians to delegate management of the bundle to a broker, on their behalf. If this were in place, it would be expected that clinician participation in management of the bundle would improve.
Note that other alternatives, for example providing the bundled payment to the clinician in all instances, or directly providing bundled payments to the device manufacturer, were considered but deemed not suitable. For example, delivering bundled payments to manufacturers directly would potentially provide some incentive to reduce the ‘upsell’ of individual items (via device representatives), and would allow device manufacturers to immediately recoup rebates provided to the private hospital system, but would be unlikely to offer price transparency over time. Such a system could also not easily facilitate an outcomes-based reimbursement system.
6.2.4 Role of patient gap payments
Gap payments are seldom a feature in the current Prostheses List. In 2019, gap payments made up ~$2m, or 0.1%, of total prostheses spend44. It is proposed, in a bundled payment model, that gap payments be removed entirely to prevent out-of-pocket costs to consumers. Where prostheses costs exceed the bundled price, there would be three mechanisms in place to protect market participants:
■ If the prostheses have been assessed as clinically superior, they would attract premium pricing
■ If clinically necessary circumstances occurred that required increased prostheses costs, these would be covered by health funds with a system of accountability to ensure no misuse (further detail follows in Section 6.2.8)
44 Australian Prudential Regulation Authority. Private Health Insurance Prostheses Report. June 2020.
It is proposed the DRG-based payment would be offered to clinicians on an ‘opt in’ basis, or otherwise delivered directly to hospitals
ManufacturerManufacturer retains reasonable margins on top of cost of goods sold, based on competitive forces in each product segment
HospitalIf clinician ‘opts in’, hospitals may engage clinicians to share benefits, or to capture administrative fees. For clinician, collaboration may allow access to hospital’s buying power. For hospital, collaboration may allow procurement decisions to be made efficiently and support reduction in volume
ClinicianClinician may ‘opt in’ to support negotiation or volume management, and receive benefits, where they choose to be engaged in such a way
PayorDelivers DRG-based payment based on the procedure being nominated
HospitalIf clinician chooses not to ‘opt in’, hospital may handle DRG payment independently
Where clinician chooses to defer responsibility

39
■ If the case was clinically complex, this could attract a greater bundled payment defined by IHPA in certain circumstances (depending on the set-up of DRG codes to account for potential complexity).
The intention of the bundled payment model is to develop a bundled pricing arrangement that is appropriate based on public sector and international benchmarks, and that is then revised based on regular price disclosure and repeat benchmarking. Within this model, it is expected hospitals and clinicians will always (barring the circumstances noted above) have the ability to procure prostheses within the means of the bundled payment.
6.2.5 Determination of the minimum benefit amount
It is proposed that the initial prescription of a bundled reimbursement amount for the prostheses related to a procedure should be based on a combination of domestic benchmarking (versus public sector prostheses spend within each DRG) and international benchmarking (where available, focused on select comparable geographies such as New Zealand, France and the United Kingdom). It is anticipated that:
■ Domestic benchmarking could yield a ~30-35% decrease in costs (once non-prostheses have been excluded from the analysis), based on data currently published by IHPA45. This would capture a range of efficiencies currently achieved in the public sector, including on price, volume and mix of prostheses.
■ International benchmarking could also yield a ~30-50% (or greater) decrease in prostheses costs46, but would have some limitations in terms of exhaustively being able to develop an appropriate 1:1 match of the prostheses.
This reference pricing should be the foundation for pricing of the bundled payments, as opposed to any endeavours to use the current PL price list, given the current PL includes several irregularities and distortions which reform should seek to eliminate. It is anticipated the initial price set might not capture the entirety of the expected value, compared to benchmarks, but would be materially lower than the current private sector prosthesis costs.
An alternative approach is to determine the minimum benefit amount through centrally managed tendering, led by payors or by a national procurement body, similar to the process undertaken by PHARMAC in New Zealand47 or by state purchasing authorities in Australia (e.g., Health Purchasing Victoria). This could also enable development of national preferred supplier arrangements. However, this would likely require a significantly greater level of central organization, and the execution of preferred supplier or volume-based arrangements may impact upon clinician choice.
45 Weighted average incremental difference between public and private sector prostheses cost calculated per DRG code
(9.0). Using two data sources: 1) Department of Health, Private Hospital Data Bureau: Annual Report (2018-19), June 2019 and 2) IHPA, National Hospital Cost Data Collection Report, Public Sector, Round 22 (Financial year 2017-18), February 2020.
46 Evaluate. “The Prostheses List: Is it cost effective and what recommendations could improve its quality as a tool for reimbursement?”, March 2020. Unpublished.
47 PHARMAC, “Medicines and medical devices contract negotiation” https://pharmac.govt.nz/medicine-funding-and-supply/the-funding-process/medicines-and-medical-devices-contract-negotiation/, accessed: December 2020.

40
6.2.6 Price adjustment mechanism and frequency
When considering price adjustment, the Pharmaceutical Benefits Scheme provides a fair template for a successful model. In the PBS, once competition is enabled within the market (following patent expiry), price reduction is driven through a process of transparent price disclosure. Every six months, manufacturers must submit data on sales revenue (accounting for rebates), volume and incentives (e.g. bonus stock), and a price reduction occurs if the weighted average disclosed price is over 10% lower than the current PBS price48. This is summarised below.
EXHIBIT 24
The notion of using market cost data to adjust prices set by a central payor or regulator is not unique to pharmaceuticals. In the public sector, pricing of activity-based payments is also adjusted based on cost data.
It is therefore proposed that a mechanism be established to enable regular adjustment of bundled pricing. The key steps in this process would be:
1. IHPA would publish the base price for a bundled payment and maintain a clear definition of which items can be claimed as prostheses within this bundled payment (i.e. those that meet the definition of a prosthesis and relate to the indication).
2. Hospitals would negotiate with suppliers to procure prostheses at lower prices to reduce costs. New manufacturers may also enter the market at lower price, without requiring the previously defined 25% market share to do so.
3. In an annual cycle, data would be submitted to IHPA by both hospitals and device manufacturers on:
48 Pharmaceutical Benefits Scheme, “Expanded and Accelerated Price Disclosure (EAPD) - Frequently Asked Questions,” Available from: https://www.pbs.gov.au/pbs/industry/pricing/eapd/price-disclosure-faq, accessed: December 2020
Case example: in the PBS, it is transparency and competition that drives significant price decrease over time for generic molecules
Source: PBS publications
1.Anniversary Price Reductions2.Statutory Price Reduction (SPR) 3.Price Disclosure Cycles
85.581.2 81.2
20.415.6
12.6
0602 08
80
1410
70
12 16 2315 1801 20 2713 22 2824 26 300
10
20
190905
30
1711
40
50
60
90
100
04 2103 07 25 29
48.7
39.0
28.2
60.9
95.0 2) Generics enter market
3) Generics suppliers sell at lower prices to compete for market share
1) Patent expiry ~15-20 years after listing
10% F1 APR @10y
5% F1 APR @15y
25% F1 SPR2 on PBS listing of 1st
generic
PBS
list p
rice
(inde
xed
to 1
00)
Years from ethical product PBS listing
1st generic launch
5) Government adjusts PBS to reflect weighted average of suppliers prices
4) At 6 monthly cycles, suppliers disclose selling prices and volumes
6-monthly PDCs3
6) Can result in reductions in similar groups due to price linkages
ILLUSTRATIVE
Generic period (F2)Ethical period (F1)5% F1 APR1 @5y

41
Volume of components from prosthesis bundles used
Total price paid for components
Any rebates/bonus incentives offered
Items used within the bundle
It should be noted that PBS price disclosure cycles have been shortened in recent years to six monthly, in order to more efficiently facilitate price reduction. At this stage, an annual cycle may balance maximising the potential for price reduction and the feasibility of the system within existing IHPA infrastructure.
4. IHPA would leverage a weighted average calculation on cost of prostheses within the bundle to determine an appropriate price reduction. It is proposed that IHPA define and adjust the price difference threshold to ensure efficient pricing while creating sufficient ongoing incentive for hospitals to negotiate for savings.
In addition, fluctuations in domestic and international benchmarks could also be accounted for to adjust the price as appropriate.
The below exhibit demonstrates how this mechanism may operate for an illustrative prosthesis bundle, under two price difference threshold conditions.
EXHIBIT 25
6.2.7 Determination of incentives for Superior Clinical Performance
The current Prostheses List provides no financial incentive to select items that deliver superior clinical performance over the long-term. In fact, in some cases, items that attract higher reimbursement are known not to offer superior clinical performance. The priority of the proposed reform is to maintain quality of care and incentivise good clinical practice, and so a mechanism must be in place to provide additional incentive for choice of higher quality items where appropriate.
The price difference threshold for price reduction would directly determine hospital margins
2.0 2.0 2.0 2.0 2.0
7.8
5.0 5.0 4.6 4.6
0.2
2.0 1.4 1.9 1.3
20242322
9.0
2020 21
10.0
8.4 8.47.9
2.0 2.0 2.0 2.0 2.0
7.8
5.0 5.0 5.0 5.0
0.2
2.0 2.0 2.0 2.0
10.09.0
2020 2321 22 2024
9.0 9.0 9.0
Hospital + clinician COGSManufacturer
Illustration of price reduction with 20% price difference threshold, for bundle of $10k, Thousands ($)
Illustration of price reduction with 30% price difference threshold, for bundle of $10k, Thousands ($)
1. There may also be a mechanism of repeat public sector and/or international benchmarking to reduce costs
Adjustment to price
difference of 20%
Reduced value for hospitals
Hospitals renegotiate and reduce costs to re-
capture 22% of value again
2nd
adjustment to price
difference of 20%1
Current state
Hospitals achieve 2%
value through rebates
Initial price set with 10% price
reduction (to 9K)
Hospitals negotiate with suppliers to capture 20% of
value + maintain 2% rebates (total
22%)
Price maintained at 9K as difference between price paid by hospital (7K) and current price (9K) is not
more than 30%
Hospitals maintain 22% of value
Equivalent to model without ongoing price reduction mechanism
Current state
Hospitals achieve 2%
value through rebates
Initial price set with 10% price
reduction (to 9K)
Hospitals negotiate with suppliers to capture 20% of
value + maintain 2% rebates (total
22%)

42
To address this challenge, it is proposed that, particularly where clinical quality registry data exists, the Medical Services Advisory Committee, or an equivalent, provide support to IHPA in determining a modified bundled payment where a clinically superior prosthesis is chosen. This is achieved through HTA evaluation and this same mechanism could also be used to deliver a penalty reduction to the base payment when a clearly inferior prosthesis is chosen. This approach is depicted in the below exhibit.
EXHIBIT 26
MSAC could be an appropriate body to conduct this assessment, given it is clinically-led and has existing capabilities in Health Technology Assessment. It may, however, require additional resourcing for this purpose. In any case, having a central body, that is appropriately resourced and clinically led, assess which items require premiums and penalties, should allow for greater transparency on this assessment.
Importantly, this mechanism is designed to incentivise use of prostheses that genuinely improve clinical outcomes over the long-term. It is not intended to favour items that simply offer greater complexity or technological advancement, if that item does not alter long-term outcomes. The current proliferation of complex pricing based on ‘suffixes’ being added to items on the PL should be avoided. Complexity and innovation, if supported by surgeons, can still be favoured within the bundled price as would occur within any market. Should an item lack long-term outcomes data, this approach provides a further incentive to develop such data.
Altering the base payment is the most feasible, and potentially influential, mechanism to drive incentives. A range of other options were considered, ranging from retrospective outcomes-based payments, warranties and non-financial incentives such as requiring permission to select a clinically inferior prosthesis, and ongoing reporting of revision rates and complications. These are examined in the below exhibit.
A form of premium pricing, even in a DRG-based model, can drive longer-term clinical outcomes
1. Should not include drivers of short-term efficiency (e.g., reduced procedure time)
Assessment (MSAC or an equivalent) Outcome (IHPA)
MSAC assessment if requested, considering if robust and comparable evidence exists for long-term differences in clinical outcomes1
In some cases, sufficient evidence may exist
In other cases, registry-level data is required
Increase or decrease to base DRG payment
For all other prosthesis Product Groups
For Product Groups where registry-level data
exists to guide assessment of differential
clinical outcomes
Equivocal or insufficient data
Division into 3 catego-ries
MSAC assessment, leveraging registry data
Superior
Inferior
No change, but engagement with research institutes as appropriate
Increase to base DRG payment
No change to base DRG payment
Decrease to base DRG payment
Segment

43
EXHIBIT 27
More sophisticated outcomes-based payment models could form a future horizon. The previously mentioned OrthoChoice program in Sweden is a system of bundled payments with additional outcome-based reimbursement49. The model includes a 2-year “warranty” for common complications, and up to 3% of the payment is withheld and paid retroactively depending on patient-reported experience measures (e.g. patient pain assessments) and process measures (length of stay and waiting time). This system has been able to achieve a ~10-15% decrease in implant cost, ~17% decrease in per procedure cost and ~40% reduction in complications. This model is highly reliant on Sweden’s strong clinical registry data, including the first global joint replacement registry50.
The challenge with establishing outcomes-based payments in Australia is largely a practical one. Performance-based payments would require improved linked datasets following patient care, and potentially consideration of a range of other factors beyond the prosthesis. If follow-up is relatively short (e.g., three years), a retrospective payment, or even a warranty, would not necessarily capture the breadth of potential adverse events following a joint replacement, given ~70-75% of revisions occur after three years51.
Given these practical challenges, a nearer-term and easier to administer incentive has been favoured for the initial implementation of a DRG-based bundled payment model. In addition to this financial mechanism, there should be a requirement for patients to provide informed consent where an item that has been independently assessed as inferior is being used as part of a procedure. Of course, there may be clinical reasons why such items are valid in certain scenarios, and an informed consent process would simply allow those reasons to be made apparent to the patient.
49 Porter et al. OrthoChoice: Bundled Payments in the County of Stockholm. Harvard Business School. 9-714-515 50 Emilsson L. et al. “Review of 103 Swedish Healthcare Quality Registries,” Journal of Internal Medicine, 277(1), January
2015. 51 Australian Orthopaedic Association – National Joint Replacement Registry, “Hip, Knee & Shoulder Arthroplasty – Annual
Report 2020,” Available online, accessed: December 2020. Note this specific analysis examined revision rates for primary total knee replacement and primary total conventional hip replacement.
There are a range of models that could incentivise selection of the prostheses with best registry data
Potential to implement incentive to select superior prosthesis Potential to implement disincentive for selection of inferior prosthesis Preferred methods
Optio
ns to
ince
ntiv
ise
valu
e ba
sed
pros
thes
es
Procedure Lifetime90 days 3 years
Timing of payment reconciliation and reporting obligation
Assessment of complications, pain and satisfaction at 90 days
Assessment of complications, pain, satisfaction and improvement in function at 3 years
Performance (outcome-based) reimbursement –financial reward or penalty
Lifetime warranty for prosthesis with replacement at hospital cost
90 day warranty for prosthesis with replacement at hospital cost
3 year warranty for prosthesis with replacement at hospital cost
Warranty of prosthesis
Extra premium if selecting superior prosthesis OR payment reduction if inferior prosthesis
Base payment
Informed consent regarding prosthesis clinical data provided to patient, and permission required to select inferior prosthesis
Ongoing reporting of revision and/or mortality
Regular follow-up of outcomes within the post-procedure time period: including reporting of any complications, revision rates, infection rates
Non-financial incentives
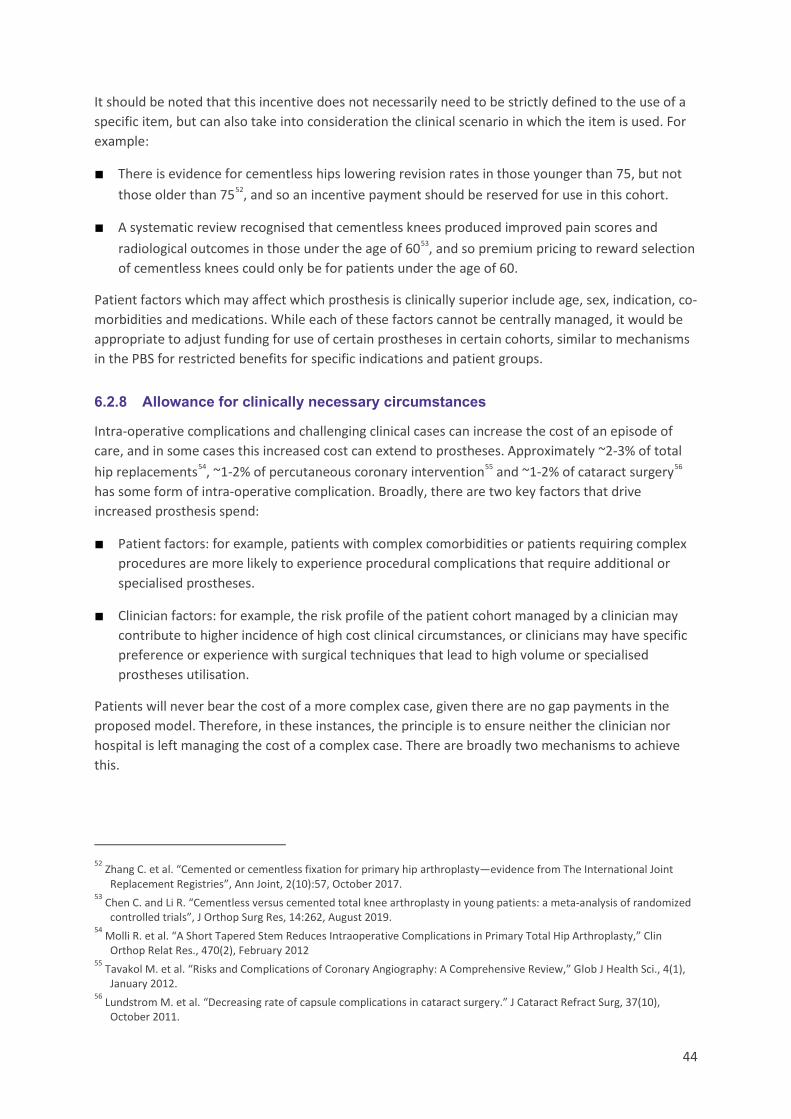
44
It should be noted that this incentive does not necessarily need to be strictly defined to the use of a specific item, but can also take into consideration the clinical scenario in which the item is used. For example:
■ There is evidence for cementless hips lowering revision rates in those younger than 75, but not those older than 7552, and so an incentive payment should be reserved for use in this cohort.
■ A systematic review recognised that cementless knees produced improved pain scores and radiological outcomes in those under the age of 6053, and so premium pricing to reward selection of cementless knees could only be for patients under the age of 60.
Patient factors which may affect which prosthesis is clinically superior include age, sex, indication, co-morbidities and medications. While each of these factors cannot be centrally managed, it would be appropriate to adjust funding for use of certain prostheses in certain cohorts, similar to mechanisms in the PBS for restricted benefits for specific indications and patient groups.
6.2.8 Allowance for clinically necessary circumstances
Intra-operative complications and challenging clinical cases can increase the cost of an episode of care, and in some cases this increased cost can extend to prostheses. Approximately ~2-3% of total hip replacements54, ~1-2% of percutaneous coronary intervention55 and ~1-2% of cataract surgery56 has some form of intra-operative complication. Broadly, there are two key factors that drive increased prosthesis spend:
■ Patient factors: for example, patients with complex comorbidities or patients requiring complex procedures are more likely to experience procedural complications that require additional or specialised prostheses.
■ Clinician factors: for example, the risk profile of the patient cohort managed by a clinician may contribute to higher incidence of high cost clinical circumstances, or clinicians may have specific preference or experience with surgical techniques that lead to high volume or specialised prostheses utilisation.
Patients will never bear the cost of a more complex case, given there are no gap payments in the proposed model. Therefore, in these instances, the principle is to ensure neither the clinician nor hospital is left managing the cost of a complex case. There are broadly two mechanisms to achieve this.
52 Zhang C. et al. “Cemented or cementless fixation for primary hip arthroplasty—evidence from The International Joint
Replacement Registries”, Ann Joint, 2(10):57, October 2017. 53 Chen C. and Li R. “Cementless versus cemented total knee arthroplasty in young patients: a meta-analysis of randomized
controlled trials”, J Orthop Surg Res, 14:262, August 2019. 54 Molli R. et al. “A Short Tapered Stem Reduces Intraoperative Complications in Primary Total Hip Arthroplasty,” Clin
Orthop Relat Res., 470(2), February 2012 55 Tavakol M. et al. “Risks and Complications of Coronary Angiography: A Comprehensive Review,” Glob J Health Sci., 4(1),
January 2012. 56 Lundstrom M. et al. “Decreasing rate of capsule complications in cataract surgery.” J Cataract Refract Surg, 37(10),
October 2011.
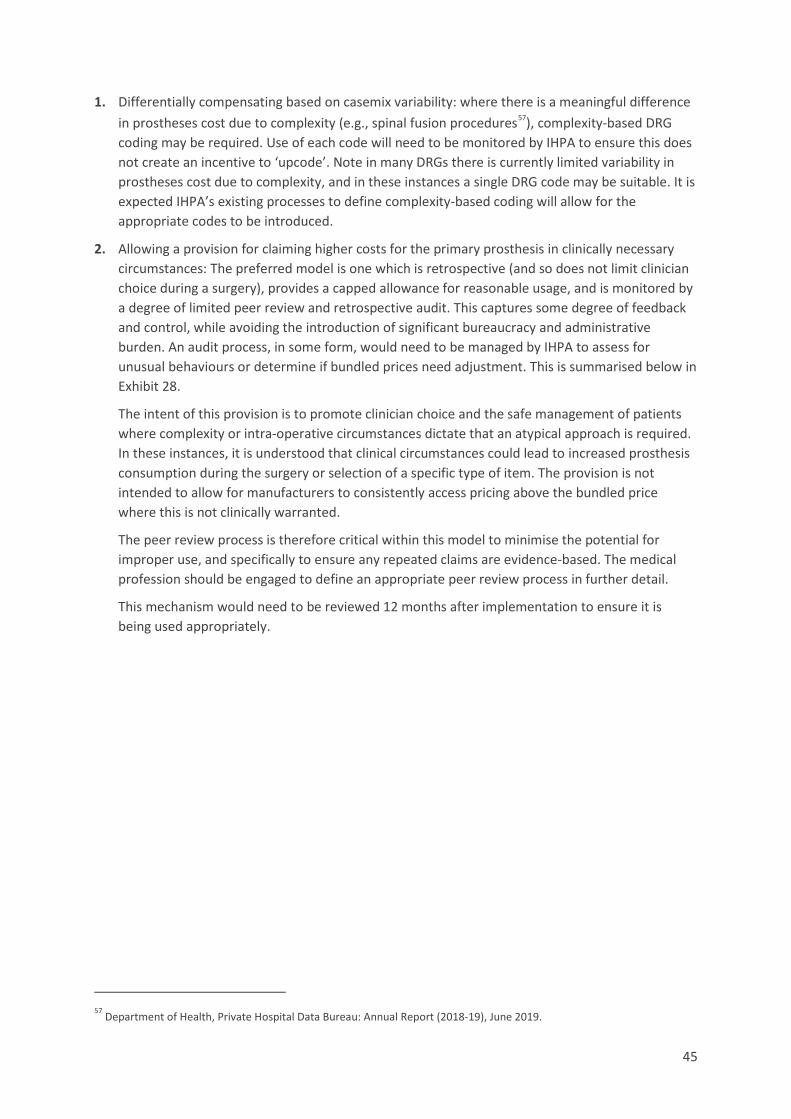
45
1. Differentially compensating based on casemix variability: where there is a meaningful difference in prostheses cost due to complexity (e.g., spinal fusion procedures57), complexity-based DRG coding may be required. Use of each code will need to be monitored by IHPA to ensure this does not create an incentive to ‘upcode’. Note in many DRGs there is currently limited variability in prostheses cost due to complexity, and in these instances a single DRG code may be suitable. It is expected IHPA’s existing processes to define complexity-based coding will allow for the appropriate codes to be introduced.
2. Allowing a provision for claiming higher costs for the primary prosthesis in clinically necessary circumstances: The preferred model is one which is retrospective (and so does not limit clinician choice during a surgery), provides a capped allowance for reasonable usage, and is monitored by a degree of limited peer review and retrospective audit. This captures some degree of feedback and control, while avoiding the introduction of significant bureaucracy and administrative burden. An audit process, in some form, would need to be managed by IHPA to assess for unusual behaviours or determine if bundled prices need adjustment. This is summarised below in Exhibit 28.
The intent of this provision is to promote clinician choice and the safe management of patients where complexity or intra-operative circumstances dictate that an atypical approach is required. In these instances, it is understood that clinical circumstances could lead to increased prosthesis consumption during the surgery or selection of a specific type of item. The provision is not intended to allow for manufacturers to consistently access pricing above the bundled price where this is not clinically warranted.
The peer review process is therefore critical within this model to minimise the potential for improper use, and specifically to ensure any repeated claims are evidence-based. The medical profession should be engaged to define an appropriate peer review process in further detail.
This mechanism would need to be reviewed 12 months after implementation to ensure it is being used appropriately.
57 Department of Health, Private Hospital Data Bureau: Annual Report (2018-19), June 2019.
46
EXHIBIT 28
The broader set of strategic options for provision of funding in clinically necessary circumstances is summarised below. An option that allows funding following limited review captures the best balance between allowing for flexibility and preventing misuse. A cap to the funded amount will likely be required to ensure items are not priced at unreasonably high amounts to take advantage of this mechanism.
EXHIBIT 29
6.3 CROSS-CUTTING CHANGES TO GOVERNANCE AND ADMINISTRATION
Three changes to governance and administration, outside of direct funding-related changes, will both enhance and streamline management of private sector reimbursement for prostheses.
It is proposed clinically necessary circumstances will be reimbursed by payors, with IHPA conducting regular audit to review payments
Procedure Review Reimbursement
1. This may be identified pre/intra-operatively
Clinician Due to clinical circumstances clinician requires high volume or specialisedprostheses that cost above DRG bundle minimum benefit amount1
Clinician required to document evidence-based rationale for additional cost
Peer review of clinical circumstance required
Payor Payor reviews peer authorisation and delivers capped additional payment to provider
Provider Provider (or clinician) receives payment for additional prostheses cost from payor
IHPA Pricing authority (e.g. IHPA) may conduct regular audit into occurrence of high cost clinical circumstances requiring additional payment. As part of this process, IHPA would consider potential for misuse and adjust cap to stop-loss payment as required
Across a spectrum of accountability and funding flexibility, there are a range of strategic options to address high cost clinical circumstances
Acco
unta
bilit
y
Cycl
ical
aud
itFo
rmal
revi
ewea
ch a
pplic
atio
nLi
mite
d re
view
Capped funding for high cost clinical circumstances, requiring no approval. Cyclical audit implemented to review cases where this additional amount was
claimed.
No cap on prostheses funded and cyclical audit implemented
No additional funding in any circumstance – cyclical audit (e.g. 12 monthly) implemented to enable
adjustment of bundled amounts where required
N/A
N/A
No cap on prostheses fundedLimited post-procedure peer review required to
receive additional payment and cyclical audit used to review payment shifts
Capped funding for high cost clinical circumstancesLimited post-procedure peer review required to
receive additional payment and cyclical audit used to review payment shifts
Capped funding for high cost clinical circumstances – formal application required to access additional
payment and cyclical audit implemented
No cap on prostheses funded – formal application required to access additional payment and cyclical
audit implemented
Several strategic options exist on a continuum of accountability and flexibility
No capCapped funding
Funding flexibility
No additional funding
Preferred solution

47
6.3.1 Governance
As depicted in Exhibit 30, PLAC currently plays several important roles in the management of an ~11,000 item Prostheses List. Following implementation of a bundled pricing model, a detailed pricing list for prostheses will no longer be required. Hospitals would be able to use TGA-approved prostheses within the bundled payment received for a procedure, irrespective of positioning on a list.
The only role for an ongoing simplified list would be to clearly define what should be included within the DRG-based prosthesis bundle, and specifically making it clear which product types should not be considered prostheses for the purposes of IHPA’s cost data collection (e.g., to ensure haemostats and other non-prostheses are not being considered as part of the bundled cost of prostheses for the procedure).
In the future state, many of PLAC’s roles will therefore become redundant (for example, needing to review individual sponsor applications for inclusion in the List) while others will remain in place but can be managed through other existing bodies (e.g., the Prostheses Section Secretariat in the Department could manage referrals to MSAC where required). This reduces the need for an intermediary administrative body. Furthermore, expansion of PLAC to adopt new roles would result in significantly increased requirements for its funding, in comparison of absorption of these roles into existing Government bodies.
EXHIBIT 30
6.3.2 Mechanism for clinical input and HTA
The mechanism for clinical advice can similarly be streamlined, as well as based on more robust HTA principles, in the new model. The following exhibit demonstrates the shift from the current system, whereby PLAC refers TGA approved devices to Clinical Advisory Groups for assessment, to a future state where TGA approved prostheses are assessed by MSAC, or an equivalent clinically-led body, where there is a case to be made for adjustment to the bundled payment based on high quality evidence of long-term clinical outcomes. This reduces waiting time for device sponsors and prevents
There would not necessarily be an ongoing role for PLAC in managing additions or removals to the PL
Required in new modelTGA registration enforces safety of device and permits inclusion of prosthesis in DRG bundle – removes waiting period for devices to enter market
Reviews sponsor application to ensure suitability for inclusion in prosthesis list
Applications can be immediately referred by Prosthesis Section secretariat
Referral of sponsor applications to MSAC
TGA evaluation includes assessment of clinical safety – only sponsors wishing to apply for premium pricing must undergo another evaluation
Routine referral of all sponsor applications to clinical advisory groups
MSAC evaluation occurs only if sponsors want to apply for premium pricing – sponsors will be aware of evidence requirements to justify clinical superiority
Liaise with sponsor to request further evidence and allow comments during CAG and/or MSAC applications
Through analysis of centralised utilisation data, registries, TGA complaints databases and other sources, TGA can recommend withdrawing TGA approval – no further list review required
Manage removals of prostheses from PL
Prosthesis Section secretariat can provide recommendations to Minister
Communicate recommendations to Minister
Current PLAC function Rationale for substitution of PLAC role

48
duplication of processes. For example, this means sponsors will no longer need to provide further evidence on safety and efficacy for a device that has already been TGA approved.
EXHIBIT 31
In order for MSAC, or an equivalent, to appropriately undertake value-based assessment, expanded clinical quality registries are required, to allow direct comparison of prostheses using long-term outcomes data. Other markets globally have substantially more advanced registry data (for example, Sweden, which now has over 100 clinical registries58). In Australia, examples include the National Joint Replacement Registry (established in 1999), the Breast Device Registry based at Monash University, and the national Cardiac Devices Registry under ACOR and SAHMRI.
Establishment of the NJRR has proven to be successful in guiding clinical practice, with an estimated savings of $600m from 2004 and 2014 due to reduced revision rates59. However, there is limited evidence of clinical superiority of prostheses in other areas. It is therefore proposed that further investment be made in expanding the role of clinical quality registries, particularly for high volume, high price or high-risk prostheses. This would enable not only more informed decision making for clinicians and patients, but would deliver further cost efficiency as premium pricing can be aligned to evidence-based outcome measures.
6.3.3 Level of supply chain transparency
Finally, one of the challenges within the existing PL has been a distinct lack of transparency, even to PLAC. This has created an environment in which it is challenging to know the true value of goods being supplied (given the opacity of rebates being offered to hospitals) and even the exact items
58 Emilsson L. et al. “Review of 103 Swedish Healthcare Quality Registries,” Journal of Internal Medicine, 277(1), January
2015. 59 As noted in Australian Orthopaedic Association – National Joint Replacement Registry, “Reimbursement for clinical
performance joint replacement surgery in Australia,” https://www.arcs.com.au/documents/item/818, accessed: December 2020
MSAC, or an equivalent, could play a role in clinical assessment and HTA, with a view to defining where premiums are required to incentive long-term clinical outcomes
PLAC forwards to Clinical Advisory Groups (CAGs) for assessment
If no CAGs, Panel of Clinical Experts perform assessment
TGA grants approvalManufacturer applies for inclusion on
Prostheses List
MSAC may be required to provide additional input
Recommendation provided to Minister Recommendation provided to Minister
TGA grants approval
MSAC1 required to perform HTA and/or SCP evaluation to assess evidence of long-term
clinical outcomes
Manufacturer applies for premium pricing
Current system New model
1. Or an equivalent

49
being billed, given the lack of clarity on Product Code and GTIN60 matching to Prostheses List billing codes. This is in stark contrast to the PBS price disclosure system where rebates and bonuses are reflected in price reductions.
To enable better management of prostheses reimbursement in future, the following areas of transparency will be critical:
Description of issue Governance proposed
Total price and volume, including discounts or rebates
Rebate agreements between hospitals and manufacturers are currently confidential and are not reflected in prostheses pricing
IHPA establishes central data reporting system to which hospitals must annually disclose price and volume data.
Details on items used Billing codes currently deliver insufficient detail, in some instances, to define which item was used in a procedure. In the future state, there is a risk this becomes more opaque once an item-specific list for billing is removed
IHPA requires hospitals to submit sufficient information on the items procured within a bundle to at least determine 1) whether a clinically superior prosthesis was used, and 2) whether any non-prostheses costs are inadvertently being included in the bundled payments
Items should therefore be mapped to an MBS and DRG code, to allow for monitoring of off label use.
Clinical rationale for selection of higher priced devices
No financial incentive for hospitals and clinicians to select cost effective devices
No current HTA process in determining pricing
Clinically necessary circumstances need to be retrospectively peer reviewed
Use of clinically superior devices will be rewarded based on HTA by MSAC, and hospitals and clinicians may then choose to select these superior devices to optimise value within the bundled reimbursement
Other areas where transparency is lacking may be more challenging to eliminate, but can be managed in the proposed model. Non-cash incentives are currently provided to hospitals from manufacturers, with no transparent quantification. In a bundled model, these services, such as clinical guidance in theatre by device representatives, and maintenance of inventories, should be minimum requirements which are included with the supply of the device. Similarly, clinicians sometimes receive benefits in kind from device manufacturers. In a bundled model, these services
60 Global Trade Item Number

50
would sit outside the reported cost. If, for any reason, these costs are considered relevant to the bundled payment, they will need to be disclosed clearly.

51
7 Proposed roadmap to deliver reforms
7.1 PHASED IMPLEMENTATION PLAN
The implementation of proposed prostheses reform consists of three primary components:
■ Solution design: completion of the design of the funding model and associated governance, including building alignment with relevant stakeholders
■ Technical implementation: implementation of the core capabilities and processes required to set-up and sustain a transition to a DRG-based funding model
■ Reform roll-out: implementation of the reform itself, including removal of items from the PL and a transition to bundled pricing.
A phased implementation plan is required across these components in order to balance the need to deliver value to citizens rapidly, and the need to manage a sustainable transition to a new funding model. With these factors in mind, the below exhibit outlines the proposed sequencing of these components over a 24-month period, from January 2021 to December 2022, with implementation of reform itself commencing in January 2022 as the MTAA Agreement concludes.

52
EXHIBIT 32
Further detail on each component of the phased implementation plan follows in the remainder of this section.
7.1.1 Solution design
Solution design is required to finalise the proposed prostheses funding model. Completing solution design will likely require the formation of a Government Taskforce with a clear mandate. It is critical that this Prostheses List Taskforce is clinician-led with a focus on performing an accelerated review of the prostheses landscape and delivering an overarching reform strategy – this process is expected to take ~6 months.
It is anticipated there are six key steps that a Taskforce will undertake to complete solution design:
1. Define terms of reference
2. Establish working groups and clinical committees: A prostheses list Taskforce should be clinician-led with involvement of relevant stakeholders (e.g. economists, policy-makers) –
A two year roadmap is proposed to implement change
2021 2022 2023
Q1 Q2 Q3 Q4 Q1 Q2 Q3 Q4 Q1 Q2
Second price adjustment
Complete domestic and international benchmarking
Hip
Establish core working groups
Implement review process for high cost circumstance claims
Price adjustment
All DRGs transitioned
Enact legislative changes
Specialist orthopaedic
All DRGs transitioned
First round of reviews
All DRGs transitioned
Establish Principles & Rules committee
Spine
Public consultation
All DRGs transitioned
All DRGs transitioned
Set-up task force
Ophthalmic
Pilot data feeds between key stakeholders
Transition governance to IHPA
All DRGs transitioned
Full transition of PL admin from PLAC
Neurosurgical
Set-up data feeds and technology enablers
Calendar year
Legislative changes required to amend PL
Deadline for PL item removal
All DRGs transitionedVascular
Solution design complete and signed off
First price adjustment based on benchmarks
All DRGs transitionedPlastics and Reconstructive
Develop HTA and re-segmentation process
Removal of items from PL
Develop repricing process
Set-up integration with PL
Pilot price disclosure mechanism
Urogenital
Parallel maintenance of current PL
All DRGs transitioned
First round of price disclosure
Develop new listing process
Ear, Nose & Throat
Cardiac
Cardiothoracic
Develop prosthesis-specific benefit calculation
Activity
Set-up of process
All DRGs transitioned
Selection of first DRGs for transition
Knee
Deliver recommendations to Department of Health
DRG selection and matching
Compile report
All DRGs transitioned
All DRGs transitioned
Solution design
Technical implement-ation
Commence DRG transition
F01BF12B,F24B,Priority DRG codes:
I04BI32B,Priority DRG codes:
I33BI33A,Priority DRG codes:
I09BI01B,I05B,I16Z,Priority DRG codes:
I09CI10B,B03C,I06Z,Priority DRG codes:
C16ZPriority DRG codes:
F04CPriority DRG codes:

53
working groups and clinical committees should address core design choice questions and include consideration of technical implementation.
3. Establish Principles & Rules committees: A Principles & Rules committee will be responsible for reviewing and driving change where necessary within the legislative and regulatory framework underpinning the Prostheses List.
4. Delivery of interim advice
5. Public consultation: Taskforce seeks feedback from key stakeholder groups (e.g., MTAA, APHA, IHPA) to test and refine interim advice and compile final report.
6. Deliver final recommendation: Taskforce delivers final recommendation with input from public consultation process – final report delivered to Department of Health for review and deployment.
The solution design process should answer a range of key questions regarding how the PL should be managed and the proposed funding model – the following table outlines a series of questions that it is recommended the taskforce cover. Many of these questions have been addressed in this report, but it is understood that additional detail and stakeholder consultation may be required.
Question Design choice Activity
What should be regulated within the PL?
Which items are to be removed from the PL?
Define segmentation and inclusion criteria for PL
Confirm items for removal from the PL
Identify high priority PL items that should be prioritised for removal
What is the most appropriate funding archetype?
How are payments structured?
Define mechanism of transition process to new model (e.g., what is the mapping process and how should this be prioritised?)
What mechanism should be used for setting the minimum benefit amount?
Define price setting mechanism (e.g., public sector/international benchmark) and data required
What is the cadence and mechanism of price adjustment (e.g., price disclosure mechanism)?
Determine frequency of price adjustment
Determine the acceptable price difference to consider in price disclosure mechanism
Define mechanism for price adjustment (e.g., price disclosure mechanism, repeat benchmarking)
What is the role of premium pricing to support improved clinical outcomes?
Determine clinical criteria for superior clinical performance (e.g., revision rate, peer benchmarking)
Define pathways to access premium pricing (e.g., via MSAC or an equivalent)
Determine amount of base payment adjustment required to incentivise choice

54
Determine if additional clinical outcomes registries are required and how they can be set-up/funded
What is the approach to managing clinically necessary circumstances requiring higher prostheses spend?
Define range of procedure types/clinical circumstances that require stop-loss mechanism
Define additional payment mechanism for clinically necessary circumstances
Determine review processes that should be implemented
7.1.2 Technical implementation plan
It is expected the technical implementation phase will be largely led by IHPA, and the below summary contains only a high-level perspective on the components this may contain. This plan should be further developed as a critical component of solution design and commence when there is clear alignment on the proposed prostheses funding model.
Broadly, the technical implementation plan should focus on establishing required processes and infrastructure to achieve two key objectives:
1. Establish the new model 2. Ensure the new model is sustainable
Within each objective, there are several technical streams to address – successfully executing each stream may be limited by availability of resources and capacity:
Objective Stream Description Owner
Critical path to establish new model
DRG selection and matching
Technical selection and adjustment of DRGs to ensure fit for purpose. Includes matching DRGs to items on the PL and to MBS codes. IHPA will need to develop a capability in using item-level information submitted by hospitals to assess whether the prosthesis bundle has been used appropriately, and to ensure non-prostheses or ‘off label’ items have not been included in the costing data. This would rely on the proposed mapping of prostheses to MBS codes and DRG codes.
IHPA
Data stream establishment
Development of technological capabilities required to ingest and process data from various stakeholders (including cost and activity data)
As part of establishing a data framework for this reform, the potential use of broader clinical datasets to guide future outcomes-
IHPA

55
based reimbursement should also be considered.
Calculation methodology
Establishment of methodology to deliver policy objectives through initial scoping of DRG benefit and calculation of DRG benefit
IHPA
Benchmarking
Identification of suitable domestic and international comparators to conduct price referencing
IHPA and PLAC
Integration
Integration of bundled model with existing PL mechanism, to enable transition where a phased implementation plan is required
IHPA and MSAC
Governance
Establishment of relevant governance, including the role of MSAC, to support the new model and transition of PL admin from PLAC to IHPA
IHPA and PLAC
Set-up for sustainability of new model
Listing process
Establishment of ongoing process for integrating new items or Product Groups into the bundled DRG price
IHPA and TGA
Re-pricing process
Establishment of mechanism to adjust DRG benefit over time based on price disclosure and repeat reference pricing, commencing with an initial pilot to trial data collection, calculation, dispute resolution and implementation
IHPA
Segmentation process
Establishment of periodic process to refresh segmentation, either to identify new segments or reclassify Product Groups where additional clinical outcomes data is available – requires set-up of HTA process
IHPA and MSAC
Clinically necessary circumstances process
Establishment of a mechanism to audit stop-loss payments and revise capped amount as required
IHPA
In many cases there will be challenges establishing these mechanisms (e.g., on data streams: there may be a lack of robust data collection in place, lack of transparency in device manufacturer reporting, or inability to link outcomes to prostheses). A path forward in these instances may include developing a Minimum Viable Product over time with a subset of items or hospitals, to define a data strategy and to determine if there are any broader funding requirements.
Similar processes should be undertaken across all technical streams to deliver the capabilities and infrastructure required to execute reform.

56
7.1.3 Roll-out of key changes
The sequencing of reform roll-out reflects a deliberate trade-off between disruption (across the value-chain and considering feasibility challenges) and system outcomes. A phased roll-out plan enables high-value shifts to occur in the short-term without significant disruption to the broader system. Furthermore, it prevents newly established processes and infrastructure from being overwhelmed while a sustainable transition to a new funding model takes place.
There are three primary components of reform roll-out
■ Removal of items from PL: High-volume non-prostheses should be prioritised for a 1st wave of PL item removal – this could account for ~50% of items to be removed. All other remaining non-prostheses should be removed in a 2nd wave. This should be completed as soon as practical, particularly if captured as part of the recommendations of the Department’s General & Miscellaneous Category Review. At the latest, both waves of PL item removal should occur before February 2022, or as soon as permitted under the MTAA agreement.
■ Price adjustment: Pricing adjustments are the core driver behind value-pool shifts affecting key stakeholders, in particular device manufacturers and providers. An extended pause between 1st and 2nd price adjustments may increase sustainability of transition to the new funding model and support stakeholders in accommodating initial and future funding shifts. Future price adjustments should continue on a 12-monthly basis. The following is therefore proposed:
1st price adjustment by February 2022, or as soon as permitted under the MTAA agreement
2nd price adjustment after Q1 2024
Annual price adjustments thereafter
■ Transition of PL items to DRG model: PL categories that represent a high proportion of total PL value (e.g. hip, knee, ophthalmic, cardiac) should be mapped to DRG-codes first – ~45% of PL value can be captured by 12 DRG codes61, suggesting that significant value can be transitioned in the short-term. The following is proposed:
Items with registry-level data transition to DRG payments between Q1 2022 and Q3 2022, commencing with highest value DRGs (hip, knee)
Items without registry-level data transition to DRG payments between Q1 2022 and Q1 2023, commencing with highest value DRGs (cardiac)
Across these three components, the PL should be maintained in parallel until all items PL items are transitioned to DRG-based model. 12-18 months following commencement of implementation, design choices should be reviewed with a view to identifying areas of improvement in the model (e.g., the role of HTA in determining premiums or penalties, or the use of the provision for clinically necessary circumstances, should be reviewed).
61 Analysis completed using Hospital Casemix Protocol-1 (HCP1), Prosthesis Utilisation Report, December 2020. Proprietary
data, unpublished; and Department of Health, Private Hospital Data Bureau: Annual Report (2018-19), June 2019.

57
7.2 EVOLUTION OF VALUE CHAIN IMPACTS
It has been estimated that, with removal of non-prostheses from the PL and delivery of an immediate average 30% reduction in price for prostheses, the total benefit to consumers from change to the PL could be in the range of ~$860m compared to the total FY20 spend of ~$2.1bn. The proposed reform only seeks to capture ~$508m of this potential value, and limits impact by means of a smaller immediate price reduction (10%) and a more gradual transition towards the end state. This is a considered choice designed to reduce disruption within the value chain.
The relative change the reforms are likely to deliver over time, versus momentum, is depicted in the exhibit below. As shown, by 2025 it is expected the reforms would deliver a significant amount of value to consumers. The reforms would also be a net positive to hospitals and clinicians, who will benefit from the ability to negotiate directly with device manufacturers within the DRG bundle. While hospitals would initially face increased costs from the immediate removal of items from the PL, it is expected by capturing ~20% of the DRG bundle value, the hospital sector would recoup this increased cost. These value shifts occur at the expense of device manufacturers, but it should be noted that the reforms create a competitive market environment in which some manufacturers will have greater opportunity to gain market share, particularly if armed with a strong product or pricing capability.
EXHIBIT 33
The above assumes non-prostheses are removed from the PL on January 2022, which is the latest date by which this activity should occur. Considering the expected growth of this segment, if removal was accelerated and occurred in June 2021, an additional ~$160m of value could flow to consumers.
Similarly, the above assumes that transition to a DRG-based bundled payment for prostheses commences in January 2022. A one-year delay (to January 2023) to this change could lead to the cumulative loss of ~$210m of value to consumers by FY25.
Deep dive: Hospital provider impact
The phased implementation plan will stagger shifts in the value chain over time
20
278565
-36
1
-67
FY23FY22
-196
16
-17
8 5
-591-542
638
130
-746
-42
FY24
679
13921
-790
-49
FY25
508
104
-37
FY25 in FY20 terms2
Value shifts relative to momentum as a result of first order changes, A$mConsumers (incl. relative reduction in premiums) Hospitals Clinicians COGS1Manufacturer gross margin
1. COGS reduction as a result of reduced volume growth2. Calculated by adjusting the observed impact in FY25 based on the size of the PL in FY20 ($2.1bn) vs the total size of the PL in the momentum case in FY25 (~$2.8bn)3. It is assumed in the process of this shift, the incentive to reduce cost would trigger a 40% reduction in volume (reversing many of the increases in recent years) and at least
20% reduction in price paid per item, and that volume growth would be slowed over the long-term4. Based on observed benefits achieved overseas; rebates not publicly disclosed – assumed to be 2%
Key assumptions include:
Non-prostheses items: shift from the PL completed by FY23, with cost absorbed by private hospitals3
Prostheses: initial 10% price reduction for items as they are transitioned to a DRG based model over FY22-24
Private hospital margins: able to ramp up to a ~20% margin on prostheses, however no longer receive rebates4 on items in DRG bundles
Clinicians: increasingly opt-in to share benefits of DRG model, collectively capturing ~5% of total available benefit in FY24+

58
The impact on hospitals has been specifically considered, with a view to ensuring the reform is sustainable. In the proposed reform model, hospital providers face the potential downside risk of absorbing the cost of non-prostheses. They also face substantial upside potential through the ability to negotiate margins on prostheses within the bundled payment amount. While, over time, it is expected the upside potential would exceed the downside risk, the relative ease of removing non-prostheses from the List means the negative impact is expected to occur first, as shown in the below Exhibit.
EXHIBIT 34
Providers will be able to mitigate the potential downside in three ways:
■ By more prudently managing volume: it is expected hospitals could deliver a 40% reduction in volume of these items, given usage has been growing at 11% p.a. and given hospitals have, prior to this reform, not had an incentive to control the volume of consumables on the PL
■ By negotiating on price: it is further expected hospitals would be able to derive procurement efficiencies from manufacturers, who currently face no price-based competitive market forces
■ By negotiating with payors: it is expected providers and payors would naturally enter negotiations to discuss distribution of the cost
The first two mechanisms are included on the Exhibit depicted above. The third is the focus for the remainder of this section.
The cost of consumables is typically reimbursed by payors as part of hospital accommodation and theatre fees, but it is acknowledged that, from a provider perspective, removal of non-prostheses from the PL will drive a material short-term earnings impact. There are a range of plausible options to insulate providers. The ideal solution would provide financial support to providers while still generating sufficient incentive to reduce clinically unnecessary utilisation of non-prostheses, and to negotiate with device manufacturers on price. The ideal option would also limit disruption to the broader prostheses reform. Within this context, three mechanisms were considered:
Despite facing the negative impact of removing non-prostheses from the PL, providers are still expected to be net positive by FY23
205
-128
FY 23
338
61
FY 22
-197 -208
FY 24
357
-218
FY 25
139
-67
8
130
Prostheses impactNon-prostheses impact
Value shift relative to momentum for providers – aggregate vs. impact of non-prostheses removal, A$m
Non-prostheses impact:
Items removed from PL in FY22 (~50% of impact captured within FY22, and remainder in FY23). This shifts costs to hospitals, but also provides incentive for up-front and ongoing price and volume reduction1
Assumptions
Prostheses impact:
Upfront price reduction: 10% price reduction applied as items are transitioned to DRG model over FY22-24
Hospitals assumed to be able to reach a 20% margin on prostheses by FY25
No secondary price adjustment assumed
1. Assumes ~40% reduction in volume-per-procedure and ~20% reduction in price by FY25 vs. the momentum case (where volume-per-procedure growth continues, albeit at rates lower than current growth)
59
■ A market-based solution: whereby providers would be insulated through renegotiation of contracts with individual health funds.
■ A transitional safety net: whereby short-term support is prospectively offered to providers as a bridge towards their being able to establish stronger procurement capability and conduct contract renegotiations.
■ A retrospective compensation schedule: which would require part of the actual non-prostheses spend incurred by providers to be reimbursed in the first 1-2 years, again with the intent of supporting providers with the initial transition.
Within these options, the market-based solution is most likely to yield an appropriate long-term outcome. It is also the most feasible, given it would occur within existing contract structures. Market-based solutions may even put providers at an advantage, given payors will not have clear visibility on the efficiencies providers have been able to achieve through volume and price reduction, and given the second-tier default system will ensure smaller providers also benefit from negotiations.
The challenge of a market-based solution, however, is that it could require years to come into effect. As shown previously in Exhibit 34, the downside risk for providers is highest in the first year of the reform, after which it is expected providers will be net positive even without additional compensation. To help mitigate this short-term risk, it is proposed that payors would establish a one-year transitional provider safety net to enable a cash positive transition towards the future state. This provider safety net would be a pre-defined proportion of current spend on non-prostheses and could be allocated to providers based on expected impact.
The potential impact of the one-year transitional safety net compensating providers is shown in the Exhibit below. Note that the level of compensation shown is illustrative and does not represent an agreed amount. Furthermore, it would be expected that delivery of the safety net will be accompanied by transparent reporting of actual non-prosthesis spend in the year the safety net is in place. The intent, nevertheless, would be to smoothen the impact on providers over time, particularly when the DRG bundled payment models are still in the process of being ramped up. Of course, this does directly impact the value accrued to consumers, which would commensurately decrease.

60
EXHIBIT 35
With this mechanism in place, the reforms will clearly signal a material and sustainable shift in value from device manufacturers to the Australian patient, consumer and taxpayer.
7.3 RISKS FOR CONSIDERATION
There are a number of risks associated with various components of proposed reform that merit acknowledgement and response.
Two primary categories of risk have been considered:
■ Implementation risk: Risk relating to the ability to implement proposed reform in a timely and cost-effective manner.
■ Post-implementation risk: Risk relating to potential stakeholder and industry consequences of proposed reform.
These risks are summarised in the below tables
Table: Implementation Risks
Category Risk Response
Feasibility
Development of technological capabilities needed to support data management requires outsized time and cost investment
Existing systems are in place between IHPA and public/private providers to support centralised price setting – solution design should also include specific working group to evaluate time and cost of developing necessary system capabilities
A short-term safety net would address immediate downside risk for providers
-128
61
67
205
FY 25FY 22
-197
FY 23
338
-208
FY 24
357
130
-218
0
8
139
Impact of compensation on value-shift relative to momentum – provider, A$m
Transitional safety net Market-based compensation: exact outcome would depend on contract negotiations
SPECIFIC COMPENSATION AMOUNTS ARE ILLUSTRATIVE
Positive impact from negotiating margins on bundled prosthesis payments Negative impact from removal of non-prostheses from the PL Payor compensation

61
Existing DRG codes do not capture range of procedural episodes and PL items required
A large proportion of PL value maps to a small range of DRG codes62 – additional DRG codes may need to be created to match long-tail of PL items but, in most cases, will be a lower priority
Public sector reference pricing does not sufficiently capture mix of procedures in private sector
A large proportion of PL value exists in procedures/prostheses that map sufficiently to public sector references (e.g. hip/knee/cardiac)63. Where public sector mix of prostheses within a procedure differs markedly from the private sector, consideration needs to be given as to whether differences in prostheses choice in the private sector is truly driving improved patient outcomes.
Table: Post-Implementation risks
Category Risk Response
Structure of payments
DRG bundle pricing incentivizes low-cost prostheses choice which may lead to poorer clinical outcomes
Firstly, the main driver of choice of prosthesis for a surgery will remain the surgeon, which will help protect patient interests and will support clinical outcomes.
Secondly, the proposed premium payment mechanism encourages use of prostheses with strong clinical performance where HTA suggests this is the case.
In any case, the expected DRG minimum benefit amount will remain comparable with healthcare systems in developed nations, where similar mechanisms are in place.
62 Analysis completed using Hospital Casemix Protocol-1 (HCP1), Prosthesis Utilisation Report, December 2020. Proprietary
data, unpublished; and Department of Health, Private Hospital Data Bureau: Annual Report (2018-19), June 2019. 63 From comparison of two data sources: 1) Department of Health, Private Hospital Data Bureau: Annual Report (2018-19),
June 2019 and 2) IHPA, National Hospital Cost Data Collection Report, Public Sector, Round 22 (Financial year 2017-18), February 2020

62
Providers are unable to negotiate lower prostheses prices due to low purchasing power or limited choice of product
Most of the highest value prosthesis Product Groups have greater than three active sponsors64, which will likely drive competition in the market. In addition, the proposed model could facilitate gain sharing arrangements with clinicians, which would enable providers to more effectively collaborate with clinicians in order to realise value.
While smaller hospitals may find price negotiation challenging, they can still expect to achieve significant savings by altering product mix and volume. In addition, there could be opportunities for smaller hospitals to organise into Group Purchasing Organisations, as has occurred overseas.
Transition to new payment model may disrupt delivery of clinical services in the short-term as new procurement models are established and negotiations between providers and manufacturers take place
Phased reform roll-out should promote a sustainable transition to new funding model, and ensure there will not be a disruption to clinical services.
DRG minimum benefit
Device manufacturers leave the Australian market due to unattractive pricing – particularly small and specialised manufacturers
Manufacturers have not left markets with similar market structures and low prostheses prices (e.g., NZ, NHS) suggesting low likelihood of occurrence. Furthermore, major pharmaceutical manufacturers have remained in Australia after significant reforms placing downward pressure on the cost of medicines. Competitive pricing may in fact increase utilisation efficient manufacturers that can optimise clinical outcomes
Further discussed below
64 Australian Government Department of Health. Prostheses List. November 2020. Available from:
www.health.gov.au/resources/publications/prostheses-list

63
Non-prostheses costs are included in the bundled price
Price disclosure mechanism should require itemised listing of prostheses used as part of bundle – this will allow IHPA to make informed price adjustments
Providers do not support or are unable to deliver payment transparency (this also extends to circumstances in which providers are offered in-kind benefits outside of the prosthesis bundle, versus a discount on prostheses prices)
In the proposed model, price adjustment can occur on the basis of either a) price disclosure or b) repeat reference pricing. In the event that price disclosure is not effective, reference pricing could still facilitate system price adjustments
Incentives relative to minimum benefit
Premium pricing pathways are insufficient to promote prostheses innovation
Pathways to additional payment (e.g., MSAC) can be optimised, with options available to both increase and decrease premiums and penalties
A practice of ‘up-coding’ episodes of care to claim additional payment occurs
The minimum benefit of DRG should be set at a reasonable price to reduce incentive to up-code. Audit process (e.g., comparing peer hospitals, and comparing private versus public sector, and other existing processes) can be implemented to review appropriateness of DRG coding
One risk bears further discussion: the risk of manufacturers exiting the Australian market following reform to the PL, therefore reducing access to medical devices for Australians. While this risk has been raised in the past when PL reform has been considered, it is deemed to be low likelihood, for two primary reasons:
■ Firstly, manufacturers are present in the region (e.g., in New Zealand, South Korea, Japan) despite lower prostheses prices, more geographic complexity, and similar models of healthcare delivery. It is unlikely that the DRG minimum benefit amount will be set at a level that prevents manufacturers from achieving similar margins to these markets.
■ Secondly, by introducing competition to the market, proposed reforms may improve the ability of efficient manufacturers or those producing effective older products to compete. Currently PL pricing is anti-competitive – there is no opportunity for market entrants to compete on price without first possessing 25% market share, and even then, applying for a change to prosthesis pricing alters the price set for the entire Product Group. This confers no advantage to a manufacturer willing to compete on price.
In a bundled model, the value proposition of more specialised device manufacturers that produce niche prostheses will be unaffected, as clinicians will retain the ability to choose such products. Novel

64
technologies would also still have an opportunity to grow share in the Australian market, through three mechanisms:
■ Procurement within the bundled payment: should the device be naturally competitive in the market (e.g., if it is preferred by surgeons and increases surgical efficiency), surgeons will have the option to select this prosthesis within the bundled payment.
■ Allocation of a premium: should there be high quality clinical evidence, validated by MSAC or an equivalent through HTA, suggesting that choice of the new technology improves clinical outcomes, a premium payment would be applied to incentivise use of the new technology.
■ Nomination of clinically necessary circumstances: if it is clinically necessary and reasonable to use the item in a procedure, payors would reimburse the price paid, with a retrospective process of peer review and audit.
These measures will ensure device manufacturers continue introducing high performance prostheses into the Australian market, and favours establishment of a robust evidence base behind new products. Importantly, there is no requirement for a separate ‘list’ of novel technologies, given these technologies should naturally gain share in the market, when this is merited, with the above mechanisms in place.

65
8 Conclusion The Prostheses List is an outdated mechanism of pricing that passes artificial and inflated costs to consumers and taxpayers. It drives perverse incentives in the private healthcare system, including increased utilisation of commoditised items during procedures, and does little to favour long-term clinical outcomes.
The proposed reform to the Prostheses List involves removal of non-prostheses from the funding mechanism and transitioning of true prostheses to a bundled payment model. Such a model will enable a reduction in the overall cost of prostheses, while creating a more competitive and transparent market. Within this model, there will be no role for patient gap payments, but provisions will be in place to provide coverage for clinically complex cases where increased prosthesis utilisation or use of higher priced prostheses is reasonable and necessary. This model could also set the foundation for ongoing improvement in Australia’s prosthesis reimbursement system, including potential examination of outcomes-based models and market-based pricing in the future.
Ultimately, these reforms will benefit consumers and taxpayers. The beneficiaries will include over 11 million Australians with Hospital Treatment cover, for whom ~$500m in annualised benefit outlay reduction will translate into lower premium increases. The beneficiaries will also include taxpayers by helping facilitate a transfer of an estimated ~70,000 Australians from the public hospital system to the private hospital system by 2025. This will help contain costs in the public system at a time when healthcare needs and fiscal constraints are growing precipitously. Australia’s private hospitals will also benefit by leveraging the competitive market conditions created in a bundled payment model to add an estimated ~$100m of annualised value to their budgets.
Most importantly, the beneficiaries will be patients. Through this reform, patients will have access to a system wherein clinicians retain control over the choice of prosthesis but are appropriately incentivised to select a prosthesis that delivers superior clinical performance where high quality evidence exists. The system proposed is also one in which there is transparency on the cost of prostheses, including rebates and items used, therefore driving increased accountability and ensuring decisions are being made in the best interests of patients.
The proposed reform is therefore an appropriate approach to addressing the multiple challenges of the current Prostheses List, while maximising outcomes for Australians.

66
9 Appendix
9.1 FURTHER CONTEXT ON INEFFICIENCIES IN THE EXISTING SYSTEM
As previously discussed in Section 2 of this report, inefficiencies exist in the current system from a price, volume and clinical perspective. This section will further outline these inefficiencies through a series of case examples. These examples highlight the core challenges present in the current system, which will be addressed through the proposed reform package.
9.1.1 Case examples: prostheses with clinical registry data
Clinical registry data would allow prostheses to be priced according to their clinical benefit, so that selection of clinically superior prostheses is incentivised through higher reimbursement amounts. This section details two examples of prosthesis types with clinical registry data, for which inefficiencies currently exist in price relative to international benchmarks, and for which there is inappropriate pricing in relation to clinical outcomes.
Cementless hip prostheses
Hip replacement prostheses consist of a femoral component and an acetabular component, both of which can be either cemented or cementless (also known as uncemented). Cemented components utilise PMMA to fix bone to prosthesis, while cementless components rely upon bone fixating to the prosthesis surface coating. In addition, hybrid hip replacements are also possible, where a cemented femoral component is used with a cementless acetabular component.
Cementless hip prostheses have higher prices in Australia compared to international benchmarks. One example is priced at $3,779 on the Prostheses List; however, costs $AUD2,520 in the UK, $AUD2,174 in New Zealand, and $AUD1,293 in France65. This therefore implies a degree of pricing inefficiency when comparing cementless hips on the Australian PL to overseas prices.
Moreover, data from the Australian Orthopaedic Association Joint Replacement Registry shows that, although lower revision rates occur in cementless hips for patients under 75 years old, for patients older than 75 years old lower revision rates occur in cemented hips66. Therefore, in certain cohorts, no premium should be offered for cementless hips. While a cemented femoral component is priced on the PL at between $1,552 to $1,762, the cementless femoral components range from $3,248 to $4,196. The increased reimbursement for cementless hips is therefore not a reflection of superior clinical performance. This emphasizes the essential role of HTA in price setting, which is not consistently performed in the current PL model.
Knee prostheses
Knee prostheses consist of a femoral component, a tibial tray, a tibial insert, a patellar component and accessories. Similar to hip prostheses, the femoral component and the tibial tray can be either
65 Evaluate. “The Prostheses List: Is it cost effective and what recommendations could improve its quality as a tool for
reimbursement?”, March 2020. Unpublished. Specific example refers to the Corail hip. 66 Zhang C. et al. “Cemented or cementless fixation for primary hip arthroplasty—evidence from The International Joint
Replacement Registries”, Ann Joint, 2(10):57, October 2017.

67
cemented or cementless. One example of a knee prosthesis construct is the Triathlon CR, which is the hybrid knee system with the largest volume on the Australian Prostheses List. While the construct costs $6,968 in Australia, the equivalent construct only costs $AUD5,199 in the UK, $5,409 in New Zealand and $4,129 in France67.
One of the most expensive knee prosthesis constructs on the PL, at over $9,000, also has revision rates of 12.9% in 10 years68, which is above the revision rates of cheaper knee constructs. This demonstrates that clinical value is not reflected in the pricing of knee prostheses and reinforces the role of HTA in price setting to appropriately signal clinical benefit in pricing.
9.1.2 Case examples: prostheses without clinical registry data
Coronary stents
Coronary stents are inserted during percutaneous coronary intervention into blocked coronary vessels, in order to keep the coronary arteries open and allow blood flow to the heart. There are two main categories of coronary stents, drug-eluting and bare metal, which correspond to individual product groups in the PL. Drug-eluting stents aim to prevent re-blockage through release of a drug which allows immunosuppression (e.g. sirolimus or everolimus).
Currently on the Prostheses List, drug-eluting stents are priced at $2,298 – this is a significantly elevated price compared to other countries. For instance, the Medtronic Onyx drug-eluting stent costs $AUD893 in New Zealand, $823 in UK and $1,239 in France69. Furthermore, drug-eluting stents are priced at nearly three times the price of bare metal stents, which are listed at $831 on the current Prostheses List.
Despite this price difference, there has been found to be no significant difference in all-cause mortality or major cardiovascular events between drug-eluting and bare metal stents, and only a mild decrease in adverse events (18% in drug-eluting compared to 23% in bare metal stents)70. This raises the question of inefficiencies in pricing of drug-eluting stents, both in terms of price relative to international benchmarking, as well as whether clinical benefits are appropriately reflected.
Pacemaker leads and accessories
Pacemakers are implanted devices which transmit electrical impulses in order to control abnormal heart rhythms. The pacemaker consists of a main battery component which sits in the chest away from the heart, with connecting leads which sit inside the heart. On the Prostheses List, pacemakers fall into three subcategories – Single Chamber, Dual Chamber and CRT Pacemakers. Separate subcategories exist for Pacemaker Leads and Pacemaker/Lead Accessories.
67 Evaluate analysis, using NHS List Prices in the UK, PHARMAC list prices in New Zealand and Product list and benefits
payable in France 68 Evaluate analysis, using Australian Orthopaedic Association – National Joint Replacement Registry, “Hip, Knee & Shoulder
Arthroplasty – Annual Report 2019” 69 Evaluate analysis, using NHS List Prices in the UK, PHARMAC list prices in New Zealand and Product list and benefits
payable in France 70 Feinberg J.et al. “Drug-eluting stents versus bare-metal stents for acute coronary syndrome,” Cochrane Database Syst
Review, 23;8(8), August 2017.

68
Total pacemaker volumes have grown at ~3.1% p.a. between 2013/14 and 2018/19, and pacemaker lead volumes have grown at a slightly faster rate of 3.6% p.a. However, pacemaker/lead accessories (08.11) rapidly rose in volume in FY19. Much of this is accounted by the introduction of the Antibacterial Envelope product group (08.11.02); however, the other pacemaker/lead accessories (08.11.01) have also grown significantly in the past three years (at ~24% p.a.). Given the ratio of leads and pacemakers to accessories would be expected to remain constant, the faster growth in utilisation of accessories suggests a degree of volume inefficiency.
Inclusion of pacemakers, leads and their accessories in a single DRG prosthesis bundle would help reduce any non-essential usage of accessories. The trends in volume and benefits for pacemaker/lead accessories are depicted below.
9.1.3 Case examples: items that are not prostheses
Growth in utilisation of non-prostheses has exceeded growth of procedure volumes, further emphasising the magnitude of potential cost savings if items which do not meet the tightened prosthesis definition were removed from the Prostheses List.
Internal adhesives
Internal adhesives sit under the subcategory of Closure Devices, as part of the General and Miscellaneous category. The internal adhesives product group includes topical skin adhesives, as well as items such as sponges and peristrips. These items are commoditised and specialty agnostic. Furthermore, there is no natural limit to the volume of adhesives used in each procedure – unlike hip prostheses, where only one construct would be expected to be used in a hip replacement surgery.
Growth in volume of internal adhesives more than doubled between FY17 and FY1971, driven in part by the inclusion of topical skin adhesives in the PL. This raises two questions of inefficiency: whether this volume of internal adhesive use is always clinically necessary given the disproportionate growth in relation to overall procedure volume growth, and whether internal adhesives belong on the PL. Indeed, internal adhesives are not implants that are maintained in the patient, nor are they essential to the ongoing function of the implanted prosthesis.
Haemostatic devices
Haemostatic devices serve to stop bleeding or prevent fluid leakage. Similar to other items in the General & Miscellaneous category, these devices are used across a wide range of procedures, with numerous items potentially used in a single surgery. The largest product groups in this subcategory are sponges, pliable patches and matrix.
Haemostatic devices have grown at a rate of 7.1% p.a.72, which exceeds procedure volume growth. As with other items in the General & Miscellaneous category, high growth rates in volumes of haemostatic devices further emphasises the impact of cost savings on the Prostheses List if haemostatic devices were to be removed from the PL. Although haemostatic devices may serve a clinically necessary function, their function is not specifically related to an implanted prosthesis and
71 Hospital Casemix Protocol-1 (HCP1), Prosthesis Utilisation Report, December 2020. Proprietary data, unpublished.
Adjustment then applied as previously described, given HCP1 data under-reports prostheses utilisation relative to APRA statistics
72 ibid

69
they do not play a continuous and ongoing role. The trends in volume and benefits for haemostats are depicted below.
EXHIBIT 36
Intra-ocular fluids
Intraocular fluids are injected into the eye during cataract surgery, in order to assist with removal of cataracts and insertion of the new intraocular lens. Furthermore, they can also be used to stain parts of the eye to ensure visualization during surgery. Two types of intraocular fluids are on the PL – Viscoelastic ($65-89) and Non-viscous ($44). Although each unit does not have a particularly high price compared to other items on the PL, total benefits paid for intraocular fluids in FY19 was $15.8m.
Utilisation of intraocular fluids grew at 5.2% p.a. between FY15 and FY19, which was higher than growth of anterior and posterior chamber intraocular lenses, at 3.0%73. As one intraocular lens would be expected to be used for each eye undergoing cataract surgery, this suggests that the intraocular fluids usage has grown at a greater proportion to cataract surgery volume. This inefficiency in volume could be reduced through bundling of intraocular fluids with the lens in a DRG prosthesis bundle, or through removal of intraocular fluids from the PL, as they do not serve an ongoing and continuous function following the procedure. The trends in volume and benefits for intraocular fluids are depicted below.
73 Hospital Casemix Protocol-1 (HCP1), Prosthesis Utilisation Report, December 2020. Proprietary data, unpublished.
Adjustment then applied as previously described, given HCP1 data under-reports prostheses utilisation relative to APRA statistics
Deep dive: Haemostatic device benefits are growing at ~13% p.a.
162
FY18FY15 FY16 FY17
150
FY19
123 129 138
+7.1% p.a.
28,18340,266
FY19FY15 FY18FY16 FY17
24,41832,284 37,365
+13.3% p.a.
Profile: 03.05 – Haemostatic devicesBaseline statistics
Volume growth over time, 000s
Benefit growth over time, 000s
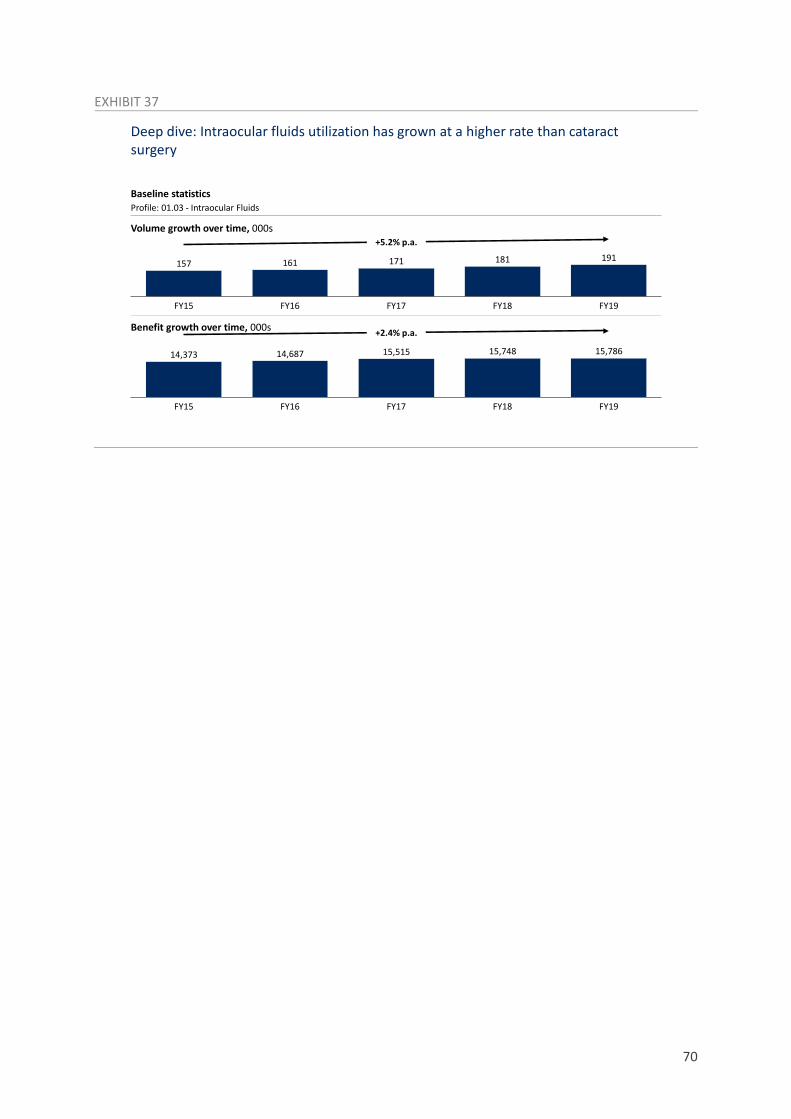
70
EXHIBIT 37
Deep dive: Intraocular fluids utilization has grown at a higher rate than cataract surgery
FY18
191
FY15 FY16
171
FY17 FY19
157 161 181
+5.2% p.a.
FY15 FY18FY16
14,687
FY17 FY19
15,78614,373 15,515 15,748
+2.4% p.a.
Profile: 01.03 - Intraocular Fluids
Volume growth over time, 000s
Benefit growth over time, 000s
Baseline statistics

71
9.2 OVERVIEW OF SEGMENTATION PROCESS
As previously outlined in Section 4, segmentation of the Prostheses List was undertaken to understand variation within the ~11,000 items on the PL, for the purpose of better defining reform options. Three segments were ultimately selected – non-prostheses, prostheses with evidence of differential clinical outcomes, and all remaining prostheses (which do not have data to demonstrate differential clinical outcomes).
However, several other segmentation dimensions across both item characteristics and market characteristics were considered, including:
■ Degree of innovation
■ Degree of genuine specialization
■ Technical complexity
■ Market intensity
■ Individual price
■ High claims categories.
The segmentation question for each dimension, examples of allocation and number of prostheses groups in each segment with corresponding benefits are depicted below.
EXHIBIT 38
As mentioned, two dimensions were selected to define the pricing model – prosthesis eligibility and evidence of clinical outcomes. Both these dimensions were deemed to be practical to assess, as prosthesis eligibility could be compared against the updated prosthesis definition and evidence of clinical outcomes would directly relate to existence of a corresponding clinical registry.
Several segmentation dimensions were considered, of which two were selected to define the reform model
291
1,809
476
507
1,896
539
1,593
1,561
1,624
658
1,442
204
2,057
42
1,606
493
Yes No
365
56
62
392
65
196
395
48
67
376
370
40
367
236
37
384
Benefits2, $m Number of Product Groups1Segmentation question Examples of allocation
Do items in the Product Group meet the definition of a prosthesis?
Item characteristics
Prosthesis eligibility
Haemostatic devices (powder, sponges, foam) and intraocular fluids are not considered prostheses
Is there evidence of active innovation in the Product Group that drives improved outcomes?
Innovation Examples of innovative product groups include deep brain stimulation and neurostimulation devices
Are items in the Product Group genuinely specialised, or are they common across specialty?
Genuine specialization
Screws exist across multiple categories in the PL
Is there genuine complexity in the items in the Product Group, or are they broadly homogenous?
Complexity Examples of complex products include cemented components of TKR prostheses
Are there three or fewer sponsors within the Product Group?
Market characteristics
Market intensity
For example, TAVI devices only have three sponsors in the market (for ~$27m of benefits)
Is the maximum cost within the Product Group greater than $200?
Individual price
Benefits <$200 for retinal detachment sleeves, hip screws, knee screws
Does the Product Group individually comprise greater than 0.5% of PL benefits in 2018/19?
High claims category
Highest claim PGs include DES, foldable posterior chamber intraocular lenses
Is there evidence of differential long-term clinical outcomes, based on robust outcomes data, in this Product Group
Clinical outcomes
Prostheses relating to primary hip and knee arthroplasty are supported by high quality outcomes data
Prosthesis
Not Prosthesis
Evidence on outcomes
No evidence
Innovative
Not innovative
Specialised
Generic
Complex
Non-complex
3 or fewer sponsors
>3 sponsors
Cost >$200
Cost <$200
>0.5% of PL
<0.5% of PL
1. Product Group totals include individual PGs in Part A and C of the list, as well as four PGs for Part B of the List based on categories (given Part B is not organised at the PG level)2. Please note: benefits calculations are based on HCP1 dataset 2019-20, extrapolated to APRA market size 2019-20 on a category basis, includes PL A-C
Source: Hospital Casemix Protocol
Selected dimensions

72
For reference, the below tables list all Product Groups with clinical registry data, and all Product Groups classed as non-prostheses.
9.2.1 Proposed list of Prostheses with clinical registry data
Please note that while the below list indicates where clinical registry data could help differentiate between items within each Product Group, the quality and appropriateness of this data will need to be further assessed by a clinically-led body.
Subcategory Product group
06.01 - ANKLE AND FOOT
06.01.01 - Ankle joint component 06.01.02 - Sinus Tarsi Implant 06.01.03 - Ankle joint
06.02 - UPPER LIMB
06.02.04 - Shoulder - Humeral 06.02.05 - Shoulder - Glenoid
11.01 - FEMORAL COMPONENTS - PRIMARY AND REVISION
11.01.01 - Cemented 11.01.02 - Cemented, Long Lengths (≥200mm) 11.01.03 - Uncemented 11.01.04 - Uncemented, HA Coated 11.01.05 - Uncemented, Long Lengths (≥200mm) 11.01.06 - Uncemented, Long Lengths, HA Coated (≤200mm) 11.01.07 - Uncemented, Modular 11.01.08 - Uncemented, Modular, HA Coated 11.01.09 - Uncemented, Modular, Long Lengths (Stem ≥200mm; Body ≥75mm; Cone ≥70mm; Spacer/Sleeve ≥50mm) 11.01.10 - Uncemented, Modular, HA Coated, Long Lengths (Stem ≥200mm; Body ≥75mm; Cone ≥70mm; Spacer/Sleeve ≥50mm) 11.01.11 - Calcar Replacement 11.01.13 - Monoblock Hemis 11.01.14 - Femoral Neck
11.02 - FEMORAL HEADS
11.02.01 - Conventional Femoral Heads, ≤32mm 11.02.02 - Conventional Femoral Heads, >32mm 11.02.03 - Metal on Metal Heads 11.02.04 - Resurfacing, Cemented 11.02.06 - Bipolar/Multipolar
11.03 - ACETABULAR COMPONENTS
11.03.01 - Cups, Cemented 11.03.02 - Shells, Uncemented 11.03.03 - Shells, Uncemented, HA 11.03.04 - Insert/Liner 11.03.05 - Bonded Shell/Liner 11.03.07 - Resurfacing Cup 11.03.08 - Acetabular Reconstruction Devices
12.01 - FEMORAL COMPONENT: TOTAL KNEE ARTHROPLASTY
12.01.01 - Cemented, Alloy 12.01.02 - Cemented, Alloy, PMMA Coating 12.01.03 - Cemented, Non-Alloy

73
Subcategory Product group 12.01.04 - Uncemented, Alloy
12.01.05 - Uncemented, Alloy, HA Coating
12.02 - FEMORAL COMPONENT: UNI-COMPARTMENTAL KNEE ARTHROPLASTY
12.02.01 - Cemented, Alloy 12.02.02 - Cemented, Non-Alloy 12.02.03 - Uncemented, Alloy
12.03 - TIBIAL TRAY COMPONENT - TOTAL KNEE ARTHROPLASTY
12.03.01 - Cemented, All polyethylene 12.03.02 - Cemented, Alloy 12.03.04 - Cemented, Alloy, for Mobile Insert 12.03.05 - Uncemented, Alloy 12.03.06 - Uncemented, Alloy, Moulded Polyethylene 12.03.07 - Uncemented, Alloy, for Mobile Insert
12.04 - TIBIAL TRAY COMPONENT: UNI-COMPARTMENTAL KNEE ARTHROPLASTY
12.04.01 - Cemented, Alloy Polyethylene 12.04.02 - Cemented, Alloy 12.04.03 - Cemented, Alloy, Moulded Polyethylene 12.04.04 - Cemented, Alloy, for Mobile Insert 12.04.05 - Uncemented, Alloy 12.04.06 - Uncemented, Alloy, for Mobile Insert
12.05 - TIBIAL INSERT: TOTAL KNEE ARTHROPLASTY
12.05.01 - Minimally Stabilised 12.05.02 - Posterior Stabilised 12.05.03 - Totally Constrained
12.06 - TIBIAL INSERT: UNI-COMPARTMENTAL ARTHROPLASTY
12.06.01 - Tibial Insert: Uni-Compartmental Arthroplasty
12.07 - PATELLO FEMORAL REPLACEMENT - FEMORAL COMPONENT
12.07.01 - Alloy 12.07.02 - Non-Alloy

74
9.2.2 Proposed list of non-prostheses
Subcategory Product group 01.03 - INTRAOCULAR FLUIDS
01.03.01 - Viscoelastic 01.03.02 - Non Viscous
01.06 - EYELID PROSTHESES
01.06.01 - Spacers
01.07 - LACRIMAL DUCT DRAINAGE PROSTHESES
01.07.01 – Intracanalicular 01.07.03 - Balloon Dilatation Catheters
01.08 - ORBITAL PROSTHESES
01.08.03 - Fascial - solid and permeable
01.09 - RETINAL DETACHMENT PROSTHESES
01.09.04 - Intraocular Gases 01.09.05 - Intraocular Heavy Liquids 01.09.06 - Intraocular Silicone Oils
02.03 - THROAT
02.03.01 - Tracheal Speaking Valve 02.03.05 - Cannula
03.01 - BRACHYTHERAPY
03.01.01 - Hepatic, Yttrium 90, Standard Dose 03.01.02 - Prostatic I-125 03.01.03 - Tissue Expander/Separator
03.02 - DRUG DELIVERY DEVICES
03.02.01 - Infusion Ports 03.02.02 - Infusion Pumps, Balloon Based 03.02.03 - Infusion Pumps, Battery Powered 03.02.04 - Infusion Pumps, Spring Powered 03.02.05 - Infusion Pump Accessories 03.02.06 - Pharmaceutical Beads
03.03 - ENTERAL TUBES
03.03.01 - Feeding Tubes 03.03.02 - Gastrostomy Tubes 03.03.03 - Jejunostomy Tubes 03.03.04 - Caecostomy Tubes
03.05 - HAEMOSTATIC DEVICES
03.05.01 - Occluder Pin 03.05.02 - Powder 03.05.03 - Sponges 03.05.04 - Pliable Patches 03.05.05 - Matrix 03.05.06 - Foam
03.07 - PULMONARY/PERITONEAL DEVICES
03.07.01 - Drainage Catheters
03.08 - CLOSURE DEVICES
03.08.01 - Adhesion Barriers 03.08.02 - Internal Adhesives
04.02 - DURA DEFECT REPAIR
04.02.01 - Repair, Graft, Small (≤10cm²) 04.02.02 - Repair, Graft, Medium (>10 to 50cm²) 04.02.03 - Repair, Graft, Large (>50 to 100cm²) 04.02.04 - Repair, Graft, Extra Large (>100cm²)

75
Subcategory Product group 04.02.05 - Repair, Liquid Sealant (0 to 3ml) 04.02.06 - Repair, Liquid Sealant (>3 to 6ml)
04.04 - DEEP BRAIN STIMULATION (DBS)
04.04.02 - External Components 04.04.04 - Microtargetting Electrodes 04.04.05 - Accessories
04.06 - INTRATHECAL DRUG DELIVERY SYSTEM
04.06.02 - Patient Programmer 04.06.04 - Accessories
04.08 - NEURO INTERVENTION
04.08.03 - Assist Devices
05.01 - Incontinence Prostheses
05.01.04 - Injectable, Synthetic
06.03 - SKELETAL RECONSTRUCTION
06.03.15 - Bone Graft Substitute
07.01 - CRANIOMAXILLOFACIAL RECONSTRUCTION & FIXATION
07.01.08 - Non-mesh, non-resorbable
07.02 - CRANIOMAXILLOFACIAL IMPLANTS
07.02.09 - Anatomical Biomodel
08.11 - Pacemaker/Lead Accessories
08.11.02 - Antibacterial Envelope
10.07 - Arterial Closure Devices
10.07.01 - Arterial Closure Devices
10.08 - Occlusion Devices
10.08.01 - Particle 10.08.05 - Liquid 10.08.06 - Delivery Device For Occlusion Media
10.09 - Long Term Vascular Access Devices
10.09.01 - Percutaneous Catheters, Single Lumen 10.09.02 - Percutaneous Catheters, Multiple Lumen 10.09.03 - Percutaneous Catheters, Multiple Lumen for Haemodialysis 10.09.04 - Infuser Ports, Single Chamber 10.09.05 - Infuser Ports, Multiple Chamber
10.10 - Peritoneal Dialysis, Long Term Implantable Catheters
10.10.01 - Peritoneal Dialysis, Long Term Implantable Catheters
11.04 - ACCESSORIES 11.04.20 - Spacer- Unique 12.11 - KNEE ACCESSORIES
12.11.12 - Temporary Spacers
08.16 - Remote Monitoring System
08.16.01 - Remote Monitoring System
08.18 - Cardiac Ablation
08.18.01 - Radio frequency (RF) Ablation 08.18.02 - Cryoablation

76
Subcategory Product group 09.14 - Surgical cardiac ablation
09.14.01 - RF Ablation 09.14.02 - Cryoablation

77
9.3 REVISED PROSTHESIS DEFINITION
The current criteria for prostheses to be listed in the Prostheses Rules are as follows, as per the Australian Government’s Guide to listing and setting benefits for prostheses, February 201774:
1. The product must be entered and current on the Australian Register of Therapeutic Goods
2. The product must be provided to a person as part of an episode of hospital treatment or hospital-substitute treatment
3. A Medicare benefit must be payable in respect of the professional service associated with the provision of the product (or the provision of the product is associated with podiatric treatment by an accredited podiatrist)
4. A prosthesis should:
be surgically implanted in the patient and be purposely designed in order to
(i) replace an anatomical body part; or (ii) combat a pathological process; or (iii) modulate a physiological process;
or
be essential to and specifically designed as an integral single-use aid for implanting a product, described in (a) (i), (ii) or (iii) above, which is only suitable for use with the patient in whom that product is implanted
or
be critical to the continuing function of the surgically implanted product to achieve (i), (ii) or (iii) above and which is only suitable for use by the patient in whom that product is implanted; and
5. The product has been compared to alternative products on the Prostheses List or alternative treatments and
assessed as being, at least, of similar clinical effectiveness; and
the cost of the product is relative to its clinical effectiveness.
It is proposed that this definition be modified in order to enforce exclusion of non-prostheses which are not implanted and do not serve a continuous and ongoing role. The proposed modified criteria are:
1. The product must be entered and current on the Australian Register of Therapeutic Goods
2. The product must be provided to a person as part of an episode of hospital treatment or hospital-substitute treatment
3. A Medicare benefit must be payable in respect of the professional service associated with the provision of the product (or the provision of the product is associated with podiatric treatment by an accredited podiatrist)
74 Department of Health, “Prostheses List - Guide to listing and setting benefits for prostheses,” Available from:
https://www.health.gov.au/sites/default/files/documents/2020/06/prostheses-list-guide.pdf, accessed: December 2020

78
4. A prosthesis should:
be surgically implanted in the patient for at least 24 months and be purposely designed in order to
(i) replace an anatomical body part; or
(ii) combat a pathological process; or
(iii) modulate a physiological process;
or
be critical to the continuing function of the surgically implanted product in an ongoing capacity, medically necessary to achieve (i), (ii) or (iii) above and which is only suitable for use by the patient in whom that product is implanted; and
5. The product has been compared to alternative products on the Prostheses List or alternative treatments and
assessed as being, at least, of similar clinical effectiveness; and
the cost of the product is relative to its clinical effectiveness.
This would enable exclusion of items that may only serve a temporary purpose (e.g., internal adhesives), whilst ensuring that true prostheses remain appropriately reimbursed as part of prostheses bundles.

79
9.4 INTERNATIONAL CASE EXAMPLES OF FUNDING MODELS
Australia’s current fee-per-item funding model based on a centralised list is inconsistent with prostheses reimbursement systems overseas.
New Zealand
In the New Zealand public system, a Medical Devices list exists which includes prostheses, as well as other non-prostheses such as tapes and drapes. This Medical Devices list is part of PHARMAC’s Pharmaceutical Schedule (Part III Section H), as in recent years PHARMAC’s role has been extended beyond pharmaceuticals into governing medical devices. Payment per unit occurs as per the PHARMAC schedule for devices that are listed on it, and District Health Boards (DHBs) procure devices at the listed price through purchase orders to the device manufacturers.
PHARMAC has access to price and volume data between suppliers and DHBs, and any prices paid that are lower than listed prices must be disclosed to PHARMAC75. This enables a similar price disclosure mechanism to the Australian PBS and promotes price reductions in line with market competition. In addition, PHARMAC can also mandate arrangements which require DHBs to use a certain proportion of a device from a specific manufacturer, thereby enabling negotiations on price in exchange for percentage market share. An example of this arrangement relates to drug-eluting stents, where at least 65% of permanent coronary drug-eluting stents must be from Abbott Laboratories New Zealand Limited76.
Private insurers in New Zealand each have an individual Prosthesis Schedule within which they determine maximum reimbursement limits and which items are included on the schedule77. In contrast to the Australian Prostheses List, prices are set by each individual insurer, and the maximum limit listed is for a bundled construct (e.g., hip prosthesis, primary), as opposed to individual components of the construct. These prosthesis schedules do not include items such as glues and haemostats which are found on the Australian Prostheses List. Therefore, shifting the Australian pricing model to a bundled model, with exclusion of non-prostheses and price disclosure mechanisms, is feasible and in line with New Zealand’s current state.
United Kingdom
The NHS also benefits from significantly lower prostheses prices compared to Australia. Funding of prostheses in the NHS occurs through a DRG-based episode bundle which includes prostheses, among other costs such as hospital stay costs and operating theatre costs. The price of the DRG-based bundle is set nationally through a fixed procedure code price, with weighting for complexity. The NHS does offer certain devices at supply chain prices; however, individual hospitals typically negotiate device prices under confidential agreements.
75 PHARMAC, “PART 1: Role of PHARMAC and the DHB Hospitals,” Available from:
https://pharmac.govt.nz/assets/PHARMAC-standard-terms-and-conditions-for-medical-devices-Part-1-7.pdf, accessed: December 2020
76 PHARMAC. "Permanent coronary drug-eluting stents" [website]. Available from: pharmac.govt.nz/hospital-devices/whats-happening-in-each-category/permanent-coronary-drug-eluting-stents. Accessed: December 2020.
77 Southern Cross Health Insurance, “List of Prostheses and Specialised Equipment,” Available from: https://www.southerncross.co.nz/-/media/Southern-Cross-Health-Society/Health-insurance/Member-collateral/Plan-documents/Current-plan-documents/List_of_Prostheses_and_Specialised_Equipment.pdf, accessed: December 20

80
France
France has a similar system to the UK, where devices as reimbursed as part of an episode-of-care based bundled payment. The French Government determines the appropriate price for the bundle, based on national benchmarking. In addition, there is a separate premium pricing list for innovative devices, which need to undergo clinical evaluation prior to being listed. There is also additional funding offered for clinically necessary circumstances.

81
9.5 SUMMARY OF HIGH PRIORITY DRG 9.0 CODES
EXHIBIT 39
In considering the transition to a bundled pricing model, it should be noted that a significant proportion of PL value can be captured via mapping PL items to a small number of codes78, highlighting that reform can commence rapidly in the short-term with a focus on select DRG codes.
Note that to audit unnecessary use and assist with cost management, DRG codes could be mapped also to MBS codes. Mapping codes enables payors to reference expected cost of DRG code against known MBS utilisation. This could support identification of inflated use, and has been used to good effect in managing utilisation of TAVI and (AF) nodes, which are matched to both the MBS item recorded by surgeons and their TGA indicated use.
78 Analysis completed using Hospital Casemix Protocol-1 (HCP1), Prosthesis Utilisation Report, December 2020. Proprietary
data, unpublished; and Department of Health, Private Hospital Data Bureau: Annual Report (2018-19), June 2019.
~45% of PL value can be captured by a small range of DRG codes
1. ARG DRG 9.0 codes used – list of relevant codes not exhaustive2. Relevant subcategories chosen based on clinical correlation to chosen DRG codes3. Transcatheter Aortic Valve Implamantation
Source: PHDB DRG 9.0 Codes, HCP1 prostheses data
Product category
Ophthal-mic
Tibial Tray Component: Uni-compartmental KATibial Insert: TKATibial Insert: Uni-compartmental Arthroplasty
Patellar ComponentPatello Femoral Replacement - Femoral Component
CRT Pacemakers
Pacemaker/ICD Adaptors
ICD LeadsPacemaker Leads
Pacemaker/ICD Extenders
Coronary StentsPacemaker/lead Accessories
Posterior Chamber Intraocular LensesIntraocular Fluids
Relevant subcategories2
3 Anterior Chamber Intraocular Lenses 4% - $ 81 M
Proportion of total PL value
Acetabular Components I31A, I31B, I31C: Revision hip replacement – minor/intermediate/major complexity
Hip Femoral Components – Primary And Revision3 12% - $216 M I03A, I03B : Hip replacement for trauma - minor and major complexityFemoral Heads I33A, I33B: Hip replacement for non-trauma – minor and major complexity
C16Z: Lens procedures (note: additional DRG codes may be necessary to capture differentiated range of lens procedures and variable prostheses requirements)
Knee 8 Femoral Component: TKA 13% - $252 M I32A, I32B: Revision of knee replacement – minor and major complexity Femoral Component: Uni-compartmental KA I04A, I04B: Knee replacement – minor and major complexity Tibial Tray Component - TKA I29Z: Knee reconstructions and revision of knee reconstructions
Cardiac 1 Single Chamber ICDs 15% - $288 M F12A, F12B: Implantation and replacement of pacemaker (total system) – minor and major complexity
Dual Chamber Pacemakers F24A, F24B: Interventional coronary procedure (not admitted for AMI) – minor and major complexity
ICDs With CRT F01A, F01B: Implantation and replacement of AICD (total system) – minor and major complexity Single Chamber Pacemakers F10A, F10B: Interventional coronary procedure (admitted for AMI) – minor and major complexity
Relevant DRG1 Codes
Dual Chamber ICDs F17A, F17B: Implantation and replacement of pacemaker generator – minor and major complexity 2

82
9.6 REQUIRED BUSINESS PROCESS CHANGES
Implementation of the suggested reform package will inevitably require changes in the business processes of manufacturers, providers and payors. However, these changes will broadly increase efficiency and maximise benefits for consumers.
9.6.1 Changes for device manufacturers
The exhibit below outlines current key processes for device manufacturers, as well as the expected changes that would result due to the proposed reform.
Listing for devices will still require TGA approval prior to inclusion in the prosthesis bundle. However, with the removal of individual item listing and the requirement for PLAC to approve each prosthesis, there will be a streamlined process for listing as devices will automatically be eligible for inclusion in the appropriate DRG prosthesis bundle once TGA-approved. This will therefore reduce market entry waiting times for device manufacturers and reduce the need to re-submit applications for safety assessment. However, should device manufacturers wish to apply for pricing above the base bundle, they will need to submit evidence to demonstrate clinical superiority, and undergo HTA evaluation through MSAC. This can occur at the time of initial listing, or during a review after the device has already been included.
EXHIBIT 40
9.6.2 Changes for hospitals
Important changes will also occur to hospital procurement processes. If clinical registries are developed and findings made publicly available, clinicians and hospitals may need to collaborate in procuring clinically superior prostheses. The proposed reform model could also incentivise the formation of group purchasing organisations in the provider sector, in order to increase negotiating power with device manufacturers. This is a trend that has occurred in markets with similar systems, such as France.
For device manufacturers, changes could increase efficiency
Positive changeNegative change
1. May include research grants, speaking engagements, sponsored travel, social events, and professional networking support
Listing UtilizationDistributionSalesManufacturing Data reporting
Changes in new system
Reduced need for sales rep in theatre as surgeons gain familiarity with highest quality devices, many of which are often relatively legacy products
Could reduce sales workforce (and subsequently lower costs) if able to achieve volume guarantees through negotiated hospital GPO arrangements
Streamlined approval process for prostheses which are suitable for inclusion in existing bundlesThorough application process only required if manufacturer desires premium pricing for clinical superiority
Device company required to submit price and volume data on sales to IHPA to enable price disclosure adjustments
Maintain current
Device manufactured (mostly overseas)Maintain low numbers of domestic manufacturing workforce
Devices shipped to Australia from overseasManufacturers maintain central hubs, with distribution through reps, hospital orders or third party providers
Device pulled from inventorySales reps support case setup and turnover, as well as device utilization during procedure
Device companies sign contracts with hospi-tals, then focus sales efforts on surgeonsMay leverage multiple avenues to encourage product loyalty from surgeons1
All devices require TGA approval prior to listing and inclusion in prosthesis bundle
May contribute to registry data

83
All rebates (as well as discounts) will need to be disclosed by the hospital in price disclosure cycles, which increases transparency and allows appropriate price reductions to occur. Hospitals will also need to establish a system to enable accurate reporting to IHPA of price and volume data. These changes are depicted below.
EXHIBIT 41
9.6.3 Changes for private health insurers
Health funds will need to consistently adapt to the changes in the proposed model as they unfold, as depicted in Exhibit 42. In the proposed model, responsibility for price setting will remain independent from payors and will shift from PLAC to IHPA. Funds will need to transition the current fee-per-item reimbursement model to a bundled prostheses reimbursement model. In addition, funds will need to adjust processes to enable premium pricing for prostheses with superior clinical performance, and to permit reimbursement for clinically necessary circumstances. Funds will also need to coordinate with IHPA, through existing IHPA audit and peer review mechanisms, to determine appropriateness of such claims. Instead of intermittent adjustments to Prostheses List pricing, funds will now be prepared for annual adjustments to occur as per IHPA’s cycles, and may contribute data to enable IHPA to regulate pricing.
Hospital procurement processes are likely to evolve over time, and in doing so help limit benefits for manufacturers
Differences in process
Define need ReimbursementNegotiationSupplier selectionCategory strategy Review
Hospital
Is the hospital part
of a GPO or large enough to enable
strong negotiations?
Device procured Hospital needs prosthesis
Procurement can issue competitive tenders
for multiple suppliersHospitals receive
reimbursement for device at prosthesis bundle prices
NO PHI pays
prosthesis bundle amount
PHI Patients pay premium to PHI
YES
ClinicianYES
Clinicians intend to perform procedure
Clinicians use device during
procedureNO
Patient Patient requires and is consented
for procedure
Patient receives device
Can the hospital persuade brand
flexibility in clinicians?
Hospital required to disclose prices and establish reporting
system
IHPA IHPA sets prosthesis bundle price
IHPA adjusts prosthesis bundle price
Device company
Device companies may offer discounts
in return for large volumes
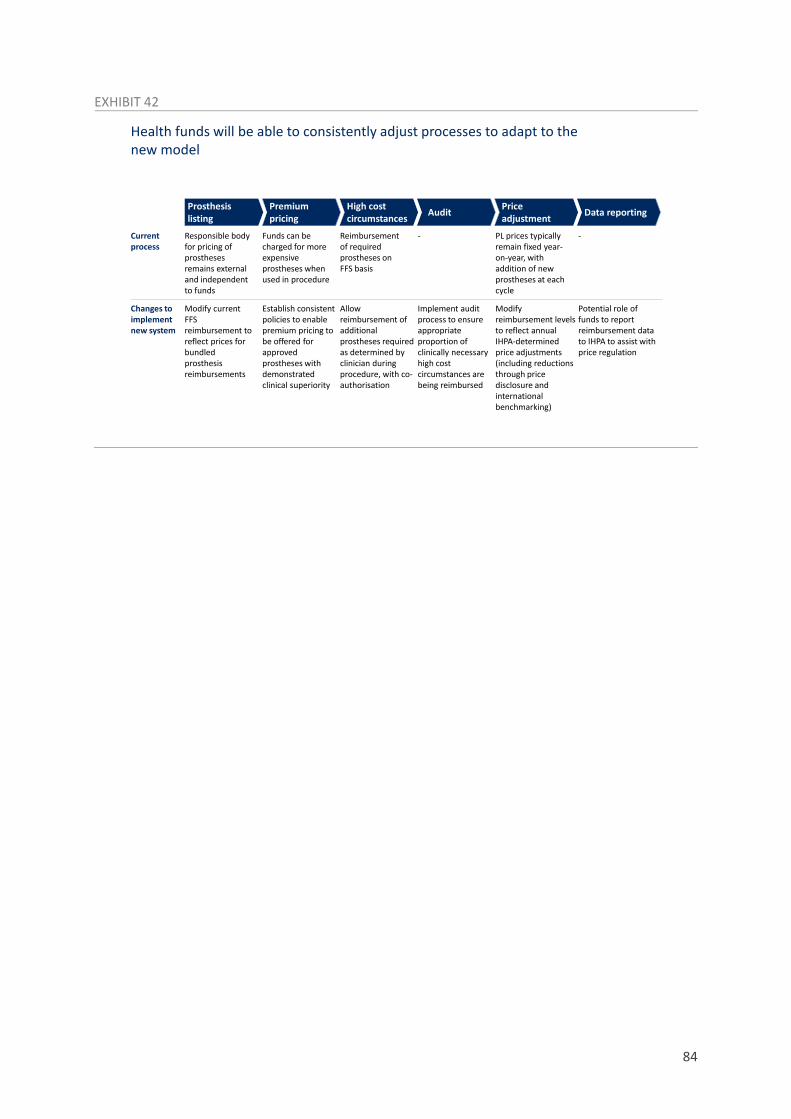
84
EXHIBIT 42
Health funds will be able to consistently adjust processes to adapt to thenew model
Prosthesis listing
Price adjustmentAuditHigh cost
circumstancesPremium pricing Data reporting
Current process
Funds can be charged for more expensive prostheses when used in procedure
PL prices typically remain fixed year-on-year, with addition of new prostheses at each cycle
Reimbursement of required prostheses on FFS basis
Responsible body for pricing of prostheses remains external and independent to funds
Changes to implement new system
Implement audit process to ensure appropriate proportion of clinically necessary high cost circumstances are being reimbursed
Modify reimbursement levels to reflect annual IHPA-determined price adjustments (including reductions through price disclosure and international benchmarking)
Allow reimbursement of additional prostheses required as determined by clinician during procedure, with co-authorisation
Potential role of funds to report reimbursement data to IHPA to assist with price regulation
Modify current FFS reimbursement to reflect prices for bundled prosthesis reimbursements
Establish consistent policies to enable premium pricing to be offered for approved prostheses with demonstrated clinical superiority
- -

85
9.7 NOTES ON FINANCIAL IMPACT MODELLING METHODOLOGY
This report has included estimates of the first, second, and third-order effects of the proposed reforms, specifically examining the impact on value pools and different stakeholder groups:
■ First-order effects include the direct impact of PL reforms on the prosthesis value chain, including payors (funds and consumers), providers (clinicians and private hospital groups) and manufacturers.
■ Second-order effects include the impact of PL reform on private health insurance benefit outlays, leading to premium reductions and the resulting potential for increased uptake of private health insurance; the key stakeholder groups are funds, consumers, and government.
■ Third order effects include the impact of increased uptake of private health insurance on the public system, with relevant stakeholder groups including providers (private hospitals and clinicians), government, and consumers.
This section describes the methodology for estimating the effect of reforms on each stakeholder group at each level of effect.
9.7.1 First-order effects
For each segment s of the PL, as described in the segmentation in this Appendix, the underlying drivers of prostheses expenditure are defined to be:
■ Procs: the volume of prostheses used per privately-insured procedure.
■ Bens: benefit per prosthesis.
■ Gaps: gap per prosthesis.
These variables have been calculated from Hospital Casemix Protocol 1 and APRA (Prosthesis Statistics June 2020) data. When projecting forwards, Bens and Gaps have been held constant to 2020 values, while Procs has been projected to increase in line with historical trends in items-per-procedure growth for the given segment.
The remaining drivers of prostheses utilisation have been defined as:
■ Pop: population estimates from the Australian Bureau of Statistics (ABS).
■ HTprop: the proportion of the population with HT cover, projected forwards using the methodology described in the subsequent section (second-order effects)
■ HTproc: annual privately-insured procedures per member with HT cover.
HTproc has been calculated from AIHW Admitted Patient Care and APRA statistics, and has been projected to increase in line with historical trends.
Expenditure by funds (Spendf) on prostheses items has been calculated, for each year projected, as:
𝑆𝑆𝑆𝑆𝑆𝑆𝑆𝑆𝑆𝑆𝑓𝑓 = 𝑃𝑃𝑃𝑃𝑆𝑆 × 𝐻𝐻𝐻𝐻𝑆𝑆𝐻𝐻𝑃𝑃𝑆𝑆 × 𝐻𝐻𝐻𝐻𝑆𝑆𝐻𝐻𝑃𝑃𝐻𝐻 × � (𝑃𝑃𝐻𝐻𝑃𝑃𝐻𝐻𝑠𝑠 × 𝐵𝐵𝑆𝑆𝑆𝑆𝑠𝑠𝑠𝑠
)
Expenditure by consumers (Spendc), similarly, has been calculated as:

86
𝑆𝑆𝑆𝑆𝑆𝑆𝑆𝑆𝑆𝑆𝑐𝑐 = 𝑃𝑃𝑃𝑃𝑆𝑆 × 𝐻𝐻𝐻𝐻𝑆𝑆𝐻𝐻𝑃𝑃𝑆𝑆 × 𝐻𝐻𝐻𝐻𝑆𝑆𝐻𝐻𝑃𝑃𝐻𝐻 × � (𝑃𝑃𝐻𝐻𝑃𝑃𝐻𝐻𝑠𝑠 × 𝐺𝐺𝐺𝐺𝑆𝑆𝑠𝑠)𝑠𝑠
Of the total expenditure (Spendf + Spendc), it is assumed hospitals receive a certain rebate from manufacturers. The terms and magnitude of these rebates are not publicly reported, and therefore rebates are assumed to be a nominal percentage of total expenditure.
In the reform scenario, the following modelling assumptions have been made:
■ For segments remaining on the PL:
Bens and Gaps decrease by a certain percentage over FY22-25 to reflect the up-front price reductions as items are transitioned to a DRG-based model.
Gaps shifts from being a consumer-borne expense to an insurer-borne expense, to reflect the transition to a no-gap model.
Private hospitals and participating clinicians achieve a margin on total spend, which they retain as revenue, and which reduces manufacturer revenue by the equivalent amount.
The margin on total spend replaces, and is not additive to, manufacturer rebates to private hospitals.
■ For the segment removed from the PL:
The Procs growth rate decreases significantly over FY22-25, approaching the growth rate for Procs for the segments that remain on the PL, based on the assumption that cost pressures will force significant reduction in use of these items.
Bens and Gaps also decrease significantly over FY22-25, as removal from the PL enables negotiations between providers and suppliers on price.
Private hospitals continue to receive manufacturer rebates on these items, but no margin as they are not bundled in the DRG construct.
9.7.2 Second-order effects
Changes in PHI HT membership have been estimated using a three-step process – firstly, to calculate the year-on-year increase in benefit outlays per member; secondly, to calculate the actual and effective premium increase per member; thirdly, to use the estimated price elasticity of demand for private healthcare to establish the impact on participation.
■ Benefit outlays
Historical annual benefit outlay per HT member excluding prostheses (HTmemberexp) has been calculated from APRA Private Health Insurance Trends (June 2020) and has been projected to increase in line with historical trends.
Total prostheses benefit outlay has been projected using the methodology described in the preceding section (Spendf), and used to derive the estimated annual benefit outlay per HT member for prostheses HTmemberp.
87
Annual increase in benefit outlay per HT member (HTmemberinc) has been calculated as the weighted average increase in HTmemberexp and HTmemberp.
■ Premium increase
The baseline for the current premium has been derived from APRA Operations of Private Health Insurers Annual Report (2019-20).
Annual member HT premiums increases have been assumed to equal HTmemberinc.
Effective premium increases have been adjusted using the Rebate Adjustment Factor, as per the calculation methodology outlined in Private Health Insurance (Incentives) Rules 2012 (No. 2); CPI increases have been assumed to remain constant.
■ Impact on participation
The price elasticity of demand for private health insurance has been calculated using historical data from 2013-2019 for participation rates and effective premium increases, indexed to wage growth, using publicly available data from APRA.
Future changes in HT membership have been estimated using effective premium increases as calculated above, indexed to wage growth, based on the estimated price elasticity of demand.
Note that this analysis does not account for the potential for different price elasticities across differing tiers of HT members, nor how demographic and other effects may impact the proportion of members in each tier.
9.7.3 Third-order effects
The approach to second-order effects has also been used to estimate the net increase in HT members (HTmemberdelta) under the proposed reform scenario.
For simplicity, the value pool shift for a unit increase in HTmemberdelta has been assumed to be zero-sum across the public and private system.
The average annual separations per person (Annualsep) has been calculated from the most recent available data, AIHW Admitted Patient care (2017-18) and population data from the ABS.
The value pool shift per separation (VSi, where i represents each different stakeholder group) has been estimated for private hospitals, clinicians, funds and consumers through out-of-pocket expenses, using data from the HCP Annual Report (2018-19) for average costs/benefits per separation to each stakeholder group.
The estimate valued pool shift, for each stakeholder group i, has been calculated using the formula:
𝐻𝐻𝐻𝐻𝐻𝐻𝑆𝑆𝐻𝐻𝐻𝐻𝑆𝑆𝐻𝐻𝑆𝑆𝑆𝑆𝐻𝐻𝐻𝐻𝐺𝐺 × 𝐴𝐴𝑆𝑆𝑆𝑆𝐴𝐴𝐺𝐺𝐻𝐻𝐴𝐴𝑆𝑆𝑆𝑆 × 𝑉𝑉𝑆𝑆𝑖𝑖
Note that this analysis does not assume changes in Annualsep over time, and therefore may underestimate the effect on value pools if per-capita healthcare utilisation rises, nor does it assume differential average annual separations per person in the private and public systems.

88