surges in southern outfall sewer and … corps of engineers, u. s. army surges in southern outfall...
TRANSCRIPT

EC CORPS OF ENGINEERS, U. S. ARMY
SURGES IN SOUTHERN OUTFALL SEWER AND
FLOW CONDITIONS IN STATE FAIRGROUNDS
(WESTERN PARKWAY) PUMPING PLANT
LOUISVILLE, KENTUCKY
HYDRAULIC MODEL INVESTIGATION
TECHNICAL MEMORANDUM NO. 2-367
CONDUCTED FOR
LOUISVILLE DISTRICT, CORPS OF ENGINEERS
BY
WATERWAYS EXPERIMENT STATION
ARMY-MRC VICKSBURG, MISS,
VICKSBURG, MISSISSIPPI
JUNE 1954
PROPERTY OF U. S. mY!' O~FIOE CHIEF OF ~GmmERS ~!~~~--~-

Report Documentation Page Form ApprovedOMB No. 0704-0188
Public reporting burden for the collection of information is estimated to average 1 hour per response, including the time for reviewing instructions, searching existing data sources, gathering andmaintaining the data needed, and completing and reviewing the collection of information Send comments regarding this burden estimate or any other aspect of this collection of information,including suggestions for reducing this burden, to Washington Headquarters Services, Directorate for Information Operations and Reports, 1215 Jefferson Davis Highway, Suite 1204, ArlingtonVA 22202-4302 Respondents should be aware that notwithstanding any other provision of law, no person shall be subject to a penalty for failing to comply with a collection of information if itdoes not display a currently valid OMB control number
1. REPORT DATE JUN 1954 2. REPORT TYPE
3. DATES COVERED 00-00-1954 to 00-00-1954
4. TITLE AND SUBTITLE Surges in Southern Outfall Sewer and Flow Conditions in StateFairgrounds (Western Parkway) Pumping Plant, Louisville, Kentucky:Hydraulic Model Investigation
5a. CONTRACT NUMBER
5b. GRANT NUMBER
5c. PROGRAM ELEMENT NUMBER
6. AUTHOR(S) 5d. PROJECT NUMBER
5e. TASK NUMBER
5f. WORK UNIT NUMBER
7. PERFORMING ORGANIZATION NAME(S) AND ADDRESS(ES) U.S. Army Corps of Engineers,Waterway Experiment Station,3903 HallsFerry Road,Vicksburg,MS,39180
8. PERFORMING ORGANIZATIONREPORT NUMBER
9. SPONSORING/MONITORING AGENCY NAME(S) AND ADDRESS(ES) 10. SPONSOR/MONITOR’S ACRONYM(S)
11. SPONSOR/MONITOR’S REPORT NUMBER(S)
12. DISTRIBUTION/AVAILABILITY STATEMENT Approved for public release; distribution unlimited
13. SUPPLEMENTARY NOTES
14. ABSTRACT
15. SUBJECT TERMS
16. SECURITY CLASSIFICATION OF: 17. LIMITATION OF ABSTRACT Same as
Report (SAR)
18. NUMBEROF PAGES
119
19a. NAME OFRESPONSIBLE PERSON
a REPORT unclassified
b ABSTRACT unclassified
c THIS PAGE unclassified
Standard Form 298 (Rev. 8-98) Prescribed by ANSI Std Z39-18

WESDR
CORPS OF ENGINEERS, U. S. ARMY OFF ICE OF THE D :m.ECTOR
WATERviAYS EXPERIMENT Sl'ATION VICKSBURG, HISSISSIPPI
'•
SUBJECT: Transmittal of T. M. 2-367, "&lrges in Southem Outfall Sewer and Flow Conditions in state Fairgrounds (Westem Parkway) Pumping Plant, louisville, Kentucky; Hydraulic l'bdel Investigation."
TO: The Chief of Engineers (ENGI\irJ) Department of the Arrey ~iashington 25, D. c.
T. M. 2-367 11 "SUrges in Southam Outfall Sewer and Flow Conditions in state Fairgrounds (Western Parkway) Pumping Plant, 1Duisville11 Kentut]q; Hydraulic Jbdel Investigation, 11 is forwarded herewith for your information and retention.
/ fincl (in dup) T. M. 2-.367
C. H. DUNN Colonel, Corps ot Engineers Director

i
PREFACE
Model studies of surges in the Southern Outfall Sewer and of flow
conditions in the State Fairgrounds Pumping Plant*, Louisville, Kentucky,
were authorized by the Chief of Engineers, Department of the Army, in
second indorsement dated 6 February 1947, to a letter from the District
Engineer, Louisville District, CE, dated 15 January 1947. Model studies
were conducted in the Hydraulics Division of the Waterways Experiment
Station during the period December 1947-July 1950. Personnel actively
connected with the model study were Messrs. F. R. Brown, T. E. Murphy,
T. J. Buntin, and G. B. Sims.
Messrs. C. L. Cowan, J. R. Hamilton, and R. E. Karlen of the
Louisville District, and Mr. R. L. Irwin of the Ohio River Division,
visited the Waterways Experiment Station to discuss test results and to
correlate these results with design work being carried on concurrently
in the District Office. Messrs. F. U. Druml and H. B. Willis** of the
District and Irwin** did all the analysis work in the application of
the model data to the prototype problem. This work is summarized in
appendices A and B to this report.
* Name of plant later changed to Western Parkway Pumping Plant. ** Presently of the Office, Chief of Engineers,and Washington District,
respectively.

CONTENTS
PREFACE
SUMMARY
PART I:
. . . . . . . . . . . . INTRODUCTION •
The Problem • • Pertinent Features of the Prototype • Purposes of the Model Studies • • • • •
PART II: THE MODELS
. . . .
. . . .
Design Considerations • • • • • • . . . . . . . . . Description • • • • • • • • . . . Appurtenances • • • • • • •
PART III: NARRATIVE OF TESTS - SURGE MODEL •
Preliminary Tests of Model Construction Material Water-hammer Pressures in Sewer • Surges in Sump of Pumping Station and Sewer • Time of Concentration • • • • • • • • • • • •
PART IV: NARRATIVE OF TESTS - PUMPING PLANT MODEL
Test Conditions • • • • • • • • • • • • • Original Design • • • • • • • • • • • • • • Development of Revisions to Pumping Plant • Sewer Line Riverward of Pumping Plant • •
PART V: DISCUSSION OF TEST RESULTS
Surge Model • • • • Pumping Plant Model • •
TABLES l-31
PLATES l-28
. .
APPENDIX A: DEVELOPMENT OF ANALYTICAL METHOD FOR DETERMINATION
iii
Page
i
v
l
1 2 4
5
5 6 8
10
10 ll 12 15 17 17 17 19 24
26 26 27
OF SURGES IN SEWERS • • • • • • • • • • • • • • • .Al-A3
PLATES Al-A4
APPENDIX B: ANALYSIS OF SURGES IN SOUTHERN OUTFALL SEWER (PROTOTYPE ) • • • • • • • •
General • • • • • • • • • Southern Outfall Sewer • • • • • Planned Pumping Capacity Generalized Model of Prototype Sewer Method of Analysis Surge Relief Reservoir • • • • • Results of Analyses • • •
. . . . . . . . . . . . . . . . . . . . . . . . . . . .
. . . . . . . .
Bl
Bl B2 B3 B4 B6 B7 B8

iv
CONTENTS (Cont'd)
APPENDIX B: ANALYSIS OF SURGES IN SOUTHERN OUTFALL SEWER (PROTOTYPE) (Cont'd)
Possibility of Surge Development Conclusions • • • • • • •
PLATES Bl-B5
. . B9 BlO

v
SUMMARY
Model investigations of the surges occurring in sewer lines and of
the flow conditions in a typical pumping plant, used to dispose of drain
age during high river stages, were conducted as a part of the local flood
protection project for Louisville, Kentucky. Studies conducted on a 1:32-
scale simplified model of the Southern Outfall Sewer provided general in
formation on the relative amount of relief from surges to be expected from
the pumping station and manholes in the sewer line upstream. It was de
termined that the open sump absorbed all water-hammer effects with no in
crease in pressure occurring upline from the sump. It also was deter
mined that the time of valve closure (pump stoppage) had little effect
upon the maximum height of surge rise. A decrease in the size of the
sump increased the maximum height of rise; an increase in the area of
the risers had little or no effect on the height of rise, although in
creasing the area greatly lengthened the time of rise. The height of
surge upline was reduced by allowing one of the lower manholes to be
overtopped and the excess water to go into storage above ground. The
time of concentration tests indicated that with a surcharged sewer the
time of travel of an additional increment of water from the point of
entry to the point of exit was practically instantaneous; whereas, with
a sewer flowing partially full, the additional increment traveled with
the normal velocity of the water, thus greatly increasing the time of
concentration of flow at the lower end of the sewer. The above studies
provided data that formed the basis for a comprehensive analysis of the
surge problem in sewers.
Tests of the State Fairgrounds Pumping Plant were made on a 1:16-
scale model and provided information on plant performance for gravity and
pumped flow. Flow conditions were improved throughout the plant by re
vising the intake and outlet transitions and removing the baffle walls
in the discharge channel. It was determined from the model studies that
an approximate depth of 2 ft of water was required over the lower end of
the inlet transition to prevent the passage of air upstream resulting
from surges in the main sump.

SURGES IN SOUTHERN OUTFALL SEWER AND
FLOW CONDITIONS IN STATE FAIRGROUNDS (WESTERN PARKWAY) PUMPING PLANT
LOUISVILLE, KENTUCKY
Hydraulic Model Investigation
PART I: INTRODUCTION
The Problem
1. The city of Louisville, Kentucky, is located on the left bank
of the Ohio River, approximately 200 miles northeast of the river's mouth
(fig. 1). At present the city's
sanitary sewage and the storm water
drainage both empty into the Ohio
River through a series of combined
sewer systems. These systems are
of the gravity flow type, and no
pumping facilities are provided
for forcing the sanitary sewage
and storm water into the river
during flood stages. Accordingly,
it is proposed to build a series
of pumping stations near the out
let ends of existing sewer sys
tems or on diversion sewers to
pump sewage and runoff across the Fig. 1. Vicinity map
line of protection into the river during flood stages.
2. Preliminary design of the internal drainage facilities of the
city of Louisville indicated that, in several instances, pumping sta
tions would be operating with a considerable length of sewer flowing
under a surcharge. It appeared that any sudden change in pump discharge,
such as might be caused by a power failure, while the station was oper
ating under a surcharge would create surges in the sump which might
result in serious damage to the system. This surge problem is ap
parently analagous to that of a penstock, although the mathematical

2
solution in connection with sewers is more difficult because of the nu
merous inlet points and the frequent changes in sewer size. The need
for information on surge effects was considered critical enough by the
Ohio River Division that studies having application to the Louisville in
ternal drainage problem were initiated. These tests were extended to in
clude the study of flow conditions at the entrance to and through a typ
ical pumping station.
Pertinent Features of the Prototype
3. The Southern Outfall Sewer System* was selected by the Louis
ville District, CE, as the prototype on which to base the model. This
system drains an area of about 4,540 acres, and has a total length of
main-line sewer of approximately 33,000 ft (fig. 2) with accompanying
laterals and manholes. The main sewer is of concrete construction, vary
ing from a 5-ft-3-in. semielliptical shape to a 15-ft-6-in. horseshoe
shape. The surcharged capacity of the sewer is approximately 1700 cfs.
4. A pumping plant (plate 1), designated as the State Fairgrounds
Pumping Plant, is to be constructed at the lower end of the Southern Out
fall Sewer line for disposal of storm water when the river elevation is
higher than that of the sewer. The plant will be constructed of concrete
with top of discharge chamber at elevation 462**, and is designed to
carry a flow of 1800 cfs when the river is at elev 427.2, and 910 cfs
when the river is at elev 458.3. Capacities for model testing were
1800 cfs at river elev 430 and 1200 cfs at river elev 458.3. The aver
age velocity in the sewer during the maximum flow will be approximately
20 ft per sec. The pumping plant was planned to be constructed in an off
set position from the existing concrete horseshoe-shaped sewer, which is
10 ft 7 in. by 10 ft 1-1/2 in., and connected to the existing sewer by
a transition on each end. The final design provides for "over-sewer"
location. The upper transition will be flared so as to decrease the
velocity of flow before it enters the sump chamber. The storm-water
* See appendix B for more detailed descriptions of sewer system. ** All elevations are in feet above mean sea level.

LEGEND .6 RECORDING STREAM GAGE e MANHOLES
•-•- EXISTING SEWER
•'
..•
PROJECT LOCATION MAP ,._ M I :r
ICAL£ IN fEET T r -

4
pumps will be open-pit type installations with each intake opening into
a trash rack well. Each trash rack well will be connected to the sump
chamber by a gated opening. The pump installation tested consists of
four 1500-hp (386 cfs) pumps·and two 500-hp (128 cfs) pumps. Final de
sign of this pumping plant provides for four 1250-hp (360 cfs) and three
500-hp (120 cfs) pumps. The river end of the sump chamber will be con
nected through two gated openings to the outfall sewer, so that the
transition section and sump chamber will serve as a part of the gravity
outlet of the sewer when the pumping plant is not in operation.
5. It is proposed to maintain the water-surface elevation in the
sump chamber within a 5-ft range when the pumps are operating. The pumps
will be manually controlled and turned on consecutively, starting with
the riverward pump and progressing landward.
Purposes of the Model Studies
6. Two models were considered necessary to study the principal
problems involved in designing an efficient and safe sewer system and
pumping plant for the conditions existing at Louisville. A simplified
model of a part of the main-line sewer is designated in this report as
the "surge model" since it was used to determine (a) the water-hammer
pressures in the main-line sewer, (b) the surges that might occur at the
pumping plant and in the lower reaches of the connecting sewer, and (c)
the effects of surcharging the sewer upon the time of concentration of
flows at the pumping station. Results of tests from the simplified model
could not be applied directly to the Louisville sewer system but were to
be used to evaluate the effects of certain variables as a basis for a
more comprehensive mathematical development of the design. The second
or "pumping plant model" was used to study flow conditions in and through
the pumping plant for gravity and pumped flow.

5
PART II: THE MODELS
Design Considerations
7. Considerable attention was given to the selection of the type
models that would allow the desired data to be obtained with minimum ex
pense. After all factors involved had been carefully weighed, it was
decided that a simplified model of a portion of the main sewer and the
more important laterals would permit collection of data that could be
applied analytically to the over-all sewer design. A 1:32 scale was
selected for the surge model. Its use permitted the cross-sectional
area of the lower part of the main sewer to be simulated by means of a
6-in.-diameter circular pipe; a 4-in.-diameter circular pipe simulated
the 10-ft horseshoe-shaped section of sewer in the vicinity of the pump
ing plant. A 1:16 scale was selected for the pumping plant model in order
to permit more detailed study of the flow conditions in the sump and
transition areas.
8. Fluid motion in both models was effected predominantly by the
force of gravity, which permitted the variation of all hydraulic quanti
ties in their proper relationships as derived from the Froude law. Since
it was desired to reproduce water-hammer phenomena in the surge model,
and since the velocity of propagation of a pressure wave is a function of
the elasticity of the fluid medium and of the conduit walls, elastic
forces were also a factor for consideration and Cauchy's number vms of
primary importance. Therefore, in order to insure closer relationships
with regard to elastic forces, the model sewers were constructed of
plastic. This material possesses the elasticity required to bring the
velocity of pressure-wave propagation'about into consonance with the
Freudian velocity scale governing discharge in the model.* The use of
plastic tubing also aided in approximating the desired roughness values.
Relationships for transference of model data to prototype equivalents,
* For verification see Waterways Experiment Station TM No. 185-1, "Model Study of Hydraulic Characteristics of Power Tunnel, Fort Peck Dam," November 1941.

6
or vice versa, are listed in the following tabulation where the subscript
r represents the model-to-prototype ratio:
Dimension
Length
Area
Time
Velocity
Discharge
Roughness
Ratio
L r
A = L 2
r r T = L 1/2
r r
V = L 1/2 r r
Q = L 5/2 r r
n = L 1/6 r r
Scale Relationship Surge Model Pumping Plant
1:32 1:16
1:1024 1:256
1:5.66 1:4
1:5.66 1:4
1:5793 1:1024
1:1.782 1:1.586
Description
9· The 1:32-scale model reproduced approximately 10,000 ft of the
lower part of the main line of the Southern Outfall Sewer (fig. 3 and
plate 2). No laterals or risers were reproduced initially; however, pro
vision was made for installing a short section of each of five main lat
erals during the testing program. The entire model was constructed ini
tially of 6-in. plastic tubing (model); after the initial tests the lower
1600 ft was replaced by 4-in. tubing (model). The wall thickness of the
6-in. and 4-in. plastic tubing was 1/8 in. and 1/4 in., respectively.
The pumping plant was represented in this model by a rectangular, plastic
box equal in area to the sump chamber. The sudden stoppage of flow was
produced in the surge model by means of a quick-closing valve on which
an electrical measuring device was installed so that the length of time
required to effect closure could be measured and recorded. Sections
of plastic tubing for reproducing the risers or manholes were provided
for installation when required.
10. The 1:16-scale model of the State Fairgrounds Pumping Plant re
produced approximately 175 ft of the existing sewer upline from the pump
ing plant; the entire pumping plant, including the intake and outlet tran
sitions; and approximately 45 ft of the existing and proposed sewers below

Fig. 3. Model of Southern Outfall Sewer

8
Fig . 4. Model of State Fairgrounds Pumping Plant
the pumping plant (fig . 4 and plate 3) . The sewers and pumping plant
were constructed of plastic . Pump action was produced in the pumping
plant model by six separate outflow and inflow lines , the pumping force
being supplied through common headers by means of a 3-cfs centrifugal
pump . Each pair of lines was equipped with a circular orifice plate and
valve so that any desired combination of discharges could be set up in
the system . River stages were simulated initially by means of a valve
installed in the discharge line . This model was later revised so as
to reproduce the extension of the proposed and existing sewers to the
river, and stages were maintained by means of a tailbay into which the
sewers emptied (fig . 5) .
Appurtenances
11 . The infl ow into both models was measured by means of venturi

meters . An overflow weir was pro
vided in the headbay of the surge
model to carry off the excess water
upon sudden stoppage of flow .
12. Static pressures were meas
ured by means of water piezometers
and water -surface elevations were
9
read by means of staff gages . Velo
cities in the sewers were measured by
means of a pitot tube mounted in a
special collar which permitted attach
ment of the tube to the pipe at any
desired location . Pressures due to
water hammer were measured by means
of pressure cells connected to an
oscillograph recorder (fig . 6) . The pressure cells were of the elec
tromagnetic type developed at the
Fig . 6. Recording apparatus
Fig . 5. Tailbay wherein water level could be controll ed to
simulate river stages
Waterways Experiment Station for
the measurement of fluid pressures .
A continuous photographic record of
the pressure fluctuations was ob
tained ; plate 4 shows typical oscil
lograph records .
13 . Surges were measured by
two methods . Initially they were
measured by means of resistance
gages installed in risers and in the
sump and were recorded by means of an
oscillograph . In later tests the
maximum height and time of rise of
the surges were obtained by visual
observation and a stop watch, re
spectively .

10
PART III: NARRATIVE OF TESTS -- SURGE MODEL
Preliminary Tests of Model Construction Material
14. A preliminary series of tests was conducted to verify the as
sumptions made during the design of the model to satisfy the requirements
of Cauchy's number. These tests involved: (a) determination of the
speed of propagation of the pressure wave along the plastic tube with
the entire length of sewer constructed of 6-in.-diameter plastic tubing;
(b) determination of the coefficient of roughness of the plastic tubing.
Pressure wave propagation
15. The modulus of elasticity of the 1/8-in.-thick plastic mate
rial {Lucite) used for the model sewer was determined to be 392,000 lb
per sq in. A check of this value after completion of the tests indi
cated that the modulus remained unchanged. The velocity of propagation
of the pressure wave in the prototype was computed to be about 3760 ft
per sec; thus the corresponding theoretical pressure wave in the model
was approximately 660 ft per sec. The 6-in.-diameter, 1/8-in.-thick
Lucite tubing was estimated to be capable of accommodating a velocity of
pressure wave propagation of 766 ft per sec, assuming the tubing to be
continuous with no joints. However, the model sewer was constructed of
4-ft sections of tubing with a 1-1/2-in. plastic flange on the end of
each section. If the entire model had been constructed of plastic with
a wall thickness of 1-1/2 in., the pressure wave velocity would have been
about 2330 ft per sec. The introduction of a correction factor based
upon the number of flanges on the tubing as a proportion of the total
length of the model sewer permitted an upward revision of the expected
velocity of pressure wave propagation to about 925 ft per sec. This ve
loc_ity agreed closely with the measured velocity of 1000 ft per sec. Thus
the actual value of the velocity of pressure wave propagation (1000 ft per
sec) was somewhat in excess of the velocity (660 ft per sec) required for
satisfying exact similitude requirements.
16. The model was initially constructed with short stub pipes at
each of the riser locations. These stubs were capped, thus providing a

11
series of branching dead-end pipes. The first tests indicated that the
sudden closure of the valve at the pumping plant resulted in a constantly
increasing pressure from the valve toward the headbay. This condition
was caused by the reflection of pressure waves from the dead ends of the
small branching pipes which in turn increased the pressure in the main
sewer. Plugs inserted flush with the main sewer in these branch pipes
equalized shock pressures along the sewer line.
Coefficient of roughness
17. The coefficient of roughness of the plastic model sewer was
determined from Manning's formula and is presented on plate 5. The com
puted average velocities based on the flow through the sewer were used
in the computation of roughness values. The slope of the hydraulic gra
dient was determined from piezometers located along the model sewer.
Water-hammer Pressures in Sewer
18. Initial tests to determine water-hammer pressures were made with
the entire length of sewer constructed of 6-in. plastic tubing. No later
als or risers were installed and all short stub connecting pipes were
plugged as described in paragraph 16. The quick-acting closing valve was
located at the end of the sewer section with no intervening sump chamber.
Pressures were recorded at six locations along the sewer (plate 2) for
discharges of 1400, 1800, and 2000 cfs prior to stoppage of the flow. Re
sults of these tests (plates 6-8) indicated that a maximum pressure of
approximately 450 lb per sq in. existed at all points for conditions of
maximum discharge. Pressures decreased as the discharge prior to valve
closure was decreased.
19. The lower 50 ft of the 6-in. tubing was replaced by 4-in. tubing
in succeeding tests and the magnitude of the pressure wave was again meas
ured for flows of 1400, 1800, and 2000 cfs with instantaneous valve clo
sure. The maximum pressures in the 4-in. line were approximately 2200 lb
per sq in., whereas the maximum pressures in the 6-in. line upstream were
only about 750 lb per sq in. (plates 9-11). A comparison of the pressures
obtained at the three discharges is shown in table 1. Variation in the

12
l ength of time of closure of the valve to determine the effect on water
hammer pressures in the line revealed that for a closure time in excess
of 4o sec the resul ting water- hammer pressures were negligible .
Surges in Sump of Pumping Station and Sewer
Effect of sump installation
20 . A chamber reproducing to scale the proper dimensions and area
of the prototype sump of the pumping station was installed in the model .
The surge relief flap openings , located near the top of the sump, were
not reproduced initially and the chamber was constructed to sufficient
height t o prevent overtopping (fig . 7) . Since the actual time of stoppage
Fig . 7. Sump chamber with surge relief valves and pump outlets
of the prototype pumps was unknown,
it was assumed that the time of stop
page would probably not exceed 2
minutes . A series of tests with dis
charges of 1400, 1800, and 2000 cfs
was made and the time of stoppage
varied from 1 to 156 seconds (table
2) . It may be noted from this table
that the maximum height of rise of
the water surface in the sump chamber
varied only slightly regardless of
the length of time required to close
the valve (pump stoppage) . Coinci
dental with these tests, measurements
of the water-hammer pressures existing
upline from the sump were also made .
These measurements indicated the high pressures noted previously within
the closed sewer system upstream were completely relieved by the sump cham
ber and were in the same range as the height of rise of water in the sump .
Effect of relief openings and pump outlets
21. The height of rise of water in the sump chamber) as described

13
in the preceding paragraph, exceeded the prototype elevation of the top
of the sump (elev 462). Therefore, it was desired that the effect of the
surge relief openings and the pump outlets on the water-surface elevation
be studied. Accordingly, the 60-in. relief flap gates were reproduced,
seven with a center-line elevation of 452.0 and one with a center-line
elevation of 455·5· Tests were made for varying times of stoppage for
flows of 1400, 1800, and 2000 cfs. The height of rise of the water level
in the sump chamber was greatly reduced from heights previously measured
(table 3). Some relief also will probably result from flow through the
pump inlets and into the outlet channel even though the pumps are stopped.
As the pump impellers and fittings will offer considerable resistance to
this flow, the assumption was made that each pump outlet would have an
effective area of 50 per cent of its actual area. Openings of the desired
size were made in the sump walls at the proper elevations. The previous
tests were repeated and, as expected, the height of rise of the water level
in the sump chamber was reduced still further (table 4).
Effect of r~sers (manholes)
22. The five principal manholes in the section of sewer included in
the model limits were simulated by the addition of a vertical riser in
stalled in the correct location. The relief openings and pump outlets in
the sump chamber were closed and the number of risers was increased one
at a time in succeeding tests. The maximum height of water level in the
sump and individual risers was measured for flows of 14oO, 1800, and 2000
cfs (tables 5-6). Complete hydrographs of the surge in the sump and
risers were obtained (plate 12). To study the effect of the initial
sump stage on the height of rise, tests were also conducted with the ini
tial sump stage varied over a range of approximately 25 ft. These tests
revealed that water-surface elevations in the sump and risers were paral
lel and varied as the difference in elevation between initial sump stages.
Thus the surge rise in feet was the same, regardless of the sump stage at
which flow stoppage was accomplished. The stoppage of only one or more
of the large pumping units also could cause a surge in the sump chamber
and risers. Accordingly, tests were made simulating the closure of in
dividual and combinations of pumping units. The maximum heights of these

14
surges are listed in table 7. As to be expected, an increase in the
amount of flow stoppage increased the amount of surge in the sump chamber
and in the sewer upstream.
Variation in sump area
23. Tests were made with sump areas of 700, 1400, and 2100 sq ft to
study the effect that variation of the area of the sump would have on the
height of rise of water level in the sewer line caused by a stoppage of
the pumping units. Results of these tests (tables 8-10) indicated that
the height of rise was greatly increased by decreasing the area of the
sump.
Submergence of sump outlets
24. The tests previously described were made with the pump outlets
and relief flap valves open to atmospheric pressure. In the prototype,
however, the head against which the pumps will operate could be above
the pump outlet. Therefore, in an attempt to simulate the effect of an
increase of the river stage on the surge relief through the pump outlet
lines, the pump openings in the sump chamber were raised to the same
elevation as the flap relief valves (elev 452.0). This increase in ele
vation had the same effect as increasing the river stage. The area of
pump openings was decreased 50 per cent as in previous tests. Tests were
made for flows of 1100, 14oO, 1600 cfs as requested by representatives
of the Louisville District. Results are listed in table 11.
Dispersion of inlet flow
25. For all previously described tests, the total inflow was in
troduced into the upper end of the model. To investigate the effect of
dispersion of the inlet flow, a total flow of 1800 cfs was distributed
between the five main laterals included in the model. The sudden stop
page of flow at the pumping plant resulted in an increase in water level
in the sump and risers (table 12) which agreed closely with the results
obtained when the total flow was introduced at the upper end of the model.
Storage of surge flow
26. All previously described tests with the risers installed were
conducted with the surge flow contained within the risers. To study the
effect of permitting the risers to overflow and containing the water in
15
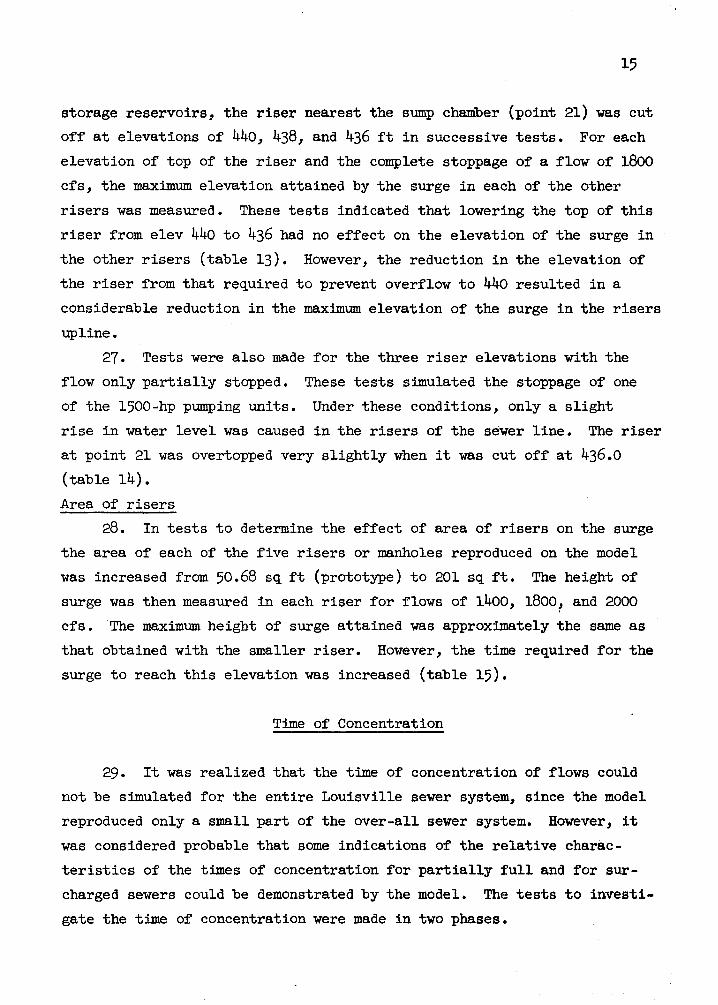
storage reservoirs, the riser nearest the sump chamber (point 21) was cut
off at elevations of 440, 438, and 436 ft in successive tests. For each
elevation of top of the riser and the complete stoppage of a flow of 1800
cfs, the maximum elevation attained by the surge in each of the other
risers was measured. These tests indicated that lowering the top of this
riser from elev 440 to 436 had no effect on the elevation of the surge in
the other risers (table 13). However, the reduction in the elevation of
the riser from that required to prevent overflow to 440 resulted in a
considerable reduction in the maximum elevation of the surge in the risers
upline.
27. Tests were also made for the three riser elevations with the
flow only partially stopped. These tests simulated the stoppage of one
of the 1500-hp pumping units. Under these conditions, only a slight
rise in water level was caused in the risers of the sewer line. The riser
at point 21 was overtopped very slightly when it was cut off at 436.0
(table 14).
Area of risers
28. In tests to determine the effect of area of risers on the surge
the area of each of the five risers or manholes reproduced on the model
was increased from 50.68 sq ft (prototype) to 201 sq ft. The height of
surge was then measured in each riser for flows of 1400, 1800! and 2000
cfs. The maximum height of surge attained was approximately the same as
that obtained with the smaller riser. However, the time required for the
surge to reach this elevation was increased (table 15).
Time of Concentration
29. It was realized that the time of concentration of flows could
not be simulated for the entire Louisville sewer system, since the model
reproduced only a small part of the over-all sewer system. However, it
was considered probable that some indications of the relative charac
teristics of the times of concentration for partially full and for sur
charged sewers could be demonstrated by the model. The tests to investi
gate the time of concentration were made in two phases.

16
30. The first-phase tests were conducted with the sump and all
risers installed. An initial discharge of 1100 cfs was used and the sewer
was flowing partially full. A sudden increase in flow was introduced at
the upper end of the sewer and the time that elapsed before the discharge
increased at the lower end was noted. This test was repeated with the
sewer initially surcharged (flowing full) by a flow of 1800 cfs. The
elapsed time before increased flow was noted at the pumping station in
the partially full sewer was 119 sec (prototype), whereas in the sur
charged sewer it was only 28 sec.
31. The second phase of the time-of-concentration tests was made
with the risers removed and all openings sealed, thus providing a closed
conduit from the upper end of the model to the sump. An initial flow of
750 cfs was introduced into the model so that the 6-in. (model) pipe was
about one-third full and the 4-in. (model) pipe was about one-half full.
The flow of water was suddenly increased as before and the time for in
creased flow at the pumping plant was measured. The sewer was then sur
charged as before and the time of travel of the additional water again
measured. The time of travel for the low flow was 351 sec (prototype)
and for the high flow it was less than 6 sec. Thus, it would appear that
for conditions of a surcharged sewer system, increases in flow at widely
separated areas would be reflected almost instantaneously at the pumping
plant. The time of concentration would be affected slightly by the num
ber of manhole openings but not to the degree expected. This factor is
important in the determination of the design of pumping capacity for the
plant.

17
PART IV : NARRATIVE OF TESTS - - PUMPING PLANT MODEL
Test Conditions
32. Tests on the 1:16-scale model of the pumping plant (fig . 8) were made for conditions of both gravity and pump flow . During initial
tests the outflow was controlled by a valve located in the discharge
Fig . 8. Details of pumping plant model
sewers downstream from the pumping plant . River stages were set by pie
zometers located in the sewer lines at the same distance below the pump
ing plant as are the sewer outlets in the prototype . These sewer lines
were later extended and tests made with the river stages reproduced in
a tailbay at the end of the sewer discharge lines .
Origina l Design
33 . Details of the original design of the pumping plant are shown
on plate 3. Tests revealed the distribution of velocities in the intake

18
Fig . 9 . View of pumping plant from north showing sump chamber in foreground and pump discharge channel in background . Water
surface indicated is for conditions of pump flow
Fig . 10. Pumping plant from west showing pump discharge channel and sewer lines on riverward
side of plant
transition to be uneven and losses
in the outlet transition to be high
for conditions of both pump and
gravity flow . Plates 13 and 14 show the velocity distribution in
the intake transition and the out
fall lines for gravity and pump
flow, respectively . Plate 15 indi
cates the velocity ranges at wh~ch
the measurements were made . Losses
in the discharge channel for the
pumps also were very high because
of the impediment to flow afforded
by the cellular-type partition
walls in the channel (figs . 9 and
10) .
34. Pressure measurements
throughout the intake and outlet

transitions for gravity and pump conditions are listed in tables 16-18
while table 19 lists the elevation of the water surface in the various
compartments of the sump chamber and pump discharge channel.
Development of Revisions to Pumping Plant
Revised intake and outlet transitions
19
35. A revised transition (plate 16) was installed at the intake
and the distribution of flow was improved slightly, especially for pump
ing conditions, as evidenced by the velocity patterns (plates 17-18).
The outlet transition to the existing sewer was replaced by an elbow sec
tion (plate 16), which also improved flow conditions in the outlet area,
Tables 16-19 show a comparison of the elevation of the hydraulic grade
lines obtained in the sewer lines and in the pumping plant for both
gravity and pump flow with the intake transition revised, and with both
intake and outlet transitions revised. Plate 19 shows the locations of
the piezometers. The gradient at the upper end of the intake transition
was lowered a maximum of 3 ft by the revision of the intake and outlet
transitions. Although the revised intake transition provided more even
flow throughout, velocities were still higher in the right portion of
the transition. However, the eddy which was present in the left portion
of the intake transition for the original condition (plate 14) was elimi
nated. The tests also indicated that the upper part of the entrance to
the outlet transition should be· rounded and a b.ellmouthed entrance pro
vided for the 72-in. sewer, as turbulent flow still existed in these
areas.
Determination of sump operating range
36. It was desired to maintain the elevation of the hydraulic grade
line at the upper end of the intake transition as near elev 416.4 as pos
sible. During pumping operations this gradient was controlled by the
water-surface elevation in the sump. Therefore, it was necessary to de
termine the .maximum permissible water-surface elevation in the sump as
well as the minimUm elevation required to maintain full flow in the in
take tra1lf!lition.. This safe-operating range was determined to be between

20
elev 415.5 and 419.5 ft msl (plate 20). Maintenance of a sump elevation
of 415.5 eliminated air from the intake transition. A sump elevation
higher than 419.5 raised the elevation of the hydraulic grade line at the
upstream end of the transition above the desired elevation of 416.4.
Therefore, in order to maintain the 5-ft operating range as required for
efficient operation of the sump pumps (paragraph 5), it will be necessary
to lower the elevation of the sump and transition 1 ft, unless a differ
ent method of pump control can be used.
Tests of pump intakes
37. Tests were made to study the relative merits of the draft-tube
type pump intake (fig. 11) and the open-pit type intake with separator
walls {fig. 12 and plate 21). Visual observation made of the flow con
ditions existing in the sump chamber and intakes for both types indicated
that flow in the open-pit intake was more turbulent than that in the
draft-tube intake. However, the relative efficiency curves (plate 22) of
the two intakes indicated the open-pit setting type of intake to be
slightly more efficient than the draft-tube intake. It is believed that
additional tests of the intakes should be made on a larger scale model
with the prototype impeller and pump characteristics reproduced, as the
scale of this model and the absence of individual pumps would tend to
disparage the results obtained.
Operation of pumps
38. A study of the effects of operating various combinations of
pumps waS, made with both the draft-tube and open-pit type intakes in
stalled. In each series of tests the sump level was maintained between
elev 417 and 422 and the outfall sewer was allowed to flow free (no river
control). The first test consisted of starting the pumps in succession,
beginning with the riverside pump and progressing toward the landside
pump. The discharge of those pumps already operating did not change as
additional pumps were started. No turbulence was observed in the sump
until the next to last pump on the landside was started, at which time a
marked increase in turbulence was noted in the sump. This turbulence was
greatly increased when the most landward pump was started.
39. When the order of starting the pumps was reversed, i.e., the

Fig. 11. Draft-tube type pump intakes
Fig . 12. Open-pit type pump intakes
21
pumps were turned on from the landside to the riverside, considerable
turbulence was noted when the first pump was started and existed through
out the rest of the test. Numerous other combinations of pumps also were
investigated and the effects noted. The starting of additional pumps
bad no effect on the capacity of the pumps already operating, regardless
of the pumping combination used. The only effect noted for any test was
the turbulence as discussed above . This turbulent condition is not be
lieved sufficiently great to warrant revision of the design .
Enlargement of sluice gate
40 . As the losses through the pumping plant for gravity flow were
still slightlybigber than considered desirable, one of the sluice gates
between the lower end of the sump and the exit channel was enlarged
(plate 23) . The enlargement of the gate reduced the elevation of the
water surface in the sump which in turn reduced the elevation of the hy
draulic grade line at the upper end of the intake transition to elev
416 .9 (table 20). The water-surface elevations in the sump and discharge

22
chanriel were also equalized (compartments 6, 14, and 15, table 21). No
further revisions were made to lower the gradient for gravity flow, as
representatives of the Louisville District stated that the gradient was
satisfactory and any additional lowering desired could be obtained by
streamlining the entrances to the outfall sewers.
Revisions to pump discharge channel
41. Several revisions were made to the pump discharge channel in
order to increase its capacity. The first of these revisions consisted
of removing the two baffle walls in the west exit channel and putting an
ogee crest just below the step-down at the lower end of the south dis
charge channel (fig. 13). A 45-degree fillet, 2ft on a side, was also
added to the southwest corner of the pumping plant (plate 23). These
revisions increased the maximum discharge capacity at high river stages
from 575 cfs to 740 cfs and reduced the turbulence in the west discharge
channel. Later tests indicated that the ogee section below the south
channel was not required and it was removed from the model. The capacity
of the discharge channel for high river stages was further increased to
920 cfs by cutting a 10-ft by 10-ft relief opening in the riverside of
the southwest corner (fig. 14). The hydraulic grade line in the sewer
below the pumping plant and the water-surface elevations in the discharge
channel obtained during these tests are indicated in tables 22 and 23,
respectively.
42. The required pump discharge of 1200 cfs with a river stage of
458.3 ft was not obtained by the preceding revision. The baffle walls in
the south discharge channel still caused excessive losses. Therefore,
that portion of the south wall baffle walls above elev 445.0 was removed.
Although this revision increased the capacity of the discharge channel
to the required amount, flow in this channel was still turbulent. Ac
cordingly, all of the baffle walls were removed from the discharge chan
nel and tests were made for various pump flows (table 24). Since sup
porting members were required in the discharge channel, however, twelve
2-ft-sq horizontal struts were installed. Tests made to determine the
effect of these struts on flow conditions (table 25) revealed no obstruc
tion to flow.

Fig. 13 . View of baffle valls in pumping plant
Fig. 14. Relief opening in pump discharge channel

24
Baffle partition walls in sump chamber
43. In an attempt to reduce surges in the sump chamber, the baffle
partition walls in the sump chamber were lowered from elev 420 to elev
415. Tests were made for both pump and gravity flow. These tests re
vealed no apparent improvement in flow conditions in the sump and no ef
fect on the pressure readings formerly obtained (tables 26-27). The
baffle partition walls were then completely removed and no change in
sump action was noticed.
Sewer Line Riverward of Pumping Plant
44. The hydraulic grade lines for all flows during initial tests
were maintained by a valve at the lower end of the model (plate 3), as
only 45 ft (prototype) of the outfall sewers were reproduced below the
pumping plant. An analysis was made of the losses* occurring in the out
fall lines for both gravity and pump flow (tables 28-29) and of the com
puted hydraulic grade line elevation at the upper end of the outfall sewer
as compared to that used in the model (table 30). These analyses indi
cated that the control elevations used during the model study for gravity
flows of 1800 cfs and pump flows of 1200 cfs were fairly close to the
computed elevations, although the elevation of the grade line used for
pump flow of 1800 cfs was too low.
45. Accordingly, the outfall sewers were extended in accordance
with plans furnished by the Louisville District (fig. 5) and a series of
tests was made to determine the hydraulic grade lines for various operat
ing conditions. The following data were obtained with the model condi
tions as indicated:
a. Hydraulic grade line existing in the 10-ft-7-in. by 10-ft-1/2-in. sewer without the pumping plant installed for a discharge of 1800 cfs and river stage elevations of 382.5 and 427.2 (plate 24).
* Losses in miter bends determined from curve contained in "Energy Loss in Smooth- and Rough-Surfaced Bends and Curves in Pipe Lines, 11 by Werner Schubai t.

25
b. Hydraulic grade lines existing in the sewer and through the pumping plant for gravity flow of 1800 cfs and river stages of 382.5, 412.0, and 427.2 (plate 25).
c. Hydraulic grade lines in sewer for pump flows of 1800 and 1200 cfs at river stage elevations of 430 and 458.3, respectively (plate 26).
Velocities were measured for all the above flow conditions and the dis
tribution of flow between the existing horseshoe-shaped sewer and the
proposed 72-in. circular sewer was computed (table 31).
46. Negative pressures were measured in the sewer lines during
some of the above tests, which indicated that the sewer lines had devel
oped siphonic action. The model was revised by the addition of vents
(fig. 5) and tests were made as indicated below. Hydraulic grade lines
were determined for:
a. Existing conditions without the pumping plant, a flow of 1800 cfs and a river stage of 382.5. Vent installed in existing sewer at sta 0+00 (plates 24 and 27).*
b. Pumping plant installed with 1800-cfs gravity flow and river stage of 382.5. Vent installed in existing sewer at sta 0+00 and in 72-in. proposed sewer at sta 5+60 (plate 27).
c. Pumping plant installed with 1800-cfs gravity flow and a river stage of 382.5. Vents installed in existing sewer at sta 0+00, 5+40, and in 72-in. sewer at sta 5+60 (plate 28). Hydraulic grade lines were not obtained for river stages of 412.0 and 427.2 as the addition of air vents did not change the grade lines previously obtained without vents.
The above tests indicated that the outfall sewers should be vented to
obtain the desired capacity for gravity flow. Velocity cross sections
were taken in the outfall lines for the various flow conditions and the
flow distribution (between the two outfall lines) was improved (table
31).
* Station 0+00 located at piezometer 1, 247.34 ft upstream from pumping plant.

PART V: DISCUSSION OF TEST RESULTS
Surge Model
47. The simplified model of the Southern Outfall Sewer was con
structed for the purpose of obtaining basic data regarding surge action
to be expected in a sewer system embracing a main-line sewer and several
laterals and risers. Initial studies were conducted to determine the
water-hammer pressures encountered in a closed line and the amount of
relief afforded these pressures by the addition of an open sump and
risers. Additional studies made to determine the effect of varying the
time of complete stoppage of pump discharge on the height of surge in
the sump and risers indicated that within certain limits this variation
in time made no appreciable difference in the height of surge produced,
48. The model tests also indicated that with the Southern Outfall
Sewer as originally designed the possibility existed of large and de
structive surges developing in the pumping plant sump and along the lower
reaches of the main sewer. High or moderately high surges could develop
under certain circumstances, not only from total shutdown of the pumping
plant, but also from shutdown of individual pump units. Model tests in
dicated that the pumping plant itself could be protected from damage due
to surges in the sump by installation of surge relief valves or flap gates
that would open and allow discharge direct to the river. However, these
features would not protect the area upline from the sump. Some reduction
in surge upline from the sump appears possible by permitting overflow of
risers (manholes) into storage areas constructed for the purpose. The
results of the time-of-concentration study of flow at the pumping plant
from the various areas of the sewer system indicate that, if the sewer
is under pressure as planned, a flow increase from any of the areas would
be reflected in increased flow at the pumping plant almost immediately.
The number of manholes tend to cause a slight time lag but not enough
to be a serious factor in design considerations.
49. The results obtained from the model study have been compared
with the results obtained from a method developed by the Ohio River

27
Division* for analytically determining the surge heights in a simple
sewer system. The model and computed data compare favorably, thus per
mitting an analytical computation to be made of the surges to be expected
in the Southern Outfall Sewer, rather than determining these surges from
a more extensive model study.
Pumping Plant Model
50. Model tests of the State Fairgrounds Pumping Plant indicated
that the original design did not produce the desired results. The in
take and outlet transitions were revised in order to reduce flow losses
through the pumping plant for gravity flow. The gate openings between
the sump chamber and the pump discharge chamber were enlarged in order
to lower the hydraulic grade line at the upper end of the intake transi
tion to the desired elevation. The cellular construction of the pump
discharge channel as originally designed restricted the flow during high
river stages to such an extent that only approximately one-half the de
sired discharge could be passed at high river stages. The recommended
design included the removal of all baffle walls in the pump discharge
chamber to accommodate the desired discharge. In addition, a relief open
ing was recommended for direct passage of flow from the plant to the
river during high river stages.
51. A study of the relative merits of the draft-tube and open-pit
setting types of pump intakes indicated that the open-pit setting was
slightly more desirable, although additional model tests are recommended
before accepting these results as conclusive. Tests also indicated that
the pumps could be operated in any desired combination without affecting
the discharge of any other pumps in the plant. A series of tests made
on the outfall lines indicated the desirability of venting these lines
and of possibly increasing the size of the proposed 72-in. line to im
prove distribution of flow further.
52. During the course of the tests, consideration was given to the
* Appendices A and B.

28
location of the pumping plant immediately over the existing sewer align
ment. This location should simplify intake transition problems; however,
no tests were made with the plant in this position.

Table 1
WATER-HAMMER PRESSURES IN SEWER
Pumping Plant Omitted
Prototype Pressure - Pounds Per Square Inch Discharge = 1400 cfs Discharge = 1800 cfs Discharge = 2000 cfs
Lower Section Lower Section Lower Section Location 6-in. Tubing 4-in. Tubing 6-in. Tubing 4-in. Tubing 6-in. Tubing 4-in. Tubing
Protection 356 1542 519 2000 565 2200 levee
*Pt 21 611 912 (4-in. Sect)
Pt 21 307 512 393 685 456 736
Pt 20 282 486 374 627 457 714
Pt 19 288 544 390 695 465 771
Pt 18 303 512 403 646 486 727
Pt 17 290 551 437 690 454 742
Notes: Time of valve closure = 0.944 seconds. No laterals or risers. All values are in prototype units except size of tubing.
* This pressure cell added when lower end was changed to 4-in. tubing.

Table 2
EFFECT OF TIME OF VALVE CLOSURE ON WATER-SURFACE ELEVATIONS IN SUMP
No Surge Relief Openings
= 1400 cfs Discharge = 1800 cfs Discharge Velocit~ = 15.89 fEs in 4-in. Line Velocity = 20.44 fps in 4-in. Line
Time of Time of Valve Closure Max* Valve Closure Max*
Seconds Elev Seconds Elev
0.94 468.30 0.94 485.90
3-96 468.48 6.79 485.60
10.19 468.38 19.24 485.60
39.05 468.32 47.54 485.12
78.11 467.42 81.50 484.48
109.24 467.20 96.22 484.16
135.84 466.40 136.41 483.20
Notes: All values are in prototype units except size of sewer line. Lower end of model constructed of 4-in. tubing.
*Water-surface elevation in sump at 420.0 msl prior to beginning of tests.
Discharge Velocity = 22.35
Time of Valve Closure
Seconds
0.94
5.66
33-96
57-17
93-39
156.22
------
= 2000 cfs fps in 4-in. Line
Max* Elev
495.20
497.28
496.80
496.64
495-52
494.88
------

Table 3
EFFECT OF RELIEF OPENINGS ON WATER-SURFACE ELEVATION IN 3UMP
cfs Discharge = 1800 cfs Discharge = 1400 Velocity = 15.89 fps in 4-in. Line Velocity = 20.44 fps in 4 -in. Line
Time of Time of Valve Closure Max* Valve Closure Max*
Seconds Elev Seconds Elev
2.8 453.8 2.8 455-7
14.2 453.8 38.5 455-7
33.4 453.8 65.1 455-7
78.7 453.6 97.4 455-7
118.9 453.6 133.6 455.4
Notes: All values are in prototype units except size of sewer line. Lower end of model constructed of 4-in. tubing.
*Water-surface elevation in sump at 420.0 ft msl prior to beginning of tests.
Discharge Velocity = 22.35
Time of Valve Closure
Seconds
4.5
41.3
106.4
152.8
= 2000 cfs fps in 4-in. Line
Max* Elev
457.0
456.8
456.6
456.6

Table 4
EFFECT OF RELIEF OPENINGS AND PUMP OUTLETS
ON WATER-SURFACE ELEVATION IN SUMP
cfs Discharge - 1800 cfs Discharge = 1400 Velocity = 15.89 fps in 4-in. Line Velocity = 20.44 fps in 4-in. Line
Time of Valve Closure
Seconds
2.8
23.8
54.9
78.1
125.1
Max* Elev
444.5
444.5
444.2
444.2
443.?
Time of Valve Closure Max*
Seconds Elev
4.0 451.2
20.4 451.2
49.8 450-9
74.8 450.9
121.7 450-9
134.1 450.7
Notes: All values are in prototype units except size of sewer line. Lower end of model constructed of 4-in. tubing.
*Water-surface elevation in sump at 420.0 ft msl prior to beginning of tests.
Discharge Velocity = 22.35
Time of Valve Closure
Seconds
4.0
36.8
52.1
90.6
140.4
- 2000 cfs fps in 4-in. Line
Max* Elev
452.2
452.2
452.2
452.2
451.8

Table 5
EFFECT OF RISERS ON MAXDIDM SURGES IN SUMP AND SEWER LINE
Water-surface Elevation msl Discharge = 1400 cfs Discharge = 1800 cfs Discharge = 2000 cfs
Condition Elev Upper Pool = 442.5 Elev Upper Pool = 455,0 Elev Upper Pool = 465.0 and Normal Max Time of Rise Normal Max Time of Rise Normal Max Time of Rise
Location Elev Elev Seconds Elev Elev Seconds Elev Elev Seconds
Sump ,... No risers Sump 420.0 468.5 130 420.0 485.6 136 420.0 495.2
Sump - l riser Sump 420.0 469.0 132 420.0 485.3 136 420.0 495.4 141
Pt 21 433-9 463.5 127 441.1 479.0 136 446.1 488.7 139
Sump - 2 risers Sump 420.0 469.0 130 420.0 485.1 136 420.0 494.9 141
Pt 21 433.8 463.9 127 441.1 479.5 130 446.3 488.8 133 Pt 19 436.6 455·7 127 444.8 470.1 133 451.8 479.4 130
Sump - 3 risers Sump 420.0 468.8 133 420.0 485.3 136 1~20 .0 495.8 140
Pt 21 433.6 463.5 133 441.3 479.3 138 446.1 488.8 140 Pt 19 436.5 456.0 133 445.8 470.3 136 451.6 479-7 140 Pt 17 439.6 448.5 133 450.3 462.0 136 457-5 470.6 141
Notes: All values are in prototype units. Area of sump = 2100 sQ ft. Area of risers = 50.68 sq ft each. Time of valve closure approximately 3 seconds.

Table 6
MAXIMUM SURGES IN SUMP AND SEWER LINE
WITH 5 RISERS INSTALLED
Water-surface Elevation msl Discharge = 1400 cfs Discharge = 1500 cfs
Elev Upper Pool = 436.5 Elev Upper Pool = 450.0 Normal Max Time of Rise Normal Max Time of Rise
Location Elev Elev Seconds Elev Elev Seconds
Sump 415.0 465.0 141 415.0 480.8 141.4
Pt 21 429.0 459·5 147 435.8 474.0 135.8
Pt 20 429.8 456.2 146.8 437.2 470.5 135.8
Pt 19 432.1 452.5 146.9 440.8 .466.0 135.8
Pt 18 434.1 477.8 147 444.0 460.8 135.8
Pt 17 435.5 445-3 147 445.8 458.3 135.8
Notes: All values are in prototype units. Area of sump = 2100 sq ft. Area of each riser = 50.68 sq ft. Time of valve closure approximately l second. Time of rise measured from the time valve is completely closed. Risers installed at points 17, 18, 19, 20, and 21.
Discharge = 2000 cfs Elev Upper Pool = 458.5
Normal Max Time of Rise Elev Elev Seconds
415.0 490.5 135.8
441.3 483.5 135.8
443-3 479.8 135.8
447.0 475·3 135.8
450.9 469.5 135.8
453·5 467.0 135.8

Table 7
MAXIMUM SURGES IN SUMP AND SEWER LINE
FOR PARTIAL REDUCTIONS OF FLOW
Initial Discharge 1800 cfs
Maximum Water-surface Elevations Units StoEped as Indicated
Two 1500-hp Three 1500-hp One 1500- and One and One
hp Pump 500-hp Pumps 500-hp Pumps Time of Time of Time of
Normal Max Rise Max Rise Max Rise Location Elev Elev Seconds Elev Seconds Elev Seconds
Sump 420.0 432.8 141 441.1 130 461.6 130
Point 21 1J.4l.l 446.2 62 453·9 96 466.1 130
Point 19 445.4 448.1 62 450.4 96 456.8 130
Point 17 450.2 451.7 96 453.5 130 457·7 130
Notes: All values are in prototype units. Sump and risers at points 17, 19, and 21 installed in model. Area of sump = 2100 sq ft. Area of risers = 50.68 sq ft each. Discharge = 1800 cfs; elev upper pool = 455.0 ft msl. Time of valve closure approximately 3 seconds. Capacity of 1500-hp pump was 386 cfs. Capacity of 500-hp pump was 128 cfs.

Table 8
MAXIMUM SURGES IN SUMP AND SEWER LINE
Sump Area = 700 sq ft
Water-surface Elevation msl Discharge = 1400 cfs Discharge = 1800 cfs
Elev UpEer Pool = 436.5 Elev Upper Pool = 450.0 Normal Max Time of Rise Normal Max Time of Rise
Location Elev Elev Seconds Elev Elev Seconds
Sump 415.0 490.0 74 415.0 514.5 76
Pt 21 429.0 478.0 79 436.0 498.9 82
Pt 20 429-5 473-5 85 438.2 493-5 85
Pt 19 432.0 464.5 85 441.0 483.5 85
Pt 18 434.0 456.2 88 444.0 472.6 90
Pt 17 435.0 451.5 91 445.9 467.5 94
Notes: All values are in prototype units. Area of each riser = 50.68 sq ft. Time of valve closure approximately 1 second. Time of rise measured from the time valve is completely closed. Risers installed at points 17, 18, 19, 20, and 21.
Discharge = 2000 cfs Elev Upper Pool = 458.5
Normal Max Time of Rise Elev Elev Seconds
415.0 527.5 79
441.3 512.0 82
443.0 505.0 88
447.0 494.3 88
450.3 482.7 89
453.0 476.7 90

Table 9
MAXIMUM SURGES IN SUMP AND SEWER LINE
Sump Area = 1400 Sq Ft
Water-surface Elevation msl Discharge = 1400 cfs Discharge = 1800 cfs
Elev Upper Pool = 436.5 Elev Upper Pool = 450.0 Normal Max Time of Rise Normal Max Time of Rise
Location Elev Elev Seconds Elev Elev Seconds
Sump 415.0 472.0 107 415.0 490.0 105
Pt 21 429.6 462.8 96 436.0 480.2 96
Pt 20 430.0 460.2 85 436.5 476.2 91
Pt 19 432.0 455-5 88 441.0 470.5 88
Pt 18 434.0 448.0 85 444.0 463.1 85
Pt 17 435.0 446.0 85 445.8 460.0 85
Notes: All values are in prototype units. Area of each riser = 50.68 sq ft. Time of valve closure approximately 1 second. Time of rise measured from the time valve is completely closed. Risers installed at points 17, 18, 19, 20, and 21.
Discharge = 2000 cfs Elev Upper Pool = 458.5
Normal Max Time of Rise Elev Elev Seconds
415.0 502.9 130
441.3 492.2 130
443.1 486.8 130
447.0 480.5 130
451.2 472.8 130
453.6 469.5 130

Table 10
MAXThtOM SURGES IN SUMP AND SEWER LINE
Sump Area = 2100 sq ft
Water-surface Elevation msl Discharge = 1400 cfs Discharge - 1800 cfs
Elev Upper Pool = 436.5 Elev Upper Pool = 455.0 Normal Max Time of Rise Normal Max Time of Rise
Location Elev Elev Seconds Elev Elev Seconds
Sump 415.0 464.0 141 415.0 480.0 141
Pt 21 429.0 459.0 147 435.8 474.0 136
Pt 20 430.0 456.0 147 437-2 470.5 136
Pt 19 432.0 452.0 147 440.8 466.0 136
Pt 18 434.0 447.0 147 444.0 460.8 136
Pt 17 435.0 445.0 147 445.8 458.3 136
Notes: All values are in prototype units. Area of each riser = 50.68 sq ft. Time of valve closure approximately 1 second. Time of rise measured from the time valve is completely closed. Risers installed at points 17, 18, 19,. 20, and 21.
Discharge = 2000 cfs Elev UEper Pool = 458.5
Normal Max Time of Rise Elev Elev Seconds
415.0 490.5 136
441.3 483-5 136
443.3 479-8 136
447.0 475-3 136
450.9 469.5 136
453-5 467.0 136

Table ll
MAXJMUM SURGES IN SUMP AND SEWER LINE
Pump Outlets and 60-in. Relief Openings Installed at Same Elevation
Water-surface Elevation msl Discharge = 1100 cfs Discharge - 1400 cfs
Elev Upper Pool = 432.0 Elev Upper Pool = 436.5 Normal Max Time of Rise Normal Max Time of Rise
Location Elev Elev Seconds Elev Elev Seconds
Sump
Pt 21
Pt 20
Pt 19
Pt 18
Pt 17
415.0 438.0
425-5 438.0
426.0 441.0
428.0 443.5
429.0 444.0
430.0 444.0
96 415.0 452-5 91
110 428.0 452.0 91
141 429.2 450.0 91
147 431.6 448.0 91
192 433.0 445.0 124
221 434.0 444.0 124
Notes: All values are in prototype units. Area of sump = 2100 $~ ft. Area of risers = 50.68 s~ ft. Time of valve closure approxi~tely l second. Time of rise measured from the time the valve is completely closed. Risers installed at points 17, 18, 19, 20, and 21. All openings in sump at elevation 452.0 ft msl.
Discharge = 1600 cfs Elev Upper Pool = 442.5
Normal Max Time of Rise Elev Elev Seconds
415.0 453.0 85
431.5 454.2 85
432.5 452.8 85
435-7 450.7 85
437.8 448.0 88
438.5 446.0 91
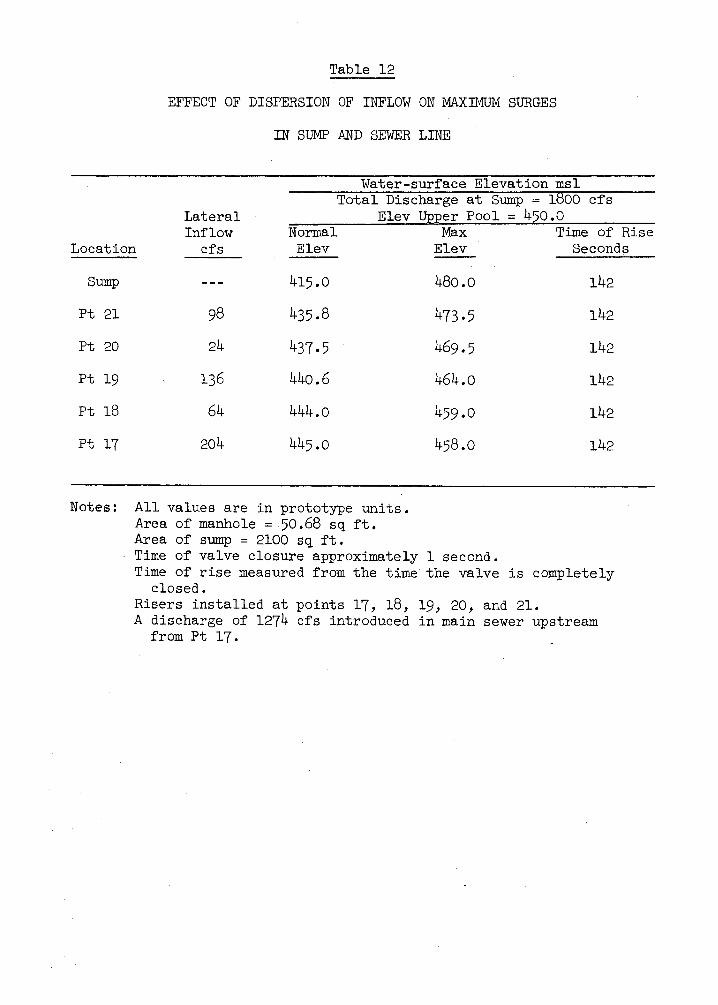
Table 12
EFFECT OF DISPERSION OF INFLOW ON MAXIMUM SURGES
IN SUMP AND SEWER LINE
Water-surface Elevation msl Total Discharge at Sump = 1800 cfs
Lateral Elev Upper Pool 450.0 Inflow Normal Max Time of Rise
Location cfs Elev Elev Seconds
Sump 415.0 480.0 142
Pt 21 98 435.8 473·5 142
Pt 20 24 437.5 469.5 142
Pt 19 136 44o.6 464.0 142
Pt 18 64 444.0 459.0 142
Pt 17 204 445.0 458.0 142
Notes: All values are in prototype units. Area of manhole = 50.68 sq ft. Area of sump = 2100 sq ft. Time of valve closure approximately l second. Time of rise measured from the time the valve is completely
closed. Risers installed at points 17, 18, 19, 20, and 21. A discharge of 1274 cfs introduced in main sewer upstream
from Pt 17.

Table 13
EFFECT OF OVERTOPPING RISER AT POINT 21 ON
MAXD1UM SURGES IN SUMP AND SEWER LINE
Water-Surface Elevation msi Discharge - 1800 cfs - Elev Upper Pool - 450.0
Elev Top of' Riser = 440.0 Elev Top of Riser - 438.0 Normal Max Time of Rise Normal Max Time of Rise
Location Elev Elev Seconds Elev Elev Seconds
Sump 415.0 462.6 113 415.0 461.8 113
Pt 21 435.4 435·5
Pt 20 437.2 455·3 141 437.2 455·5 141
Pt 19 440.5 4~5 .o 141 440.5 454.0 141
Pt 18 4~3.8 453.0 141 443.8 453.0 141
Pt 17 445.5 453.0 141 445.5 453.0 170
Notes: All values are in prototype units. Area of sump = 2100 sq ft. Area of risers = 50.68 sq ft. Time of valve closure approximately l second. Time of rise measured from the time the valve is completely closed. Risers installed at points 17, 18, 19, 20, and 21.
Elev Top of Riser = 436.0 Normal Max Time of Rise Elev Elev Seconds
415.0 461.3 116
435·5
437.2 455·5 158
440.5 455.0 158
443.8 453.0 158
445.5 453·5 181

Table 14
EFFECT OF OVERTOPPING RISER AT POINT 21 ON MAXIMUM SURGES IN SUMP AND SEWER LINE
Stoppage of One 1500-hp Pump ( 386 cfs)
Water-surface Elevation msl Discharge = 1800 cfs - Elev Upper Pool 450.0
Elev Top of Riser = 44o.o Elev Top of Riser = 438.0 Elev Top Normal Max Time of Rise Normal Max Time of Rise Normal
Location Elev Elev Seconds Elev Elev Seconds Elev
Sump 415.0 416.0 57 415.0 416.0 57 415.0
Pt 21 435.5 436.5 85 435·5 436.5 85 435.5
Pt 20 437.2 438.2 113 437.2 438.2 113 437.2
pt 19 440.5 441.5 141 440.5 441.5 141 440.5
Pt 18 443.8 444.5 141 443.8 444.5 141 443.8
Pt 17 I 445 o5 445.5 445.5 445.5 445.5
Notes: All values are in prototype units. Area of sump = 2100 sq ft Area of risers = 50.68 sq ft Time of partial valve closure approximately 1 second. Time of rise measured from the time the valve movement is completely stopped. Risers installed at points 17, 18, 19, 20, and 21.
of Riser = 436.0 Max Time of Rise Elev Seconds
416.0 57
438.0 68
441.0 96
443.8
445.5

Table 15
MAXIMUM SURGES IN SUMP AND SEWER LINE
Area of Risers = 201 s~ ft
Water-Surface Elevation msl Discharge = 1400 cfs Discharge = 1800 cfs
Elev Upper Pool = 436.5 Elev Upper Pool = 450.0 Normal Max Time of Rise Normal Max Time of Rise
Location Elev Elev Seconds Elev Elev Seconds
Sump 415.0 463.5 141 415.0 479·9 153
Pt 21 429.0 458.0 153 435.8 472.5 153
Pt 20 430.0 456.4 153 437.6 470.9 158
Pt 19 432.0 452.2 164 440.6 466.3 170
Pt 18 435.0 448.0 164 444.0 461.7 170
Pt 17 435.5 446.0 170 445.8 459.1 170
Notes: All values are in prototype units. Area of sump = 2100 s~ ft. Time of valve closure approximately l second. Time of rise measured from the time the valve is completely closed. Risers installed at points 17, 18, 19, 20, and 21.
Discharge = 2000 cfs Elev Upper Pool = 458.5
Normal Max Time of Rise Elev Elev Seconds
415.0 489.0 164
440.0 481.9 164
442.0 479·5 170
446.0 474.1 175
449.5 468.7 181
452.0 466.2 181

Table 16
ELEVATION OF HYDRAULIC GRADE LINE FOR GRAVITY FLOW CONDITIONS
Discharge = 18oo cfs Outlet Sewer Uncontrolled
Piez Original Revised Intake Revised Intake and No. Conditions Transition Outlet Transitions
1 422.0 421.0 419.0 2 422.0 420.8 418.6 3 421.0 421.0 419.0 4 421.0 420.5 418.4 5 421.0 420.5 418.4 6 420.6 420.0 418.2 7 421.0 420.0 418.3 8 420.0 420.0 418.0 9 421.0 418.5 417.0
10 420.0 420.0 418.0 11 420.0 420.0 418.0 12 421.0 420.2 418.5 13 421.0 419.0 418.0 14 419.0 418.5 417.0 15 420.0 419.8 418.0 16 421.0 422;0 420.0 17 421.0 422.0 420.0 18 421.0 422.0 420.0 19 421.0 422.0 420.0 20 421.0 422.0 420.0 21 422.0 422.5 420.4 22 422.0 420.5 420.5 23 422.0 422.0 420.4 24 422.0 422.5 420.4 25 423.0 422.8 421.0 34 422.0 422.5 421.0 35 422.0 422.5 421.0 49 423.0 423.0 421.4 50 4o7.0 4o7.0 408.5 51 398.6 399·5 4o0.5 52 398.6 399.5 4oo.o 53 410.0 4o9.0 410.0 54 4o9.o 4o9.0 409.5 55 4o9.o 4o8.o 4o9.0 56 4o9.0 409.0 4o9.0 57 420.0 420.5 417.0 58 417.0 418.0 415.5 59 419.0 419.5 417.5 6o 416.0 416.0 417.5 61 417.0 417.0 416.5 62 411.0 411.0 412.8 63 413.0 413.0 416.8 64 414.0 414.0 415.5 65 414.0 414.0 416.8 66 414.0 414.0 415.5 67 414.0 414.0 414.0 68 415.0 415.4 415.8 69 415.0 415.2 414.5 70 415.0 415.4 415.8 71. 422.0 422.4 421.0 75 422.0 422.4 420.8 76 423.0 423.0 421.4 77 423.0 423.0 421.4 78 423.0 423.0 421.4
Note: Piezometer locations are shown on plate 19.

Piez No.
1 2 3 4 5 6 7 8 9
10 11 12 13 14 15 16 17 18 19 20 21 22 23 24 25 34 35 49 50 51 52 53 54 55 56 57 58 59 60 61 62 63 64 65 66 67 68 69 70 71 75 76 77 78
Table 17
ELEVATION OF HYDRAULIC GRADE LINE FOR PUMP FLOW CONDri'IONS
Discharge = 1800 cfs
Original Conditions
420.0 419.4 419.8 418.0 418.0 417.6 418.6 418.0 418.0 418.0 418.4 419.0 417.6 417.0 418.0 418.0 419.0 419.4 419.0 420.0 421.0 420.0 419.0 419.6 421.0 448.4 448.0 420.6 430.5 417.0 417.0 424.0 428.0 428.4 428.4 438.0 437-0 435.0 433-0 420.8 426.0 431.0 431.0 430.5 431.0 431.0 431.2 432.4 432.8 449.0 448.0 420.0 421.8 421.2
River Stage = 430.0 ft msl
Revised Intake Transition
418.5 418.4 418.5 418.0 418.0 417.8 417.8 417.8 417.5 417.5 417.5 417.8 417.0 416.0 417.0 418.5 418.5 418.5 418.5 418.5 419.0 419.0 419.0 420.0 420.0 452.0 451.0 420.5 431.0 415.0 418.0 420.0 428.6 426.0 429.0 439.0 437.0 436.0 433-0 430.0 427.0 431.0 431.0 431.0 431.0 431.0 432.0 432.0 432.0 449.2 448.2 420.5 420.5 420.5
Revised Intake and Outlet Transitions
418.5 418.4 418.5 418.0 418.0 417.8 417.8 417.8 417.5 417.5 417.5 417.8 417.0 416.0 417.0 418.5 418.5 418.5 418.5 418.5 419.0 419.0 419.0 420.0 420.0 452.0 451.0 420.5 431.0 420.0 420.0 424.6 42~L4 429.0 428.8 433.6 433.6 434.0 435.0 434.4 427.2 433.2 432.0 433.0 432.2 431.6 432.4 429.6 432.6 446.6 446.0 433.6 433.6 433.6
Note: Water-surface e1.evation in sump mintail:led at 420.0 ft msl at upper end. Piezometer locations are shown on plate 19. ·

Piez No.
1 2 3 4 5 6 7 8 9
10 11 12 13 14 15 16 17 18 19 20 21 22 23 24 25 34 35 49 50 51 52 53 54 55 56 57 58 59 6o 61 62 63 64 65 66 67 68 69 70 71 75 76 77 78
Table 18 ELEVATION OF HYDRAULIC GRADE LINE FOR PUMP FLOW CONDITIONS
Discharge = 575 cfs*
Original Conditions
420.2 417.6 420.2 420.1 420.1 420.0 420.1 420.0 420.1 420.1 420.1 420.2 420.0 419.8 420.0 420.1
420.2 420.2 420.2 420.2 420.4 420.4 420.4 420.4 460.2 460.1 420.0 458.2 456.8 456.8 457·5 458.0 457.9 458.0 459.0 458.8 458.7 458.0 457.7 458.3 458.2 458.2 458.2 458.1 458.3 458.2 458.7 458.3 46o.2 46o.o
River Stage = 458.3 ft ms1 Revised Intake
Transition
419.0 419.0 419.0 419.0 419.0 419.0 419.2 419.2 420.2 419.2 419.4 419.6 419.0 419.4 419.8 420.2 421.8 420.4 420.2 420.2 420.8 420.2 420.2 420.4 420.4 46o.2 460.1 421.4 458.0 456.6 456.6 457.2 457.6 457·5 457.6 458.7 458.5 458.4 458.2 457.8 457.6 458.0 457·9 458.o 458.0 458.o 458.0 458.0 458.0 459·9 459.8 421.8 422.2 422.2
Revised Intake and Outlet Transitions
419.6 419.6 419.7 419.8 419.8 419.8 419.8 419.8 419.8 419.8 419.8 419.9 419.8 419.6 419.8 420.0 419.8 420.0 419.9 420.0 420.0 420.0 420.0 420.0 420.0 460.1 460.0 419.8 458.5 457.4 457.3 458.0 458.3 455.2 458.4 459.0 453.0 459.0 459.1 457.6 458.3 458.8 458.7 458.0 458.6 458.6 458.6 457.6 456.6 .460.3 46o.o 420,0 420.0 420.0
Notes: Water-surface elevation in sump maintained at 420.0 ft mal at upper end. Piezometer locations are shown on plate 19.
* Maximum quantity of water that could be pumped due to piling up of water in upper end of discharge channel. ·

Table 19
WATER-SURFACE ELEVATIONS IN PUMPING PLirnT
Pumps Operating Pumps Operating Discharge = 1800 cfs Gravity Flow Discharge = 575 cfs Tailwater = 430.0 Discharge = 1800 cfs Tailwater = 458.3
Revised Revised Revised Compartment Revised Intake and Revised Intake and Revised Intake and
No. Original Intake Outlet Original Intake Outlet Original Intake Outlet
l 420.0 Same 420.0 422.0 Same 420.5 420.0 Same 420.0 2 420.0 as 420.0 422.5 as 420.8 420.0 as 420.0 3 420.0 Original 420.5 422.5 Original 421.0 420.0 Original 420.0 4 421.0 421.0 422.5 421.2 420.0 420.0 5 421.0 421.0 422.6 421.4 420.0 420.0 6 421.0 421.0 422.6 421.5 420.0 420.0 7 450.6 448.0 459.8 46o.o 8 450.6 448.0 459.7 460.0 9 450.0 447.0 459.6 459·9
10 4-48.2 445.8 459.4 459.8 11 447.0 445.0 459-2 459-5 12 1.46.5 444.0 459.1 459-3 13 446.0 443.5 458.9 459.2 14 1~39 .0 436.8 422.0 421.0 458.2 458.4 15 438.4 436.0 422.0 420.0 458.0 458.4
Notes: The water-surface elevations are average for each compartment. For compartment locations see plate 15.

Piez No.
1 2 3 4 5 6 7 8 9
10 11 12 13 14 15 16 17 18 19 20 21 22 23 24 25 34 35 49 50 51 52 53 54 55 56 57 58 59 60 61 62 63 64 65 66 67 68 69 70 7J.
Tab1e 20
EFFECT OF ENLARGED SWICE GATE ON HYDRAULIC GRADE LINE
FOR GRAVITY FLOW CONDITIONS
Discharge = 1800 cfs River Stage Uncontrolled
Revised Intake and Outlet Transitions
Original Gate Opening
419.0 418.6 419.0 418.4 418.4 418.2 418.3 418.0 417.0 418.0 418.0 418.5 418.0 417.0 418.o 420.0 420.0 420.0 420.0 420.0 420.4 420.5 420.4 420.4 421.0 421.0 421.0 421.4 4o8.5 4o0.5 4oo.o 410.0 409.5 4o9.0 4o9.0 41.7.0 415.5 417.5 417.5 416.5 412.8 41.6.8 41.5.5 416.8 415.5 41.4.0 415.8 414.5 415.8 421..0
Note: Piezometer locations are shown on plate 19.
Enlarged Gate Opening
418.7 418.4 418.6 418.1 418.0 417.7 417.8 417.6 417.0 416.9 417.3 417.6 416.9 416.1 416.9 419.5 419.5 418.6 419.3 419.5 420.1 420.2 420.0 420.0 420.8 420.5 420.5 421.0 4o8.o 4oo.5 4oo.1 4o9.5 4o8.5 4o8.5 4o9.0 417.7 416.4 417.3 417.8 416.4 412.5 416.7
.415.6 415.9 415.6 413.7 415.5 415.3 415.5 420.5

Table 21
EFFECT OF ENLARGED SLUICE GATE ON WATER-SURFACE ELEVnTIONS
FOR GRAVITY FLOW CONDITIONS
Discharge = 1800 cfs River Stage Uncontrolled
Revised Intake and Outlet Transitions
Compartment No. Original Gate Opening Enlarged Gate Opening
1 420.5 420.0
2 420.8 420.4
3 421.0 420.6
4 421.2 420.7
5 421.4 420.9
6 421.5 421.0
14 421.0 421.0
15 420.0 420.0
Notes: The water-surface elevations are average for each compartment. For compartment location see plate 15.

Table 22
EFFECT OF REVISIONS TO PUMP DISCHARGE CHANNEL ON HYDRAULIC GRADE LINE
Piez No.
50 51 52 53 54 55 56 57 58 59 60 61 62 63 64 65 66 67 68 69 70
Revised Intake and Outlet Transitions
Discharge = 1800 cfs River Stage = 430.0 ft msl
Modified Step West Baffles Removed
428.0 421.0 421.0 428.3 428.5 428.9 429.5 436.2 436.1 434.6 436.0 434.0 428.2 433.6 432.8 433.2 432.9 431.4 432.8 432.6 432.8
Discharge = 740 cfs River Stage = 458.3 ft msl
Modified Step West Baffles Removed
458.0 456.7 456.8 457.9 458.0 457.8 457·9 459.0 459.0 458.9 459.1 458.9 457.8 458.8 458.5 458.7 458.6 458.4 458.5 458.5 458.5
Note: Locations of piezometers are shown on plate 19.
Discharge = 920 cfs River Stage = 458.3 ft msl
Modified Step West Baffles Removed
Relief Opening Installed
458.4 457.1 457.0 458.1 458.1 458.0 458.1 459.0 458.9 458.8 459.0 459·3 458.1 458.8 458.6 458.6 458.6 458.4 458.6 458.6 458.6

Compartment No.
1 2 3 4 5 6 7 8 9
10 11 12 13 14 15
Table 23
EFFECT OF REVISIONS TO PUMP DISCHARGE CHANNEL ON
WATER-SURFACE ELEVATIONS IN PUMPING PLANT
Revised Intake and Outlet Transitions
Discharge = 1800 cfs River Stage = 430.0 ft msl
Modified Step West Baffles Removed
420.0 420.0 420.0 420.0 420.0 420.0 442.9 442.6 441.8 440.3 439.6 438.7 438.0 438.0 437.8
Discharge = 740 cfs River Stage = 458.3 ft msl
Modified Step West Baffles Removed
420.0 420.0 420.0 420.0 420.0 420.0 460.0 459.8 459·7 459.4 459.2 459.0 458.8 458.2 458.0
Note: Locations of compartments are shown on plate 15.
Discharge = 920 cfs River Stage = 458.3 ft msl
Modified Step West Baffles Removed
Relief Opening Installed
420.0 420.0 420.0 420.0 420.0 420.0 46o.o 459·9 459.8 459.4 459·3 459.1 458.6 458.6 458.5

Table 24
EFFECT OF REMOVAL OF BAFFLE WALLS FROM DISCHARGE CHANNEL
ON WATER-SURFACE ELEVATIONS IN PUMPING PLANT
Revised Intake and Outlet Transitions
South Baffles Removed to Elev 445.0 South Baffles Completell Removed Relief OEening Closed Relief Opening Operating Relief Opening Closed Relief 0Eening Operating
Compart- Q = 925 Q = 1350 Q = 1050 Q = 1670 ment Q = 1800 (max) Q = 1200 (max) Q = 1800 (max) Q = 1200 (max) No. RS = 430.0 RS a 458.3 RS = 458.3 RS • 458.3 RS = 430.0 RS = 458.3 RS = 458.3 RS = 458.3
1 420.0 420.0 420.0 420.0 420.0 420.0 420.0 420.0 2 420.0 420.0 420.0 420.0 420.0 420.0 420.0 420.0 3 42o.oJ·. 420.0 420.0 420.0 420.0 420.0 420.0 420.0 4 420.0 420.0 420.0 420.0 420.0 420.0 420.0 420.0 5 420.0 420.0 420.0 420.0 420.0 420.0 420.0 420.0 6 420.0 420.0 420.0 420.0 420.0 420.0 420.0 420.0 7 444.0 459.2 459.2 459.4 440.1 459·3 459.0 459.8 8 443.4 459.2 459.2 459.4 439·7 459·3 459.0 459·7 9 442.7 459.1 459.1 459·3 439.6 459·5 458.9 459.6
10 441.6 459.0 458.8 458.9 439.1 459.2 458.8 459·5 11 439.0 458.8 458.6 458.6 437.6 459.1 458.7 459.!+ 12 438.5 458.7 458.4 458.4 437.4 459.0 458.6 459.2 13 438.0 458.5 458.4 458.4 437.1 459.0 458.6 459.0 14 437.8 458.5 458.3 458.3 436.5 458.9 458.6 459.1 15 437.5 458.5 458.4 458.3 437.6 459.1 458.8 459.2
Notes: Locations of compartments are shown on plate 15. All elevations in ft msl.

Table 25
WATER-SURFACE ELEVATIONS IN PUMPING PLANT WrrH STRurS
IN SOUTH CHANNEL REPLACING BAFFLE WALLS
Revised Intake and Outlet Transition
Compartment No.
Discharge = 1200 cfs River Stage = 458.3 ft msl
Discharge = 1800 cfs River Stage = 430.0 ft msl
1 2 3 4 5 6 7 8 9
10 11 12 13 14 15
420.0 420.0 420.0 420.0 420.0 420.0 459.2 459.2 459.1 459.0 458.9 458.7 458.5 458.7 458.7
420.0 420.0 420.0 420.0 420.0 420.0 440.7 44o.o 439-7 439-5 438.0 437·7 437·3 436.3 437-9
Notes: Locations of compartments are shown on plate 15. Spillway crest removed from south channel stepdown. Fillet still in southwest corner.

Table 26
EFFECT OF REMOVAL OF BAFFLE WALLS FROM SUMP CHAMBER
ON WATER-SURFACE ELEVATIONS IN PUMPING PLANT FOR GRAVITY FLOW
Enlarged Gate Opening
Revised Intake and Outlet Transitions
Discharge = 1800 cfs Bottom of Sump Baffles
Compartment Bottom of Sump Baffles at Elev 415.0 No.
1
2
3
4
5
6
14
15
at Elev 420.0 East* West*
420.0 420.0 420.0
420.5 420.0 420.5
420.6 420.2 420.8
420.8 420.5 421.0
420.9 420.5 420.5
421.0 420.4 420.4
420.2 420.0 420.0
420.2 420.0 420.0
*Denotes average water-surface elevation measured along east and west sides, respectively, of each compartment.
Note: Locations of compartments are shown on plate 15.

Piez ~
1 2 3 4 5 6 7 8 9
10 11 12 13 14 15 16 17 18 19 20 21 22 23 24 25 49 50 51 52 53 54 55 56 57 58 59 60 61 62 63 64 65 66 67 68 69 70
Table 27
EFFECT OF EEMOV AL OF BAFFLE WALLS FROM SUMP CHAMBER
ON ELEVATION OF HYDRAULIC GRADE LINE FOR GRAVITY FLOW CONDITIONS
Enlarged Gate Opening
Revised Intake and Outlet Transitions
Discharge = 1800 cfs Bottom of Sump Baffles Bottom of Sump Baffles
at Elev 415.0 at Elev 420.0
418.5 418.0 418.1 417.5 417.3 417.1 417.3
416.8 416.9 417.1 417.1 416.9 416.0 416.9 418.8 419.0 419.3 419.0 418.9 419.8 419.9 419.9 420.0 420.2 420.2 407.7 4oo.o 4oo.o 410.0 409.0 4o8.4 4o8.9 417.6 416.4 417.1 418.1 416.7 412.5 416.7 415.6 416.0 415.6 413.9 415.6 415.5 415-7
418.6 418.3 418.6 418.1 418.0 417.4 417.9 417.5 417.0 417.0 417.3 417.5 416.8 416.1 417.0 419.4 419.5 419.5 419.4 419.5 420.0 420.0 420.2 420.0 420.3 420.8 4o8.o 400.5 4oo.1 4o9.5 4o8.5 4o8.5 4o9.0 417.7 416.4 417.3 418.2 416.4 412.5 416.7 415.6 415.4 415.6 413.7 415.5 415.3 415.5
Note: Location of piezometers shown on plate 19.

Discharge Sewer cfs
Existing 1200 n = 0.16 Total Q =
1800 cfs
Proposed 6oo 72 in. Total Q = n = .013 1800 cfs
Existing 356 n = .016 Total Q =
1200 cfs RS = 458.~
Proposed 179 72 in. Total Q = n = .013 1200 cfs
RS ::: 458.3
Table 28
CO:MPUTED FLOW LOSSES IN PROTOTYPE OUTFALL SEWER LINES - SUMP TO EXIT
DISTRIBUTION OF FLOW COMPUTED FROM VELOCITY MEASUREMENTS
GRAVITY FLOW
Area Entrance in Head Loss Loss Contraction Enlargement Bend Loss
Section Sq ft in Pipe K = 0.5 Loss Loss Jil._ ]}£
A 88.6 0.88 1.43 B 49.3 3.14 0.88 0.81 0.46 0.46 c 54.3 0.98
A 28.3 2.95 3.48 B 28.3 1.97 0.35 0.35 c 28.3 0.89
A 88.6 0.08 0.08 B 49.3 0.28 0.06 0.07 0.04 0.04 c 54.3 0.09
A 28.3 0.26 0.21 B 28.3 0.18 0.06 c 28.3 0.08
Exit Total Loss Loss
2.31 5·75
7.62 8.60 lb.bb b.43 2.67
6.96 7.85 lb.95 0.16 0.49
0.67 0.76 1.41 o.47 0.24
0.62 0.70 1.41
Notes: Distribution for flow of 1200 cfs determined as follows: Total flow (1200) less flow through relief opening (665) =flow through sewers (535). This flow was distributed between existing sewer and proposed sewer in same ratio as for gravity flow at 1800 cfs.
The 72-in. sewer assumed to have same slope as existing sewer and a constant area. Pipe assumed flowing full.

Table 29
COMPUTED FLOW LOSSES IN PROTOTYPE OUTFALL SEWER LINES - SUMP TO EXIT
DISTRIBUTION OF FLOW COMPUTED FROM VELOCITY MEASUREMENTS
PUMP FLOW
Area Entrance Discharge in Head Loss Loss Contraction Enlargement Bend Loss Exit Total
Sewer cfs Section Sq ft in Pipe K = 0.5 Loss Loss JlL Jl£ Loss Loss
Existing 1360 A 88.6 1.13 1.29 2.42 n = .016 Total Q = B 49.3 4.04 1.73 1.05 0.59 0.59 8.00
1800 cfs c 54.3 1.25 9.76 11.01
Proposed 44o A 28.3 21.43
2.42 1.32 3.74 72 in. Total Q = B 28.3 1.61 0.19 0.19 1.99 n = .013 1800 cfs c 28.3 0.73 3.76 4.49
10.22 Existing 405 A 88.6 0.10 0.11 0.21 n = .016 Total Q = B 49.3 0.36 0.12 0.10 0.055 0.055 0.69
1200 cfs c 54.3 0.11 0.87 0.98 1."88
Proposed 130 A 28.3 0.21 0.11 0.32 72 in. Total Q = B 28.3 0.14 0.015 0.015 0.17 n = .013 1200 cfs c 28.3 0.06 0.33 0.39
o:-gg
Notes: Distribution for flow of 1200 cfs determined as follows: Total flow (1200) less flow through relief opening (665) =flow through sewers (535). This flow was distributed between existing sewer and 72-in. sewer in same ratio as for pump flow at 1800 cfs.
The 72-in. sewer assumed to have same slope as existing sewer and a constant area. Pipe assumed flowing full.

Table 30
ELEVATION OF HYDRAULIC GRADE LINE AT
UPPER END OF OUTFALL LINES
Computed Computed Model Elev msl Elev msl
Location Elev msl Dist A Dist B
Gravity Flow - 1800 cfs
Exist. Sewer Piez. 70 415.5 413.2
72 -in. Sewer Piez. 56 409.0 408.6
Pump Flow - 1800 cfs
Exist. Sewer Piez. 70 432-3 442.1 446.2
72-in. Sewer Piez 56 428.2 436.0 434.8
Pump Flow - 1200 cfs
Exist. Sewer Piez. 70 458.5 459.2 459·7
72-in. Sewer Piez. 56 458.0 458.9 458.7
Note: Elev at piezometer 70 is average of piezometers 68 and 70. Elev at piezometer 56 is average of piezometers 54, 55, and 56. Distribution A is the distribution of flow as indicated in
table 28. Distribution B is the distribution of flow as indicated in
table 29. All measurements are in prototype units.
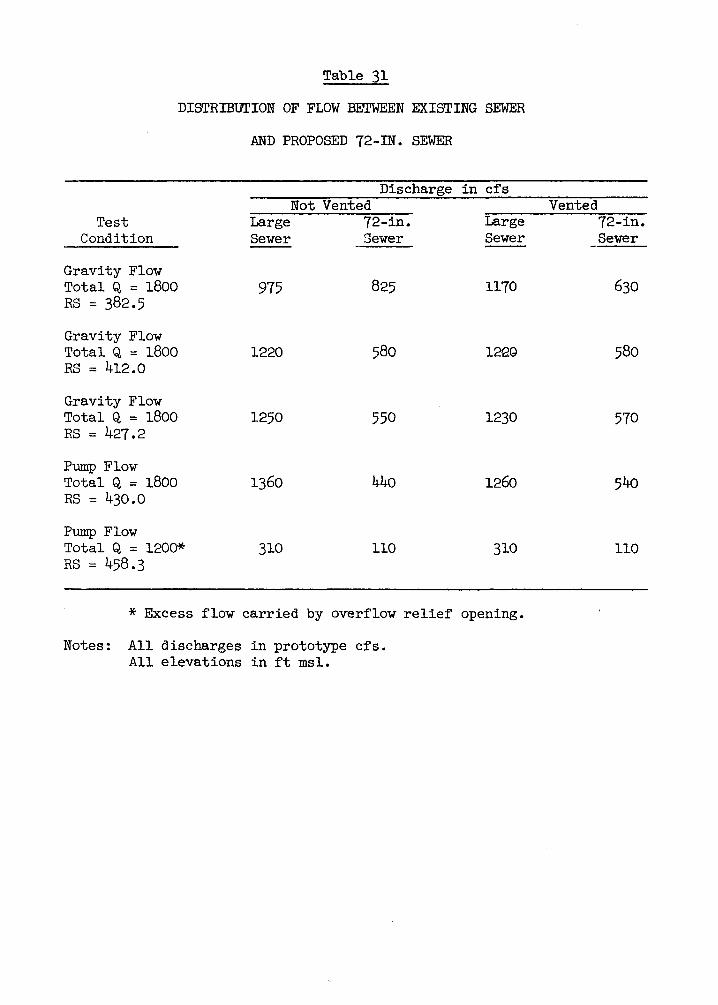
Table 31
DISTRIBUTION OF FLOW BETWEEN EXISTING SEWER
AND PROPOSED 72-IN. SEWER
Discharge in cf's Not Vented Vented
Test Large 72-in. Large 72-in. Condition Sewer Sewer Sewer Sewer
Gravity Flow Total Q = 1800 975 825 1170 630 RS = 382.5
Gravity Flow Total Q = 1800 1220 580 12eG 580 RS = 412.0
Gravity Flow Total Q = 1800 1250 550 1230 570 RS = 427.2
Pump Flow Total Q = 1800 1360 440 1260 54o RS = 430.0
Pump Flow Total Q = 1200* 310 110 310 110 RS = 458.3
* Excess flow carried by overflow relief opening.
Notes: All discharges in prototype cfs. All elevations in ft msl.

~ I
NORTH ELEVATION
NOTI!. : ALL UNITS ARE IN THEIR PROTOTYPE EQUIVALENTS
WEST DISCHARGE CHANNEL
CPROPOS£1) 72' SEWER
, ---:±::::3 E:-": E----
DETAILS OF STATE FAIRGROUNDS PUMPING PLANT
25 0 --- 25 50 75 rT I

~ ~ PLAN
~ld T ELEVATION ELEVATION END
RISER AND LATERAL
NOTE.: MODEL CONSTRUCTED OF PLASTIC TUBING AS INDICATED.
MODEL INITIALLY CONSTRUCTED OF 0.~1 TUB INC THROUGHOUT LOWER SECTION LATER CHANGED TO 0.33' TUBING AS SHOWN.
LATERAL AND RISER WERE ADDED AFTER INITIAL TESTS.
AU.. OtMENSIONS ARE GIVEN IN MODEL UNITS.
SUMMARY OF LATERALS AND RISERS
LOCATION POINT
17 18 IV
20 21
L.ATERAf... RISER NUMBER SIZE NUMBER SIZE
2 0.1867' O.IM'P 0.2083' 0.0888' O.l&e7'
0.251
0.25' Q26' 0.25' 0.25'
SECTION A-A
TUBING DETAILS
MODEL LAYOUT SURGE STUDY
SOUTHERN OUTFALL SEWER
SCALES
PROTOTYPE4li 0 32 96 160 224 288fT
MODEL l W U U 6 L.JrT

'l:J r ~
SECTION B-B
PLAN
NOTE ALL. OIMENSfONS ARE GIVEN IN MODEL UNITS .
MODEL LAYOUT STATE FAIRGROUNDS PUMPING PLANT
LOUISVILLE. KENTUCKY INITIAL CONDITION
~
PROTOTYPE 10.6 =-=0
--10::8 =='32--4~·==~64:.....,::80 FT
MODEL [11
w~----------------------------------------------------_j

~'-,;----WuUIIiilliliMII!MiiMiMIIIIiliiJiilliiillliiiiM••u•l•~·~l- • *'._'.'''f'tM,.,..'!I~~~~~~~~Jwldl PRESSURE CELL "C" ·- - -·
.._ ......................... ·- ............. _ ... .......,_ """"' ... - --~· -~ .. ~,... .......... PT 18 :a- J. -, · • 0.381\F • .042"
'•
• 96Ps1L.,.._ .. lo
til 1-a: C<ll 1-Z til-
til wo >.J ;~,u
>
PLATE 4
NOTE: THE ABOVE STEPPED LINES REPRESENT 0.1 OHM RESISTANCE CHANGE IN THE GAGE· CIRCUIT. CORRESPONDING HEAD DIF· FERENTIAL IS INDICATED.
RECORDING OF CALIBRATION OF PRESSURE CELL
11 tV
>-_, _, :::>0 ......
<II wo >.J .JU -< >
Q • 2,000 CFS
CELL B
ELL D
NOTE: LINES ABOVE BASELINE INDICATE NORMAL OPERATING PRESSURE. LINES BELOW BASELINE INDICATE BELOW NORMAL OPERATING PRESSURES.
OSCILLOGRAPH RECORDING FOR CLOSURE OF VALVE
TYPICAL OSCILLOGRAPHS FOR
MEASUREMENT OF PRESSURES

0.0100
0.0095
C: II) 0.0090 ij z
~ :::;
~ z J: "Q0085 :::> fi
0.0075
1-
1-
1-
r-
r-
r-
1-
r-
1-
r-
1-
r-
1-
r-
1-
1-
1-
r-
1-
r-
1-
r-
1-
1-
0.0070 0
I I I I 1.0
I I I I I 0.0100
--
-
\ -
00095
\
I I I I
~
~ ~ r---
I I I I I I I I 2.0 3.0 4.0
I I I I I I I I 5.0
0.0075
OIJ(JfO 6.0
MODEL VELOCITY IN FEET PER SECOND
COEFFICIENT OF ROUGHNESS FOR
PLASTIC TUBING
PLATE 5

45 0
300
15 0
0
-150
450
w300 s ~ 15 0
~ \1
0
t= -15 0
~ ~45 0
<i 300
~ 15 0 z
~ 0
... 0 z -15
Q !;(450 ii' ~ 300 J: ~ 150
0
50 L~ a: ~450 :g z 3 00 5 a. I
~
Jl! " ~ -1 w a: a. 4
50
0
50
50
3 00
50
0
50
0
NOTE:
I I I I I I I I V : VELOCITY Of PROPAGATION
OF PRESSURE WAVE.
L: 9,700 FEET.
21.. v
If \. PTI .--./
v r---.. ........... v -
I \ 1--PT/6 .._.
I f\.. I/ ..........
~ _...!-" )'.... _..
1\ ....-- f'"l!;
1'--... v r-r-t---.. f-1-- I'--1'--1-. 1.--~ -
( '\ PT2 -...-- I-- I'-
rr !'.... / ['..
"r-..... 7 -r--- 1--
1'\ PT2 l-- -I" L-v 'I'-.
"' 17 -r--"""- !-"
\.. 1--- PROTECTION LE'V££ v 1--- .......... r--.. \ ..... ~ ["...
!'.. / I"-r-1--.,;
1.0 2.0 3.0 4.0 5.0 e.o 7.0 eo 9.0 10.0 11.0 12.0 130 14.0 15.0
ELAPSED TIME IN SECONDS FROM END OF' VALVE CLOSURE
VELOCITY 6.96 f'T PER SEC.
TIME Of' VALVE CLOSURE 0.944 SEC. MODEL CONSTRUCTED Of' 6-IN. TUBINI; THROUGHOUT.
NO LATERALS OR RISERS. ALL VALUES I;IVEN IN PROTOTYPE UNITS.
PRESSURE WAVES FOR SUDDEN CLOSURE OF VALVE
6-INCH TUBING DISCHARGE. 1400 CfS
PLATE 6

45 0
300
w 0:
15
-15
45
:J 30 ~ l\1 "- 15
"' z ~ ffi -15 "-0 45 _j
" ~ 30
~
~ 0: "z
15
0 -15 ~
" Ci 45 ;;
0
0
0
0
0
0
0
0
0
0
0
0
0
0
{ I
,...
I
/
2L v
I( [\ p 17
\ v 1'.
...- \ / i>T.'
\V 1'--
k' /
....._
-......,
V =VELOCITY OF PROPAGATION OF PRESSURE WAVE.
L = 9,100 FEET.
v !"-1'--~ 1-r-
-v .........
"r--.. v 1--
PT:I -1--1--..
.. /"" --1--:-... -~ v 1-- ..._ -T2!
' 30 r u
0
If ["-< ~ 15
w 0:
!3 a VI -15 a: w "- 45
l3 3 30 0 "- IS ?
~ ~ -15 w a:
0
0
0
0
0
0
0
0
0. 45 0
30 0
15 0
0
-15 0
0
NOTE:
1"'- / i-""' 1'--
I'- v r-- r-- t--t-- ,..._
/PT 2 D. L
\ v 1-- .......
I\ v " '"""
v -........ r--1-t--
r---, PROTECnON L£VE£
IY ,.--1-- !'...
\ / ['-._ ..........
./
1.0 2.0 3.0 40 50 60 7.0 ao 90 100 11.0 12.0 130 14.0 15.0
ELAPSED TIME IN SECONDS FROM END OF VALVE CLOSURE
VELOCITY 8.93 f'T PER SEC.
TIME Of' VALVE CLOSURE 0.944 SEC.
MODEL CONSTRUCTED Of' 6-IN. TUBING THROUGHOUT.
NO LATERALS OR RISERS. ALL VALUES GIVEN IN PROTOTYPE UNITS.
PRESSURE WAVES FOR SUDDEN CLOSURE OF VALVE
6-INCH TUBING DISCHARGE 1800 CFS
PLATE 7

V =VELOCITY OF PROPAGATION OF PRESSURE WAVE.
L = 9,700 FEET.
2L v
300 1/ 1\ \ .-----
[/7
15
'-. v I'-b, ........ ......_ ,..._
-15 r-... -45 ...-h
3 \ I '(...--
PTt. 1----
15
I 1'- " r-0 I' -......
=- f-f.- r--150 r---
4
300 [\
\ v T/9 v !"""--150 v
I 1'-1-- v t-1-0
f'-,... ~ f-r-- r--<50 t:::-t:-
450
300 If 1\ v ''
!50 r-- -....... ['., / "!'-.
0
I'\.. v 1"-t::: -150 !::::::, --~-- L--
450
( 300 r'\
\ ~ Pr2
I ./"
0 l 1\ v ""' -15
['.. v f'.. t-
,..._ L-- r-
450 -300 PROT£CT/ON LEV££
~ - ~ ['.. 150
\ v L'--. 0
-150 \ / r-........
"'-- /
0 1.0 2.0 3.0 4 . .0 5.0 e.o 7.0 6.0 90 100 11.0 120 130 14.0 150
ELAPSED TIME IN SECONDS fROM END OF VALVE CLOSURE
NOTE;
VELOCITY 9.93 FT PER SEC.
TIME OF VALVE CLOSURE 0.944 SEC.
MODEL CONSTRUCTED OF 6-IN. TUBING THROUGHOUT.
NO LATERALS OR RISERS.
ALL VALUES GIVEN IN PROTOTYPE UNITS.
PLATE 8
PRESSURE WAVES FOR SUDDEN CLOSURE OF VALVE
6-INCH TUBING DISCHARGE 2000 CFS

45 0
300
150
-15 0
450
300
150
0
450
w 30
"' " ~ 15 w
"' 0.
C>
~-IS
"' w 45 (1.
0 _J 30 ~ ::; "' 15 ~
~ .._ ;s z § 45
~ 30 > 5 15 ~ w
"' " § ;5
~ 45
~ 30 z " 0 15 (1.
:<: w
"' ~ -15
"' ~150 (1.
100
50
-50
0
0
0
0
0
0
0
0
0
0
0
0
0
0
0
0
0
0
0
0
0
0
0
0
-2.0
NOTE:
r\ \ - PT./7
1\ /
\ 1/ ......._ /
......._ -~ r-
(
I I '--1"\ \.. r---- fr18 /"'
1/ \ r 1,.-, / 1-" '-.. ,....-~
n r-
I '-- r-- t.-- 1- jPTt9
I 1\ / v
I \ II /
" 1-v h 1'--- 1'-- -v
\1--- r-.... L.-h ,___ ,.____. fc2
1\ / !--~-"'"
~ v I'
--......
1\ I/"' v
1\-+-- j- PT. 21 IN 6* SECTION 1--
\ v ]'... v
1\ \
1\-+-- I PT. 21 IN .,. SECTION
\ / ~
Ill) -~ "*"TECTION LEVEE
..,J '\ /
I'-.. v -
-1.0 0 1.0 2.0 3.0 40 5.0 &.0 7.0 ao 9.0 100 11.0 12.0 13.0
ELAPSED TIME IN SECONDS FROM END OF VALVE CLOSURE
VELOCITY IN O-IN. SECTION 6.90 fT PER SEC.
VELOCITY IN 4-IN. SECTION 15.67 fT PER SEC.
TIME Of VALVE CLOSURE 0.944 SEC.
MODEL CONSTRUCTED Of 4-IN. AND 6-IN. TUBING. NO LATERALS OR RISERS. ALL VALUES GIVEN IN PROTOTYPE UNITS.
PRESSURE WAVES FOR SUDDEN CLOSURE OF VALVE
LOWER SECTION OF 4-INCH TUBING DISCHARGE 1400 CFS
PLATE 9

60 0
4SO
30
15
-IS
4S
30 ... cr ~ 15
"' ... cr Q,
" ~ -15 \( fi 45 Q,
0 .J 30 .. :l; cr 15 0 z
~ a: ll,_ -15 z Q 45 \(
~ 30 ';' 0 15 ;;:; w a: .. 5-rs
"' ffi 45 Q,
~ 30 z 6 15 Q,
"
0
0
0
0
0
0
0
0
0
0
0
0
0
0
0
0
0
0
0
0
0
0
0
-1 so
15 00
10 00
so 0
0
-5 00
-20
NOTE:
\ v PT/
r / \ .r - /
."-.,. v ....--
\ " '-- \_ 1--- ~TI
1/ ~ 1/
I'-' ~"---r-.. 1'\ -lr '-v
\... \.. - PT/9
\ v I I \ ~
/ 1---1--
1'--- r-. v j_J I'- -....... ~I\
1 1--- ~T2
---~ --1\ \ :--1-
,_. \ '-... L/
L, 1\ /I--
,, - v \ 1--
'PT 21 (IN 6" SECTION) v !'.,
/It r--- 1-v
't-" K PROTECTION LEV£~ ,
l) '\ /" v "-.. --
-1.0 0 10 20 30 40 so 60 70 8.0 90 10.0 110 120 13.0
ELAPSED TIME IN SECONDS FROM END OF VALVE CLOSURE
VELOCITY IN &-IN. SECTION 8,g3 fT PER SEC. VELOCITY IN 4-IN. SECTION 20.og fT PER SEC,
TIME Of VALVE CLOSURE o.g44 SEC. MODEL CONSTRUCTED Of 4-IN. AND &-IN. TUBING. NO LATERALS OR RISERS. ALL VALUES GIVEN IN PROTOTYPE UNITS.
PRESSURE WAVES FOR SUDDEN CLOSURE OF VALVE
LOWER SECTION OF 4-INCH TUBING DISCHARGE 1800 CFS
PLATE fO

e 00
400
2 00
0
-2 00
eo
4 00
20
0
-200
6
00
0
00
00
00
00
0
00
00
00
00
0
00
00
00
0
0
200
00
000
5 00
0
-2.0
NOTE:
~
1\--1-~n
I f\ v-f'.- -
_[_
I \...h I \.. f.-- PT/8
:I \ / 1-" ........... /
"\ \.V h
1\- f-- ~T/9
\ v--1'.. v
In r-- v
/
1.--f--.--- ~T2C
\
""" v
r' ,....._
\ i/' - -'\ PT 21 (IN 6'UcT!ON)
\--~ ( 1'-. v
1\ '-
\ PT 21 ( N 4' SECTKJI;}
\ v LV
\ / Pf/OT£CTION LEV££
J '\/
' v
0 1.0 2..0 30 4.0 5.0 60 7.0 8.0 90 10.0 11.0 120 l:l 0
ELAPSED TIME IN SECONDS F'ROM ENO Of VALVE CLOSURE
VELOCITY IN 6-IN. SECTION 9.93 FT PER SEC.
VELOCITY IN 4-IN. SECTION 22.35 FT PER SEC.
TIME OF VALVE CLOSURE 0.944 SEC.
MODEL CONSTRUCTED OF 4-IN. AND 6-IN. TUBING.
NO LATERALS OR RISERS.
ALL VALUES GIVEN IN PROTOTYPE UNITS.
PRESSURE WAVES FOR SUDDEN CLOSURE OF VALVE
LOWER SECTION OF 4-INCH TUBING DISCHARGE 2000 CFS
PLATE 11

490r---------~---------T----------r---------~---------T----------r---------~---------,490
480~--------~--------~--------+---------+---------~~~====~~------~--------~480
wJV: ------<; R5~"" / _//RtS£R20~ -----------
4/U~--------~---------+----------r-----~~~~-------t~~~--~r---------~~~----~470 ,/:; __ / ~----~ /'l/. RIS£R!9~ ---, -
~ /~/ ·- I ____ / r----- ---....... ~
~480~--------~---------+----~/~,~~~~L--------4----------~~-~~-~~~~r---------~--------~480 ~ ! 't?<l'/1
/ ... - RIS£RI8__~::-~·-::-···::=::~·.~ ~ ::J -~,.( / ~_,...---·-·- ___ _.............;'--RISER 17 ::J
~ ···_~v ~ Q450~--------~~~----~~--------r---------~---------+----------r---------~--------~450Q
~ WI ~ ~ r=~i i i~~ ~: ~ ~ v ~ 43or-------~;f~----------t----------r---------+----------t-~-------r---------+----------1430
4201--+------+-/ ----+---l-----l----------t-----+-------l420 v 4~L---------~---------L--------~L---------~---------L--------~~--------~--------.J~o
o ~ ~ ~ ~ ~ ~ m ~
ELAPSED TIME IN SECONDS FROM END OF VALVE CLOSURE
NOTE: DISCHARGE I 800 C F S SUMP AREA 2 100 SQUARE FEET. ALL VALUES GIVEN IN PROTOTYPE UNITS. THE SUMP WATER SURFACE ELEVATION WAS 415.0
WHEN VALVE WAS CLOSED.
PLATE 12
SURGES IN SEWER LINE

w
7.9 7.9 10.2 14.7 18.2 19.5 20,6
3.9 4.5 18.2 12.4 16.0 20.0 22.4
0 3.2 6.8 11.6 15.7 18.4 21.8
MIDDLE SECTION OF INTAKE TRANSITION
INLET SEWER LINE INVERT ELEV 406.15
ELEV. 412.3
Ei.EV. 410.0
Ei.EV, 406.9
Ei.EV. 415.32
Euy 413 72
Euv. 412. 12
ELEV. 410.52
Ei.Ev. <408.92
Ei.EV. <407.32
Ei.EV. <406.88
NOTE; ALL MEASUREMENTS ARE IN THEIR PROTOTYPE EQUIVALENTS.
0 0
0 0
0 0
0 0
OUTLET SEWER LINE INVERT ELEV 405.28
TEST CONDITIONS
DISCHARGE SUMP ELEV
1800 CFS 422.0
3.2 4.6 7.2 8.5 11.6 13.6 16.0 16.6 17.6
3.2 5.6 5.11 9. 1 11.1 12.4 16.0 17.6 t7 .6
3.2 4.6 !5.6 7.2 10.2 14.4 14.4 16.0 17.6
0 0 3.2 4.5 9.1 10.2 16.o 16·0 17.11
0 0 5.8
DOWNSTREAM END OF INTAKE TRANSITION
El.Ev. 414.45
Ei.Ev. 412.85
Euv. 411.25
Ei.EV. 409.11!5
ELEV. 408.05
ELEV, 408.45
Ei.Ev, 105,81 OUTLET SEWER 72" LINE
INVERT ELEV 399.9
Ei.EV. 414,0
Ei.EV. 412.0
Ei.EV. '410.0
Euv. 406.0
Ei.EV, g.O
Ei.Ev. 404.0
\El.Ev. <403.5
Ei.EV, 404.94 Ei.EV, <404. 14 ELEV. <403.34 Ei.EV. <402. 54
Ei.EV. «) 1. 74
Ei.Ev. 400.94
Ei.EV, 400. 14
VELOCITY CROSS SECTIONS ORIGINAL CONDITIONS
GRAVITY FLOW

6.8 8.5 11.6 115.4 22.4 20.3 20.1 E!.EY. 412.3
5.1 6.4 16.0 14,0 17.9 19.8 21.0 Euv. 410.0
0 3.2 8.8 3.2 15.4 19.5 20.6 E!.EY. 406.9
MIDDLE SECTION OF INTAKE TRANSITION
INLET SEWER LINE INVERT ELEV 406.15
Et.Ey 415.32
Et.Ev. 413.72
ELEY. 412.12
Et.Ev. 410.52
Et.Ev. 408.92
E!.EY. 1()7. 32
ELEY. 406.68
NOTE: ALL MEASUREMENTS ARE IN THEIR
PROTOTYPE EQUIVALENTS.
0
0
0
0
0
OUTLET SEWER LINE INVERT ELEV 405.28
TEST CONDITIONS
DISCHARGE 1800 CFS
SUMP ELEV 420.0 RIVER STAG!; 430.0
0 0 4.15 3.2 3.2 ( Et.Ev. 414,0 7.9 9.1 9.1 12.4 15.4
0 0 3.2 5.6 9.1 10.2 12.4 15.4 lti.O 16.0 E!.EY. 412.0
3.2 4.5 4.5 5.6 9.1 9.1 14.4 14.4 16.0 17.0 Et.Ev. 410.0
0
0
0 3.2 4.5 6.4 10.2 10.2 14.4 16.0 16.0
0 0 0 3.2 9.1 10.2 13.6 15.0 16.0
0 0 3.2 4.5
DOWNSTREAM END OF INTAKE
Et.Ev. 414.45
£LEV. 412.815
Et.Ev. 411.25
E!.EV • .409.65
ELEV. 408.05
Et.Ev. 406.45
Et.EV 405 81
TRANSITION
OUTLET SEWER 72" LINE
INVERT E LEV 399.9
E!.EV, 408.0
Et.Ev. 406.0
E!.EV, 404,0
'"\ Et.Ev. 403.5
E!.EV. 404. 94 Et.Ev. 404. 14
E!.EY. 403 34 Et.Ey. 402.54
Et.Ev. 401.74
Euy 400 Q4
Et.EV. 40Q. 14
VELOCITY CROSS SECTIONS
ORIGINAL CONDITIONS
PUMP FLOW

PITOT TUBE
HORIZONTALLY
NOTE• COMPARTMENT NUMBERS ARE FOR ORIGINAl.
AND RIVISED CONDITIONS
PITOT TUBE l-OCATIONS ARE FOR ORIGINAL AND
REVISED INTAKE AND OUTLET TRANSITIONS
AI.L VAI.UIS ARI IN PROTOTYPE UNITS * PITOT TUBE VERTICALLY MOUNTED
PITOT TUBE RANGE
COMPARTMENT NUMBERS AND
PITOT TUBE LOCATIONS

PLAN
ZQQQI
ELEVATION
END VIEW OF INTAKE
REVISED INTAKE TRANSITION SCALE
RADIUS /Ql/'-+'------1\ RADIUS S29' RADIUS /S.88'·-::::j"'"-<-__::,.;.4---+=--
ELEVATION END VIEW
REVISED OUTLET TRANSITION SCALE
10 tpi'T
NOTE: ALL UNITS ARE IN THEIR PROTOTYPE EQUIVALENTS.
REVISED TRANSITIONS INTAKE AND OUTLET

""0 r ~· 111.
8.5 9.4 13.8 16,.4 17.3 17.9 17,8
3.2 8.4 13.8 14.0 17.6 18.4 17.9
5.8 7.9 10.2 1e.4 11.11 19.0 19.5
MIDDLE SECT ION OF INTAKE TRANSITION
INLET SEWER LINE INVERT E:LEV 406.15
ELEV, 412.3
ELEV, 410.0
ELEV. 408.9
ELtv. 415,32
ELEV. 413.72
ELtv. 412.12
E!.£Y, 410.!52
ELEV. 407,32
ELEV, <108.88
NOTE: AI..L MEASUREMENTS ARE IN THEIR PROTOTYPE EQUIVALENTS.
0 0
0 3.9
0 0
0, 0
0 0
OUTLET SEWER LINE INVERT ELEV 405.28
TEST CONDITIONS
DISCHARGE SUMP ELEV
1800 CFS 420.0
0 6.0 6.4 7.2 9.4 10.6 12.0 11.8 Euv. 414.0
e.1 8.4 7.2 9,1 10.2 12.0 14.4 15.4 1e.1 ELEV, 412.0
5.1 6.4 6.0 9.1 10.6 14.0 18.0 U!o4 16.4 ELtv. 410.0
0 3.2 6,0 6.8 9.4 10.8 14,0 15,7 16.4 lil.l~. !108 !l
0 0 5.1 7.9 8.!5 12.2 14.4 16.0 17.3 ELEV, 406.0
0 0 0 3.9 6.8 ELtv. 404.0
\ELEV, 403.5
DOWNSTREAM END OF' INTAKE TRANSITION
ELEV, 414.4e
ELEV, 412.8e
Eu~. 411.2!5
E!.EY, 409.8!5
ELEV, 4011.0!5
ELEV. 4011.4!5
ELIY. 40!5.11 OUTLET SEWER 72" LINE
INVERT E LEV 399.9
E!.EV. :404. H Ea. tv. :404, 14 ELav. 403,34 EI.EV, 402.114 EI.EY. 401.74 ELEY, 400.H E!.EY, 400.14
VELOCITY CROSS SECTIONS REVISED INTAKE AND OUTLET
GRAVITY FLDW

7.!5 9.11 13.8 16.0 19.0 17.8 19.0 Euy 412 3
4.15 7.2 10.11 14.7 17.0 111.4 18.2
15.1 8.8 9.1 13.2 1!1.4 17.9 18.1
MIDDLE SECTION OF INTAKE TRANSITION
INLET SEWER LINE INVERT ELEV 406.15
ELEV, 410.0
Euv. 40e.ll
ELEV 1 41!5132
ELEv, 4121 12
£I ry f!O M
E!.EV. 40e.82
E' ry 1/)7 32 ELIV, 40e,t8
NOTE: ALL MEASUREMENTS ARE IN THEIR PROTOTYPE EQUIVALENTS ,
0 0
0 0
0 0
0 2.3
0 0
OUTLET SEWER LINE INVERT ELEV 405.28
TEST CONDITIONS
DIKHAR" 1a00 CF$ $UMP lL.!Y 420.0 RIVER STAGE 430,0
3.2 3.2 4.!1 4.!5 7,!5 1,2 1,4 ••• ... 3A 11.0 8.4 u 10.2 13.2 14.7 1!!,4 1!5,'7
3,9 !1,11 8.0 7.11 12.4 12,1 14.7 111,0 18.0
3,2 !5,11 8,0 8,1 II, 4 11,1 13,8 18,0 18,4
0 2,3 3,2 7,2 7.9 10,8 13.8 14.7 l!l. 7
0 3.9 4.5 s.e 8.4 7,11 12.0 13.2 12.4
DOWNSTREAM END OF INTAKE TRANSITION
Euv. 412185
EL.IY, 411.2!5
ELIV. :409.85
Euy 40f!.O!!
Ef.EV, :408.415
E!,EV, :4()5181 OUTLET SEWER 72" LINE
INVERT E LEV 399.9
Euv. 414.0
Euv. 412.0
Euv. 410.0
!!.IV, g,g
!i.IV1 g,o EI.IV • ..,..,0
"'\~IV, g,D
EI.EV • ..,..,114
Euv, ..,..,14 !LEV. 403,34
EI.IV, ..02.!14
ELcy. :401.7:! Euv. Q,H EL.n, 4QO, 14
VELOCITY CROSS SECTIONS REVISED INTAKE AND OUTLET
PUMP FLOW

"'tJ r ~ tTl -co
PIEZOMETER
NUMBER
I 2 3 4 5 8 7 8 8
10 II 12 13 14 IS 18 17 II .. 20 21 22 23 24 26 34 35 43 45 41 47 ... 48 60
PIEZOMETER ZERO
411.42 418.78 411.42 410 80 418.71 410.80 408.58 408.16 418.18 408.1 e 408.33 412.78 418.19 412.78 408.25 410.U 415.80 410.8t 404.80 408.74 415.31 40t.74 403,78 403.te 403.74 418.00 41!1.80 408.75 438.01 438.88 438.01 432.48 403.70 403.22
PIEZOMETER PIEZOMETER NUMBER ZERO
Sl 406.18 ~2 403.22
OOQQoo ~3 400.18 ~4 402.48 55 407.28
PLAN
£L£V 4GDQO
~~~ l-"'--.lf"10-o<J85 £L£K414QO
SECTION 8-8
NOT£: ALL VALUES ARE IN PROTOTYPE UNITS.
. PIEZOMETERS SHOWN THUS (i)-@ NUMBER ON LEFT INDICATES NEAR PIEZOMETER.
ELEK4!5400
£L£1t.tftHOQ
58 402.91 57 411.21l 58 41~.~.!t
59 403.90 eo 410.80 81 41~.81
82 410.!10 83 405.17 84 410.22 85 415.78 8& 4t o.2e 87 405.13 88 407.311 89 41~.81
70 407.~2
71 415.85 72 408.75 73 411.78 74 408.88 75 415.38 78 407.88 77 404.00 78 405.08 78 405.011 83 422.37 84 422 . .!7 115 422.37 ee 431.92 87 433.82 88 431.Q2 88 431.92 84 404.25 95 415.33 98 415.33 97 415.33 n 408.75
~~~ ~ . £LEV 414.J.1
SECTION A-A
PIEZOMETER LOCATIONS ORIGINAL CONDITIONS
~
PROTOTYPE 11.Loc-::0--...01ol!::=::::'!3112--ii?!::=:::!eeiioo_ .. f FT
MODEL. L 0 2 3 4 m

..J II)
::li
Iii ILl ... ?;
z Q 1-u; ~ a: 1-... 0
0 z ILl
::li < ILl a: !;; 0.. :>
~ ILl z :J ILl 0 < a: .., u :J :> < a: 0 >-:X: ... 0 z 0 ~ < > ILl ..J ILl
418
417
Va UPPER LIMIT ELEV 416.-1 / v
416 v 415 v 0
0 / 414 1/
/ 413 / 0
AIR SEAL BROKEN'
412
411 414
~ /
v
415
/
SAFE OPERATING RANG£ I I
418 417 418 419 420
WATER SURFACE ELEVATION IN SUMP IN FEET - MSL
NOTE: DISCHARGE 1800 CFS. ALL PUMPS OPERATING.
EFFECT OF SUMP ELEVATION ON HYDRAULIC GRADE LINE AT ENTRANCE
TO PUMPING PLANT
PLATE 20

"tJ r ·~ 1'11
I\) -
1200' P:U' ELEV460.0-
~
€(.{.V~
25.00' ELEV415.0
ELEV 412.0
1/2.5' RAD/1/S
~uo Ei.EY«H.o
. '<)!' ELEV 101.0
61.98'
=i /000'
~
~ ~
~ . ~ ELEV 436.0
El I'Vi/1/ltJ
~ ~
% "'
OPEN PIT
12- 10.00'
~
lm.
----'~ , .. 8~
~
E DRAFT TUBE ~ 'Ci
!
iotJI ~
I li
~
~ ;LEV407.5 \_ ~
NOTE: ALL UNITS ARE IN THEIR PROTOTYPE EQUIVALENTS.
ELEVI 40S.O ~
D~TAILS OF PUMP INTAKES SCALE
10~~~~0-------I~?======~R--------Hrr

12
I
10
9
3
2
I
0 88
PLATE 22
89 90 91
I I SUMP EJ .EVATION 420.0- ""'
~ DRAFT TUBE INTAKE 1/
I I I!
I lj
VI i
~ /
OPEN PIT SETTING INTAKE lJI ..1
92 93 94 95 96 97 98 99
PERCENT OF MAXIMUM DISCHARGE
I 2
I
I 0
9
3
2
0 100
EFFECT OF TYPE PUMP INTAKE ON CAPACITY

&-- FLOW FLOW
DISCHARGE CHANNEL
PLAN
TOP OF ORIGINAL GATE: OPENING- ELEV 412.8
NORTH GATE OPENING
'NCREASff£1ff1u
SOUTH GATE OPENING
. • ...
SECTION A-A
OGEE FILLET
: ~: ·.
~ I I
.'• · .
-~ .
.·..;
... ~
--0 -VERnCAL FILLET
.· .4.' .·. ·.
I>· '• •• • •••
SECTION B-8
DETAILS OF SLUICE GATES AND REVISIONS TO DISCHARGE CHANNEL

..J Ill :I
460
RA-ER !;~AGE ~21:2 4!10
440
430
- VOlT
t; 420
"' IL
~ z 2410
~ ... .J ...
400
390
380
a ... Q
~ ~
~ .,
370 0
/ / /
itvER rrAc;J 382.5
>IVI'I> STAGE 382 .. /
50 100
TEST CONDITIONS
DISCHARGE 1800 CFS
150 200
NOT, V~'- "#n
/ / /
VEN~EO AT STA 0-1-00 I
i r I
I
i I :
i 250 300 350 400 450
DISTANCE ALONG CENTER LINE IN F'EET
NOTE: STATION OtOOLOCATED 247.34 F'T UPSTREAM FROM PROPOSED PUMPING PLANT. EXISTING CONDITIONS DENOTE PUMPING PLANT NOT INSTALLED.
i
\
\ i
\.
\
1\ \ "Eo.:_ / '\ \
\ r\ ~~ \.
-
-- -~---
~
\ k
~ ~ >~ \_
\ '-'-
\
J .4..L.
480
450
440
430
..J Ill :I I
420 ti w IL
~ z
410 0
~
400
390
380
> w iii
500 550 600 650 370
700
HYDRAULIC GRADE LINES EXISTING CONDITIONS
GRAVITY FLOW

..J Ill ::1 I
480
450
440
430
l;j420 ... ... ~
~410 !( ,. Ill ..J Ill
400
300
380
RIVER srAGE ~7.2
RIV •R .(T.Ot:~ '20
LL / /
RIVE/I STAGE 31!2.5
/I/ / /
50 100
TEST CONDITIONS
DISCHARGE
NOT VENTED
1800 CfS
_.....
_.......
150 200
PUMPING PLANT
~
\' ~; ISrtN
1\ '{ ~.'lifr,
= r::::::::::: :---~ /
\ ,.,, __ , ~tw-.
\ -· -'"'7-, \ /
---,___ --
-~Elf 'ER
r-.... 72"DIA ~E.
........
-----=-HI.€!i.. .............
-""' 7.2" 0/A SEWER ' ~ \
""' 0x / I// / / /\ \\, .... ,..... -·
--,~ \\ """~· ~Elf< 0..:::4
~ ~\ i'<, -~ ~ ~~x_\' -~
-
.......
r---K-----~ \. v
480
450
440
430 ..J Ill ::1 I
420 ti 1&.1 ... ~ z
410 0
~
400
380
,. Ill ..J w
250 300 350 400 450 500 550 800 850 370
700 DISTANCE ALONG CENTER LINE IN F'EET
NOTE: INITIAL CONDITIONS DENOTE PUMPING PLANT INSTALLED.
HYDRAULIC GRADE LINES INITIAL CONDITIONS
GRAVITY FLOW

"'0 r ~ 1'11
N Cb
...1 Ill :::1 I
460
450
440
430
ti 420 w I.L.
i:
~410 ~ > w .J lal
400
Jeo
340
L
~ ... Q
~
~ ~ ..,
370 0
01. CHA ·~181. rJCF L_
50 100 150
/
200
0/SCHAHt:E 1200 CFS RIVER STAG 4511.:7
.... EXISTING SEWeR
/
PUMPING PLANT TOTAL DISCHARGE f8()0 C~~ ~~uD/A cW£,
L_ /
1-· -- ·-'"7-;: /
·-
·- - ---
250 300 350 400 450 DISTANCE ALONG CENTER LINE IN FEET
NOTE: STAnoN OtOOLOCATED 247.34 FT UPSTREAM FROM PROPOSED PUMPING PLANT.
/
·-
500
"' " HIVE~ ST"At;E ~.3Qo
-~
\ 1\
\ "\ f<
1\ \ ->: ~\ ~ r-<., I' \. .
~ K--I ~·
~ ....
~
460
450
440
430
...1 Ul :J
420 t=i w I.L.
~
z 410 0
~
400
390
380
> w ul
550 600 650 370
700
HYDRAULIC GRADE LINES INITIAL CONDITIONS
PUMP FLOW

.J
"' :II
460
4SO
440
430
t; 420
"' II.
- VENT
L L/ /
~ WI17Af '-""' riiTTON
~410 ~ Ill .J Ill
400
i "' <:) 3110
~ .-: i!
380 .,
370 0
EXIS17Nt:,
50 100
TEST CONDITIONS
DISCHARGE 1800 CFS RIVER STAGE ~82.5
I NO PUMPING ~ ANl
ISO 200
PUMPING PLANT
V.ENT£1 AT S TA OfOO _...,
"' L
\" r-... EXISTING SEWER '\ \ TlND/A 1EWE) VENTED...& ST;f "' NOT VENTED 1::::.: 1f60
/ ~ / / "'>; ·-
\ \
VENT
I
y
\_'\v ~ ~ '\~ ~~\
'\. ~ ~ )~~ ·~
K )
~ 77 I\_ "'
4110
450
440
430
.J
"' :II
420 t; Ill II.
~ z
410 0
~
400
3110
380
> Ill .J Ill
250 300 350 400 450 500 550 600 850 370
700 DISTANCE ALONG CENTER LINE IN F"EET
NOTE: STATION OtOOLOCATED 247.34 FT UPSTREAM FROM PROPOSED PUMPING PLANT.
HYDRAULIC GRADE LINES INITIAL CONDITION VS
NOT VENTED EXISTING CONDITION GRAVITY FLOW

"'0 r )>
.::-1 1'11
N CD
480
4SO
440
430
l;j420 1&1 ...
- fvf"NT
~NinAJ. CONtKTION
~ - t ')(!STING CONDITION NO f'UMPINr. ~~
z 2410
~ Ill J Ill
400
390
380
() () 1-()
~ g ~ ..,
370 0
/ /
so 100
TEST CONDITIONS
DISCHARGE 1800 CFS RIVER STAGE . 382 .5
ISO
,...-:" ,.,
200
PUMPING PUNT
~
I £NTI"D AT STA 0+ 00
""-
7V£A Ts
460
4SO
440
430
420 t Ill IL
Ail STA I +00 \ \
L EXISTING SEWER ~NTeo' ,
~~ s".ro\ r..;;: ~ z
\ -_n ' l ~)_ _I
1 DIA.SEWFI VENTED ST"A
""7-:: /
2SO 300 3SO 400 4SO DISTANCE ALONG CENTER LINE IN FEET
NOTE: STATION OtOOLOCATED 247.34 F'T UPSTREAM FROM PROPOSED PUMPING PLANT.
/
,.....
soo
[\ \i.-
~ ~ I( -- ·-\, ~ ~ ~-- ~ ~
' \'\ A~
' 5SO 600
K j
l~ .L /]
I\_ y 650
410 0
~
400
390
380
370 700
> Ill .J Ill
HYDRAULIC GRADE LINES INITIAL CONDITION VS
VENTED EXISTING CONDITION GRAVITY FLOW

APPENDIX A
DEVELOPMENT OF ANALYTICAL METHOD FOR
DETERMINATION OF SURGES IN SEWERS
by R. L. Irwin*
1. A search of the available files pertaining to engineering lit
erature, published both in the United States and in foreign countries,
indicated that a satisfactory method for the solution of the surge prob
lem in the Southern Outfall Sewer was not to be found. Numerous articles
and papers pertaining to surges in penstocks in power systems were avail
able; however, for the condition of multiple risers and laterals, ap
parently the only solution depended upon the use of model studies. Ac
cordingly, the simplified undistorted 1:32-scale model, described in the
basic report, was authorized. To reduce costs to a minimum only about
10,000 ft of the prototype sewer was reproduced. Risers were added at
intervals in the main sewer line to simulate the effect of manholes.
2. Simultaneously, a study was made of the possibility of develop
ing a procedure for computing the height of surge rise to be expected at
various locations. One of these computations related to the features in
the model, and the results compared very favorably with results of the
model tests conducted at the Waterways Experiment Station. The method
later was described to personnel of the Louisville District Office, who
continued the computations and took into consideration the characteristics
of flow found in the prototype sewer rather than those used in the model.
An explanation of the computations made in the Louisville District is
found in appendix B of this report.
3· The computational procedure consists in the derivation and
solution of a set of simultaneous equations. In deriving a set of equa
tions for solution, the number of unknown quantities are dependent upon
the number of sections of pipe between the pools and surge tanks. It is
* Formerly of the Ohio River Division and now with the Washington District.

A2
necessary to obtain the results for small successive finite increments
of time, assuming the discharge, friction head, velocity head, elevation,
and retarding head to vary as a straight line during the interval of time
involved. The variable factors are adjusted after each step before pro
ceeding with the computation for determining the next series of incre
mental changes. On plate Al is shown the derivation of the basic equa
tions used for determining the set of simultaneous equations applying to
a continuous sewer with numerous risers or surge tanks. It is necessary
that either the elevation of the uppermost pool remain constant, or that
flow into the pool and the dimension of the pool be given or assumed.
The derivation may be expanded to include as many laterals as are desir
able, provided that each junction of the lateral with the main sewer or
another lateral is made at a riser or surge tank. The uppermost point
in each lateral system also must meet the conditions stated for the upper
most point on the main sewer. The finite increment of time should not
be taken too large or the computation must be carried to too many places
to obtain a check. The results obtained through use of time increments
that are quite large often lead to serious errors because of the approx
imations used in deriving the basic equation.
4. If it should be desirable that the relationship for friction
head and velocity head follow approximately a curve line, it then becomes
necessary to solve a new set of simultaneous equations for each step. A
change in the area of the riser for change in elevation also would re
quire a separate solution of equations for each step. In many instances
the same solution of equations can be used for several steps, as demon
strated by the computations on plate A2.
5. The computations shown on plate A2 were made for conditions
similar to those used in the model tests, and hydrographs which are
plotted from the results of the computation are shown on plate A3. The
results of the model tests plotted to the same scale as used to plot the
computed results are shown on plate A4.
6. From a comparison of the model and computational hydrographs
the proposed computational proce~ure appears to be quite satisfactory.
It, therefore, was considered expedient and economical to terminate the

A3
model studies and complete the study through the computational procedure
outlined above.

Q - Diacbarp 1D Met1011 ot __,. uptV.., trca tel* a1o ~ ot ts.t period CODIIi~ (cf"•)•
I - Unitonl tr'tbu.t.rr 1.Jatl.o. c'*'t.aer.d. to __. ....,. tat tl1ftcU, (cf"•). q - Retu'dattoa (or .cceJ.trat:t~) 1a ~ Ja MeUCIIl ot ..._ _..lit&
tiM pria4 c-.ikrel (ch). A • Cro .. -..ctiODIJ. _.. ot AI'P Mat ( .. J't).
- Cron•Met1~ .rea Q/l ...,.. ( .. tt) • ... Lnctlt ot ...., .-c:tica (.14. tt) .. - llleYat1oa or 1111.ter artace 1a ...... tulk at ~ ot tS.. period.
coallia.red. (f't). AI. - Rtae (ar tall.) 1a w.ter nrt.ce :lA tllak llllrille tt.. perl.Od c~tdlln4
(tt). P - Pt~t.rtc l.rn!!l or taU. at ~ ot tae JWiOd. -=-tdllre4 (ft).
(Dtt1.De4 u tbe elafttloa ot tblt bJ'dnalJc ...,_ 1.1.- at u.-v- tuk a1.zlu h)-4n,u1.1c toe.ee l.a reach 1IDI!8r ne.q t'lCiw eGDIUU...)
7 - ~ie ~· 121 MCUC. of ..... far 1ai\ial c.U.tt .. (ft)o 4l - Chulp 1:0 ~ lOIIMa 1a reecb ~ tt. peria4 CC1Uidere4 (tt). C ·- BYVauJ,..ic ~. f'actcr nell that Cq • A7 • ('10 sDplif)' ~ti.OIIa:
it bas breeD .. -.-4 tbat IQ\1nal.1c loeMS ue l.illnr fa.:ti.c:IU; of ..-r ......... ) h - BetardtD& (or accelen.ttaa) -.a. actiJIC to~ ~tt-. C•
aceel..el'atioa) 1a dUcbar'88 (tt}. - ~ period. (IMC)o - Acee1An.t1oa 4ale to BraY1t7 (32.2 tt/.ec2}.
BabiiCI'ipts:
o, 1, 2, ••• a - t'eDt ...tier <r ....r Netic.. b - Beat-iaC ot t,_ ptrlod..
- .,.... darl.Ds tWe period.. - ID4 ~ ts. pertoa...
(Diacr• repreeettts lnll"IU GriDs e. Dart tiM 1DterTal. ill two dcMlatre.. tub of a .Uttpa tank .,..._ Yith coaetu.t ou.tnow (Qo) f'rc. .,..t..l!is and D.o dJ.rect illf'low iDtO dmrnltnul tuko 'l'S. iatenal repreMDted b a shcZ"t tt.e after begl..aatDg ~ nrae actioa u z1 woul4 'be eqll&l to pt at 1Mtuat nrp acttoa 'begiall.)
ftoca tba laYII at a!Dtiora it cell be ebown that, 1t ara uba.J..allced bN4 "b" ie applied to a crose.,..eti~ uea "a• ot e._.. ot ai;er 1rh1cll
bat a leqth, "L," tbe result1q rate of cbu&e of 'ftlOC:itJ' ot tm 1111ter Yill be .f! aa4 tM rate ot cbaltp ot 41acharae put a &1~ pollrt Y1ll
be ~ • U•ill« tbe adopted. lll'aRClature thi• eM be ez,resee4 u:
J'rQI. the &J:Kwe clia&ra it C&ll be seen that,
(vbere i b anrtt4111t rate ot cbup of" 41ecbarp 1D. tbe
first reach ot eewr thlrUJc tbe tt.t period. "t •. •) ••••••••••••••• (1)
ql .. 1 T" !!ti (h1b + .,_) • • • • • • • • • • • • • • • • • • • • • • • • • • • • (2 )
•••••••••••••••••• (3)
••••••••••••• <'>
t •• •z,. " Ii (q1 - T - II,) • ... • • • • • • • • • • • • • • • • • • • • • • • • • • (5)
• [ .. .1 ] ... - i2 (II, - 2) • (~ - r, - 2) •••••••••••••••••••••••• (6)
••••••••••••••• (7)
•••••••••••••• (8)
lt bu bM:a aa-d. that tbe upatrea. eurp tat 111 tbe qst. (\be ath tat) U ~ "bJ" ....-r \0 a cautu'\-.w..J. ......_. ~. 11" uall'l1s slailar to \bat aboft the tollCIIr'ia& -..attCIII trw thia J'MCh ot ....- te lllr1ft4:
[( .. ) ( ·'•·1'>] t ... "-Cia - 2 - '<•·1) - I, . ....,.... :.; ...... c .... ..... ••••••••••••••••• (10)
DERIVATION OF BASIC EQUA,.IOHS
PLAtt· AI

,~~·.·lt~A~I~·\-f,--U-.-R.-~-O-~---TK--11-~--p-.-J-fC-T--------------~--~~-~. ------~.~.,.~-------~mM~EAA .. MAITt~!S~I~S--~----------------~--.~ .. ----------------=~=-=L~·=oF~~=··=m=J=·-~w=T~r~·U~L~,H=:~~ ,.. COMPUTATION OF SURGES FOR SEWER MODEL )o: COIISTRUCUD AIID TESTED IIY U.S.W.E.S.
~I ,,
I
(I)
(2)
(3)
(4)
(5)
(6)
(I)
I; C2)
(3)
(4)
(5)
A, 2100
•
Q, -
•q ft A,
415.0
20.1 "·
l,co, • o, . ~·> + :..,. • c,q, + [co, • i'> . co, . i'>] l, -~
[co, • i'> . (0, • i'>] 1, + :~~>,. • c,q, + ~o, . i'> . co, . i'>]
[co, • i'> · co, · i'>]
[co, ~ i'> · co, • i'>]
[co, • i'> .. ctJ •• ~'>] i, + 2'1,., • c,q,+
reo · ''l · co · ''>] ! + :~~>,. · c,q, l' ' 2 ' 2 A,
[co, · i'> · co, • i'>] l, ~0• • i'> · co, • ;•>] l,
, .. ,
H1(~ + tf:r, + il.1+ ~) · q, ~?7 • O,C 2:0+ 50'?7> • Q, ::1 + 2h,. • T
- q.(~) + q,C~+ ;is+ ii;i;>
- q,c~i + q,(~;;+ Its+ i\£> -q,(~) +q,<sf;+32~s+&i>
- q,Ci&> +q,<;f;+65~o+ M>
• q, ;)t; • l:7 <20,· O,· Q,)
• q, !0~7 • Jf:r; (20,· 0,· 0,)
• q, ~?7 • sf:, (20,· O,· 0,)
• q, J?:, • /:, C20,· 0,· 0,)
• ;f; CO,· 0,)
+ lh,. I u
+ ~.,. • v
+2h., •••
+21,, • X
+~ •• • y
Diaehar~e in C.F.S.
o, 1800.0000
1671.34172 1457. 1881 1241.8593 925. 1725 583.7772
277.7281 ·341.7318
·392.81§96 ·111. 4705
o, 1800.0000
1701.03110 1489.23:111 1243.7307 931.8787
592.5277
290.6151 ·46.9904
·401.4110 ·710. 7176
0, 1800.0000
1735.91:19 1525.6467 1240.5154 935.1374
606.9404
296.9773 ·53.0575
·413. 3055 ·703. 3947
Q,
1800.0000
1752.8154 1557.0291 12».1219 921.6441
627.8387
298.9728 ·63.1278 ·414.4~2
·702.1!634
o, 1800.0000
1761.1193 1577.9418 1240.6706 917.2296
645.1935
302.3896 ·77.6819
·406. 3025 ·101'i.l3>7
441 ••
4. 2 ''·
SldnUI'In ef ~U••l tant!IDin lquaUons
ConltMt L•••l Pool ll•••tion 450.0
•ith hutl lou•• •••~"' to vary uni foNly hn~~ inl tid •Uues at + 1100 eh to 0 at -ro•i•ateJy + 400 ef1
q, • 7.!035023 T + 5,364453 U + 3.7li41M V + 2.7524314 I + 2.1330470 X + 1.-149 y q1 • 5.3644QI T + 7.4597714 U + 5, 1916256 V + 3.12752411 I -t 3.10521:11 X + 2.6418245 Y q1 • 3,7314196 T + 5. 1986241 U + 7.1560741 V + 5. &1111 I + 4. 274493:11. X + 1.-1921 Y q, • 2.7524311 T + 3.8215224 U + 5,2M7105 V + 7.6119417 I + 6.17555611 X + 5.:11171210 y
q, • 2.2UI410 T + 3.105:11107 U + 4.21449341 V + 6.1755578!1 I + 9.1234952 X + 7.'111- y
q, • 1.9048141! + 2.6411ll2U + l.6461923V + 5.2&78211 W + 7.7824466 X +10.963»42Y
•ith hu"' lo•••• nul~tt.·ti he-tween ...,mxiutet., +600 efs to IDOM1ti~~~ately -800 eh
q 1 • 8.789127 T + 6.3791819 U + 4.5411!658 V + 3.41:1114456 I + 2.11- X + 2.41199546 Y q
1 • 6.3791824 T + 8.-594 U + 5.9162131! V + 4r44549ll!l I + 3.668:11579 X + 3.177164311 Y
q1
• 4.5416658 T + 5.916213341 U + 7.8216459 V + 5,1772519 • + 4,84970519 X + 4.:110U22 Y
q 1
• 3. 41:111463 T + 4, 4454930 U + 5. 877a5U V + 8. 22585774 I + 6, 787.358 X + S. 07196492 Y q, • 2.8159979 T + 3.6602674 U + 4,1497049 V + 6,7876940 W 1" 9,7145 .. 2 X + 1.-47461322 T
q, • 2.431!99540 T + 3.17116406 U + 4.:11043:11 V + 5.8719654 I + 8,4746135 X + 11.73127532 T
TiNe in Sea>ndo
0
20 40 60 10 100 120 140 160
110
0, 1800.0000 1767.3461 1592.3715 1242.5272 901,73414
651.8717
305.6356 ·90.1417
·398.1858 ·109. 3973
415.0
431.530303 446.428174 459.280771 469. 599960
476.785427 480.88782!1 402.035395 479.989643 474, 730R86
2
435.8
443.032820 456.585995 483.275383 464.987217
4456.015875 472.283626 472,103428 469.096723 467.558162
~= L,
:1Jx32.2te90
IS80 = 341.4
~-L,
~-L,
~= L,
3) 'll 32. 2 X 3)2
1150 = Ill
~ W 32.2 X XJ2 = 65
2000
~ ... 32.2 , 3)2
2000 = ~5
~ : 2) 1r 32. 2 1i: l02 = 13» L, 1000
tea, = r.-
2Jx.t2.2w2)2
1910 = 65.6
Wett'r !lf"vatlon
437.2
442.698008 455.371284 461.9:111370 461.934930 465.420413 469,518028 469.516231 4456.033510 465.131814
440.8
-.1338:111 453.657474 459.572444 457,81!1624
'4611,463601 464.9791!0 483.386418 461. 180374 461.100101
5
444.0
-.716193 451.631179 416.067435 454.318757 455.687652 4 •• '1114614 457.!17908 456.3111402 457.:141557
6
445.8
-.909822 4!0.865139 454.011027 452.761033 453..5851 458.731105 454.9:117118 454.064161 453.0111115
LOUlftiLLI PLOOII PIIITICTIC. noJIICT -TUIII OUTPALL linD
lUlGI AIIJUSIS POl IHUTDOW OP n.GI IN -. llftl
HIO .,,... .,,.,. 0,_ ... , J •I •
C.....t•• ., "·'··· CIJ•d•d.,. 11.1..1.

..J 1/)
480
470
~ 460 1-w ..... ..... z z Q
~ ~ 450 ..J ..... ..... u ~ a: ::> 1/)
I
a: ..... 440 ~ ~
430
420
roo-~
t:1 v
I / v
I ~ cL if··-
f;J ~ ~ ~
. J~ ~ ~ V, v 7
I I
/
VTAN.:..:O. I
/ v
/TANK N0.1~ v 'I TANK NO . .J
/ "" / ~~0.:~~~ r---~
/ ~~0.~ / ~ "\ ~ ~
/ ~
---' , ...._ ...-
..,......,.. TANK NO.~/
' '
'
' .
0 20 40 60 80 100 120 140 160 180 TIME IN SECONDS
SURGE ANALYSIS SHUTDOWN OF FLOW
IN MODEL SEWER
:PLATE; /l.~

.J fl)
~
1-w w ~
z z 0
~ > w .J w w u ~ a: :::> fl) I a:
1&1
~ J
~ vTjNK ~0./ - ~
/ ~ .......
"" 480
- ["-.
/ _/ v ~ ~ANKN0.2
v; v ""- ~ J. L/TA~N0.4 ~TA~N0.3 _, roo...
470
I v / '--~I I v
~ /TANK N0.5
~ t::-~"--~-/: r---..
v: ___,.. '\
460
~ r--1: Ld ....,_TANK NO.6
IV r •
ll I 450
u I
I b:J I
440
I 430
I I v 420
o 20 40 eo eo 100 120 140 1eo 180 200 220 TIME IN SECONDS
HYDRO GRAPH FROM MODEL TESTS
SHUTDOWN OF FLOW IN MODEL SEWER

APPENDIX B
ANALYSIS OF SURGES IN SOUTHERN OUTFALL SEWER (PROTOTYPE)
by F. U. Druml and H. B. Willis*
(November 1950)
General
1. Southern Outfall Sewer drains a large portion of the central
urban area to be protected by the Louisville, Kentucky, Flood Protection
Project. State Fairgrounds Pumping Plant is planned to pump flood per
iod runof,f carried to the line of protection by this sewer when drainage
by gravity is blocked by high river stages. This plant will pump com
bined storm runoff and industrial and sanitary sewage from an area of
over seven square miles against static heads ranging from 11 to 67 ft.
With the pumping plant operating at or near design capacity, flow condi
tions in Southern Outfall Sewer will be especially conducive to develop
ment of large surges in the pumping plant sump, the main sewer, connecting
sewers and manholes, if the pumping plant discharge is suddenly decreased
or stopped altogether. Therefore, considerable studY has been given to
analyses of surges that could develop under various operating criteria
in order to evaluate conditions that could develop so as to determine a
practicable method for alleviating these surges. This method would then
be incorporated into design of the pumping plant and other planned work.
The basic report describes surge tests in a greatly simplified model of
part of Southern Outfall Sewer in which surges were produced by sudden
closure of a valve at the outlet end of the model sewer. Appendix A
describes the development of a method for analytically determining surge
heights in a simple sewer system, and shows that surges computed by this
method for the model sewer compare very favorably with the surges meas
ured in the model tests. The method of computing surges in the proto-'
type sewer is described in the following paragraphs.
* Louisville District and Office, Chief of Engineers, respectively.

B2
Southern Outfall Sewer
2. The areas served by the major sewer systems in the western por
tion of Lousiville are shown on plate Bl. Southern Outfall Sewer, which
is the second largest sewer in the city system, is within this group. It
is estimated that a sewered area of about 4,540 acres served by this
sewer will contribute storm runoff to the planned State Fairgrounds Pump
ing Plant within a short time after beginning of rainfall. This area is
shown on plate B2. In addition to the 4,540-acre area, an area located
near the eastern limits of the sewer system slowly drains into Southern
Outfall Sewer through ditches. Because of the very slow runoff from this
area, it has been neglected in determining the pumping capacity required
at State Fairgrounds Pumping Plant. The drainage area is flat with con
siderable variation in development. About 75 per cent of the area con
tains residential developments, 5 per cent commercial developments and 17
per cent industrial developments. The remainder is in parks, cemeteries,
and other open spaces. The population of the area served by Southern
Outfall Sewer is about 60,000 persons. The area is drained by a well
developed system of sewers, as shown on plate B2. The main sewer, a
profile of which is shown on plate B3, is built of reinforced concrete
and consists of horseshoe and semielliptical sections of varying sizes.
The largest of these is a 15-ft-6-in. x 15-ft-2-in. horseshoe section,
which is 3,247 ft long and flows into a sewer of smaller section approx
imately 1500 ft landside of the line of protection. This next section
of sewer is considerably smaller but is on a steeper grade and has a
brick paved invert. In addition to runoff from the drainage area shown
on plate Bl, Southern Outfall Sewer carries sanitary or dry weather flows
from the areas to the north that are drained by Western Outfall and
Northwestern Trunk Sewers. The dry weather flows of these two sewers
reach Southern Outfall Sewer through Western Interceptor at a point ap
proximately 1500 ft landward from the line of protection. At various
points near the perimeter of ·Southern Outfall Sewer drainage area there
are sewers that interconnect this area with other sewer systems. How
ever, the probable amounts of flow through these interconnections during

B3
periods of intense rainfall are so small compared to the flow that will
reach State Fairgrounds Pumping Plant that these interconnections have
been neglected in determining station capacity.
Planned Pumping Capacity
3. Since construction of Southern Outfall. Sewer in 1.910, the area
served has been extended by construction of tributary sewers and has
undergone intensive development. As a result, the sewer is now over
loaded and, even with low river stages, intense storms frequently produce
damaging hydraulic gradients and flooding along several reaches of sewer.
Flood-period design rainfalls ordinarily used for determining pumping re
quirements for interior drainage would cause considerable damage in the
area drained by Southern Outfall Sewer because of the inadequate sewer
capacity now provided. For this reason the planned pumping capacity at
minimum design head for the State Fairgrounds Pumping Plant is based, not
upon design rainfall criteria as used at other plants, but on the maxi
mum flow that the existing sewer can deliver to the pumping plant with
out producing excessive damage within the protected.area. In order to
fully utilize the capacity of the existing sewer and to provide as high
a degree of protection as possible with the conditions that exist, it is
planned that during pumping periods the hydraulic gradient at the pump
ing plant intake will be held at or below the crown of the existing sewer.
Computations based upon a value of Kutter' s · "n '·' of 0. 013 for the main
sewer indicate that the maximum discharge that the sewer can deliver to
the pumping plant under these conditions without producing considerable
damage in the protected area is about 1700 cfs. However, in order to
allow an additional margin of safety, it is planned to provide 18oO-cfs
pumping capacity at minimum design head at State Fairgrounds Pumping
Plant. As mentioned above, the computations of discharge capacity of
Southern Outfall Sewer were based upon a value of Kutter's "n" of 0.013,
which is commonly used for design of concrete sewers. HOwever, measure
ments of discharge in the 15-ft-6-in. by 15-ft .. 2-in. concrete horseshoe
section of this sewer indicate that 'a value of "n" of 0.016 would be more

B4
applicable to this section. Rainfall criteria normally used to determine
pumping capacities at maximum design heads would not result in runoff
rates that exceed the capacity of Southern Outfall Sewer. The required
capacity of the State Fairgrounds Pumping Plant at maximum design head
based on these criteria is 910 cfs. The computed hydraulic gradient in
the main sewer for 1800-cfs inflow to the pumping plant is shown on plate
B3· This profile is based upon uniform contribution of runoff from the
tributary sewered area. It will be noted that the computed hydraulic
gradient on plate B3 shows that approximately 33,000 ft of the main sewer
will be surcharged when the inflow to the pumping plant is 1800 cfs.
Under these conditions the velocities in the surcharged sections of sewer
would be as high as 20 ft per sec (in 10-ft-7-in. by 10-ft-1-1/2-in.
sewer near pumping plant). The kinetic energy of the large mass of water
moving at high velocities through surcharged sewers introduces the pos
sibility of large surges developing upon pump shutdown.
Generalized Model of Prototype Sewer
4. The analytic method of determining surge heights described in
appendix A assumes that the sewer is divided into reaches with the sewer
barrel in each reach having a uniform cross-sectional area, and that the
rate of flow at any instant is constant throughout each individual reach.
The method also assumes a surge tank located between adjacent reaches of
sewer with the cross-sectional area of each tank representing the com
bined horizontal areas of any manholes in the reach or partially filled
tributary sewers connecting with the reach that would afford surge re
lief. By this method, determination of the surges during each short time
interval requires the solution of a group of simultaneous algebraic equa
tions, one equation for each reach of sewer in the system. From exami
nation of the plan and profile of Southern Outfall Sewer shown on plates
B2 and B3, it is obvious that it would not be practicable to analyze
surge action in this sewer by the above-described method if each inflow
point, change of sewer section, or opening in the. sewer section, or open
ing in tbe sewer barrel is considered separately. For this reason

B5
analysis has been based upon a hypothetical sewer system, differing con
siderably from the prototype but having essentially the same characteris
tics insofar as the effect upon surge action is concerned. In develop
ing the hypothetical system, several lengths of sewer having slightly
different cross-sectional areas and rates of discharge have been con
sidered as one reach having a length equivalent to the corresponding reach
in the prototype, but with cross-sectional area and initial rate of dis
charge roughly equivalent to the weighted averages of the areas and
initial discharges of the respective lengths of the reach of prototype
sewer. To facilitate computations, the hypothetical system was made as
simple as possible without departing too much from those characteristics
of the prototype sewer that influence surge heights. For example, since
surge is a function of the kinetic energy of moving water in the sewer
system, .it is apparent that in computing surge heights at points near the
river, the kinetic energy of water in small laterals and near the upper
end of the main sewer may be neglected if this energy is a very small
part of the total energy in the system. With 1800-cfs inflow to the
pumping plant, the kinetic energy of the water in all the surcharged
laterals would be but a small part of the total kinetic energy of the
water in the main sewer. Therefore, surge computations were not extended
to the laterals, but the laterals were considered to discharge d,irectly
into the surge tanks of the hypothetical sewer system. It was also found
that the kinetic energy of water contained in the surcharged main sewer
upstream from Third and Avery Streets (point 6 on profile on plate B3)
was less than one per cent of the total energy in the system with a pump
ing plant inflow of 1800 cfs. Thus, surge computations have not been ex
tended upstream from this point, but it has been assumed that a constant
level headwater reservoir is located at point 6 on the main sewer. The
hypothetical sewer system adopted for the computation of surge heights
includes five surge tanks and a constant level reservoir as shown on
plate B5. Initial water-surface elevations and discharges required for
the computation of surge heights resulting from complete shutdown of the
pumping plant from 1800 cfs are also shown.

B6
Method of Analysis
5· The method of determining surge heights provides for the pro
gressive calculation of surges in all risers in the system during succes
sive time intervals. Derivation of basic equations for this method of
analysis from the general laws of motion is shown on plate Al in appendix
A. These basic equations express changes in flow in each reach of sewer
for a short interval of time in terms of elements of the sewer system,
physical constants, length of time interval, and, also, the discharges,
water-surface elevations, and hydraulic losses that exist at the begin
ning of the period. One such equation is deriveO. for each reach of
sewer in the system. Thus, for a sewer system with five risers the changes
in flow in each reach within a short time interval are expressed by five
simultaneous linear equations involving the five unknown changes in dis
charge. It will be noted that, in order to make the basic equations
linear, hydraulic losses between surge tanks are assumed as linear func
tions of discharge. This, of course, is not true, but such an assumption
permits the simplification of the computation procedure and, in the usual
case, the errors resulting from this assumption will not greatly affect
the computed surge heights. Application of the analytic method to com
putation of surges that would result from total plant shutdown from 1800
cfs is shown on plate B5. In this and other surge computations it has
been assUmed that pump discharge would cease instantaneously, although it
is known that, owing to inertia of the moving parts of the pumping units
and the water within the pump passages, pump discharge would not stop
immediately. However, in the model tests of surges described in the basic
report, it was found that within certain limits variation in time for
complete stoppage of pump discharge made no appreciable differences in
the height of surges produced. It will be noted that computations in this
example have been carried to several more significant figures than would
be justified by the basic data and the nature of the problem. This was
done to facilitate arithmetical checks for each interval of time in the
computations. In all of the computations of surges in Southern Outfall
Sewer the time interval used in the step-by-step computations was 20 sec,

B7
as this interval was found adequate to properly define the surges in this
system without requiring an excessive amount of computation. As shown
on plate B5, sheet 3, a cross-check on the computations is provided at
the end of each successive time interval if the increment of surge in
the most downstream tank computed from the basic equations is compared
with the increment of surge based on the volume of water entering or
leaving the surge tank during the same t.ime interval.
Surge Relief Reservoir
6. Some of the extremely high surges measured in the model tests
would not occur in the prototype sewer because the surges measured in the
model were ge.nerally confined in surge tanks while such surges in the
prototype would be higher than the ground surface and would not be con
fined. However, the model tests and preliminary surge computations in
dicated that with Southern Outfall Sewer as it now exists there are pos
sibilities of large and possibly destructive surges developing in the
pumping plant sump and along the lower reaches of the main sewer during
pumping periods. High or moderately high surges could be developed under
certain circumstances not only from total shutdown of pumping plant, but
also from shutdown of individual pump units. It was found that the pump
ing plant itself could be protected from damage due to surges in the
sump by installation of surge relief valves or flap gates which would
open and allow discharge direct to the river during high surges. How
ever, because of the great depth of the planned station, it would be dif
ficult and expensive to install these valves at an elevation low enough
to provide surge relief in the protected area. Also, these valves would
not be effective in preventing surges at high river stages. In view of
these circumstances, it appears that the only method of effectively pro
tecting the pumping plant from damage by surges and at the same time al
leviating surges in the main sewer within the protected area consists in
providing a surge tank or surge relief reservoir connected to the sewer
as close to the pumping plant as possible. This surge relief reservoir
would function in the same manner as the simple surge tanks frequently

B8
constructed where long penstocks are used at hydroelectric installations.
Fortunately, a site for the development of a surge relief reservoir is
available adjacent to Southern Outfall Sewer in the now abandoned chan-
nel of Upper Paddy Run within the Kentucky State Fairgrounds. Topography
at this site is shown on plate B4. In this low area a reservoir with
sufficient storage area to provide effective surge relief can be provided
with little excavation by constructing a short levee across the abandoned
creek channel. An outlet structure with sufficient capacity to allow
high rates of flow from the sewer into the surge relief area with small
loss of head will be required. Investigations indicated that, if possible
a surge relief reservoir at this site should have about 90,000 sq ft of
horizontal area, as a much smaller reservoir would not prevent the develop
ment of fairly large surges in the pumping plant sump upon shutdown of
individual pump units. It appears practicable to develop a reservoir
with about 90,000 sq ft of horizontal area at the State Fairgrounds site
and such a reservoir is tentatively planned. Computations of surges for
total plant shutdown from 1800 cfs discharge rate, which are shown on
plate B5, sheets 1 and 3, are based on a 90,000-sq-ft surge relief reser
voir.
Results of Analyses
7. As now planned, State Fairgrounds Pumping Plant will have four
large pumping units with 386-cfs capacity each at minimum design head,
and two smaller units, each having 128-cfs capacity at minimum design
head. Surge analyses have been made for complete plant shutdown when
pumping at rated capacity at minimum head (pump plant discharge changing
from 1800 cfs to zero), for shutdown of one large pump unit under the
same conditions (pump discharge changing from 1800 cfs to 1414 cfs), and
for shutdown of one small pump unit (pump discharge changing from 1800
cfs to 1672 cfs). Computed water-surface elevations in risers of the
hypothetical system with a 90,000-sq-ft surge relief reservoir in the
State Fairgrounds for the first five minutes after complete plant shut
down are shown on plate 5, sheet 4. The table on the following page

B9
shows computed maximum surge heights at the pumping plant sump and at
the 90,000-sq-ft surge relief reservoir in the State Fairgrounds for com
plete plant shutdown from 1800 cfs, for shutdown of one large pump unit
when inflow is 1800 cfs, and for shutdown of one small pump unit under
the same conditions. It should be noted that the computed surges listed
are maxima that would occur in the first four or five minutes after change
in pump discharge~ It c~ be seen that, if it is assumed that the in
flows to the sewer system remain constant as was done in the surge com
putations, there wquld be a gradual filling of the sewer system and con
necting low areas because of the storage of inflow. This gradual filling,
if continued long enough, could produce higher water-surface elevations
than caused by the surges due to kinetic energy of the flowing water.
However, records of storm discharge in Southern Outfall Sewer show that
peak discharges are of relatively short duration, and, for this reason,
flooding from continued sewer Cl.ischarge would not be as rapid as indi
cated by the surge computations.
COMPUTED MAXIMUM SURGE HEIGHTS WITH 90,000-SQU.ARE-FOOT SURGE RELIEF RESERVOffi IN STATE FAffiGROUNDS
(Pumping Plant Inflow = 1800 cfs)
Maximum Height of Maximum Height of Surge in Pumping Surge in SUI'ge
Operating Condition Plant Sump, ft Relief Reservoir,
Complete shutdown of 32 4 pumping plant
Shutdown of one large 7 1 (386 cfs) pumping unit
Shutdown of one small (128 cfs) pumping unit
2.6 0.3
Possibility of Surge Development
8. Most of the pumping at the State Fairgrounds Pumping Plant
will be accomplished under conditions that will not be conducive to
surge development upon shutdown of pumping units. The pumping plant
ft
BlO
will be operating at high capacity with the attendant surcharge of a con
siderable part of Southern Outfall Sewer very infrequently. A long reach
of surcharged sewer carrying runoff at high velocities is necessary be
fore surges develop in the magnitude of those listed above. It is es
timated that a pump plant discharge of 1800 cfs, upon which the computed
surges discussed above are based, will occur once in about 25 years on
the average. There is little probability of complete shutdown of the
pumping plant when pumping at or near maximum capacity. In the design
of the plant and its power supply system every practicable safeguard to
insure dependable operation will be included. As now planned, power
will be supplied to the plant by two three-phase circuits from the Paddy
Run Generating Plant of the Louisville Gas and Electric Company, which
is located about one mile downriver from the pumping plant site. How
ever, it is possible that inadvertent misoperation at the pumping plant
or at the generating plant or a power outage due to transmission line or
transformer failure will cause unintentional complete plant shutdown. If
such a shutdown should occur as a result of misoperation, it is possible
that the pumps could be placed in operation again before serious surge
developed. The computations indicate that under certain conditions
fairly large surges will develop after the shutdown of one large pumping
unit. However, the pumping schedule is to be arranged so that, as the
pumps are progressively shut down after a period of high inflow, the max
imum sudden decrease of pump discharge will be equivalent to the capacity
of one of the smaller pumps. In other words, when it becomes necessary
to stop a large pump, the two 128-cfs pumps will be started at the same
time.
Conclusions
9. It is estimated that the planned pumping plant could be pro·
tected from possible damage due to surge action following complete plant
shutdown by installation of high-level surge relief valves in the sump
walls at lower cost than by construction of a surge relief reservoir in
the State Fairgrounds. However, the surge relief valves would afford

Bll
little protection against damages from such surges in the area within
the protection works and would not alleviate smaller surges in the pump
ing plant sump and in Southern Outfall Sewer that could develop during
ordinary pumping operations. Since there is little probability of com
plete plant shutdown when the plant is operating at or near maximum
capacity, construction of a surge relief reservoir solely to protect the
interior area against damages from such an occurrence may not be justi
fied. However, the computed surges for shutdown of one pumping unit
without a surge relief reservoir indicate that rapid changes in sump
level would probably make plant operation very difficult and that surges
in the main sewer and its laterals might cause some damage in the pro
tected area. For these reasons it is considered that the surge relief
reservoir should be provided to insure reasonably satisfactory operating
conditions at the pumping plant under all conditions. As indicated by
the computed maximum surge heights listed in paragraph 7, even with the
planned surge relief reservoir the surges in the pumping plant sump for
shutdown of a single pumping unit may cause difficulty in programming
pump operation. For this reason consideration is being given to basing
the pump operation schedule upon stages at the surge relief reservoir
rather than on stages in the pumping plant sump because of the smaller
amplitude of the surges in the reservoir.

•
SCALE IN MILES
Lwww:w:::iL 1
~ C•ly Boundary ~'"' 4. of Prorect•on
Propoaed Pump•nQ Plant
Ora•noQe Area Boundary
d
OHIO RIVER IIASIN
F~OOD PROTECTION LOOSVILLE, KY. INTERIOR DRAINAGE FACILITIES
SURGE ANALYSIS DRAINAGE AREA AND ~OCATION MAP
SOUTHERN OUTFALL SEWER SCALE AS SHOWH
LOUISViLLE, KY. IHO

~r---------------------------------~~~~~~------~~-----------------------, r ~ f'l
aJ N
.!J2k. .. t:;;'>t. lndicttl,.s conlrollm9 --v !lrtJvn# #lr~tons.
Toto! or.o~ 4,440 ~• ~ AIII-III'H in t1t:rH 6h(lwl f/w /lH) Pump~ng p/Ofll•*fl' dTU~ ~ 1,800 c. f.•.
OHIO lOVER .....
FLOOD PROTECTION-LOUISVILLE, KY. INTERIOR DRAINAGE FACILITIES
SURGE ANAL YSlS
PLAN SOUTHERN OUTFALL SEWER
LOUISVILLE, I<Y. "'""

OJ w
H-
I
1-
H
'
I
I
H
.......
~1+i .!
N..
J fC[
I
' ' I '
I
I
' i
'
'
' !
a
I
I
I I
'
T I
I
.;/
I
I I
'
I _(
'
I
I
i
I
I I
I
I
'
' .. "" I
I
i I
I '
~ I

NOTES:
APPROXIMATE LIMITS OF AREA REOI.JIRED FOR SI.IRGE RELIEF
RESERVOIR
E/#ltations r#ftN to M#OII Sea Ltlvel (1912 /J.S. C. 8 6.5. Adjuslm#f/1). Con,_. inl11rwl 2 ful
I 1•1
~I I ~I I -.1 I ~I I ~I' I ,., I I ~I I ~I I ~I, I "'I I
SCALE IN FEET 000 0 ,......,
lt,ft,IPUfli
000
01110 RIVER IIASIII
FLOOD PROTECTION - LOUISVILLE KY. INTERIOR DRAINAGE FACILITIES
SURGE ANALYSIS
SURGE RELIEF RESER\IOIR SITE SOUTt£RN OUTFALL SEWER
SCALES AS SHO
LOUISVILLE, k't 1860

f ..J .. " z i: ::1 ::> ..
FIVJ< TAilK SISTI>! ADOI'l'I<D '1'0 SIMPJ.J:Fr AIIALYSIS
A•JStJ.,. • ,.-r1•4JO CFS
~·U"
z,•44T.4
CONSTAKr I.EIIEL POOL
L._E_!EI'UU Q .. D1sl;harge in &ect.iOD. ot aever upstreaa trc. tank •t beg:imain& ~ u., :period c""'idered (cto).
I ~ Unit'orw tributary inflc:w considered to enter tan1r. directly (cf~J). q - Ret.&.r<ioo (or acceleration} in diachar• tn seetiQa or sever
durine; tt. period considered (eta). A - Croes-aectiona.l &re& of tank (sq rt) • a .. CrO&s-sectiooal area or sewer (aq rt) • L - Un:gth or sever section ( f't ).
Z - El..en.tion of vater surface in t.aDk at beglmli.D8 or tt.. period coaaidered (ft).
AZ - Rise (or f&ll) iD V&ter surface elevation 1n t&Dk clurillg tiM period considered (tt).
J' - Hydraulic losses in reach or sever far initial conditiooa (tt.). AP ,.. Change in b,ydrau.lic loases i.n reach cbu'iDB ti,., period coaatdered (tt). C - IQ'd.raulic loss t&ctor such that Cq • AY (to s111pl1f'y cCIIpl.ltat10D8 it
h&a been a.seuaed that h¥drau1Jc losses are linea:r tunc:tiona ot eever dlscbarges).
h - P.etardi.flg {or &cceleioating) head actiag to cau.e retardatfoo (or acceleration) in discharge (tt).
t - T~ period (oec). (Used as 20 seconds tllrougbout thio aualysio.) g - Accelen.tton dlAe to gravity (32.2 :rt/aec2).
U1 V1 W1X,Y- runettOllS of' (Qlh). Used to abl;plU) equations. 0,1,21 31 4,5 -Subscripts to denote tank nuaber ar reach of' sewer.
b - Bube:eript to denote begiDDing ot tille period. • - Subeeript tc denote average during t.t.e periode - Subscript to denote end ot ti.Jae periOd.
Qua.at1tie8 ehovn in above sketch-,. be further defined:
A1 repre-Hnt• eroe•-eeetiooal area ot JIUIIPiD,e: plant au.p. ~ repreeente •W'F fare& asan.ecl to be .-de available at State l"atrgrOUhdll.. A3, Aq. and A~ are eett..ted sever and anbole &rea.s available on •in atem and tributary severs. Z1, 1-2, Z3, ~ and Z5 are the hydraulic gr-a~ line elevations obta.ined tor flow conditions in the prototype se-wer
produCiDI! 1Boo cfo at tho puapiJ>6 pl.ADt. ~h, ~, Q.3, ~ and Q5 are average initial diech&rges in the respective t-eaches. ~~ ~~ L31 L4 and L5 are pl"ototype lengths betweeo U&UIIed Uwk locations.
A con•tant level pool bas ~n a&Sl.mied in the uppe'r reaches at the sever close to the ground surface on the hydraulic gr&a line vbere little -ve.rtat.ion 1n elevation vou.ld occur during the aurge pet'iod s~ed.
Buie Equat1ou: (1) t ql Al (Q1 - Clo • 2) • 2h1b • Clql •
[ ql "" ] t 2
q1L,_ {Ql • 12 - .,-l - <~ - 2l A;· tga
1
(2) [ "" q1] t [ (~ - !3 - fl - (~ -1-l] t 2.,r.,
(~ -2) - (Cl1 - 12 - 2) A;;"+2":1b-c2.,. A) •• ......,
EVAlllATIOR OF COBSoorl'S
2L,_ 2 X 1537 • .052918979 tg.
1 z 20 X 32.2 X 96.2
2X.. 2 • 611,3 ~ • 20 X 32 o 2 X 180 • •1059868"
(3) [ (~ -1-) - (~ -13 - fl] t [ (~ - 14 -1-) - (Cl4 - ~)] .1..~ AJ + 2~b - C3q3 + '\ ...., :2 2 X 50128 • •10409938
tp3
00
20 X )2.2 X 150 90~~ • .OOOllllll.ll
(4) [ (Q4 - ~) - (~ - 14 -1-l] t [(fit. - 15 - ~) - (~ - t->] t 2'll,I,.
li;" + 21;,b - C4q4 + x;. tsa.. ~. 2 x?OTi! tsa.. 20 X 32.2 X 140 ° ~ll2SllCJ9
(5) [< .. 5 -1-) - (Q" - 15 -it)] t -~ x; + 2h5l> - c5q5 tga5 ~ 2
X 6635 • ol79179CJ4 te1t; • 20 X 32.2 X ll5
20 q1 12 [ q1 "" ] 20 2q1 X 1537 Bubetituti"'! COIIIIt&llto: (1) 2100 (Q1 • 0 • 2) + 2"J.b • il!OO q1 + (Q1 • 210 • 2) • (~ • 2) 9i5;(iOO" 2Q X 32.2 X 9().2 c1 = ~ • .0066666667
20 • • oo851C6383 2350
c2 • ~ • .0072955975 10 • • 0013605'<42 mo
2Q 20, X 611,3
2351i 0
20 X 32.2 X lSO (2)
c3 = ~ • .0036752137 20 •• 002721<834 mo {3) [ (~ - ~) - ~~ - 420 - .jJ] 2~0 + ""3· -~ .3 + [ (~ - 230 - ~) - (Q4'" ~)] 20 2qJ X 5()28
7350 • 20 X )2.2 X 150
c, - ~ • .00372]1>043 10
- .oo8571l!29 35" {I,) [ (Q4 - ~) - (~ - 230 - ~)] ~o•2!;..· ~'ll,· [ (Q4 - 410 - ~) - (Q5 - ~)] 20 ~X 50Ti!
350 ""' 20 X J2.2 X l!iO
(5) [<~ -~) - (Q4 - 410 - ~)] 3~ + 2h5b ~h5 2~. 6635
""r 2Q :lr: J2.2 X ll5 c5 • ~ •• 010000000 20
• -05711<2657 350
Collect.iD& terae IUid aettt.a.g equatiooa equal to U , v , w 1 X an4 Y : (It h to be noted that mmarical 1'aluea have been ca.put.ed to eight aignitic&nt figures in order to obtain seven signiticant figures accuracy tn the reault.s $hown at tbe bottca ot the •beet. Sewn dgrd1'1cazrt fisure ac:eurac;y wae tOUDd necessary to •intain pl"oper evaluation ot all tactars involved &od to obtain arithmetical cheeks at the end ot each t~ period u ebOWD oa Bbeet (3).}
0..:
AD4:
B7 Il.iaiJiatian: lq (~) X 7.6212663
lq (5) + lq (6)
lq (3) X 797.TIC63
lq (7) • lq (8)
lq (2) • 21,255-565
lq (9) + lq (10)
8q (1) X 22,~75,696
lq (ll) + lq (12)
(2) .0001llllll1q1 • o,(.00011llllll + .00'/2955975 + .0042553191 + .10598669) + .0042553191q3
= .oo851o6383(~ • ~) + .~222(Cl1 - ~) - 211:! + 3-57411681 • .046666666 • V
(3) -0042553191"" - q3(.0042553191 + .0036752137 + .00136o5442 •• 10409938) + .001360541,2'll. •• oo851o6383(~ - ~) •• Q02721o6BI.(Q4 - ~) - 2"J - 3-5741,681 + .62585033 • 11
(5) .028571~ - ~(.028571429 •• 010000000 + .17917904) •• 057142B57(Q4 - Q5) - 2h5 - 23.428571 • y
(1) - .o64ll:;8662q1 + .ooollllllllo, = -~ - -009746031711,. - 2"J. + .046666666 • u
(2) .000llll1lllq1 • .ll764892q, + • 0042553191q3 •• oo851C6383(~ - ~) + .00<le2222022(~ - ~) - 2h:. + 3-5278o14 • v
(3) .0042553191"" • oll339046q3
• • 00136o5442'll. •• oo851o6)83(~ - ~) • -002721~(Q4 - ~) - ~ - 2.9486178 -w
(~) .(X)l~ - .14616647'll, + .028571~~ = .002721~(~ -fit.) + .05711,2857(~ - Cl .. ) - """ + 22.8o272l •X
(5) .0265714~ - .21T75007"s > .057142857((1,. - ~) - ""s - 23-428571 • y
(6) -1.1139736q .. + ,21Tf5007~ + • 010369070q3 • 7 .621.2663X
(7) -1.o85'>='ll, + .010369070q3
• 7 .6212663X + y
(8) 1.o8~ + 3-39'<7686q, - 90. 459579q3 • 797-Tio6311
(9) 3-39'<~ - 9Q.41,9210q3 • 797-Tio6311 + 7.6212663X + y
(10) 2.3617"94<t1 - 2500-69'<3., + 9Q.449"10q3 - ~,255.5657
(ll) 2.3617"94<tl -2497-~ • 21,255-565V + 797-Tio6311 + 7.6212663X + y
(12) -1,l!48, 753-3q1 • 2497.2995., • 22,475,696<1
(13) -1,l!48, 750-9q1 • 22,475,69611. 21,255.565V + m.Tio6311 + 7o6212663X + y
lq ( 13) • • 00000069024979 Bq (11) X .()()Olo()()4)255 Bq (9) % .011055929
q1 • -15-51384l.u - .014671649¥ - .OQ055Q66101W - .OOOQ0526o5TI5X - .()()()()(l(J69Q4979Y 11:! • - 8.51142<l1V - .3194533311 - .0030518o31X - .000400432551 + -OO<l94571333q1
Bq (7) • .9213171>6 Bq (5) • ~-592~1.26
q3 • - 8.8200954w - .o81126o179X - .Oll055929Y + .037532321'12 "4 • - 7 .a!16051X - .92131746Y + .OQ95532052ql q5 • • ~-5924!.26Y + .1312ll79q,
SolTin« for q 1n ter. of U, V 1 V, X aM r q1 • -15.513/l4liU -.014671649¥ -.OQ055Q66101V •• 0000052605175X -. 000()()()6<J012979Y -.Ollo671649U -.00001}!tr5174V -.00000Q52o811 -. 0000000049751 -.0000000006531
-8. 51142<l1V -.319'>533311 -. 00305l.803U -.000400432551
'12" -. 014671649!1 -8. 5114]l>OV -.319'>5385v --0030518o61X -.O<JOI>OOI.]320Y -.00055Q661o4U -.319'>5387V -. Ol19f!9!l44W -.0001145ll14l,X -.0000150292Y
-8.8200954W -. o81126o179X -.Oll055929Y
q3- --00055066104u --319'>5387V -8.8]20852W -.o811]74720X • • Oll07Q958Y -.OCJ00052605TI9U -.003051Boei<V - .o811374722W -.ooo6o60490U -.000105763131
-7.012160511< -.921317lo6Y
'll." -.OCJ00052605TI9U -.003051Boei<V -.o811371172211 -7 .0224122X -. 92142]22! -. 000000690124964U -.O<JOI>OOI.3324V -.Oll<YTQ95811 -.92142327X --12090159!
-"· 592'<l.26Y
~- - • 000()()()6<J0129fl4U -.0004004]324V -.Oll<YTQ95811 -.92142321X ...... 71331421
It 1a to be DOted that in t.be erquatioa.e below tbe coefficieQt.a of U 1 V , V 1 X and T are re-peated 1D a regular pattern, prOYid.ing an ar1t.t.et1cal check 011 tbe c~:tat1oo ar thr-ee coe1"t1cienta:a
Bquatioa. t.o ~n Bipiticant Fie:urea:
., - -15. 51)81.u -.Ol'-67165V -.00055()661011 .,. -.011o67165U -8.5ll4]l>V -.319'<5)8w
q3. --00055066100 --319'<539¥ -8.83208511 .... -. ()()()OC)526o57SU -.0030518o8V -.o81137472W
"s" -.()()()()()Q69QI .. <)811 -.00011004332'1 -.Oll!YTQ96W
-. (J()(l()l)5"6o8x
--0030518oBX
-.o81137472X
-7.01221<12%
--921i<232X
-.()()()(J()()69Q496Y
-. 0004004332Y
-.Oll<YTQ96Y
--921i<2)2Y
-4.7133141
COMPLETE SHUTDOWN OF STATE FAIRGROUNDS PUMPING PLANT
(1800 CFS TO 0 CFS)
SHEET I 01' 4

Tae111 ~ __ Q_l ___ '~:, __ ~ ~ ~
0
20
40
6o
80
100
120
140
16o
l8c
200
220
1590.0000 .2515
1589.7485 1.5665
158IU82o 4. 7455
1583.4365 9.6o58
1573.8307 14.9286
1558.9021 19.1477
1539.7544 2l,o864
1518.668o 20.4436
1498.2244 17.8688
148o.3556 14.6444
146§.7112 12,1421
1453.5691
1170.0000 .OQ94
1169.9906 .0941
1169.8965 .4598
1169.4367 1.4868
1167.9499 3.6142
1164,3357 7·0934
1157.2423 11.7453
1145.4970 16.8677
1128.6293 21.3681
1107.2612 24.0928
lo83.1684 24.2316
1058.9368
940.0000 .ooo~
939.9999 ,0012
939.9987 .0077
939.9910 .0332
939.9578 ,lo60
939.8518 .2713
939.5805 .5842
938.9963 1.0958
937.9005 1.84o3
936.o602 2.8262
933.2340 4.0324
929.2016
530,0000 .oooo
530,0000 ,0002
529.9998 .0015
529.9983 ,Oo85
529.9898 .0340
529.9558 .1072
529.8486 .2791
529.5695 .6214
528.9481 1.2119
527.7362 2.1096
525,6266 3.3298
522.2968
T:!Ao 111 ~ _h_l__ --~-- ~ _h_4_ _h_5 __
0
20
40
6o
80
100
120
140
160
180
200
220
0
14.0738
20.98o83
20.11513
13.34705
3.945110
-4.701903
-10,13476
-11.37532
-8,91592
-4.266150
• 714322
,02665718
.1393760
.3635872
.6545042
.9277336
1.101672
1.133212
1.033546
.860313
.691807
·595a95
0
.00098268
.Oo881134
.03905746
.1157222
.26o5124
.4779024
• 7447730
1,011141
1.213267
1.294781
1,227717
0
• 00001014 • 00000212
• 0001226o • 00002562
.00074638 ,00024644
• 00299134 • 001274 70
• Oo893988 , 00482174
• 02158966 • 014 37790
.04413448 .03562766
.07915180 .07571982
.1279072 .1414184
.19oo690 • 2365710
:2636166 .36oo630
(1) (2) (3) (4) (5) (6) (7) (8) (9) (10) (11) (12)
TUie 111 Col (3} + Col (4 ) - Col (6) x Col (8) x Col (la) + Col (11) -~ • 000222222~ -,a09746o32Ql Col {1)+(2) ,04666666 2h1 " (U) (Q3 - '~:,) .0o851o638 (Ql - '~:,) .0002222222 Col (7),..(9) 3.5278a1 2~ = (V)
-17.54286 -17.18953 -17.14286 -17.14286 -14.95o88 -8.494893
-14.59760 -8,141964
-14.55093 -42.69871 -8.095297 -50.05696
0 20 40 60 80
·3533333 .3532774 .3529293 ·3518747 .3497401 .3464227 .3421676 ·3374817 ·3329387 .3289679 .3257136 .3230153
-.9262941 -.5744194 -. 5277527 -40.75801 100 120 140 16o 180 20a 220 240
0
(1)
20 420,0000 40 419.7579 6o 418.2855 80 413.9998
laO 405.88o8 120 394.5664 140 382.5121 16o 373.1710 180 369.5951 200 373.0944 220 382. 5428 240 394.6323
5.236402 8.42lo80 8.281702 5. 549250 1.587761
-2.149256 -4.576984 -5.231120
(2)
Col (l) X
.Oo85lo638
3·574468 3.5724o8 3· 559876 3· 523402 3.4543a5 3.358012 3.255422 3.175923 3.145490 3·175271 3.255683 3·358573
(l) (2)
Ti.me in ( Col (1) x ~ ~ ,00272lo88
0 20 40 6o 80
100 120 140 160 180 200 220 240
230.0000 229.9907 229.8978 229.4457 227.9921 224.4839 217.6618 206.5007 190.7288 171.2010 149.9344 129.7352
.6258502
.6258249 ,6255721 .6243419 .6203866 .6lo8404 .5922769 .5619066 .5189898 .4658530 .4079847 .3530209
5.586142 8. 767503 8.623870 5.886732 1.920700
-1.820288
5.632809 -21.06129 8,814170 .923950 8.670537 18.07434 5·933399 26,20292 1.967367 24. 718al
-1.773622 16.05822 -4.251270 -4.204603 4.32770 -4.9o8105 -4.86143'8 -6.29oo82
-230,0000 -229.9907 -229.8978 -229.4457 -227.9921 -224,4839 -217.6618 -2o6.5007 -190.7288 -171.2010 -149.9344 -129.7352
(3)
(Q5 - Q4)
(4)
Col (3) X
,00272lo88
-.6258502 -.6258249 -.625572'1 -,6243419 -.6203866 -,6108404 -. 5922769 -.5619066 -.5189898 -.4658530 -.4079847 -.3530209
(4)
Col (3) x .05714286
-410. 0000 -23.42857 -409.9999 -23.42857 -409.9989 -23.42851 -409. 9927 -23. 42816 -409. 9680 -23. 42674 -409.8960 -23.42263 -409.7319 -23. 41325 -409.4268 -23.39582 -4o8.9524 -23.36871 -4o8. 3240 -23.33280 -407.6074 -23.29185 -406,9048 -23.25170
(5)
Col (2)+(4)
2.948618 2.946583 2, 934304 2.899060 2.833918 2.747172 2.663145 2,614016 2.626500 2. 709418 2.847698 3.005552
(5)
Col (2)+(4)
-22,Bo272 -22,80274 -22,80294 -22.80382 -22.80635 -22.81179 -22.82097 -22,83391 -22.84972 -22.86695 -22.88387 -22.89868
-420.0000 -419,7579 -418.2855 -413.9998 -405.88o8 -394.5664 -382,5121 -373.1710 -369.5951 -373.0944 -382,5428 -394.6323
(6)
Col (5) 2.948618
0 -,002035 -. 014314 -.049558 -.114700 -,201446 -.285473 -.334602 -.322118 -.239200 -,100920
.056934
-3.574468 -3.5724o8 -3-559876 -3· 523402 -3.4543a5 -3.358o12 -3.255422 -3.175923 -3.145490 -3.175271 -3.255683 -3.358573
(7) Col (6) -2h
3 = (W)
0 -.0040004 -.031937 -.127673 -.346144 -. 722471
-1.241278 -1.824148 -2.344400
=t~br§~ -2.398500
(6) (7) Col (5) + Col (6) -22,8o272 2h4 ~ (X)
0 -.00002 -.00022 -.00110 -,00363 -.00907 -.01825 -.03119 -.04700 -.06423 -.o8115 -.09596
0 -.00004 -.o0046 -.00259 -.00961 -,02695 -.06143 -.11946 -.20530 -.32004 -.46129 -,62320
210,0000 -55.7001
-716.5562 -1488.393 -2111,116 -2422.954 -2389.506 -2o88.0536 -1661.1380 -1259.8293 -996.o858 -916.8255
(8)
(Q4 - Q5)
410.0000 409.9999 409.9989 409.9927 409.9680 409.8960 409.7319 409.4268 4o8.9524 4o8.3240 407.6074 4o6.9048
.04666666 -.01237780 -.1592347 -.33a754a -.4691368 -. 5384342 -·5310013 -.4640119 -.3691417 -.2799620 -.2213524 -.2037390
(9)
Col (8) x .05714286
23.42857 23.42857 23.42851 23.42816 23.42674 23.42263 23.41325 23.39582 23.36871 23.33280 23.29185 23.25170
-3.527801 -3.584786 -3.719111 -3.854156 -3.923442 -3.896446 -3.786423 -3.639935 -3.514632 -3.455233 -3.477035 -3.562312
0 -.056985 -.191310 -.-326355 -.3956410 -.368645 "'258622 -.1121340
.013169
.a72568
.a50766 -.034511
(10) (11) Col (9) Col (10) -23.42857 ~
0 0 -.oooo6 -.00041 -.00183 -.00594 -.01532 -."03275 -.05986 -.09577 -.13672 -.17687
0 0 -.00011 -.Oa09o -.00438 -.01558 -.044o8 -.10401 -.21130 -.37861 -.6o986 -.89700
0 -.1102994 -.470o62
-1,053529 -1.704649 -2.224112 -2.461966 -2.378558 -2.a53923 -1.648058 -1.332848 -1.224701
Ti.me in (1) (2) (3) (4) (5) (1) (2) (3) (4) (5) (1) (2) (3) (4) (5) ~ -15.51384U -,01467165U -,00055o6610U -,00000526o578u -,OOOOoo69024gSu -,Ol467165V -8.511434V ~ -.0030518o8v -,0004004332V -.00055o661CM ~ -8.832o85W -.o8437472W -.0119JQ96w
0 20 40 6o 80
100 120 14a 16o 180 200 220 24a
Tillle111 ~
0 2a 40 6o 80
100 12a 14a 16o 180 200 220 240
265.9516 662.4210 776.5757 632.3132 326.7415 -14.33401
-28o.4024 -406.5079 -383.4713 -249.1247
-67.13925 97.58333
(1)
,2515140 .62646o5 • 7344182 .5979873 .3090039
-.01355587 -.2651804 -.3844401 -.3626540 -.2356oo6 -.o6349450
,Q9228588
(2)
,00943990 ,02351251 .02756442 .02244385 ,01159763
-.0005o878 -.00995283 -.01442893 -.01361124 -.00884264 -.00238310
,00346370
(3)
.00009018
.00022462
.00026333 ,00021441 ,00011079
-.ooooo486 -.000095o8 -.00013784 -,00013003 -.oooo8448 -.00002277
,00003309
(4)
,00001183 .00002947 ,00003455 .00002813 ,00001454
-.oooooo64 -.00001248 -,00001809 -.00001706 -.oooo11o8 -.00000299
,00000434
(5)
0 ,00161827 .oo689659 ,01545701 • 02501001 .03263139 .03612110 ,03489737 .03013444 .02417973 ,Ol9555o8 ,01796838
(1)
0 .9388o6l
4.000902 8.967043
14.50901
~~:§§~~ 20,24494 17.48183 14.02734 11.34445 10,42396
(2)
0 ,03523557 .1501631 ·3365539 • 5445568 • 7105013 • 7864846 • 7598396 .6561337 .5264786 .4257835 .3912355
(3)
0 ,00033661 ,00143454 ,00321517 .00520226 .0o678756 .00751345 .00725890 ,oo626818 .00502956 .o040676o ,00373755
(4)
0 ,00004417 ,00018823 ,00042187 .Ooo6826o ,Ooo89o61 .Ooo98585 ,00095245 ,OOo82246 .ooo65994 .00053372 ,00049041
(5)
-.00000526o578x -.00305l&l8X -.o8437472X •7,0224l2X -.9214232X , -0000006902498Y -.0004004332Y -,0110J()96Y -,9214232Y -4.713314Y
0 0 0
.00000001
.OOCOOCQ5
.OOCOOC14 ,OOCOOC32 .00000063 .000001o8 ,00000168 ,00000243 .00000}28
0 .00000012 .00000140 .00000790 .00002933 .00oo8225 .00018747 .00036459 .00062654 ,OQ09767a .00140777 .00190189
0 .a0000337 ,0000388 ,0002185 .00o81o8 ,0022739 ,0051831 .010079 ,0173221 .0270033 .0389212 .0525823
0 ,000281 ,00323 ,01819 .o6749 .18925 .43139 .83890
1.44170 2.24745 3.23937 4.37637
0 ,0000369 ,000424 .002386 ,0o8855 ,024832 ,0566o3 .11007 ,189168 .294892 .425043 .574231
0 0 0 0 0
,00000001 .00000003 ,00000007 .00000015 ,00000026 ,00000042 .00000062
0 0
,00000004 ,00000036 .iJoo00175 ,OOOoo624 .00001765 .00004165 .oooo8461 ,00015161 .00024421 .00035919
0 0
,00000122 ,00000996 ,00004849 ,00017249 ,Ooo48801 ,00115150 ,00233930 ,00419158 .oo675174 .00993065
a a
,000101 ,Ooo829 .o04a36 ,014356 ,04o616 .095837 .194697 .34886a .561939 .826517
0 0
,000518 ,00424 .02064 .073433 .207763 .490232 .995923
1, 78451 2.87446 4.22784
0 .00000220 ,00001759 .00007030 ,00019061 .00039784 ,Ooo68352 .00100449 ,00129097 ,00146792 ,00148154 ,00132076
(1)
0 ,00127794 .01020240 .04078563 ,1105770 .2307961 .3965310 .5827310 .7489275 .8515789 .8594847 • 7662099
(2)
0 .0353319 .282070
1.127619 3.057173 6.380925
10.96307 16.11103 20,70594 23.54399 23.76257 21.18376
(3) E (1) = q1 E (2) • ~ E (3) = q
3
265.9516 662.4226 776.5826 632.3287 326,7667 -14.3oo98
-280.3656 -4o6.472a -383.4399 -249.0991 -67.11821 97.60262
.2515140 1.566545 4, 745524 9.6o5824
14.92862 19,14771 2l,o8642 2a,44364 17.86881 14,64445 12.14209 11,28472
.00943990
.094o8335
.4598375 1.486845 3.614187 7·093364
11.74527 16.86767 21.36812 24.09282 24.23164 21.64097
0 .00033753 ,00269468 ,01077237 ,0292058o .o6095829 .1047325 .1539120 .1978o81 .2249206 .227oo87 .2023728
(4) E (4) = q
4
.00009018 ,00117976 .00772355 .03322095 .lo60448 .2713470 .5841569
1.095770 1,840343 2.826176 4.032363 5.40903a
0 .00004429 .00035357 .00141346 .00383215 ·00799845 .al374214 .02019507 .02595476 • 029:;.1223 ,02978622 .02655370
(5) E (5) • ~
.00001183
.00015483
.00151835
.oo848g46
.03402429
.1071534
.2790815
.6214314 1.2J.l.851 2.109563 3.32982o 4.829119
General Jfotea: Sbeet 2 1B uaed to l!f'Yaluate (q)s tram equations developed on sheet 1. These q values are the bues of determining water B'U.rface elevations (Z) shcnt'Jl on sheet 3.
Sheet 2 is used in conJunction vith sheet 3. New va.lues of Q and h are inserted as sheet 3 computations progr-es.s. The Q values for each period are determined b7 11\ibtractins the retardation ill diacbarge (q) f"rca the Q, Y&lues at the beginning of the preced.ing period. The h values shown are he; values of the precedi.ng period shown on sheet 3.
VaJ.ues at Q &Dd h at the besilmi.Dg of the :tirst period are known since the Q. values are thoae tar stead;y tlav conditions at the instant of stoppap and all the h valuea are zero.
COMPLETE SHUTDOWN OF STATE FAIRGROUNDS PUMPING PLANT
(1800 CFS TO 0 CFS)
SHEET 2 OF 4

Toiik!tea .02d5949
2 .652&969 ' .o56;5555 .089§8952 .o26t5949 .o5J9344 .o$2&969 .656;5555 .089~8952 .o26t5949 • 652t344 .05;&969 .656~5555 ••• L/tsa .65299344
c .006666666 .00122~~ .00~61~214 .003123404 ~ .006666666 .OOJ32~~~ .OOJ612214 .003723404 ~ .006666666 .ooz2~22~ .OOJ6Z2214 .00372J404 ~
~ ~ 40-6o
(1) q 265.9516 .2515140 .00943990 .00009018 .00001183 662.4226 1.56?545 .o94o8335 .00117976 .00015483 776.5826 4. 745524 .4598375 ·00772355 ,00151835 (2) 61' • Cq l. 773010 ,00183495 .00003469 .00000034 .00000012 4.416150• ,01142888 .00034578 .00000439 .00000155 5.177217 .03462144 ,001651000 .00002876 .00001518 (3) %6>' l.77488o .00187010 .00003515 .00000046 .00000012 4.427931 ,Oll78o6o .00035172 .00000594 .00000155 5.213572 .03635538 .00173394 .00004394 .00001518 14) ~ • q L/tga
0 0 0 0 0 14.07389 .02665718 .001)98268 .00001014 .00000212 20.9Bo83 .1393760 .oo881134 .00012260 .00002562 5) 7.036944 ,01332859 ,00049134 .00000507 .00000106 17.52736 .o8301661 .00489701 .000o6637 .00001387 20.54798 .2514816 ,02393440 .oo043449 .00013603
(6) ~
14.07389 ,02665718 .00098268 .00001014 .00000212 20.9Bo83 :~m~ .oo881134 .00012260 .00002562 20.11513 .3635872 .03905746 .00074638 ,00024644 (7) 0 0 0 0 0 14.10154 .00099494 .00001226 .000002;1.2 21.12917 .1483356 ·00895956 .00014822 .00002562 (8) Zhe 14.10154 .02765212 .00099494 .00001226 .00000212 21.12917 .1483356 .00895956 .ooo14822 .00002562 20.51877 .4036375 .04005028 .00099282 .oooe4644 (9) 6Z • Ihe - Ehj, + Il>F 15.87642 .02952222 .00103009 .00001272 .00000224 11.45556 .1324641 .oo831634 .00014190 .00002505 4.603172 .2916573 .03282466 .ooo88854 .000236oo ( 10) 6Z cheek 15.87642 11.42559 4.60Jl86
60-80 ~ ~
(1) q 632.3287 9.605824 1.486845 .03322095 .oo848946 326.7667 14.92862 3.614187 .1060448 .03402429 -14.30098 19.14771 7·093364 .2713470 .1071534 (2) 6F • Cq 4.215524 .07ooBo23 .00546447 .00012370 .oooo8489 2.178444 .1oB9132 ,01328291 .00039485 .00034024 -.0953399 .1396940 .02606963 .00101033 .00107153 (3) %6F 4.291277 .07575329 .00567306 .0002oB59 .ooooB489 2.301375 .1229312 ,014018o .00073509 .00034024 .07250559 .1678455 .02815149 .002o8l86 ,00107153 (4) hb 20.11513 .3635872 .03905746 .00074638 .00024644 13.34705 .6545042 .1157222 .00299134 .oo-127470 3.945110 .9277336 .2605124 .00893988 .00482174 (5) he • q L/tsa 16.73109 .5090457 .07738982 .00186886 .00076057 8.646o8o .7911189 .1881173 .00596561 .00304822 -·3783966 1.014703 .3692074 .01526477 .00959982 (6)
~b 13.34705 .6545042 .1157222 .00299134 .00127470 3.945110 .9277336 .2605124 .oo893988 .00482174 -4.701903 1.101672 .4779024 .02158966 ,01437790 (7) 20.51877 .4036375 .04005028 .00099282 .00024644 11..12154 • 771.1.924 .1199882 .00426604 .001274'10 5.147118 l.202ooB .271.2740 .01376162 .00482174 (8) I he 14 .• 12154 .7744924 .1199882 .00426604 .001~71.70 5.11.7118 l.2020oB .274274 .01376162 .00482174 -3.o86361 1,615542 .5138700 ,03596756 .01437790 (9) 6Z • Zhe - Ehb + %6F -2.105953 .4466o82 .o856110 ,00348181 .00111315 -6.673047 .5504468 .1683038 ,01023067 .00388728 -8.160973 • 5813795 .26771.75 .0242878 .01062769 ( 10) 6Z cheek -2.105916 -6.6IJ037 -8.160969
~ ~ ~ (1) q -280.3656 . 2l.o8642 11.74527 • 5841569 .279oB15 -406.4720 20.44361. 16.86767 1.095770 .6214314 -383.4399 17.86881 21.36812 1.840343 1.21185~ (2) 6F • Cq -1.869104 .153838o .04316638 ,00217505 .00279oB2 -2.709813 .1491486 .06199230 .00407999 .006214Jl -2.556266 .1303637 .07853241 .oo685234 .012llB51 (3) %6F -1.667134 .2019703 .04813225 .00496587 .00279082 -2.488378 • 2214352 .07228660 .01029430 .00621431 -2.328399 .2278670 .09750326 .oJ.897o85 .01211851 (4) hb -4.701903 1.101672 .4779024 ,02158966 .01437790 -10.13476 1.133212 • 7447730 .04413448 .03562766 -11.37532 1.033546 1.011141 ·0791518o .07571982 (5) he • q t/ts• -7.418331 1.117442 .6113377 .03286207 .02500278 -10,75504 1.oB3379 .8779570 .06164314 .05567374 -10.14562 .9469297 1.112204 .1035295 .1o85691 (6) ~
-10.13476 1.133212 • 7447730 .04413448 .03562766 -11.37532 1.033546 1.011141 ,0791518o .07571982 -8.91592 .860313 1.213267 ·1279072 .1414184 (7) -3.o86361 1.615542 .5138700 ,03596756 .01437790 -8.17701 1.957747 .8245351 .07976214 .03562766 -9.17576 2.199559 1.166013 -1548716 .07571982 (8) Ihe -8.17701 1. 957747 .8245351 .07976214 .03562766 -9.17576 2.199559 1.166013 .1548716 ·07571982 -6.57301 2.342906 1.482593 .2693256 .1414184 (9) 6Z • Ihe - Ebb + %6F -6.75778 • 544175 .3587974 ,04876045 .02404058 -3.48713 .463247 .413765 .o854038 .04630647 .27435 .371214 .414o83 .1334249 .07781709 (10) 6Z cheek ~ -6.75779 -3.48714 ~
~ ~ ~ (1) q -249.0991 14.64445 24.09282 2.826176 2.109563 -67.11321 12.14209 24.23164 4 :gi~5~~12 3·32982 97.60262 11.28472 21.64097 5.409030 4.829119 (2) 6F • Cq -1.660661 .1068400 .o8854627 ,01052300 .02109563 -.4474547 .o8858381 .o8905646 .0332982 .6506841 .o8232878 .07953520 .02014000 .04829119 (3) %6F -1.433656 .2270049 .1201649 ,03161863 .02109563 -. 2215021 ,2259526 .1373688 .04831232 .0332982 .88o9793 .2302952 .1479664 .06843119 .04829119 (4) hb -8.91592 .860313 1.213267 .1279072 .1414184 -4.26615 .691807 1.294781 .1900690 .2365710 • 714322 • 595095 1.227717 .2636166 .3600630 (5) ha • q t/tsa -6.591035 • 7760598 1.254024 .1589881 .1889947 -1.775914 .6434511 1.261249 .2268428 .2983170 2.582516 .5980161 1,126406 ·304288o .4326385 l6) ~b -4.26615 .6918o7 1.294781 .1900690 • 2365710 • 714322 • 595095 1,227717 .26~166 ·3600630 4.450710 .6009372 1.025095 .3449594 .5052140 7) -6.57301 2.342906 1.482593 .2693256 .1414184 -1.85292 2.413228 1. 7211.21 .42 6400 .2365710 3.16o814 2.446492 1.851397 ,6236796 .3600630
(8) the -1.85292 2.413228 l. 721421 .4266400 .2365710 3.16o814 2.446492 1.851397 .6236796 ·36oo630 6.926916 2.476206 1.875268 .8501734 .5052140 (9) 6Z • lhe - I~ + %6F 3.28643 .297327 ·358993 .188933 .116248 4. 792232 .2592166 .2673448 .2453519 .1567902 4.647o81 .2600092 .1718374 ·2949250 .1934422 (lo) 6Z cheek 3.28644 4. 792233 ~
Crose Check 6Z1A1 q1t q1t
Qo + -t- • l8oo - Iq1(t-1) -......- Or: 0 + 105 AZ1 = 18oO - Iq1(t-1 ) -2 Final Tabulations
Tiae in zq1(t-1) q1t 18oo-col 105 AZ AZ•~ Tank 5 Seco.nda 2 (2)-(3) Te.nk 1 Tank 2 Tank 3 Tank 4
....ll.L __J&_ ___m_ _J!L_ __l..2L_ ~ t&Zl _z_1_ 6Z2 _L oz3 _z_3_ AZ4 _z_4_ • Kz5 _i_
0 416,000 428.000 439.600 443.900 447.400 20 0 132.9758 1667.0242 1667.0241 15.87642 15.876 431.876 .030 428·.030 ,001 439.601 0 443.900 0 447.400 40 265.9516 331.2113 1202.8371 1202.8338 11.45559 11.456 443.332 .132 428,162 .ooB 439.609 0 443.900 0 447.400 60 928.3742 388.2913 483.3345 483.3331 4. 603186 4.603 447.935 .292 428.454 .033 439.642 .001 443.901 0 447.1.00 /30 1704.9568 316.1644 -221.1212 -221.1251 -2.105916 -2.106 445.829 .447 428.901 .o86 439· 728 .003 443.904 .001 447.401
100 2337.2855 163.3834 -700.6689 -700,6699 -6.673037 -6.673 439.156 .550 429.451 .168 439.896 .010 443.914 .004 447.405 120 2664.0522 -7.1505 -856.9017 -856.9022 -8,160969 -8.161 430.995 .581 430,032 .268 440.164 .024 443.938 .Oll 447.416 140 2649.7512 -140.1828 -70oJ.5684 -709.5669 -6.757794 -6.758 424.237 .544 430.576 .359 440.523 .049 443.987 .024 447.440 l6o 2369.3856 -203.2360 -366.1496 -366.1487 -3.487139 -3.487 420.750 .463 431.039 .4!4 440.937 .085 444.072 .046 447.486 l8o 1962.9136 -191.7200 28.8064 28.8068 .27435 .274 4.21.024 ·371 431.410 .414 441.351 .133 444.205 .OJ8 447.564 200 1519.4737 -124.5496 345.0759 345.0752 3.28644 3.286 424.310 .297 431.707 ·359 441.710 .189 444.394 .116 447.68o 220 1330.3746 -33.5591 503.1845 503.1844 4. 792233 4. 792 429.102 .259 431.966 .267 441.977 .245 444.639 .157 447.837 240 i.263.2564 48.8o13 487.9423 487.9435 4.647070 4.647 433· 749 .260- 432.226 .172 442.149 .295 444.934 .193 448.030
The 1 tess ahmm in a typic&l 20·secoDd caaputation are obtained as follows:
(1) q ca:aputed on sheet 2 (2) 6F Cq (as shovn) (3) I6F auaation ot hydraulic loss changes of reaches upetrea fraa. tank during time period coneidered (4) hb sa.e as he ot previou.a tille period (5) h. q L/tsa (•• shovll) (6)
~ 2ba - hb (7)
%~ su.mat1on ot hb of reaches upstream f'rCII. tank (8) au.ation ot he of reaches upstreu f'rCIII tank (9) 6Z Ihe - Ehj, + IAF (•• Shown)
(10) AZ check voluatric check as shown in cOl\IIIJl (6) of cross check and final tabulations.
COMPLETE SHUTDOWN OF 1J
STATE r FAIRGROUNDS PUMPING PLANT ~ (1800 CFS TO 0 CFS) rTI
(ll SHEET 3 OF' 4
(}I

.......,
458
456
454
452
450
448
~ 446
~ ~ 444
I 442
~440 LL
1&.1 ..J ..J > (f)
§ ..... _j u; 2 ,_; LL I z 0
~ ~
~ 1&.1
1&.1
~ &&.: a:: i
~ 3i
438
436
434
432
430
428
426
424
422
420
418
416 0
'
~ -
20 40
t .-- WATER SI.N'ACE AT UPPER ENO OF SEWER SYSTEM AOOPTEO / FOR ANALYSIS (ASSUMED CONSTANT AT ELEVATION 452. 7[])
TANK NQ 5
;_TANK NO.4
!,-TANK NO.3
~ r;
" TANK NO. 2 (SURGE AREA IN STATE · FARGROt.WOS-ASSUMEO gqooo sa F"r.J
L, rT,- u~~ ,r r-T
4- ·tT r l j::j •
llfi
TANK NQ I (PUMPING PLANT SIMP)
t ~
60 eo 100 120 140 160 tao TIME IN SEOONlS (AFTER PLANT SHUTOOWN)
!L t
200 220 240
260 280 300 340 360
LOUISVILLE FLOOD PROTECTION PROJECT SOUTHERN OUTFALL SEWER
SURGE ANALYSIS
COMPLETE SHUTDOWN OF STATE FAIRGROUNDS PUMPING PLANT
( 1800 TO 0 C.F.S.)
LOUISVILLE, KY. SHEET 4 OF 4