surface water field sampling manual - appendix ii · o in vacuum pump (bottle with spout) ____...
TRANSCRIPT
Surface Water Field Sampling
Manual - Appendix II
for water quality parameters and flows
Photo Courtesy of Russ Gibson, Ohio EPA, DSW
March 30, 2018
Next Revision Due: March 30, 2020
John R. Kasich, Governor Mary Taylor, Lt. Governor Craig W. Butler, Director
Fin
al M
arc
h 3
0, 2
01
8

Surface Water Field Sampling Manual –Appendix II Version 6.0 – March 30, 2018
Ohio EPA, Division of Surface Water Page 2
Surface Water Field Sampling Manual
Appendix II
Section A: Chlorophyll-a Sampling Procedure Page 3
Section B: Critical Cleaning Protocol for Orthophosphate Syringes Page 12
Section C: Churn Splitter Sampling and Maintenance Page 13
Section D: Sampling Method for Documentation of a Public Health Nuisance Page 16
Section E: Compliance and Whole Effluent Toxicity Sampling Page 21
Section F: Water Quality Sonde Deployment Page 26
Surface Water Field Sampling Manual –Appendix II Version 6.0 – March 30, 2018
Ohio EPA, Division of Surface Water Page 3
Appendix II – Section A
Chlorophyll-a Sampling Procedure
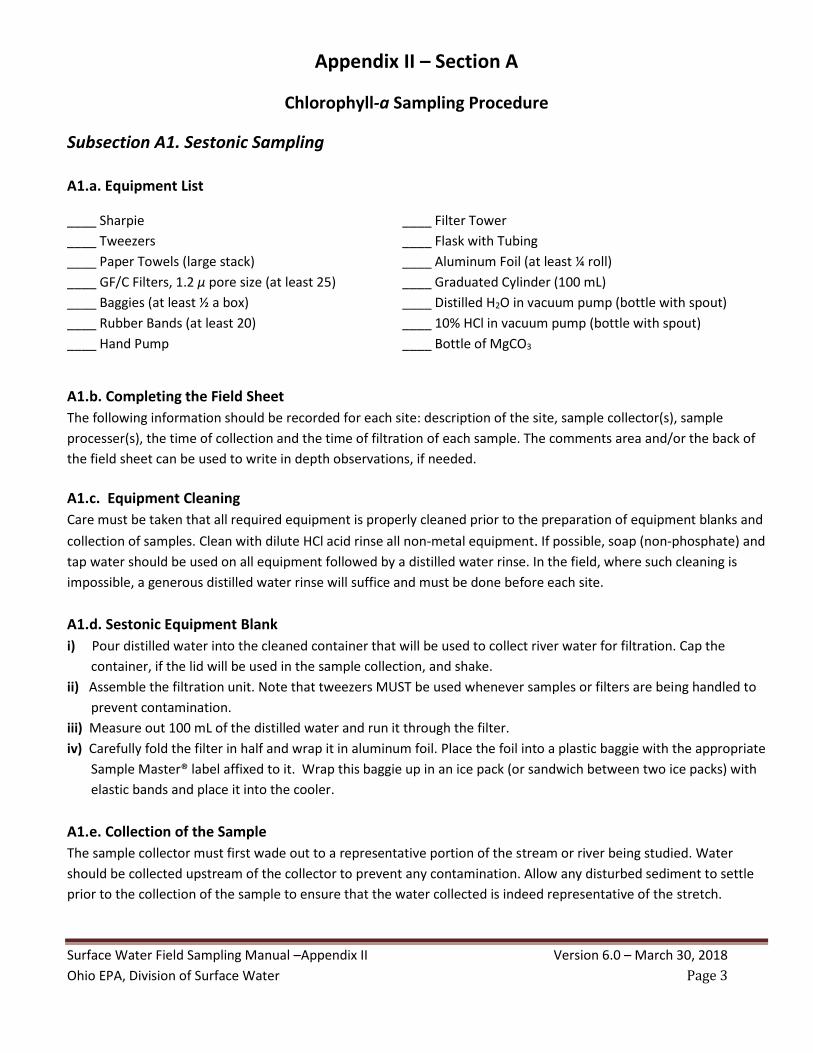
Subsection A1. Sestonic Sampling A1.a. Equipment List
____ Sharpie ____ Filter Tower
____ Tweezers ____ Flask with Tubing
____ Paper Towels (large stack) ____ Aluminum Foil (at least ¼ roll)
____ GF/C Filters, 1.2 µ pore size (at least 25) ____ Graduated Cylinder (100 mL)
____ Baggies (at least ½ a box) ____ Distilled H2O in vacuum pump (bottle with spout)
____ Rubber Bands (at least 20) ____ 10% HCl in vacuum pump (bottle with spout)
____ Hand Pump ____ Bottle of MgCO3
A1.b. Completing the Field Sheet
The following information should be recorded for each site: description of the site, sample collector(s), sample
processer(s), the time of collection and the time of filtration of each sample. The comments area and/or the back of
the field sheet can be used to write in depth observations, if needed.
A1.c. Equipment Cleaning
Care must be taken that all required equipment is properly cleaned prior to the preparation of equipment blanks and
collection of samples. Clean with dilute HCl acid rinse all non-metal equipment. If possible, soap (non-phosphate) and
tap water should be used on all equipment followed by a distilled water rinse. In the field, where such cleaning is
impossible, a generous distilled water rinse will suffice and must be done before each site.
A1.d. Sestonic Equipment Blank
i) Pour distilled water into the cleaned container that will be used to collect river water for filtration. Cap the
container, if the lid will be used in the sample collection, and shake.
ii) Assemble the filtration unit. Note that tweezers MUST be used whenever samples or filters are being handled to
prevent contamination.
iii) Measure out 100 mL of the distilled water and run it through the filter.
iv) Carefully fold the filter in half and wrap it in aluminum foil. Place the foil into a plastic baggie with the appropriate
Sample Master® label affixed to it. Wrap this baggie up in an ice pack (or sandwich between two ice packs) with
elastic bands and place it into the cooler.
A1.e. Collection of the Sample
The sample collector must first wade out to a representative portion of the stream or river being studied. Water
should be collected upstream of the collector to prevent any contamination. Allow any disturbed sediment to settle
prior to the collection of the sample to ensure that the water collected is indeed representative of the stretch.

Surface Water Field Sampling Manual –Appendix II Version 6.0 – March 30, 2018
Ohio EPA, Division of Surface Water Page 4
A1.f. Filtering the Sample
i) Filtering should be performed in subdued light as soon as possible after sampling to avoid errors resulting from
changes in the algal pigments in the sample after collection. If the water sample cannot be filtered immediately,
it is to be stored on ice in darkness. Filtration is to occur within 6-8 hours of water sample collection.
ii) Gloves should be worn during all parts of this procedure. Do not use the same pair of gloves as those used to
acquire the sample in the river.
iii) Measure out 100 mL of the collected water (or however much the sampler feels is necessary for the lab to detect
Chlorophyll_a, without too much water to prevent clogging the filter) and filter. As little as 60 ml can be enough
for the lab, just be sure to document the amount filtered. Always use a pair of tweezers when handling the
filters.
iv) Pour the subsample into the filter tower/funnel of the filtration apparatus and apply a vacuum (remember not to
exceed a pressure of 15 cm Hg). Rinse the sides of the filter tower/funnel with DI water. Do not draw the filter
dry with the vacuum; instead slowly release the vacuum as the final volume approaches the level of the
filter.).Filtration time should not exceed 10 minutes.
iii) Carefully fold the filter in half and wrap it in aluminum foil.
iv) Place the foil into a plastic baggie with the appropriate Sample Master® label affixed to it. Wrap this baggie up in
an ice pack (or sandwich between two ice packs) with elastic bands and place it into the cooler. The filter may be
kept on ice or sandwiched between two ice packs for up to 48 hours – as long the ice in the cooler is refreshed
often to keep from thawing significantly. Freeze the sample immediately upon return to an Ohio EPA facility with
a deep freeze, and before shipping to the laboratory. Then send the filter to the laboratory between two freezer
packs. If the laboratory will not process the filter immediately upon receipt, the laboratory should store the
sample at - 20o C.
Surface Water Field Sampling Manual –Appendix II Version 6.0 – March 30, 2018
Ohio EPA, Division of Surface Water Page 5
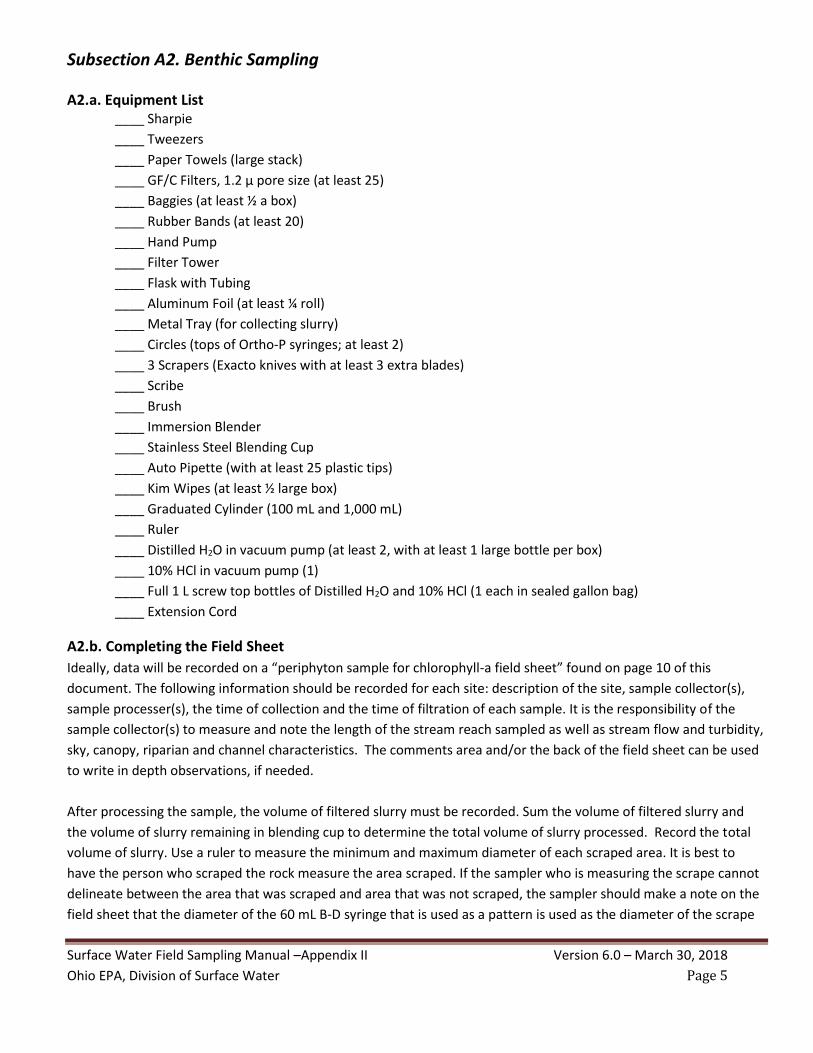
Subsection A2. Benthic Sampling A2.a. Equipment List
____ Sharpie
____ Tweezers
____ Paper Towels (large stack)
____ GF/C Filters, 1.2 µ pore size (at least 25)
____ Baggies (at least ½ a box)
____ Rubber Bands (at least 20)
____ Hand Pump
____ Filter Tower
____ Flask with Tubing
____ Aluminum Foil (at least ¼ roll)
____ Metal Tray (for collecting slurry)
____ Circles (tops of Ortho-P syringes; at least 2)
____ 3 Scrapers (Exacto knives with at least 3 extra blades)
____ Scribe
____ Brush
____ Immersion Blender
____ Stainless Steel Blending Cup
____ Auto Pipette (with at least 25 plastic tips)
____ Kim Wipes (at least ½ large box)
____ Graduated Cylinder (100 mL and 1,000 mL)
____ Ruler
____ Distilled H2O in vacuum pump (at least 2, with at least 1 large bottle per box)
____ 10% HCl in vacuum pump (1)
____ Full 1 L screw top bottles of Distilled H2O and 10% HCl (1 each in sealed gallon bag)
____ Extension Cord
A2.b. Completing the Field Sheet
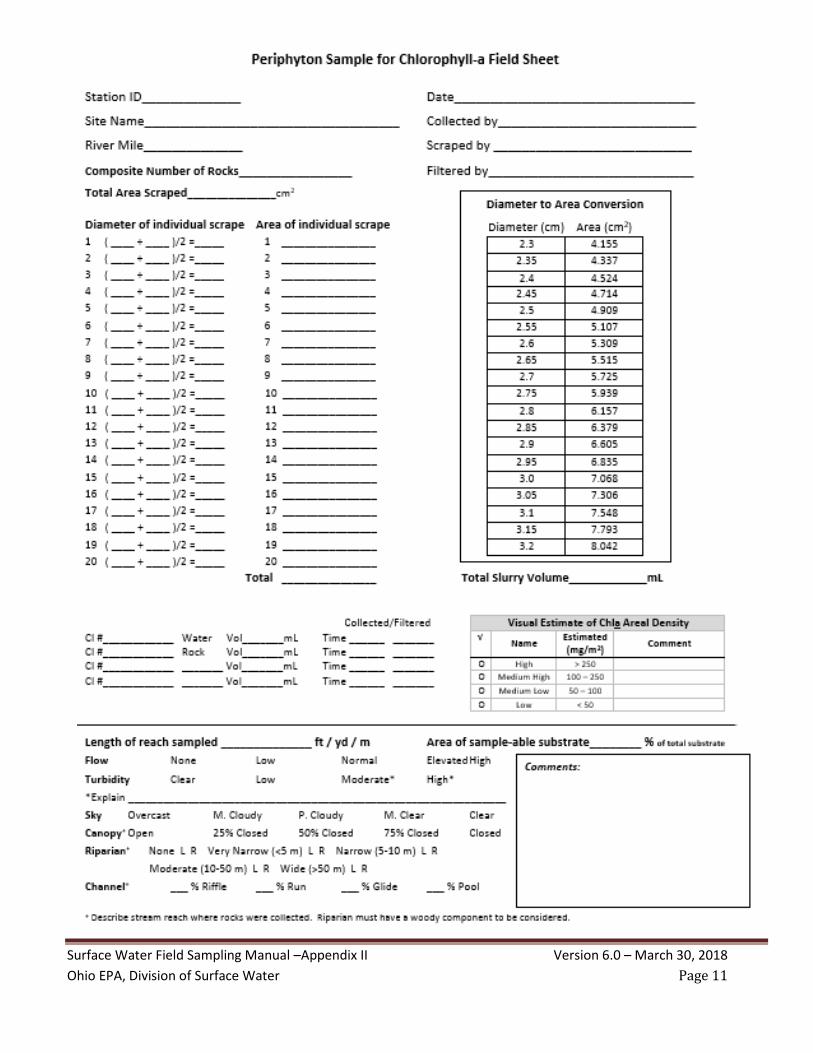
Ideally, data will be recorded on a “periphyton sample for chlorophyll-a field sheet” found on page 10 of this
document. The following information should be recorded for each site: description of the site, sample collector(s),
sample processer(s), the time of collection and the time of filtration of each sample. It is the responsibility of the
sample collector(s) to measure and note the length of the stream reach sampled as well as stream flow and turbidity,
sky, canopy, riparian and channel characteristics. The comments area and/or the back of the field sheet can be used
to write in depth observations, if needed.
After processing the sample, the volume of filtered slurry must be recorded. Sum the volume of filtered slurry and
the volume of slurry remaining in blending cup to determine the total volume of slurry processed. Record the total
volume of slurry. Use a ruler to measure the minimum and maximum diameter of each scraped area. It is best to
have the person who scraped the rock measure the area scraped. If the sampler who is measuring the scrape cannot
delineate between the area that was scraped and area that was not scraped, the sampler should make a note on the
field sheet that the diameter of the 60 mL B-D syringe that is used as a pattern is used as the diameter of the scrape

Surface Water Field Sampling Manual –Appendix II Version 6.0 – March 30, 2018
Ohio EPA, Division of Surface Water Page 6
instead of direct measurements of the minimum and maximum diameters of the scrape. Calculate the average
diameter of each individual scrape. Use the diameter to area conversion table (on field sheet) to determine the area
of each individual scrape. Sum the areas of the individual scrapes to determine the total area scraped.
A2.c. Equipment Cleaning
Care must be taken that all required equipment is properly cleaned prior to the preparation of equipment blanks and
collection of samples. Clean with dilute HCl acid rinse all non-metal equipment. If possible, soap (non-phosphate) and
tap water should be used on all equipment followed by a distilled water rinse. In the field, where such cleaning is
impossible, a generous distilled water rinse will suffice and must be done before each site.
A2.d. Rock Scraping Equipment Blank
i) Pour distilled water into one of the trays that will be used to collect the rock scrapings.
ii) All instruments (or portions of instrument, i.e. not the handles) that will be used in the collection of the
periphyton samples, such as knives, brushes, and stirrers, must contact this distilled water so that the
equipment blank will accurately reflect any potential for contamination. Then pour the water into the blending
cup and allow the blender to come into contact with the water.
iii) Assemble the filtration unit. Note that tweezers MUST be used whenever samples or filters are being handled to
prevent contamination.
iv) Use the pipette to collect 5 mL of water of the distilled water in the tray. Run this sample through the filter.
Note that each pipette tip can only be used with the preparation of one blank or one sample.
v) Carefully fold the filter in half and wrap it in aluminum foil. Place the foil into a plastic baggie with the
appropriate Sample Master® label affixed to it. Wrap this baggie up in an ice pack (or sandwich between two ice
packs) with elastic bands and place it into the cooler.
A2.e. Collecting the Rocks
i.) Time of day for collection. To afford the greatest opportunity for light penetration into the benthic zone, rocks
should be collected between 1000 and 1800 hrs, inclusive1. Some excursion (about 0.5 hr) from this time window
can be tolerated due to workload and staff resources. It is critical that notes on light penetration to the substrate
should be recorded for each site. Factors such as canopy cover, topographic shade, cloudiness, presence of
surface scum, and water column turbidity (caused by both suspended sediment and seston) should be described
accurately. The transparency of the water column is inversely affected by both color and turbidity.
ii.) Representative reach and minimum number of rocks to be collected. A target of 15 rocks is sought and
collected from a representative length of stream. The goal is to collect rocks at a sample length that is
representative of the site (reach) and at a minimum of 100 m sampling length.
1 Chlorophyll-a production from algal biomass will stabilize after a certain amount of light incidence occurs of the course of the
day (Matheson et al. 2012, p. 1627). Whether this saturating amount is achieved in a given sampling event depends on the time
of day, season of year, and the stream conditions identified above. Sampling within the 1000-1800 hr time window affords the
best opportunity to achieve light saturation.

Surface Water Field Sampling Manual –Appendix II Version 6.0 – March 30, 2018
Ohio EPA, Division of Surface Water Page 7
a. Sample anywhere rock substrate is available with a target to sample various hydrological flow structures
(i.e. riffle, run, pool, and glide)2.
b. When rock substrate is not as prevalent, such as at sites that experience heavy sedimentation or have
natural bedrock slabs, the target rock count may not be realized. In these situations, less than 15 rocks
may be collected. However, an effort to sample the equivalent area should be made (i.e., scrape 15 or
nearly 15 circles from the rocks which are collected). Document the uniqueness of the situation in the
Periphyton Sampling Field Sheet (p. 10) and, most importantly, in the “Field Comments” section of the
DES laboratory submission sheet [form EPA 4709 (1/10)]. While atypical, this type of sampling approach
should be undertaken to understand the trophic status of the sampling reach (site).
c. If less than 15 rocks are collected and they are sampled from non-representative areas of the stream
(e.g., only 4 rocks were collected, and all were sampled from the edge of water), then the benthic algae
analysis should be discontinued. Document the uniqueness of the situation in the Periphyton Sampling
Field Sheet (p. 10) and/or field reconnaissance sheet.
iii.) How to collect. The collection procedure involves wading to a given portion of the site, reaching down, and
selecting a representative rock to be sampled. A gentle swirling of the rock in the water will help to remove any
sediment that has settled on the surface and dislodge macroinvertebrates. Also, gently brushing the underside
of the rock by hand will help to dislodge caddisfly cases. Rocks selected should clearly show signs of having been
undisturbed; such rocks have a distinct bi-colored appearance due to algae growing only on the exposed surface.
If two or more samplers participate in the collection, disturbance of downstream sampling sites should be
avoided or minimized. One sampling method that minimizes disturbance by two samplers is to align a sampler on
each edge of water and progress upstream in a zig-zag pattern, with each sampler responsible for one-half of the
stream width. It should be noted that the portion of the stream closest to the edge tends to be grazed and have
less algae. Typically, a green swath can be seen nearer the middle of the stream. Rocks should be collected from
that greener area as that is more representative of the stream segments productivity. Rocks in the clearer areas
along the edges should be avoided, as well as any rocks that are not submerged.
iv.) Number of days following a storm (runoff) event before collection. High streamflow velocity and corresponding
particle movement has great potential in scouring benthic algae. Community composition tends to change as
flow velocity changes (Biggs 2000). For example, filamentous forms dominate at low velocity (<< 1.6 m/s)
whereas mucilaginous mats dominate at high velocity (> 3 fps).
a. Following a moderate to low storm event, sampling is typically scheduled in the following week. Benthic
surveys usually begin on Tuesday of a given week and in association with a dissolved oxygen survey using
multi-parameter sensor devices. Hence, if a moderate to low storm event occurred anytime in the
preceding week (up to the Saturday evening prior), the survey would not be cancelled. For moderate to
high storm events, benthic sampling for the following week should be postponed one week or longer and
scheduled when flows return to normal (specific to the time of year) during the interim week (or weeks).
b. Flow hydrographs should be monitored from US Geological Survey gauges at or near a given site with
attention paid to existing flow versus (long-term) normal flow. Flow conditions for benthic sampling are
2 Sampling different microhabitats allows for collection of a large number of co-existing species (Wetzel 2001, pp. 594-599). In
streams with moderate to high enrichment, runs typically produce the highest biomass because the lower velocities (compared
to riffles) prevent sloughing of periphyton (Biggs and Kilroy 2002, p. 28). In streams with moderate to low enrichment, riffles
produce the highest biomass because higher mass (nutrient) transfer occurs in higher velocity areas (also p. 28).

Surface Water Field Sampling Manual –Appendix II Version 6.0 – March 30, 2018
Ohio EPA, Division of Surface Water Page 8
considered ideal if existing flow has been at base level for 10 or more days without interruption by a
moderate or high storm event.
c. When a study watershed is prone to frequent high flow events, sample as late after the previous high
flow event as is sensibly possible (Biggs and Stokseth 1996).
v.) Time between collection and scraping. After collection, the rocks should be stored in a shaded area, and
submerged in ample stream water to mitigate temperature changes. The rocks can be transported to the
scraping location with these precautions taken. The rocks should be processed at a location that is less than 30
minutes of total transport time from the collection area.
A2.f. Scraping the Rocks
i) When deciding what area on the rock to scrape, bear in mind that the goal is to acquire a representative sample of
the algal growth on the rock wherever such growth is possible. As such, avoid areas on the rock where the rock
was buried and areas where the growth is extreme. Choosing an area to scrape that is near an edge of the rock is
recommended to limit how much material may get stuck on other parts of the rock, as well as material from
other parts of the rock that could get into the final sample. And again, keep in mind that the time between
collecting and scraping rocks should be minimized.
ii) Perhaps the most important aspect of the whole procedure is making sure that the area scraped is known.
Therefore, the collector should inscribe a circular boundary onto the surface of the rock. Care must be taken to
make sure that any material removed from the rock by the process is collected into the pan.
iii) If large plant fibers are present within the sample site, collect these first. Use best professional judgment to
decide which portions of the algae belong within the sample area and which are outside the boundary. Large
fibers should be diced up within the pan as much as possible.
iv) Use a knife (flat edge knife best at this phase) and brush to remove material from the area being sampled. All
such material should be collected in the pan used to prepare the blank. A squirt bottle filled with distilled water is
often useful here, especially when removing algal material from the brushes.
v) Use care when rinsing the cleaned sample surface with the squirt bottle to avoid contaminating the sample with
material outside the boundary. If the surrounding surface is covered with loose sediment, such a rinse may prove
impossible.
vi) Use best professional judgment to determine when a given rock sample has been sufficiently scraped.
vii) Measure and record the diameter of the area scraped. If this region ends up exceeding the original bounds, make
several “diameter” measurements and average.
A2.g. Filtering the Sample and Duplicate Sample
i) Filtering should be performed in subdued light as soon as possible after sampling to avoid errors resulting from
changes in the algal pigments in the sample after collection. If the water sample cannot be filtered immediately,
it is to be stored on ice in darkness. Filtration is to occur within 24 hours of water sample collection.
ii) Transfer all material collected in the pan into a blending container. Use the spray bottle to rinse the pan into the
container to make sure that nothing is left behind.
iii) Use an immersion blender to thoroughly mix the sample and prevent sediment from settling to the bottom.
iv) Use the pipette to acquire a 5 mL (or however much the sampler feels is necessary for the lab to detect
Chlorophyll_a, without too much water to prevent clogging the filter) aliquot of the sample from the blending
cup. Continue to mix the sample while using the pipette.
Surface Water Field Sampling Manual –Appendix II Version 6.0 – March 30, 2018
Ohio EPA, Division of Surface Water Page 9
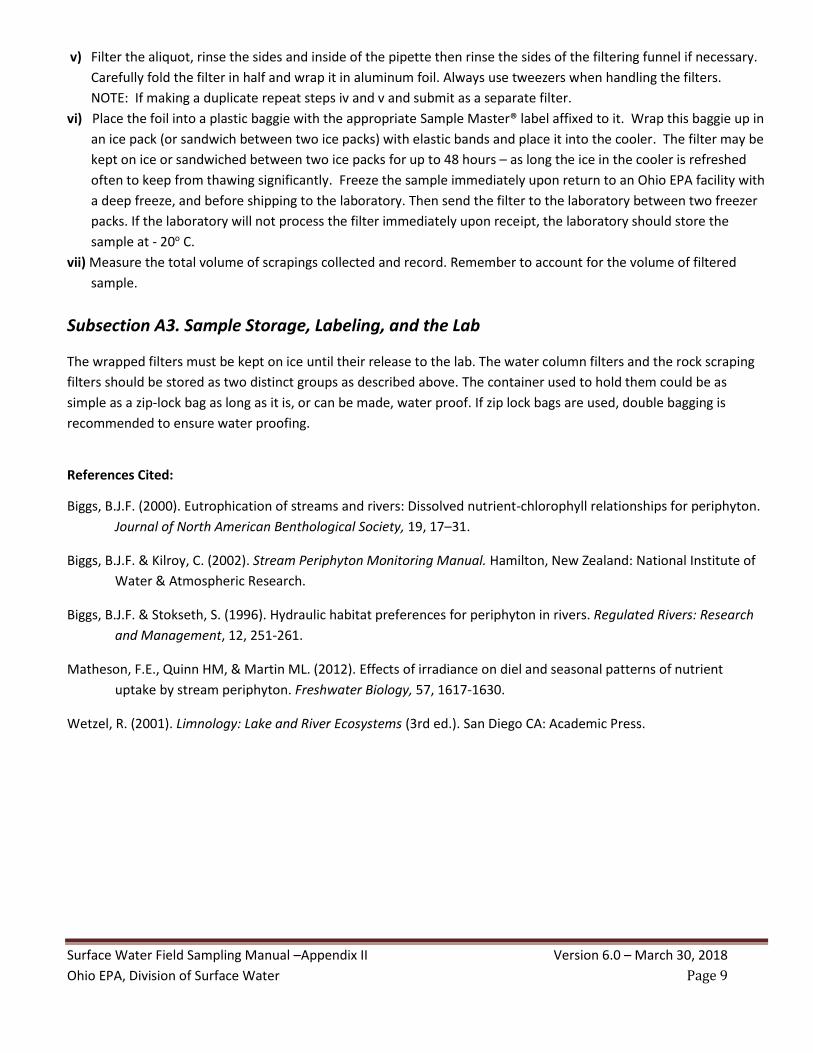
v) Filter the aliquot, rinse the sides and inside of the pipette then rinse the sides of the filtering funnel if necessary.
Carefully fold the filter in half and wrap it in aluminum foil. Always use tweezers when handling the filters.
NOTE: If making a duplicate repeat steps iv and v and submit as a separate filter.
vi) Place the foil into a plastic baggie with the appropriate Sample Master® label affixed to it. Wrap this baggie up in
an ice pack (or sandwich between two ice packs) with elastic bands and place it into the cooler. The filter may be
kept on ice or sandwiched between two ice packs for up to 48 hours – as long the ice in the cooler is refreshed
often to keep from thawing significantly. Freeze the sample immediately upon return to an Ohio EPA facility with
a deep freeze, and before shipping to the laboratory. Then send the filter to the laboratory between two freezer
packs. If the laboratory will not process the filter immediately upon receipt, the laboratory should store the
sample at - 20o C.
vii) Measure the total volume of scrapings collected and record. Remember to account for the volume of filtered
sample.
Subsection A3. Sample Storage, Labeling, and the Lab
The wrapped filters must be kept on ice until their release to the lab. The water column filters and the rock scraping
filters should be stored as two distinct groups as described above. The container used to hold them could be as
simple as a zip-lock bag as long as it is, or can be made, water proof. If zip lock bags are used, double bagging is
recommended to ensure water proofing.
References Cited:
Biggs, B.J.F. (2000). Eutrophication of streams and rivers: Dissolved nutrient-chlorophyll relationships for periphyton.
Journal of North American Benthological Society, 19, 17–31.
Biggs, B.J.F. & Kilroy, C. (2002). Stream Periphyton Monitoring Manual. Hamilton, New Zealand: National Institute of
Water & Atmospheric Research.
Biggs, B.J.F. & Stokseth, S. (1996). Hydraulic habitat preferences for periphyton in rivers. Regulated Rivers: Research
and Management, 12, 251-261.
Matheson, F.E., Quinn HM, & Martin ML. (2012). Effects of irradiance on diel and seasonal patterns of nutrient
uptake by stream periphyton. Freshwater Biology, 57, 1617-1630.
Wetzel, R. (2001). Limnology: Lake and River Ecosystems (3rd ed.). San Diego CA: Academic Press.
Surface Water Field Sampling Manual –Appendix II Version 6.0 – March 30, 2018
Ohio EPA, Division of Surface Water Page 10
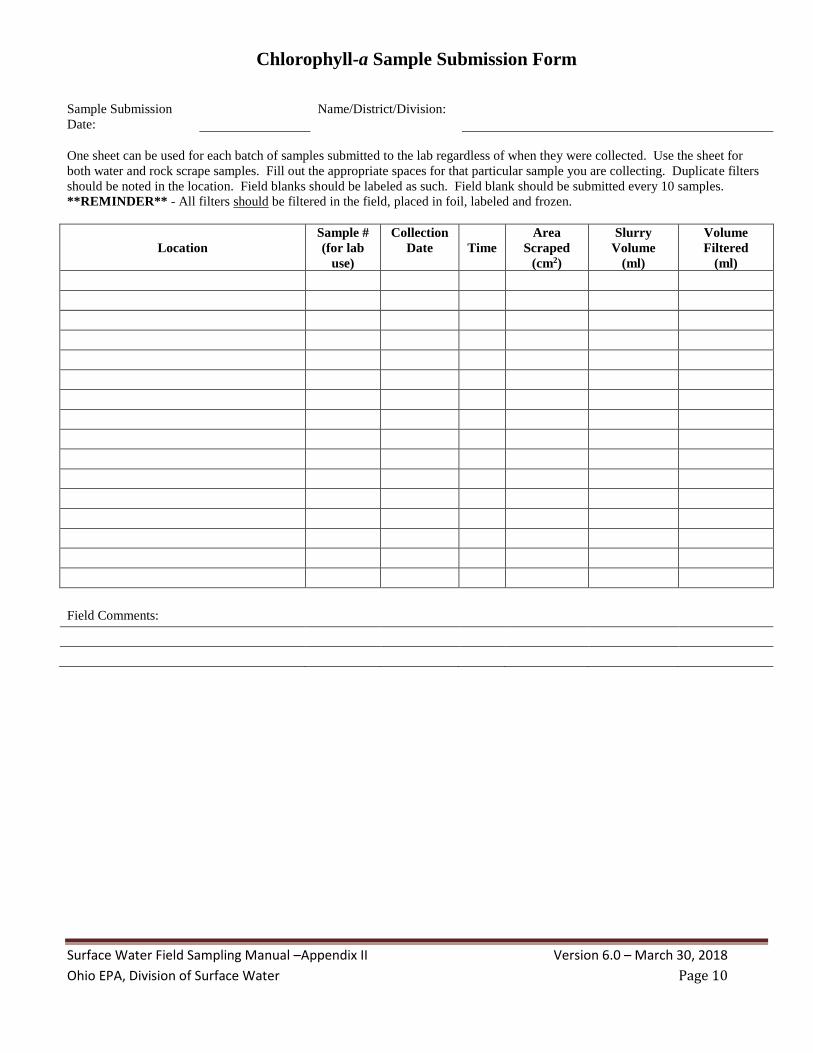
Chlorophyll-a Sample Submission Form
Sample Submission
Date:
Name/District/Division:
One sheet can be used for each batch of samples submitted to the lab regardless of when they were collected. Use the sheet for
both water and rock scrape samples. Fill out the appropriate spaces for that particular sample you are collecting. Duplicate filters
should be noted in the location. Field blanks should be labeled as such. Field blank should be submitted every 10 samples.
**REMINDER** - All filters should be filtered in the field, placed in foil, labeled and frozen.
Location
Sample #
(for lab
use)
Collection
Date
Time
Area
Scraped
(cm2)
Slurry
Volume
(ml)
Volume
Filtered
(ml)
Field Comments:
Surface Water Field Sampling Manual –Appendix II Version 6.0 – March 30, 2018
Ohio EPA, Division of Surface Water Page 11

Surface Water Field Sampling Manual –Appendix II Version 6.0 – March 30, 2018
Ohio EPA, Division of Surface Water Page 12
Appendix II - Section B
Critical Cleaning Procedure for Orthophosphate Sampling Syringes*
Critical cleaning procedure for ortho-P syringes: 1. Fill a warm water bath with enough water to cover a batch of syringes. 2. Add “Liqui-Nox” (or other non-Phosphorous detergent) per directions on package. 3. Pull plungers out of syringes and add both to bath. 4. Use small brush to scrub out the inside of all syringes, 5-10 sec apiece. Suck up detergent solution with syringes and squirt out. 5. Rinse once with DI water (or out-of-date nanopure) to remove detergent. 6. Rinse inside of syringes 1x thoroughly with squirt bottle of 10% HCl. 7. Triple rinse with DI. 8. Lay on clean drying rack and cover with clean paper towels until dry. 9. After about one day place the clean, dried syringes in labeled Ziploc gallon bags. Clean and re-use up to a maximum of three times.
*DO NOT USE THIS PROCEDURE WHEN DOING LOW-LEVEL ORTHO-PHOSPHORUS TESTING OR WHEN DOING
DISSOLVED ORGANIC CARBON TESTING – ONLY NEW, CLEAN SYRINGES SHALL BE USED WHEN COLLECTING SAMPLES
FOR THOSE TESTS.
Surface Water Field Sampling Manual –Appendix II Version 6.0 – March 30, 2018
Ohio EPA, Division of Surface Water Page 13
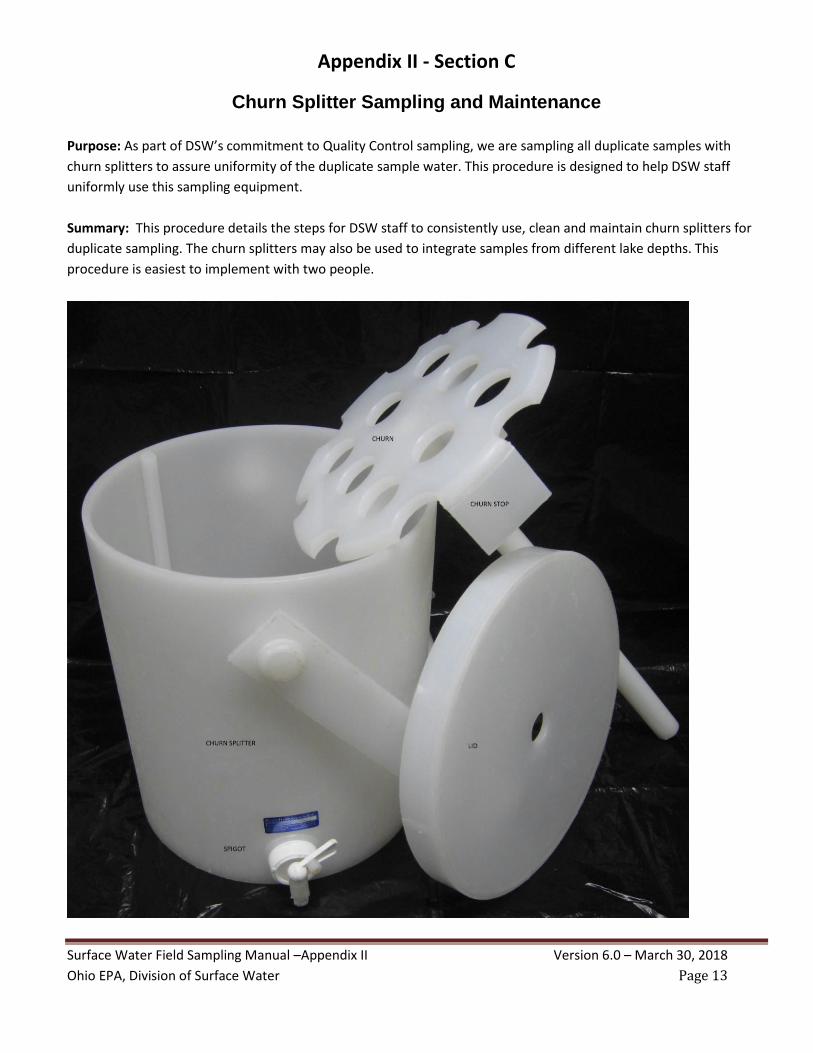
Appendix II - Section C
Churn Splitter Sampling and Maintenance
Purpose: As part of DSW’s commitment to Quality Control sampling, we are sampling all duplicate samples with
churn splitters to assure uniformity of the duplicate sample water. This procedure is designed to help DSW staff
uniformly use this sampling equipment.
Summary: This procedure details the steps for DSW staff to consistently use, clean and maintain churn splitters for
duplicate sampling. The churn splitters may also be used to integrate samples from different lake depths. This
procedure is easiest to implement with two people.
Surface Water Field Sampling Manual –Appendix II Version 6.0 – March 30, 2018
Ohio EPA, Division of Surface Water Page 14
Sampling Procedure
1. Choose the appropriate churn splitter (CS) for the total sample volume required. There is a 14-liter CS and an
8-liter CS. The 14-liter CS has a useable volume of about 12 liters. The 8-liter CS has a useable volume of
about 6 liters.
2. Using a bucket or other clean container that has been rinsed with site water, add 2 to 4 liters of site sample
water to the churn splitter and swirl the water around (also raising/lowering the churn paddle in the rinse
water), thoroughly rinsing the inside. Empty some of the water out through the spigot to rinse that also.
Extra water can be poured out at the end.
Note: The CS may be equipped with push button or turn valve spigots. The turn valves are not very sturdy and
should be operated carefully to extend their lifetime.
3. Fill the churn splitter with sample water using the same bucket or other container, swirling out any sediment
in the bucket/container each time more is added to the CS. Each succeeding fill of the bucket/container can
help collect any remaining sediment from the previous fill. Fill to a couple inches of the top of the tank. This
is the maximum height the churn goes during churning. This leaves about 2 liters of head space, which is
needed to properly mix the sample and avoid spillage.
4. Place the lid over the stirrer. For two-person operation, the stirring can be continuous. One person can hold
down the lid and operate the churn while the other can operate the valve and fill the containers. The sample
should be stirred at a uniform rate of approximately 9 inches vertical change per second by raising and
lowering the churn paddle, touching the bottom and then reaching the water surface with every stroke. Stir
the sample for about 10 complete cycles before withdrawing samples through the spigot. For one-person
operation, care must be taken not to displace the lid by over lifting the churn. The rate of churning and the
number of churns before sampling should still be achieved.
5. Withdraw the largest volume samples first, always operating the valve spigot in the full open position.
Churning must be continuous during sample withdrawal. If sampling is interrupted, you must again stir the
sample for about 10 complete cycles before resuming sample withdrawal. As samples are withdrawn, and
the volume in the CS decreases, the round-trip frequency with the churn paddle should increase to
compensate. Once you go below the recommended useable capacity, the churning becomes less efficient
and excessive air is introduced to the sample. This is undesirable and may change characteristics of the
sample water.
6. After all the water down to the level of the spigot has been withdrawn, the remaining water may be used for
filtered samples only. It is recommended to allow any sediment to settle out for a few minutes prior to
processing the filtered subsamples.
7. If the CS must be used a second time prior to following the complete cleaning procedure below, it should be
thoroughly rinsed with Nanopure water and site water.

Surface Water Field Sampling Manual –Appendix II Version 6.0 – March 30, 2018
Ohio EPA, Division of Surface Water Page 15
Cleaning Procedure
1. Wash all churn splitter parts with warm tap water and laboratory grade non-phosphate detergent (0.1-0.2%
solution). Scrub with a soft brush or sponge to avoid damage and pass some of the solution through the
spigot. Rinse well with tap water, passing some through the spigot.
2. Rinse well with de-ionized water, passing some through the spigot.
3. Dry and store CS in plastic bags.
Surface Water Field Sampling Manual –Appendix II Version 6.0 – March 30, 2018
Ohio EPA, Division of Surface Water Page 16
Appendix II - Section D
Sampling Method for Documentation of a Public Health Nuisance
Sampling Methods for Documentation of a Public Health Nuisance under OAC Rule 3745-1-04 (F) & (G)
Introduction
Ohio law (section 6117.34 of the Ohio Revised Code) provides a mechanism for local jurisdictions to initiate
complaints of unsanitary conditions and for the Director of Ohio EPA to issue orders to correct the problems.
Bacterial counts are a primary means used to document unsanitary conditions in lakes, rivers, and streams.
Bacteriological standards are the safe levels of bacteria (fecal coliform and E. coli) associated with the recreational
use designations (bathing waters, primary contact recreation and secondary contact recreation) of lakes rivers and
streams. The bacteriological standards are in Chapter 3745-1 of the Ohio Administrative Code (OAC). After a court
case established that the bacteriological criteria associated with recreational uses do not apply to small streams or
water bodies that are unlisted in the water quality standard rules the Agency adopted changes in OAC rule 3745-1-
04. A subsequent rulemaking occurred in March 2010 that designated all surface waters of the state primary contact
recreation waters - unless otherwise designated as bathing waters or secondary contact recreation. Using these
standards and the sampling protocols in this guidance Ohio EPA and local health departments can investigate
incidents of raw or poorly treated sewage in small streams, roadside ditches or similar water bodies that meet the
definition of surface waters of the state [OAC rules 3745-1-02(B)(83)] and take appropriate actions to alleviate public
health nuisances.
Subsection D1. General Bacteria Sample Collection Procedures
Water samples for bacteria analysis are to be collected directly into sterilized, glass or plastic bottles. Rubber gloves
should be used for protection against skin contact with potentially contaminated water. Samples may be collected by
hand according to the following procedure: The collection container is submerged carefully into the water to avoid
contact with soil and surface debris. This is accomplished by holding the container near the base with one hand and
removing the cap with the other hand. The container is quickly pushed into the water with the mouth of the
collection container down. The mouth of the bottle is then tilted upward into the current to fill. If there is no current,
move the container through the water in a continuous and unbroken movement. If residual chlorine is suspected
sterile containers from the manufacturer containing sodium thiosulfate should be used. The amount of sodium
thiosulfate used is 0.1 gm of the crystal powder. If samples must be collected from a bridge, the sterilized bottle
(without cap) may be secured to a string and lowered into the water. A weight may be needed to submerge the
bottle. Bottles must be filled to between 2/3 and 3/4 full.
Note: Special sampling considerations if intending to document a public health nuisance associated with raw or
poorly treated sewage pursuant to OAC rule 3745-1-04 (F) & (G): Samples must be conducted by, or under the
supervision of, Ohio EPA or a sanitarian registered under Chapter 4736 of the Ohio Revised Code:
D1.a. Sample Location
The bacteria sample shall be collected in “surface waters of the state” as defined in OAC rule 3745-1-02(B)(83),
and where odor, plus color and/or visual manifestations of raw or poorly treated sewage occur, as defined in

Surface Water Field Sampling Manual –Appendix II Version 6.0 – March 30, 2018
Ohio EPA, Division of Surface Water Page 17
Section 1.5. Bacteria samples also may be collected at a control location outside the influence of the sewage
discharge to determine background levels of bacteria in the surface water being tested.
D1.b. Sampling Time and Frequency
Bacteria samples may be collected year-round, but only when the surface water is at a flow that is representative
of dry weather, “baseflow”, conditions as defined in Section 1.4. A minimum of two bacteria samples must be
collected over a time period not to exceed thirty days. Bacteria samples may be collected at any time of day at
least two hours apart. It is recommended but not required, that at least two bacteria samples be collected on the
same day within the thirty-day period, because it is difficult to predict when baseflow conditions will change
rapidly.
D1.c. Preservation and Chain of Custody
The sample shall be cooled to 6 degrees Celsius and delivered to the laboratory for analysis within 6 hours.
According to 40 CFR 136.3, Table II, the time from sample collection to the time the laboratory begins analysis of
the sample is 8 hours. Make arrangements with your laboratory if transport time will exceed 6 hours to ensure
that the 8-hour ultimate holding time is not exceeded. A Chain of Custody form must be used for the transfer of
samples to the testing laboratory in order to get samples into evidence in a legal proceeding.
D1.d. Documentation of Baseflow or Dry-weather Flow
OAC Rule 3745-1-04(G)(1) requires that bacteria samples be collected only when the flow and height of the
surface water is not rapidly changing in response to rainfall or snow melt. This dry-weather flow condition is
called baseflow and is defined as “water that sustains stream flow during rainless periods.” (T. Dunne and L.B.
Leopold, 1978, Water in Environmental Planning, W.H. Freeman and Company). Baseflow levels in a stream can
change over time due to antecedent rainfall and saturated soil conditions.
Before collecting bacteria samples, document that the surface water being tested is at baseflow. For the
purposes of OAC rule 3745-1-04(G)(1) a baseflow condition will be present if and only if all three of the following
field observations are met: (1) the channel water stage is less than bankfull, and (2) muddy-brown turbidity from
runoff of silt/clay is not present, and (3) there is no visual evidence of runoff from wet pavement or snowmelt in
the upstream vicinity of where the bacteria sample is collected.
For the purposes of OACD rule 3745-1-04(G)(1) the ‘stage” of the water is defined as the elevation of the water in
the stream channel. And “bankfull flow” occurs when the channel is completely full and the stream stage is level
with the floodplain (Dunne and Leopold, 1978). Observations on baseflow conditions may be recorded on the
Public Health Nuisance Field Form provided in Section 1.6.1.
If available, USGS real-time flow hydrograph data and/or rainfall data from the National Weather Service or other
local sources can be used to further document that baseflow conditions were present at the time of the sample.
The Ohio River Valley Water Sanitation Commission (ORSANCO) uses a “dry-weather” rainfall criterion of 72
hours antecedent dry period, and a “wet-weather” criteria of 48-hour antecedent dry period plus at least 0.3
inches of precipitation in a six-hour period. Measurements on stage height to the nearest (cm) may be taken to
document that the flow did not change rapidly between the two required bacteria samples. These additional
data are not required in order to document baseflow conditions at the time of sampling.

Surface Water Field Sampling Manual –Appendix II Version 6.0 – March 30, 2018
Ohio EPA, Division of Surface Water Page 18
Subsection D2. Documentation of Odor, Plus Color, and/or Other Visual Manifestations of
Raw or Poorly Treated Sewage. To document a public health nuisance under OAC rule 3745-1-04(F)(1) bacteria samples should be collected only
when there is evidence of odor, plus color, and/or other visual manifestations of raw or poorly treated sewage. For
purposes of meeting the requirements of this rule, the following explanations of odor, color, and other visual
manifestations of raw or poorly treated sewage are provided as guidelines for staff to use in the field.
D2.a. Odor: A fully acceptable system for characterizing odor has not been developed. Jain, et al (1977,
Environmental Impact Analysis, Van Nostrand Reinhold Company, pp. 195-200) state that the contaminant odor
of septic sewage a commonly accepted odor descriptor type known as “rotten egg”, which results from the high
amount of organic matter and sulfide compounds present. In addition, failing sewage systems often have a
unique septic odor that combines with the rotten egg smell. Health effects from odors include reducing appetite,
producing nausea, causing headaches, and disturbance of sleep, breathing, and olfactory sensation (Jain, et al.
1977).
For each odor contaminant, a concentration can be defined for which there can be no human perception of
the odor, generally known as the odor threshold. Odor intensity levels can be measured by the following
scale following Jain, et al. (1977):
Levels Descriptors
0 No odor
1 Odor threshold (very slight)
2 Slight odor
3 Moderate odor
4 Strong odor
An environment with no odor at all is considered to be an ideal air environment. The “odor threshold”
represents a tolerable level, and a gradient of impairment of the air environment is found from the sequence
of slight to moderate to strong odor levels.
A violation of OAC rule 3745-1-04(F)(1) will exist if septic sewage odors are found at levels greater than or
equal to a slight odor level (level 2) as perceived by the investigator at the time of sampling. Observations on
odor may be recorded on the Public Health Nuisance Field Form provided after Section 1.6.
D2.b. Color: Apparent color means the color of water that includes substances in solution and color due to
suspended matter. Raw or poorly treated sewage contains a mixture of carbon based organic matter, sulfide
compounds, oils and greases, and other compounds that may create a nuisance in surface waters. The colors
imparted by raw or poorly treated sewage may range from white to black with various shades of grey within the
spectrum. In addition to the imparted color a characteristic rainbow sheen may or may not be present as a result
of oils refracting ambient light.

Surface Water Field Sampling Manual –Appendix II Version 6.0 – March 30, 2018
Ohio EPA, Division of Surface Water Page 19
Brown-orange-yellow colored water would be expected in water that contained silts and/or clays, diatoms,
humic and/or tannic acids, and/or elemental iron from acid mine drainage. Observations on the type of
apparent color present in the surface water at the time of sampling may be recorded on the Public Health
Nuisance Field Form provided in Section 1.6.1.
D2.c. Other Visual Manifestations of Raw or Poorly Treated Sewage: OAC rule 3745-1-04(F)(1) indicates that a
public nuisance may exist if visual manifestations of raw or poorly treated sewage other than color are also
present in the surface water. OAC rule 3745-1-04 (A), (B), & (E) define other visual types of evidence of sewage as
including: sewage sludge particles in the water, sewage sludge deposits in bottom sediments, floating oils and
scums, and nuisance growths of aquatic weeds and algae from nutrient enrichment. A nuisance also may be
caused by the growth of “sewage fungus”, which is defined as a slimy matrix of bacteria, fungi, and protozoa
associated with sewage. Bacteria including, among others, the Sphaerotilus-Leptothrix group, are associated with
the “sewage fungus” matrix. These bacteria can form extensive cotton-wool-like plumes (white, grey, or brown)
of filamentous mats in areas of organic pollution and are aesthetically undesirable (Curtis, E.J.C., 1969 Sewage
Fungus: Its Nature and Effects, in Water Research, Vol. 3, pp. 29-311, Pergamon Press). Observations on visual
manifestations of problems other than color may be recorded on the Public Health Nuisance Field Form provided
in Section 1.6.1.
Subsection D3. Public Health Nuisance Field Form As a standard operating practice, Ohio EPA field personnel should utilize the Public Health Nuisance Field Form
below when collecting samples pursuant to OAC rule 3745-1-04 (F) & (G). Local Health Departments and other
sanitarians registered under OAC Chapter 4736 may use the form at their discretion because the form is not
required by the rule.

Surface Water Field Sampling Manual –Appendix II Version 6.0 – March 30, 2018
Ohio EPA, Division of Surface Water Page 20
Public Health Nuisance Field Form, OAC Rule 3745-1-04(F)&(G)
Description of Event Location________________________________________________________ Latitude: ___________________ County_____________________________________ Longitude: __________________ Township___________________________________ Agency____________________________________________________________________________ I certify that bacteria samples were collected at times when the surface water being tested met the odor, plus color and/or other visual manifestation of raw or poorly treated sewage requirement of OAC rule 1-04(F)&(G).
Printed Name of Sample Collector _______________________________________ Title_______________________ Signature of Sample Collector _______________________________________ Date________________________ ======================================================================================= Bacteria Sample # ____________ Bacteria Sample # ___________ Location of Sample __________________________ Location of Sample_________________________ _________________________________________ ________________________________________ Date of Sample _________________________ ___ Date of Sample ____________________________ Time of Sample _____________ AM ___ Time of Sample _____________ AM ___
PM ___ PM ___ Baseflow Documentation: Baseflow Documentation: Stage less than bank full ____ yes _____ no Stage less than bank full ___ yes _____ no Muddy-brown turbidity absent ____ yes _____ no Muddy-brown turbidity absent ___ yes _____ no Pavement/ snow melt runoff absent ____ yes _____ no Pavement/ snow melt runoff absent ___ yes _____ no [All three baseflow conditions must be met (yes) before a bacteria sample can be collected] Odor Documentation: Odor Documentation: _____ No odor, level (0) _____ No odor, level (0) _____ Odor Threshold (very slight), level (1) _____ Odor Threshold (very slight), level (1) _____ Slight Odor, level (2) _____ Slight Odor, level (2) _____ Moderate Odor, level (3) _____ Moderate Odor, level (3) _____ Strong Odor, level (4) _____ Strong Odor, level (4) [An odor level of 2 or greater must be met before a bacteria sample can be collected] Visual Documentation: (check all that apply) Visual Documentation: (check all that apply) Color Documentation: Color Documentation: [non sewage colors] [sewage colors] [non sewage colors] [sewage colors] _____ clear, no color _____ white _____clear, no color _____ white _____ brown-yellow-orange _____ gray _____brown-yellow-orange _____ gray _____ muddy-brown _____ black _____ muddy-brown _____ black Other Visual Manifestations: Other Visual Manifestations: ____ oily sheen _____ aquatic plants ____ oily sheen _____ aquatic plants ____ floating scums _____ sewage fungus ____ floating scums _____ sewage fungus ____ suspended sludge _____ algae ____ suspended sludge _____ algae ____ sludge deposits _____ other* ____ sludge deposits _____ other*
[At least one sewage color and/or other visual manifestation of sewage must be met before a bacteria sample can be collected. Check all the above that are present at the time of sampling.]
Additional field notes, as needed, should be written on the reverse side of this form.
Surface Water Field Sampling Manual –Appendix II Version 6.0 – March 30, 2018
Ohio EPA, Division of Surface Water Page 21
Appendix II - Section E
Compliance and Whole Effluent Toxicity Sampling
Specific objectives of the compliance and whole effluent toxicity (bioassay) sampling conducted of regulated entities
typically include the following:
• Verify accuracy of reports and program self-monitoring.
• Support permit development reissuance and/or revision and compliance evaluation inspections.
• Determine the quantity and quality of effluent.
Sampling, analysis, preservation techniques, sample holding times, and sample container requirements are provided
in Section E of the Surface Water Field Sampling Manual.
Subsection E1. Effluent Sample Collection
E1.a. Sample Types
Two types of sample techniques are used by Ohio EPA: grab and composite. The type of samples taken should be
consistent with those required in the NPDES permit to the extent possible.
Grab Samples. The collection of a grab sample is appropriate when a sample is needed to:
• Represent an effluent that does not discharge on a continuous basis.
• Provide information about instantaneous concentrations of pollutants at a specific time.
• Sample effluent that is not expected to vary over the 24-hour period (e.g. settling basin discharge).
• Corroborate composite samples.
• Monitor parameters not amenable to compositing (e.g., pH, temperature, dissolved oxygen, chlorine,
purgeable organics, oil and grease, E.coli, and others specified by the NPDES permit, which may include
phenols, sulfites, and hexavalent chromium).
Composite Samples. Composite samples are collected when:
• Average pollutant concentration during the compositing period is desired.
• Mass per unit time loadings are calculated.
• Wastewater characteristics are highly variable.
DSW staff should consider variability in waste stream flow rate, parameter concentrations and the approved EPA
methods when choosing compositing methods, sampling equipment (tubing and containers), and quality assurance
procedures.
Surface Water Field Sampling Manual –Appendix II Version 6.0 – March 30, 2018
Ohio EPA, Division of Surface Water Page 22
E1.b. General Guidelines
The following general guidelines apply when taking samples:
• Take samples at a location specified in the NPDES permit and/or at a location selected to yield a
representative sample. Occasionally, municipal plant permits may specify sampling prior to chlorination. For
these plants, monitor all parameters at the pre-chlorinated location except E. coli, pH, and total residual
chlorine.
• Use the sampling method (grab or composite) specified in the permit. Some parameters that must be
collected as an individual grab sample are dissolved oxygen, oil and grease, E. coli, purgeable organics,
sulfides, cyanide, and total phenols.
• Avoid collecting large nonhomogeneous particles and objects.
• Collect the sample holding the container with the opening facing upstream into the flow to avoid
contamination.
• Collect sufficient volume to allow for quality assurance testing (see Tables E-1 and E-2 in the Surface Water
Field Sampling Manual)
• When sampling for compliance purposes only (no WET sampling), test schedules should be chosen based
on the size and type of facility.
The following general guidelines apply when using automatic samplers:
• Collect samples where the wastewater is well mixed. Collect the sample near the center of the flow channel
at mid-depth.
● Oil and grease samples should be collected in a quiescent location and should be collected from near the
water surface.
• Obtain a sufficient volume of sample to perform all required analyses plus any additional amount for
quality control. Individual portions of a composite sample should be at least 100 milliliters to minimize
sampler solids bias. Generally, samplers should be set to collect at least 24 aliqouts (1/hr) and volume for
each can be calculated based on total volume needed and the capacity of each jar. Where effluent is highly
variable or the study plan objectives indicate the need, more aliquots may be collected.
Since the aliquot volume is influenced by how and where the sample intake screen is set at each individual
site, the aliquot volume should be checked and verified and adjusted if necessary, prior to starting the
sampler program.
The sampler should be filled with ice around the sample bottle to maintain the collected sample at 6°C.
• For automatic samplers that use a peristaltic pump, obtain adequate flow rates in the sampler tubing to
effectively transport the suspended solids. To avoid solids bias, the velocity of the wastewater in sample
tubing should be at least 2 feet per second (fps) and the tubing diameter should be at least 0.25 inch.
Surface Water Field Sampling Manual –Appendix II Version 6.0 – March 30, 2018
Ohio EPA, Division of Surface Water Page 23
• For composite samples, a start time and end time shall be recorded. The holding time for the samples
begins when the first aliquot is dispensed into the composite sample container.
● Field parameters should be collected at the start and end times to document effluent conditions.
Subsection E2. Whole Effluent Toxicity (WET) Sampling
WET is a National Pollutant Discharge Elimination System (NPDES) permits program parameter designed to evaluate
the toxicity of the entire waste stream as opposed to its individual components. The DSW staff person should
understand the permittee's WET testing requirements so that the appropriate objectives can be met. These
objectives may include:
• Assess adequacy of self-monitoring procedures.
• Document presence or absence of toxic conditions.
• Identify need to perform Toxicity Reduction Evaluation (TRE) and/or a Toxicity Identification Evaluation
(TIE).
• Identify permit terms and conditions that may not be strong enough to ensure state WET water quality
standards are met.
All WET samples should usually be collected by composite sample to be consistent with the DSW biomonitoring
guidance and NPDES permit conditions (exceptions may be made for discharges from settling ponds or other uniform
discharges). Upstream control water samples should be submitted to the laboratory along with the effluent samples.
Samples taken for toxicity testing purposes must be analyzed within 36 hours after completion of sample collection.
E2.a. Effluent
The WET testing effluent sampling strategy should be specified in the NPDES permit. In some instances, the sampling
location specified in the permit may not be adequate for the collection of a representative sample. In that case, OEPA
staff should determine the most representative sampling point available and collect a sample at that location as well
as the location specified by the permit (or chosen by the permittee). Effluent samples must be representative of the
entire final effluent discharge and free of contamination from other sources.
Effluent samples used to conduct the acute toxicity tests shall be collected as 24-hour composite samples. If the
effluent is chlorinated for disinfection purposes, the effluent sample should be collected at a point prior to
chlorination. However, if dechlorination is an integral part of the disinfection system at the facility, the sample should
be collected at the final outfall.
E2.b. Upstream/Dilution Water
The choice of dilution water to use in WET definitive tests should be specified in the NPDES permit and depends on
the purpose of the toxicity test. Synthetic dilution water is used to evaluate the inherent toxicity of the effluent.
Dilution water from the receiving stream or a nontoxic equivalent is used to test for interactions after an effluent
discharge thoroughly mixes with the receiving water (where state laws allow for a mixing zone). Receiving waters,
synthetic waters, or synthetic waters adjusted to approximate receiving water characteristics may be used for
dilution water, if the water meets the qualifications for an acceptable dilution water. For Ohio EPA-conducted WET
testing, upstream water is prioritized as the dilution water of choice as long as the QA protocols are met (outlined in

Surface Water Field Sampling Manual –Appendix II Version 6.0 – March 30, 2018
Ohio EPA, Division of Surface Water Page 24
“Ohio EPA Permit Guidance #5, 1998”). If Ohio EPA staff do not have safe access to the receiving stream, they should
request the WET lab use synthetic water for dilutions.
Dilution water obtained from receiving waters should be collected following all sampling procedures including the
use of a chain-of-custody form, and should kept at 6°C. To ensure that no appreciable change in toxic characteristics
occurs before testing, the holding time from the time the receiving water sample is collected to the first use of the
receiving water sample in the WET test initiation must not exceed 36 hours unless a variance has been granted. The
location of the receiving water sample should be noted on the field form and the chain-of-custody form. It should be
upstream and out of the influence of the permitted outfall. Care should be taken to assure than any upstream
backflow of the effluent is avoided when selecting the upstream sampling location. The location should also be free
of other sources of contamination (e.g., other facility outfalls). If the facility’s 801 station is appropriately located
then samples should be taken there. Field parameters should be collected at the upstream sampling location to help
verify the location is not influenced by the site or an upstream source.
E2.c. Upstream/Downstream Water
If data is needed for wasteload allocations, downstream samples should be collected to determine receiving water
hardness or additional parameters as needed. These samples should generally be collected at or near the facility’s
901 station (after mixing of effluent).
Unless specifically modified by the NPDES permit, an acute toxicity test of an effluent requires that an upstream
control sample be collected. The upstream control sample is to be collected as a grab sample upstream from the
zone of effluent and receiving water interaction.
E2.d. Testing
Acute toxicity tests conducted by Ohio EPA will normally be static tests. Acute toxicity tests may be categorized as
either screening tests or definitive tests. A screening test is a test in which the effluent and control solutions are
evaluated at full strength. This is an inexpensive test designed to indicate presence or absence of toxicity in the
effluent. A definitive test uses dilutions of the effluent to quantify toxicity.
Since detection of toxic conditions in the Acute Screening test (>50% adverse effects such as mortality or lack of
motility) may require re-sampling of the WWTP effluent with subsequent definitive testing, district staff may choose
to forgo the screening test and move directly to definitive testing (resource-dependent) if there is a reasonable
expectation that the screening will detect toxic conditions (e.g. previous tests had >50% adverse effects).
These two types of tests are described further below:
1. Acute Screening Tests: These tests are performed by Ohio EPA to screen for toxicity in the effluent. The
effluent and control solutions are tested full strength, but the test durations are 48 hours for both
Pimephales promelas and Ceriodaphnia dubia.
2. Acute Definitive Tests: A definitive test is designed to quantify the amount of toxicity in an effluent. In
order to accomplish this, the effluent is diluted to various concentrations with one of the control waters. A
minimum of 5 effluent concentrations shall be used in a definite test. The typical dilutions used are 100, 50,
25, 12.5 and 6.25 percent by volume effluent.

Surface Water Field Sampling Manual –Appendix II Version 6.0 – March 30, 2018
Ohio EPA, Division of Surface Water Page 25
E2.e. Quality Assurance
There may be instances when poor survival or other adverse effects exhibited by control organisms preclude the use
of data from an effluent toxicity test and the test must be repeated. The following conditions outline when a repeat
of an acute toxicity test is mandatory.
A repeat of an acute toxicity test is mandatory when a combination of mortality and adverse effects in both receiving
water and laboratory controls exceeds 10 percent of a particular species. A repeat test is not necessary if there is 10
percent or less affected in one of the two control waters. A repeat test is necessary only for the species exhibiting
unacceptable effects in the controls.
Failure to follow approved procedures may result in a requirement to repeat a toxicity test. Any deviations from
approved procedures should be explicitly described in the report of the tests results.
E2.f. Chemical Analysis
A sufficient volume of effluent shall be collected to allow aliquots for use in acute toxicity tests and chemical analysis.
Bioassay effluent sampling may be coordinated with other sampling requirements as appropriate to avoid
duplication. The analyses detailed in the currently effective Part I, Effluent Limitations and Monitoring Requirements
tables in the NPDES permit need to be conducted for the effluent sample. In addition, alkalinity and hardness (as
CaCO3) should be measured. Chemical analysis must comply with Ohio EPA accepted procedures.
When WET sampling is conducted, a complete list of conventional, nutrient and metal pollutants need to be collected
and analyzed (use Bioassay Composite and Bioassay Grab test schedules). Also, priority organic pollutants in the
Volatile, Acid and Base/neutral fractions must be collected.
References
Reporting and Testing Guidance for Biomonitoring Required by the Ohio Environmental Protection Agency, Permit
Guidance 5, Final. Ohio EPA, Division of Surface Water, Revision 1, July 1998

Surface Water Field Sampling Manual –Appendix II Version 6.0 – March 30, 2018
Ohio EPA, Division of Surface Water Page 26
Appendix II - Section F
Water Quality Sonde Deployments
Subsection F.1 Introduction
This section outlines best practices for the deployment of auto-logging water quality sondes (sondes). Sondes can be
outfitted with sensors to collect many parameters, but commonly Ohio EPA staff collect the set of temperature,
specific conductivity, pH, and dissolved oxygen (DO). The resulting data are utilized in various analyses, including
supporting the assessment of nutrient enrichment and identifying the influence of intermittent non-point sources on
conductivity. Details of the type of data collected and how it supports a project are documented in the QAPP for that
project. The processes documented in this procedure are appropriate for deployments where equipment is deployed
for less than 2 weeks and is retuned to the central laboratory location. Longer-term deployments that require field
calibration and maintenance are outside the scope of this procedure.
Subsection F.2 Equipment preparation
F.2.a. Calibration: The manufacturer's specifications are to be followed. Specific procedures vary based on
equipment manufacturer and type. Ohio EPA has developed a maintenance and calibration log that is maintained for
each instrument. The log consists of two parts: a maintenance log (F.7.a) and a calibration log (F.7.b). For each sonde
deployment the calibration should be logged in the maintenance log and a calibration log filled out documenting the
details of the calibration. Each form should be filled out completely. Calibration is to be performed to known
standards or be traceable to a known standard. The exception is dissolved oxygen, which is calibrated with air
saturated tap water or water saturated air.
F.2.b. Programming: Sondes are programmed by staff to begin taking readings at a certain time. This date, time and
interval is typically reflected on the sonde deployment request form. Staff are to write the sonde serial number on
the deployment field sheet (F.7.c), along with other related information.
F.2.c. Additional Documentation: Any instability in readings should be documented within the comments of the
calibration log, as this is possibly a sign of sensor damage in the pH or DO components. Unusual sensor wear or other
peculiarities noted during the calibration and programming should be noted in the appropriate location. Any
maintenance done to the sonde, such as changing sensors, sensor components, batteries or servicing the pH
reference junction, should be documented in the maintenance log (F.7.a).
Subsection F.3 Deployment
F.3.a Field conditions: All sondes should be appropriately secured when deployed. Ohio EPA typically uses a
stainless-steel sleeve to protect the body of the sonde as well as provide additional weight. The stainless-steel tubes
slide over the body of the sonde and are secured when the deployment sensor guard is tightened. Other securing
mechanisms can be appropriate if they provide adequate protection of the sonde against the field conditions.
F.3.b. Sampling method: Sondes are to be placed in a location that captures median stream character. For example,
a sonde should not be placed in the only deep pool of the stream segment being assessed. However, if the stream is

Surface Water Field Sampling Manual –Appendix II Version 6.0 – March 30, 2018
Ohio EPA, Division of Surface Water Page 27
largely pooled and sluggish, water moving more swiftly should not be sought out. In streams with typical run-riffle-
pool-glide structure, the most ideal location to place the sonde is within the run or glide. These segments have
sufficient velocity to help prevent biofouling but have slower velocities than riffles, which may move coarser bed
materials into the protective sleeve and sensor guard, making them difficult to remove. This also ensures the
adequate velocity required for some sensors (Ohio EPA does not have any of these sensors currently). Large riffles
and waterfalls can have substantial local impacts due to reaeration. If these are uncommon in the reach being
assessed, they should be avoided by deploying on the upstream end of them.
Sonde deployment location needs to be representative of the conditions across the channel. This is typically
accomplished by placing the sonde within the thalweg of the stream where most of the flow occurs. In general,
eddies and peripheral areas should be avoided. In some streams, especially larger streams with wide channels, lateral
variability can be a concern. If these concerns arise they should be discussed in the Quality Assurance Project Plan for
the project. The probes need to avoid sediment deposits at the stream bottom. If a sonde is being deployed in deep
water, an empty cubitainer or similar device should be used to float the sensors into the water column. In the case of
bracketing a point source, the downstream sonde needs to be deployed beyond the mixing zone.
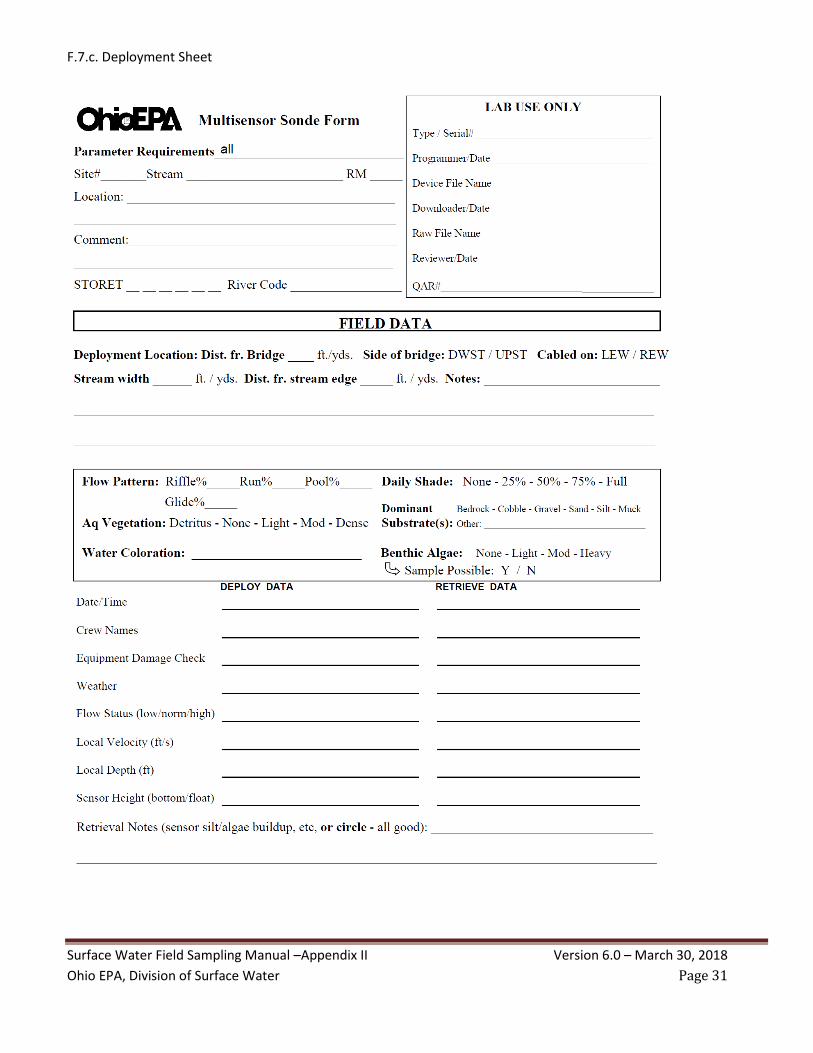
F.3.c. Documentation (field notes): For every sonde deployment, field sheets need to be filled out (F.7.c). Sonde
field sheets document the date, time, exact location of deployment, and qualitative environmental data (such as
depth, velocity, substrate, flow regime, rainfall and weather condition) at the time of deployment. These
observations are repeated at sonde retrieval to allow the user to interpret the data under the specific conditions that
occurred at the time of deployment.
Subsection F.4 Equipment Retrieval
F.4.a. Inspection: Upon retrieval, the sensors should be visually inspected, and any conditions with potential effects
on data quality should be noted on the field sheet. Probes need to be maintained in the same condition as the
deployment, to the extent possible, when the storage cap is put on. If substantial fouling occurs and is minimally
disrupted, the post-check process can identify the impact on the data.
F.4.b. Documentation (field notes): For every sonde retrieval, a field sheet needs to be filled out. Sonde field sheets
document the date, time, qualitative environmental data at the time of retrieval, and sonde inspection results.
Subsection F.5 Data management
F.5.a. Data download and storage: The raw data files are downloaded from the sondes, typically during the QC post-
check process. The files are saved in the Excel .csv format (comma separated value). The raw files are stored locally
on the state of Ohio servers. Raw data is organized by year and project. The downloaded file names are created
using the start date of the deployment (YYYYMMDD), site number (project specific meaning), watershed or project
name, and the STORET station. (e.g. 20180724_01_Swan_123456.csv).
F.5.b. Post-check measurement: Upon the return of equipment from the field, a post-check measurement shall be
performed. This must be done no later than one day after the return of the equipment. All sondes are placed in a
bath of aged tap water for five minutes before being turned on. Data is then logged for at least 40 seconds, after
which the data is recorded. This data is used as a control point to validate the calibration of the sondes and evaluate
possible issues with fouling. The post-check data is logged electronically and on a hard copy then stored with hard
copies of the field sheets.

Surface Water Field Sampling Manual –Appendix II Version 6.0 – March 30, 2018
Ohio EPA, Division of Surface Water Page 28
F.5.c. Data review: A staff person within the Modeling, Assessment and TMDLs section at Ohio EPA reviews the raw
data with regard to collected QC data and transfers it to editable fields for adjustment/approval. The raw datafiles
(.csv’s) are moved into an Excel workbook and initially trimmed so the start and end time correspond to the deploy
and retrieval times. Then, the post-check data is fitted with a trendline and the trendline is bounded by the specified
accuracy of the sensors being evaluated. If the post check data lies outside of the accuracy range for a specific sensor,
data collected with that sensor is not approved. The values are rounded to the appropriate significant units prior to
making this assessment. For example, if a sonde D.O. sensor reads 8.62 mg/L, the average of the bath is 8.5 mg/L,
and the specified accuracy is 0.1 mg/L the reading would be rounded to 8.6 and kept. If the value were above 8.65 it
would be rejected. Other anomalies in the data are considered and field notes are reviewed. If data is removed from
the dataset, a specific quality assurance record (QAR) note is developed. QARs are recorded in files stored on the
state of Ohio’s servers. Once all data for a site is reviewed, the field sheet is initiated and dated by the reviewer. At
this point, the data is approved and can be used.
Subsection F.6 Maintenance and Care
F.6.a. Routine maintenance
o Maintenance should be performed according to manufacturer's specifications
o Need for maintenance is continuously tracked in the calibration and maintenance logbook and the lab
post-check process outlined in this procedure.
o Malfunctioning equipment shall be evaluated for problems using manufacturer troubleshooting guides
and in-house best professional judgment.
F.6.b. Storage during field season: The equipment should be stored according to the manufacturer’s
recommendations, except for HACH® branded equipment that has a serviceable reference junction for pH sensors.
These reference junctions are prone to leaking and the manufacturer’s recommendation to store in a moist
environment should not be followed. The sensors should be surrounded by water (full cup) so air bubbles do not
develop within the reference junction. The compromise is slightly faster wear on the pH sensor cathode and
electrode.
F.6.b. Winterizing: The external battery supply for each sonde must be removed during long term storage. The pH
porous junctions are to be stored separately in KCL solution. The sensors are to be fully submersed in pH 4 buffer
solution. As a pre- or post-season maintenance item, the DO silver anode may be treated with ammonia to lessen
the effects of oxidation. Winterizing helps prolong the life of the sensors but is not required for quality data if other
QA procedures are followed.
Subsection F.7 Supporting Documents
The following forms are used by Ohio EPA staff.

F.7.a. Maintenance Log
Date Initial Calibrated DownloadedPost-
checkedCleaned
Batteries
ChangedSurvey NOTES: Problems, repairs and/or misc.
Page _____
MAINTENANCE LOG FOR EQUIPMENT MODEL __________________ NUMBER __________________

F.7.b. Calibration Log
Surface Water Field Sampling Manual –Appendix II Version 6.0 – March 30, 2018
Ohio EPA, Division of Surface Water Page 31
F.7.c. Deployment Sheet