surface treatment of cellulose ethers ytmodifiering av
TRANSCRIPT

Examensarbetet omfattar 15 högskolepoäng och ingår som ett obligatoriskt moment i
Högskoleingenjörsexamen i Kemiingenjör – tillämpad bioteknik, 180 hp
Nr 4/2014
Surface treatment of cellulose ethers
Ytmodifiering av cellulosaetrar
Linus Wikström

Examensarbetet omfattar 15 högskolepoäng och ingår som ett obligatoriskt moment i
Högskoleingenjörsexamen i Kemiingenjör – tillämpad bioteknik, 180 hp
Nr 4/2014
Surface treatment of cellulose ethers
Ytmodifiering av cellulosaetrar
Linus Wikström, [email protected]
Examensarbete, 15 hp
Ämneskategori: Teknik
Högskolan i Borås
Institutionen Ingenjörshögskolan
501 90 BORÅS
Telefon 033-435 4640
Examinator: Mikael Skrifvars
Handledare, namn: Jonas Karlsson
Handledare, adress: Akzo Nobel
444 85, Stenungsund
Uppdragsgivare: Akzo Nobel, Performance additives, Stenungsund
Datum: 2014-06-13
Keywords: Cellulose ether, cellulose, Bermocoll, glyoxal, surface treatment with
glyoxal, EHEC

Examensarbetet omfattar 15 högskolepoäng och ingår som ett obligatoriskt moment i
Högskoleingenjörsexamen i Kemiingenjör – tillämpad bioteknik, 180 hp
Nr 4/2014
Acknowledgements
This 15 credit diploma work was performed at Akzo Nobel Performance Additives in
Stenungsund during the period of March – June 2014.
I would like to thank everyone who have shared their knowledge and taught me the methods
needed for completion of this work. Many thanks to Rolf Arvidsson, Bo Karlsson for their
help with glyoxal content analysis and Yvonne Klingberg for her help with t1/t2
measurements.
I would also like to thank my examiner at Högskolan i Borås, Mikael Skrivfars, for his help
and assistance.
I would like to specifically thank my supervisor, Jonas Karlsson for his help, advice and
invaluable guidance throughout my entire stay at Akzo Nobel Performance Addditives.
Last I would like to thank my family for their support and encouragement throughout this
diploma work.

Examensarbetet omfattar 15 högskolepoäng och ingår som ett obligatoriskt moment i
Högskoleingenjörsexamen i Kemiingenjör – tillämpad bioteknik, 180 hp
Nr 4/2014
Abstract
The aim of this diploma work was to execute surface treatment of non-ionic cellulose ethers
EHEC that AkzoNobel provides under the tradename Bermocoll®. In order for the cellulose
ether to dissolve without forming lumps, some surface treatment is commonly required. In
this work glyoxal has been used for this surface modification using two different lab-scale
methods that in different ways mimic the full scale production. It is an everlasting challenge
for the chemical industry to reduce the consumption of chemicals and also reduce energy
consumption in the production. Therefore one objective of this work was to gain fundamental
understanding about the glyoxal reaction with EHEC in terms of required equivalents glyoxal,
reaction temperature and reaction time. Another aim of this work was to compare the two lab
scale methods with regards to their predictivity and reproducibility of results.
One method is called the dry method in which a water solution of glyoxal was added to dry,
non-glyoxal treated EHEC at varying temperature during heavy agitation. The second method
is called the acetone method where the EHEC and glyoxal were first suspended in acetone at
room temperature, and then heated at different temperature for various time periods. The
parameters in the experiments made was chosen using a design of experiments (DoE)
approach in order to gain as much information as possible from a few experiments and also
facilitating a statistical analysis of the results.
This diploma work indicates that the acetone method have a better reproducibility and would
be the better choice when investigating various parameters for the reaction. On the other hand
the dry method might be better suited for the further analysis of temperature dependence of
the glyoxal reaction with cellulose ethers. The most important factor for the reaction was the
amount of glyoxal used, whereas it is indicated that the reaction temperature had a minor
effect on the reaction yields.
Key words: cellulose ether, cellulose, Bermocoll, glyoxal, surface treatment with glyoxal,
EHEC

Examensarbetet omfattar 15 högskolepoäng och ingår som ett obligatoriskt moment i
Högskoleingenjörsexamen i Kemiingenjör – tillämpad bioteknik, 180 hp
Nr 4/2014
Sammanfattning
Syftet med detta examensarbete var att utföra ytbehandling av non-joniska cellulosaetrar,
EHEC, som AkzoNobel säljer under varumärket Bermocoll ®. För att cellulosaetrar ska lösas
upp utan att bilda klumpar är det vanligt att ytbehandling krävs. I detta arbete har glyoxal
använts för denna ytmodifiering i två olika metoder i labbskala som på olika sätt efterliknar
den fullskaliga produktionen. Det är en evig utmaning för den kemiska industrin att minska
förbrukningen av kemikalier men också att minska energiförbrukningen i produktionen.
Därför var ett syfte med detta arbete att få grundläggande förståelse för glyoxal reaktion med
EHEC när det kommer till glyoxal ekvivalenter, reaktionstemperatur och reaktionstid. Ett
annat syfte med detta arbete var att jämföra de två labbskalemetoderna med avseende på deras
prediktivitet och reproducerbarhet av resultaten.
Ena metoden kallas för torrmetoden, där en vattenlösning av glyoxal tillsattes till torr, icke-
glyoxal behandlad EHEC vid varierande temperatur och kraftig omröring. Den andra metoden
kallas acetonmetoden där EHEC och glyoxal först suspenderas i aceton vid rumstemperatur
för att sedan värmas olika länge vid olika temperaturer. Parametrarna i experimenten valdes
med hjälp av en design av experiment (DoE) metod för att få så mycket information som
möjligt från ett fåtal experiment, men även för att underlätta den statistiska analysen av
resultaten.
Det här examensarbetet indikerar att acetonmetoden har en bättre reproducerbarhet och skulle
vara det bättre valet när man undersöker olika parametrar för reaktionen. Å andra sidan kan
torrmetoden vara bättre lämpad för ytterligare analyser av glyoxalreaktionens
temperaturberoende. Den viktigaste faktorn för reaktionen var den tillsatta mängden glyoxal,
medan data pekar på att reaktionstemperaturen har en klart mindre effekt på
reaktionsutbytena.
Nyckelord: cellulosaeter, cellulosa, Bermocoll, glyoxal, ytbehandling med glyoxal, EHEC
Examensarbetet omfattar 15 högskolepoäng och ingår som ett obligatoriskt moment i
Högskoleingenjörsexamen i Kemiingenjör – tillämpad bioteknik, 180 hp
Nr 4/2014
Innehåll 1. Introduction ...................................................................................................................... 1
1.1 Cellulose ....................................................................................................................... 2 1.2 Cellulose derivatives .................................................................................................... 3 1.3 Bermocoll ..................................................................................................................... 4 1.4 Dissolution ................................................................................................................... 5
1.5 Glyoxal ......................................................................................................................... 6 1.6 Design of Experiments ................................................................................................. 6 1.7 Dissolving time method ............................................................................................... 7 1.8 Total and free glyoxal method ..................................................................................... 7
2. Method and material ........................................................................................................ 7 2.1 Material ........................................................................................................................ 7
2.1.1 Dry method - apparatus ...................................................................................... 7
2.1.2 Dry method – chemicals ..................................................................................... 7 2.1.3 Acetone method – apparatus ............................................................................... 7 2.1.4 Acetone method – chemicals .............................................................................. 8 2.1.5 Dissolving analysis – apparatus .......................................................................... 8 2.1.6 Dissolving analysis – chemicals ......................................................................... 8
2.1.7 Total and free glyoxal – apparatus...................................................................... 8
2.1.8 Total and free glyoxal – chemicals ..................................................................... 8 2.1.9 Dry content – apparatus ...................................................................................... 9
2.2 Method ......................................................................................................................... 9
2.2.1 Dry method ......................................................................................................... 9 2.2.2 Dry method – Moisture dependency ................................................................ 11
2.2.3 Acetone method ................................................................................................ 11
2.2.4 Dissolution analysis .......................................................................................... 12
2.2.5 Bound glyoxal analysis ..................................................................................... 12 2.2.5.2 Free glyoxal analysis ............................................................................................ 13
2.2.6 Moisture content ............................................................................................... 13
3. Results and discussion .................................................................................................... 15 3.1 Dry method ................................................................................................................ 15
3.2 Dry method – Moisture dependency .......................................................................... 22 3.3 Testing the dry method............................................................................................... 23 3.4 Acetone method ......................................................................................................... 23
3.5 Testing the acetone method ........................................................................................ 33 3.6 Dry method vs. acetone method ................................................................................. 34
4. Conclusions ..................................................................................................................... 36 5. Future work .................................................................................................................... 38
6. Bibliography ................................................................................................................... 39
Appendix 1 Acetone method - Contour plots over 10 and120 min drying time

1
1. Introduction
In Sweden EHEC, ethyl hydroxyethyl cellulose [1], was first produced by Mo & Domsjö in
Örnsköldsvik and was sold under the name of Modocoll. The rights for Modocoll were
bought by Berol Kemi in Stenungsund and the EHEC product was changed into Bermocoll.
[2]
By making a chemical modification of cellulose a wide range of water-soluble derivatives can
be obtained that are environmentally friendly and has biodegradable advantages. [3] [4] [5]
The derivates have a significant variation in their properties which gives a huge number of
application fields. Some of these applications fields are paint, building industry,
pharmaceuticals and food products. [3] Others that use these water soluble cellulose ethers are
oilfield, household care and personal care. [4] [5]
Bermocoll is often used as a rheological modifier to thicken the products. [6] This thickening
effect is a result of how the polymers bind to each other and form a network. Along with the
forming of this network the solution viscosity will increase dramatically and therefore
improve the rheology properties. [7] [8] In addition to this thickening effect, Bermocoll also
contributes with good water retention which is necessary to keep the water from escaping
from the product. Cementitous adhesive for tile fixing is one example where water retention is
necessary for the product to work properly [6]
AkzoNobel Performance Additives RD&I department in Stenungsund develops products for
the paint industry as well as for the building and construction industry. In paint it is important
to have the right consistent, which can be adjusted with changed viscosity. To change the
viscosity we use water soluble polymers, such as Bermocoll products. The amount of how
much polymer is needed depend on molecular weight of the polymers. A polymer with high
molecular weight is a more effective thickening agent than the ones with low molecule weight
and requires therefor less amount of polymers. The upside of using a low molecule weight
polymer is that its color qualities are better but you’ll still need much more polymers to get
the wanted viscosity. [9] In the building industry fresh cement-based materials use non-ionic
cellulose ethers for thickening, retardation, water retention and air extraining. [10]
Bermocoll is very soluble in water, and upon dissolution the viscosity of the solution is
markedly increased. Two very important things when preparing an aqueous solution is to have
a good dispersion and complete wetting of the product before the dissolving begin. If the
product is not completely wetted before dissolution starts, lumps will likely be formed. [11]
These lumps will eventually dissolve but it will take a long time which is undesirable from a
customers’ perspective. The time of which the cellulose ether takes to dissolve in water is
called the hydration time. This hydration time can differ between products due to particle size
and if the surface of products has been treated in different manners. A common way of
surface treatment is by cross-linking the cellulose ethers. [12] Other ways of surface treatment
can be by spraying the particles with surfactants, salts and sugars and then drying in fluidized
beds. [13]
In order to lengthen the hydration time of certain Bermocoll products they are cross-linked
with the di-aldehyde glyoxal. The carbonyl groups of glyoxal react with hydroxyl groups of
the Bermocoll to produce hemi-acetal bonds that cross-links two cellulose ethers strands. The
pH on the water has an effect on the hydration time and a higher pH will give a faster
hydration time, which is when 10% of the final viscosity is achieved. In addition to pH,

2
temperature and particle size also have an impact on the hydration time. With increasing
temperature the hydration time decreases and with a smaller particle size the hydration time is
shortened. [14]
The aim of this diploma work is to perform surface treatment of Bermocoll with glyoxal using
two different methods in lab-scale. It is important to Akzo Nobel to have small scale methods
that can be translated into a full scale factory environment and the purpose here is to evaluate
the usefulness of these two methods with regards to their predictive power and reproducibility
of the results. For environmental sustainability reasons as well as for cost reasons it is also
important to use as little glyoxal as possible to achieve sufficient hydration times of the
products. In addition a potential decrease in reaction temperature would also be very
beneficial from an energy cost and environmental sustainability standpoint. Therefore
another aim of this work is to gain fundamental understanding about the glyoxal reaction with
Bermocoll in terms of required equivalents glyoxal, reaction temperature and reaction time.
In more detail the difference between these methods with regards to yields of the glyoxal
reaction, the dissolution time of surface treated Bermocoll samples, and the correlation
between bound glyoxal and the dissolution behavior have been studied. In order to gain as
much information as possible from a few experiments a Design of Experiments (DOE)
approach has been utilized for both labscale methods. The statistical analyses of these two
DOE’s have been done using a software called MODDE (insert reference) and the validity,
reproducibility and predicitivity of the models obtained have been evaluated and compared.
1.1 Cellulose
One of the most widespread and familiar natural polymeric substances is cellulose which
make up about fifty percent of the cell wall material in wood. [15] Cellulose is obtained either
from cotton linters or wood pulp, where cotton linters consist of almost pure cellulose and
yields an end product with higher molecule weight. [2] [15] Cellulose is a polysaccharide that
is built up by a long chain of glucose units, otherwise called anhydroglucose units. [15] These
units can also be called poly β-1,4-D anhydroglucopyranose. [16] Each of these
anhydroglucose units holds three hydroxyl groups and the cellulose molecule can therefore be
considered as a polyalcohol. [17]
Figure 1. The general structure of cellulose.
The most biodegradable, renewable and richest polymer in nature is cellulose and its
derivatives are commonly used as a pharmaceutical additive but also widely used in paper,
food, plastics and textiles. The reactivity of the three hydroxyl groups in poly β-1,4-D

3
anhydroglucopyranose, otherwise called anhydroglucose unit [15], offers huge possibilities
when made into derivatives. [16]
1.2 Cellulose derivatives
The specific chemistry of cellulose makes it possible for derivation which results in a wide
range of chemical units. These chemical units can have a high variety in porosity, mechanical
strength, water solubility and swelling ability but also in stability when it comes to pH and
temperature of the reaction. The fact that cellulose can be functionalized is of major scientific
importance. [16]
Figure 2. The reaction sequence of cellulose ether.
The first step in preparation of cellulose derivatives is always mercerization, which causes the
cellulose fibers to swell and is considered as an activation step. After this activation, that most
commonly is effected by the use of NaOH, there is two reactions to perform the etherification
of cellulose, the first reaction is called Williamson ether reaction and introduces an alkyl to
the cellulose. The second reaction is a base-catalyzed oxalkylation where the activated
hydroxyl groups are substituted with alkylene oxide groups. The etherification of cellulose
gives an access of base which needs to be neutralized; this neutralization is performed with a
weak acid producing water and salt formation (usually NaCl since NaOH is the most
commonly used base in mercerization). A purification step is also made to purify the product.
[18]
Etherification and esterification is the main functionalizing of cellulose which involves the
reactive hydroxyl groups mentioned above. Ethycellulose is one of the cellulose ether
derivatives and has generally been used as a thermoplastic material and is therefore the most
important derivative within etherification. When comparing cellulose material with its ether
derivatives it shows that most of the derivatives are more water soluble, biodegradable,
reactive and possibly exhibit equal safety as cellulose. [16]
Cellulose ethers come in varying forms; HEC (hydroxyethylcellulose) and CMC
(carboxymethylcellulose) [19] are examples of different products. HEC is formed when alkali
cellulose is reacted with ethylene oxide. If the HEC is reacted with ethylchloride it results in
EHEC. If cellulose reacts with monochloroacetic acid CMC is formed. [20]

4
The areas where water soluble cellulose ethers are used are many. A few examples are
household care, personal care, oilfield, food, pharmaceutical and building and construction
materials. But it’s specially used in paint and coatings. [4] [5]
The synthesis of Bermocoll, which is a non-ionic product, is a series of reactions as described
above that substitutes the cellulose backbone. Different series of reactions give a varying
substitution on the backbone and result therefore in different Bermocoll products. For
example have standard EHEC three reaction sequences, alkalization, ethoxylation and
ethylation when M-EHEC has both methylation and ethylation. The Bermocoll products have
different properties and are therefore divided into different groups. Some have a higher
thickening efficiency while others are more resistant against enzymatic attack. [21] For
example are thickening agents often used in our lives. We use it regularly in shampoo and
starch from corn or potatoes are used to give the sauce the right consistency. [9]
1.3 Bermocoll
Bermocoll products are produced in different particle sizes and in the form of a whitish free-
flowing powder. There are three main types of Bermocoll that are being manufactured:
EHEC, ethyl hydroxyethyl cellulose, (E and EBS)
MEHEC, methyl ethyl hydroxyethyl cellulose, (M, EM and EBM)
HM-EHEC, hydrophobically modified ethyl hydroxyethyl cellulose, (EHM)
Since the Bermocoll products are water-soluble and forming colloidal solutions are they used
in a variety of industrial applications. They are though mainly used in building products and
in water-based paint. Different Bermocoll products are acting as thickening agent, binding
agent, protective colloid and dispersing agent amongst other things. [21]
Figure 3. A general structure of Bermocoll.
O
OH
O
OOOH
O
OO
OO
OO
OH
O
OH O
O
O
O
O
OHOO
O
O
O
OH
O
OH
O
OH
O
OH
OHOH
O
O
O
O
OH

5
1.4 Dissolution
There are two different phases of dissolution when polymers go into solution. Dispersion,
which is the first phase, depends on the surface chemistry, instrumentation, technique and
morphology of the polymer. The second phase is hydration which loosens the polymer chains
but also expands their hydrodynamic volume and the solution is therefore gaining viscosity.
When the polymers come in contact with water they rapidly start to swell and get in contact
with nearby particles and glue together which forms lumps. The lumps will give a
considerable longer hydration time. To get minimal formation of lumps is it a requirement to
have good dispersion. Good dispersion will also provide a quick hydration in the final
applications. [22]
Many end use applications have their water soluble polymers delivered in its powder form
and thereby need to dissolve the powder in a water-based system. The tendency of forming
lumps when adding polymer to water is a technical problem which comes from the fact that
when water soluble polymer powder is added to a water-based system it results in a rapid
hydration and swelling of the powder. This rapid hydration and swelling of the powder takes
place at the interface between fluid phase and powder phase and beside the hydration and
swelling effect it’s also slowing down the fluid penetration into the core of the powder.
Ultimately it results in slowly dissolving gel agglomerates that are in diverse sizes and
persistent to dissolve. [4] [5] The fact that polymer particles take longer time to dissolve in
water than it takes for them to associate with each other is the origin of lump formation. One
way to improve the polymer’s dispersibility is to control the particle size. [22]
There are approaches that have been used to produce lump free dissolution with water soluble
polymers, of which three approaches are amongst the most commonly used. The first one
adds the powder slowly and therefore slows down the powder utilization a lot. The second
pre-wets the powder with a mixable solvent and the last one blends the powder with another
dry material before usage. The second and third approach can carry over substantial
concentrations of additives which could have negative effects. [4] [5]
But these approaches aren’t the only ones to avoid lump formation. An approach that uses
high shear induction equipment is used to suppress the formation of lumps during dissolution.
This approach exposes the mixture of powder and water system to high shear which will
break the formed lumps into individual polymer particles. One defect is that it requires
dedicated equipment when it shall be used. [4] [5]
Other approaches have been developed that are trying to provide lump free solutions. These
approaches are based on chemical or physical modifications of the water soluble polymer
powder. Bhargava, Vaynberg et al reports on a method that uses chemical modification of the
powder surface to improve the powders ability to disperse. To allow the particles to disperse
before its solubilization a surface cross-linking is made with either formaldehyde or
dialdehydes. [4] [5]

6
1.5 Glyoxal
In paint manufacturing, it is necessary to disperse the cellulose derivate before they are added
to the paint to avoid lump formation. The dispersion is often facilitated by a surface treatment
with glyoxal which forms crosslinking between the cellulose strands. The carbonyl groups of
glyoxal react with hydroxyl groups of the Bermocoll to produce hemi-acetal bonds that cross-
links two cellulose ethers strands (Figure 4). [14] This crosslinked product is reversible and
can be cleaved again, with a time delay, when it is dissolved in neutral or weackly acidic
water and is seen as an abruptly increase of viscosity without the formation of lumps. [23]
Hence, if the pH of the paint is increased the cross-linkages break and the cellulose ether go
into solution under controlled forms resulting in the wanted thickening effect on the water-
based paint.
Figure 4. Crosslinking between glyoxal and cellulose ether.
Many of the functionalizing reactions of cellulose are traditionally executed by harmful
solvents or toxic crosslinking agents which make it very important to develop a lot of
alternative crosslinking agents that are both less toxic and safer. Dialdehydes are a good
alternative to replace these toxic and non-biodegradable crosslinking materials. Formaldehyde
is an aldehyde that is excluded from the less toxic and safer crosslinking agents. One of the
recently used agents which is less toxic than formaldehyde is glyoxal. [24]
The pH on the water has an effect on the hydration time and a higher pH will give a faster
hydration time, which is when 10% of the final viscosity is achieved. In addition to pH,
temperature and particle size also have an impact on the hydration time. With increasing
temperature the hydration time decreases and with a smaller particle size the hydration time is
shortened. [14]
1.6 Design of Experiments
Today’s rapidly increasing cost for experiment has made it very important to obtain as much
relevant information as possible with each experiment but also to produce as much as possible
to the lowest cost. A common way to perform optimization were to change one factor at a
time, but it was proven in the early 20th
century that changing one factor at a time doesn’t
have to provide information about the optimum condition, especially when interactions
between the factors are present. This traditional optimization approach won’t let the
experimenter find the real optimum. In contrast relevant factors can be changed
simultaneously, in what is called a statistical experimental design, or Design of Experiments,
DOE. With such a design it is possible to obtain a reliable basis for decision-making that’s
providing a charter for changing the factors systematically with a limited number of
experiments. DOE is used to guarantee that the selected experiment will grant the maximum
amount of relevant information. By distributing the experiments in a rectangular form is it
+ (M)EHEC
Glyoxal
Glyoxal cross-linked EHEC

7
possible to identify a direction of where a better result is produced. DOE has many usages
with optimization, screening and robustness testing, and is often used in many different
industries. [25]
1.7 Dissolving time method
With the help of a viscometer the dissolving time can be analyzed. The way to dissolve a
cellulose derivative in a buffer solution is followed by continuous viscometry. The time it
takes to have a noticeable increase of viscosity, 10%, is called t1 and t2 is when 95% of the
final viscosity is reached. [5]
1.8 Total and free glyoxal method
An often used method to get a delayed solubility of cellulose ethers is to treat it with glyoxal.
The retardation effects is provided from the hemi-acetal crosslinks which is established when
the glyoxal reacts with the polymers hydroxyl groups. A procedure to quantify the free
amount of glyoxal in cellulose ethers is to let the cellulose ether sample be extracted with
tetrahydrofuran for four hours at room temperature. The free glyoxal amount is measured in
the extract by a colorimetric determination after it has reacted with MBTH (3-methyl-2-
benzothiazoline hydrazine hydrochloride). When the total amount of glyoxal is measured is
the cellulose ether dissolved at basic conditions and then determined by the same procedure as
for free glyoxal amount. [26]
2. Method and material
2.1 Material
2.1.1 Dry method - apparatus
Warring blender (model 32BL73)
Warring blender plastic lid with a hole for the syringe
Glass bowl
Syringe 5 milliliter
Oven (Termaks)
Weighing machine
Brush
Stopwatch
2.1.2 Dry method – chemicals
EHEC (Code 108820, AkzoNobel) having an DSethyl = 0.8-0.9 (degree of
substitutions ethyl per anhydroglucose unit), and MSEO = 2.5-2.9 (molar substitution
of ethylene oxide units per anhydroglucose unit). In the remaining sections this
material will be described as EHEC-LW.
Glyoxal, 40% aqueous solution (Alfa Aesar)
2.1.3 Acetone method – apparatus
Erlenmeyer flask

8
Agitator
Oven (Termaks)
Coffee grinder (Braun plus model)
2.1.4 Acetone method – chemicals
EHEC-LW
Glyoxal, 40% aqueous solution
Acetone
2.1.5 Dissolving analysis – apparatus
Viscometer Rheomat 108 or 180 equipped with measuring system cup and anchor
Water bath with thermostat
50 milliliter disposable syringe
Chart recorder
2.1.6 Dissolving analysis – chemicals
EHEC-LW
Standard buffer solution of pH 7.0
2.1.7 Total and free glyoxal – apparatus
Spectrophotometer
10 milliliter glass tubes
20 milliliter headspace vial, flat bottom (Agilent part.number 5182-0837)
Silicone/PTFE septa crimp seals-20 ml (cat.no 151287 Brown Chromatography)
100 ml measuring flask
100 ml beakers
Eppendorf Multipipett plus
Combitips 50 ml, 10 ml, 1 ml
Disposable hypodermic needle (0,80 x40 ml B Braun)
Syringe 5 milliliter (Luer REF 62.5605 Codan)
Needle 100 Sterican (0.80 x40 millimeter B Braun)
Acrodisc Syringe Filters 0.45 um GHP Membrane 25 ml (PALL Life 44Sciences)
Shaking apparatus
2.1.8 Total and free glyoxal – chemicals
EHEC-LW
Acetic acid
Tetrahydrofuran anhydrous (Merck KGaA)

9
2.1.9 Dry content – apparatus
Moist content apparatus (Sartorius)
2.2 Method
2.2.1 Dry method
his method was planned with MODDE software (Umetrics) using a full factorial DOE having
the reaction temperature and equivalents in the given interval, 40-80°C and 0.1-0.5
equivalents respectively, which resulted in seven reactions. The amount of EHEC-LW
powder was 100 grams for every reaction and the volume of 40% glyoxal solution and water
was calculated depending which equivalent each reaction should have.
Exp No Exp
Name
Run
Order Incl/Excl Temp
glyoxal
eq
1 N1 1 Incl 40 0,1
2 N2 4 Incl 80 0,1
3 N3 2 Incl 40 0,5
4 N4 3 Incl 80 0,5
5 N5 5 Incl 60 0,3
6 N6 6 Incl 60 0,3
7 N7 7 Incl 60 0,3
Table 1: DoE charter for the dry method
Figure 5. The full factorial design used
100 grams of EHEC-LW was heated in an oven. The temperature on the oven was set to the
reaction temperature (40°C, 60°C or 80°C). When the temperature on the powder was around
the reaction temperature the mixer it was taken out, after approximately 80 min in the oven.
During this time a water solution of glyoxal was prepared (0.1-0.5 wt% based on total amount
EHEC-LW with a total volume of five ml.
Two minutes after the mixer was taken out from the oven the glyoxal solution was added with
a syringe during one minute under mixing set on high speed. After the addition of glyoxal, the

10
powder was mixed for another minute and a half before the powder was poured into a plastic
beaker. The time from when the mixer was taken out from the oven to the time when the
powder was in a beaker was between nine and ten minutes.
Figure 6. Experimental set up for the dry method

11
2.2.2 Dry method – Moisture dependency
Beside the DOE experiments using the dry method, an investigation of how water affects t1
and t2 when added to dry powder was made. This investigation was performed in the same
way as the dry method mentioned above with the difference that water was added into dry
powder before the addition of glyoxal.
Glyoxal eq Temperature
0.25 Rt
0.25 rt + 5 ml water
0.25 rt + 15 g water Table 2. Charter for the moisture dependency
2.2.3 Acetone method
The acetone method was also planned with MODDE using a DOE that selected the
temperature, glyoxal equivalents and drying time in the designated intervals. The temperature
interval was set to 40-100°C, the drying time was between 10-120 min and the glyoxal
equivalent interval was 0.05-0.5 wt%. The DOE with these intervals resulted in eleven
reactions.
Exp No Exp
Name Run
Order Incl/Excl Temp Drying
time glyoxal
eq 1 N1 5 Incl 40 10 0,1 2 N2 2 Incl 100 10 0,1 3 N3 4 Incl 40 120 0,1 4 N4 7 Incl 100 120 0,1 5 N5 9 Incl 40 10 0,5 6 N6 8 Incl 100 10 0,5 7 N7 6 Incl 40 120 0,5 8 N8 11 Incl 100 120 0,5 9 N9 3 Incl 70 65 0,3
10 N10 10 Incl 70 65 0,3 11 N11 1 Incl 70 65 0,3
Table 3. DoE charter over the acetone method
Figure 7. The full factorial design used.
The amount of 20 g EHEC-LW was used for every reaction. 50 ml acetone was added to the
powder during stirring using a magnetic stirrer bar. A glyoxal/acetone solution was also added
to the powder, the amount of glyoxal added to 5 ml acetone was calculated depending on

12
what equivalents the reaction had. After 15 minutes of stirring, the solution was poured into a
petris dish for evaporation until the powder was dry. The amount of powder was first grinded
in a coffee grinder and then weighed. A small amount of powder, around 2 g, was taken out
for a pre-oven sample for analysis. The rest of the powder was equally divided between two
petris dishes that were subsequently heated in the oven. The temperature on the oven
depended on the reaction temperature chosen from the DOE.
2.2.4 Dissolution analysis
0,65 g of the sample was weighed in the viscometers measuring cylinder and roughly 5 ml
acetone was added. The solution was shaken before the container was mounted to the
viscometer in a water bath at 20°C. The viscometers stirring was started and set to 425 rpm.
50 ml of a tempered pH 7 buffer was added fast to the sample solution and the analysis was
immediately started. The provided results from the computer program are calculated from a
charter with the dissolution time against how much powder has dissolved.
2.2.5 Bound glyoxal analysis
The values for bound glyoxal is calculated from subtracting the measured free glyoxal value
from the total glyoxal value measured (vide infra).
2.2.5.1 Total glyoxal analysis
Approximately 0.10-0.15 gram of the sample were weighed in a 100 milliliter volumetric
flask. Distilled water was added until the flask was half-filled. The flask was shaken before 3-
4 drops of 25% ammonia and an agitator was added. The beaker was filled with distilled
water and placed for agitation for one hour.
A color reagent solution was prepared with 0,2 grams of 3-methyl-2-benzothiazoline
hydrazine hydrochloride (MBTH), 40 grams of acetic acid and 10 grams of distilled water.
The solution was placed for agitation for the powder to dissolve.
5 milliliter of the color reagent solution was added to the glass tubes (the blank and the
sample). 2 milliliter distilled water was added to the blank and 2 milliliter of sample was
added to the sample tube. The tubes were vortexed a short period of time and after two hours
was the absorbance measured at 405 nanometer. [26]
The equation to determine the total glyoxal content after measuring the absorbance is as
follows:
(
)
Equation 1. Equation used for calculating total glyoxal.
Where,
y is the measured absorbance at 405 nm
V is the volume (ml) of distilled water added to the volumetric flask (100 ml)
F is the factor conversion from µg to g ( )
v is the volume (ml) of sample taken from the volumetric flask (2 ml)
w is the sample weight in g

13
2.2.5.2 Free glyoxal analysis
Approximately 0.20 grams of the sample were weighed in a headspace vial. 10 milliliter of
tetrahydrofuran (THF) was added to the tubes. The vial was sealed with Silicome/PTFE septa.
The vial was placed in a shaking apparatus under 240 rpm for three-four hours.
After the shaking apparatus was turned off the vials was placed in a fume cupboard for
allowing the solid to settle. About 5 milliliter was taken from the vials with a syringe and a
needle. The needle was removed and an Acrodisc Syringe Filter was placed to the syringe.
The solution was filtered into a glass tube. 0.2 milliliter of the filtrate was pipetted to a new
glass tube and was diluted with 1,8 milliliter of distilled water.
A color reagent solution was prepared with 0.2 grams of 3-methyl-2-benzothiazoline
hydrazine hydrochloride (MBTH), 40 grams of acetic acid and 10 grams of distilled water.
The solution was placed for agitation for the powder to dissolve.
5 milliliter of the color reagent solution was added to the glass tubes (the blank and the
sample). 2 milliliter distilled water was added to the blank to compensate for the 0,2 milliliter
of filtrate. The tubes were vortexed a short period of time and after two hours was the
absorbance measured at 405 nanometer. [26]
Equation 2. Equation used for calculating free glyoxal.
Where,
y is the measured absorbance at 405 nm
V is the volume (ml) of distilled water added to the volumetric flask (100 ml)
F is the factor conversion from µg to g ( )
v is the volume (ml) of sample taken from the volumetric flask (2 ml)
w is the sample weight in g
2.2.6 Moisture content
The moisture content was determined to be able to correct the mass of the samples when
calculating yield total and yield bound.
Roughly one gram of the sample was weighed in an aluminum plate and was putted in (the
machine). The moisture content was determined by the apparatus at a temperature of 105°C.
The mass was adjusted with the following equation:
( ) Equation 3. The equation used for adjusting the mass.
Where,
X is the moisture content in decimal form
Z is the moisture content of the original powder, EHEC-LW, in decimal form

14
Y is the previous weighed mass of the sample in gram

15
3. Results and discussion
In this work have two different lab-scale methods been evaluated for surface treatment of
Bermocoll using glyoxal. Parameters such as glyoxal equivalents, reaction temperature and
reaction time have been analyzed for the two methods to estimate how much glyoxal is
needed to achieve satisfactory hydration times of the products. Which reaction temperature is
sufficient for a good reaction and if the drying time has an effect on the dissolution behavior
are other questions that have been investigated. The two methods were compared with regards
to their reproducibility and usefulness for gaining fundamental understanding about the
glyoxal reaction with Bermocoll®.
It was important that the Bermocoll product that was chosen for studying the glyoxal reaction
was free of glyoxal and easy to handle in the Waring blender. The chosen product for this
work was easy to work with and one of the glyoxal free products that were available.
However, the intended Bermocoll product chosen as starting material was analyzed and
proved to have some traces of glyoxal but it was still chosen due to its easy workability. The
initial trace of glyoxal in the starting material was adjusted for when the calculations of
glyoxal yields were made.
In this section are results such as dissolution times of surface treated Bermocoll samples,
amount of glyoxal, reaction temperature, reaction time, yields of the glyoxal reaction and the
correlation between bound glyoxal and the dissolution behavior presented and discussed. The
different methods are first discussed separately and later on their differences is discussed.
3.1 Dry method
Exp No
Exp Name Run Order
Incl/Excl Temp Glyoxal eq
t1 t2 Bound glyoxal
Yield bound
1 LW140327-
1
1 Incl 40 0.1 10.5 38.9 0.034 33.651
2 LW140401-
1
4 Incl 80 0.1 12.2 45.8 0.050 49.532
3 LW140331-
1
2 Incl 40 0.5 20.3 76.6 0.202 40.354
4 LW140331-
2
3 Incl 80 0.5 24.4 87.8 0.224 44.842
5 LW140402-
1
5 Incl 60 0.3 20.3 71.8 0.187 62.302
6 LW140402-
2
6 Incl 60 0.3 24.9 71.7 0.211 70.197
7 LW140403-
4
7 Incl 60 0.3 17.4 68.8 0.156 52.045
Table 4. A summary of results for the dry method.

16
Figure 8. A summary of fit for the dry method.
In the dry method a good reproducibility was obtained for almost every analysis which can be
seen in figure 8. It is observed that there is a difference between the reproducibility of t1 and
t2 where t2:s is very close to 1.0. This means that the pure error is almost zero and that
reactions under the same conditions are the same. On the other hand show the yields a
reproducibility of 0.4 or lower which means a large pure error and poor control of the
experimental set up. This also affects the predictivity (Q2), which is how well the method can
predict new data, and validity of the reaction. t1 demonstrate a reproducibility of
approximately 0.5 and therefore comes the low predictivity value. The other analyze methods
show a reproducibility of 0.8 – 1.0 which is reflected upon their Q2 value.
As the Q2 value is a reflection on the reproducibility it is not surprising when the yields result
in a very low predictivity but also t1 shows a low Q2 which means that prediction of new data
cannot be reliable. On the other hand shows figure 8 a very high predictivity for free glyoxal,
around 0.9 and the prediction accuracy of new data is very high. Between the very high
predictivity of free glyoxal and the extremely low of the two yields are t2, total glyoxal and
bound glyoxal found in between 0.25 and 0.6 and the prediction of new data cannot be fully
trusted.
-0,2
0,0
0,2
0,4
0,6
0,8
1,0
t1 t2 free glyoxal Tot glyoxal Bound glyoxal Yield bound Yield Tot
Investigation: torrmetod full fac, temp and glyoxal eq (MLR)
Summary of Fit
N=7 Cond. no.=1,323
R2
Q2
Model Validity
Reproducibility
MODDE 9 - 2014-05-28 17:46:12 (UTC+1)

17
Glyoxal eq (%) Temperature (°C) t1 (min) t2 (min)
0.1 40 10.5 38.9
0.1 80 12.2 45.8
0.3 60 20.3 71.8
0.3 60 24.6 68.8
0.3 60 17.4 71.7
0.5 40 20.3 76.6
0.5 80 24.4 87.8 Table 5. t1 and t2 results for the different reactions of the dry method.
The results of hydration time, t1, from the seven reactions of the dry method are presented in
table 5 and the results indicate that both the reaction temperature and the glyoxal
concentration had an effect on t1. As expected the glyoxal equivalents of the reaction had a
large effect on t1, but the reaction temperature seems to have only a minor effect under these
conditions. The variation in glyoxal concentration resulted in a difference of several minutes,
almost 10 minutes between 0.1 to 0.5 equivalents and a reaction temperature of 40°C and just
over 12 minutes with 80°C, while the reaction temperature resulted in a smaller but detectable
variety. The trends for t1 is also seen from t2 values which is expected since it is a
measurement of how quickly the crosslinks are broken.
The t1and t2 resulted in a smaller change between 0.3 to 0.5 equivalents than between 0.1 and
0.3 equivalents which indicates on a non-linear development with increasing glyoxal
equivalents. This is also showed by the three reactions with 0.3 glyoxal equivalents which
almost resulted in the same t1 as the reactions with 0.5 glyoxal equivalents. However, this
could also be due to some experimental error.

18
Figure 9. Scaled and centered coefficients for t1 and t2 for the dry method.
The staples in figure 9 indicate how much the glyoxal equivalents and the temperature affect
t1 (to the left) and t2 (to the right). It’s observed that the glyoxal concentration is the only
coefficient which has a significant effect on t1 and t2. The temperature has a larger effect on
t2 but is still insignificant. Since the error bar for the temperature coefficient is very large one
cannot clearly say that it has a positive or negative effect on the t1/t2 values at this stage and
some further experiments is needed to deduce whether increased reaction temperature would
lead to increase the t1/t2 values under these conditions.
19
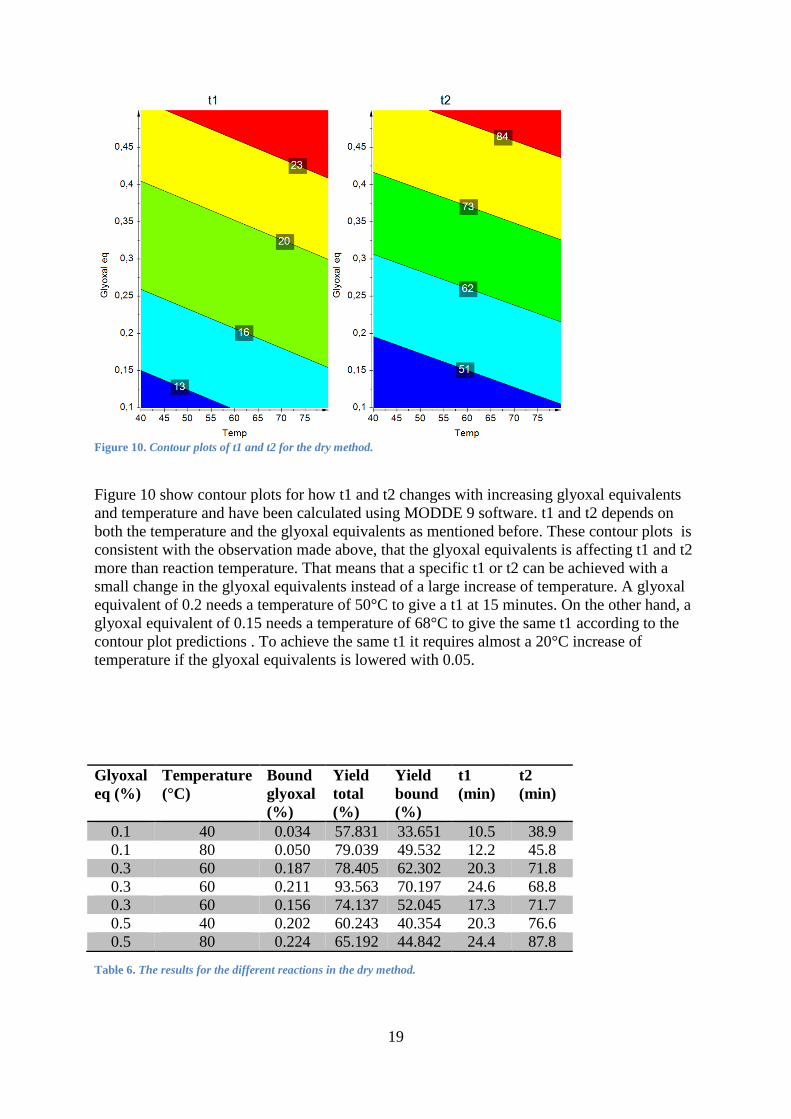
Figure 10. Contour plots of t1 and t2 for the dry method.
Figure 10 show contour plots for how t1 and t2 changes with increasing glyoxal equivalents
and temperature and have been calculated using MODDE 9 software. t1 and t2 depends on
both the temperature and the glyoxal equivalents as mentioned before. These contour plots is
consistent with the observation made above, that the glyoxal equivalents is affecting t1 and t2
more than reaction temperature. That means that a specific t1 or t2 can be achieved with a
small change in the glyoxal equivalents instead of a large increase of temperature. A glyoxal
equivalent of 0.2 needs a temperature of 50°C to give a t1 at 15 minutes. On the other hand, a
glyoxal equivalent of 0.15 needs a temperature of 68°C to give the same t1 according to the
contour plot predictions . To achieve the same t1 it requires almost a 20°C increase of
temperature if the glyoxal equivalents is lowered with 0.05.
Table 6. The results for the different reactions in the dry method.
Glyoxal
eq (%)
Temperature
(°C)
Bound
glyoxal
(%)
Yield
total
(%)
Yield
bound
(%)
t1
(min)
t2
(min)
0.1 40 0.034 57.831 33.651 10.5 38.9
0.1 80 0.050 79.039 49.532 12.2 45.8
0.3 60 0.187 78.405 62.302 20.3 71.8
0.3 60 0.211 93.563 70.197 24.6 68.8
0.3 60 0.156 74.137 52.045 17.3 71.7
0.5 40 0.202 60.243 40.354 20.3 76.6
0.5 80 0.224 65.192 44.842 24.4 87.8

20
The t1 and t2 is dependent on how much glyoxal that has bounded to the powder. Both t1 and
t2 results indicate on a prolonged t1/t2 with increasing amount of bound glyoxal. So in
general a higher t1 would correspond to a larger amount of bound glyoxal. Indeed, it is
evident from table 5 and from figure x that the amount of bound glyoxal corresponds to the
t1/t2 values .
Figure 11. Correlation between t1 values and bound glyoxal in the samples using the dry method.
Figure 12. Scaled and centered coefficients for bound glyoxal (left) and predicted contour plot of bound glyoxal versus
temperature and glyoxal equivalents.
Figure 12 shows the coefficients and the contour plots for how the bound glyoxal is affected
by the glyoxal added and the reaction temperature. Consistent with t1/t2, both these charts
0
0,05
0,1
0,15
0,2
0,25
0 5 10 15 20 25 30
Bo
un
d g
lyo
xal (
%)
t1 / min
Bound glyoxal (%)

21
show the obvious effect of the added glyoxal on bound glyoxal levels and a small effect
induced by the temperature.
Figure 13. Scaled and centered coefficients for yield bound for the dry method (left) and contour plot for yield bound for
the dry method.
To the right in Figure 13 it is shown the contour plots on how the yield of bound glyoxal is
affected by the temperature and glyoxal equivalents. These results differ from the observed
predicted contour plots of t1, t2 and bound glyoxal since both of them indicate that the yield is
almost independent of the glyoxal equivalents added in the conditions studied. However, the
Q2-value and the calculated validity of the obtained model regarding the yield is very low and
any interpretations from these predictions should be taken with great caution. If the obtained
model would exhibit more reliable data one could speculate that the temperature has a major
effect on the yield of bound glyoxal. The temperature could potentially be of importance to
achieve a good reaction between EHEC-LW and glyoxal using this dry method, but more data
points is needed in order to be able to make such a conclusion.

22
Figure 14. Sweet spot plot for the dry method. Criteria’s: t1 [min] (10-25), t2 [min] (30-60),and Yield bound [%] (50-100)
Blue indicates where two criteria’s are met, pale green indicates three criteria’s are met and bright green indicate all four
criteria’s are met.
In MODDE you can easily make a sweet spot analysis, i.e. conditions wherein certain set
criteria are met for many responses. In figure 14 the sweet spot analysis is shown wherein the
criteria for dissolution times are set according to the general requirements of paint
manufacturers, but also with a set criteria for a sufficient reaction yield (10< t1 <25 min, 30<
t2 <60 min, and yield >50%). . The sweet spot plot indicates that the optimum conditions is to
use a low glyoxal concentration combined with a medium – high temperature to achieve all
criteria’s. Hence, if considering a full scale production in industry with similar conditions as
the dry method, it may be possible to reach satisfactory dissolution performance of the
EHEC-LW using a low amount of glyoxal at an elevated, albeit modest, temperature.
3.2 Dry method – Moisture dependency
Glyoxal eq (%) Temperature t1 (min) t2 (min)
0.25 rt 20.2 70.1
0.25 rt +5 ml water 15.1 65.7
0.25 rt + 15 g water 6.4 47.7 Table 7. t1 and t2 for dry method with different amounts of water added
The results when adding water to dry Bermocoll showed in table 7 proved to have a markedly
effect on both t1 and t2. As table 7 indicates, both t1 and t2 are decreasing heavily with an
increased addition of water. These results indicate that it could be beneficial treating EHEC-
LW with glyoxal in as a dry state as possible.

23
3.3 Testing the dry method
In order to test the predictivity of the dry method, a reaction was made having conditions
outside the DoE matrix. The chosen conditions were 0.25% glyoxal equivalents and a reaction
temperature of 100°C. The model obtained from MODDE predicted a t1 of 20.1 min, a t2 of
around 70.1 min, 0.16% of bound glyoxal content, and a 60% yield bound.
Glyoxal
eq (%)
Temperature t1
(min)
t2
(min)
Bound
glyoxal
(%)
Yield
bound
(%)
0.25 100°C 20.9 60.6 0.086 57 Table 8. The result from when dry method was tested.
Table 8 shows the real results obtained at these conditions. The dry method predicted a t1 of
around 20.1 min and the test reaction gave a t1 of 20.9 min which is very close. A prediction
of 70.1 min for t2 was not achieved for the test reaction which only gave a t2 of 60.6 min.
Figure 8 indicate on higher predictivity for t2 than for t1 which is not the case for the test
reaction where t1 are closer to the predicted data than t2.
The bound glyoxal amount as well as the yield are not equally well predicted but as figure 8
reveal is the dry method weaker to predict bound glyoxal compared to the other parameters.
3.4 Acetone method
Exp Name Temp Drying
time
Glyoxal
eq (%)
t1 t2 Bound
glyoxal
Yield
bound
LW140404-
2
40 10 0,05 8,3 35 0,043 57
LW140402-
4
100 10 0,05 9,8 36,6 0,037 50
LW140404-
3
40 120 0,05 9,5 34,4 0,048 63
LW140402-
5
100 120 0,05 8,1 35,3 0,034 45
LW140407-
2
40 10 0,5 27,2 71,1 0,168 32
LW140403-
2
100 10 0,5 27,8 72,1 0,235 45
LW140407-
3
40 120 0,5 27,4 69,5 0,176 34
LW140403-
3
100 120 0,5 29,2 100,3 0,202 39
LW140407-
5
70 65 0,275 20,6 59,4 0,146 45
LW140408-
2
70 65 0,275 20,9 57,5 0,123 38
LW140408-
4
70 65 0,275 21,8 58,8 0,112 35
Table 9. A summary of result from the acetone method including their experiment name and run order.

24
Figure 15. A summary of fit for the acetone method.
In the acetone method a very high reproducibility can be seen for all responses (figure 15).
Yield bound show a lower reproducibility than the rest of the responses but is still well over
the limit for a large pure error and poor control of the experiments (0.5).
Many of these analyzes also have a high predictivity where Q2-values of t1 and bound
glyoxal is at almost 1.0. This indicates that the acetone method predicts new data very good
for t1 and bound glyoxal but also for total glyoxal, yield total and t2. Free glyoxal and yield
bound show a predictivity below 0.5 and thereby doesn’t predict new data very well. When
comparing analyzes with a reproducibility around 1.0 it is observed from figure 16 that a very
low model validity dramatically reduces Q2.
Glyoxal eq
(%)
Drying time
(min)
Temperature
(°C)
t1 t2
0.05 10 40 8.3 35.0
0.05 10 100 9.8 36.6
0.05 120 40 9.5 34.4
0.05 120 100 8.1 35.3
0.275 65 70 20.6 59.4
0.275 65 70 20.9 57.5
0.275 65 70 21.8 58.8

25
0.5 10 40 27.2 71.1
0.5 10 100 27.8 72.1
0.5 120 40 27.4 69.5
0.5 120 100 29.2 100.3
Table 10. t1 and t2 for the acetone method with varying glyoxal eq, drying time and temperature.
The t1 and t2 result from the acetone method indicate a clear trend, t1 and t2 is longer with an
increase in the glyoxal equivalents. On the other hand, with increasing glyoxal equivalents
there is a noticeable decline in the change of t1 compared to t2. When going from 0.05 to 0.5
glyoxal equivalents the t1 is roughly tripled and the t2 roughly doubled. The triplicates in the
middle show on a t1 and t2 slightly above the “middle values” which indicate the non-linear
development (Table 10 and Figure 16). Between 0.05 to 0.275 glyoxal equivalents, a change
of up to 13 minutes for t1 is shown while between 0.275 and 0.5 glyoxal equivalents only a
change of 8 minutes is shown. It will be a point where increasing the glyoxal equivalents will
not give a change in t1 or t2.
Figure 16. t1 and t2 values versus the added glyoxal equivalents using the acetone method.
The samples drying time had a minor effect on both t1 and t2. It was observed that the drying
time had a different effect whether it was t1 or t2. Result for t1 at 0.05 glyoxal equivalents
show that the drying time had a varying effect at different temperatures. With a longer drying
time at 40°C a longer t1 was observed whereas at 100°C a shorter t1 was observed with
longer heating. In contrast, t2 showed to be shorter with increased drying time, independently
of the temperature, with one exception at 0.5 glyoxal equivalents, 120 minutes drying time
and 100°C which gave a very high t2.
Both t1 and t2 was, in general, lengthened by increased temperature. At low concentrations a
variation of temperature dependence was observed for t1, where it was both longer and
shorter with an increase in temperature.
0
20
40
60
80
100
120
0 0,2 0,4 0,6
t1 /
t2
(m
in)
Glyoxal eq (%)
t1
t2
26
The conclusion is that the glyoxal equivalents primarily controls which t1 and t2 values that
are obtained. Both temperature and drying time have a small effect and can be adjusted for a
perfected t1 and t2 value.
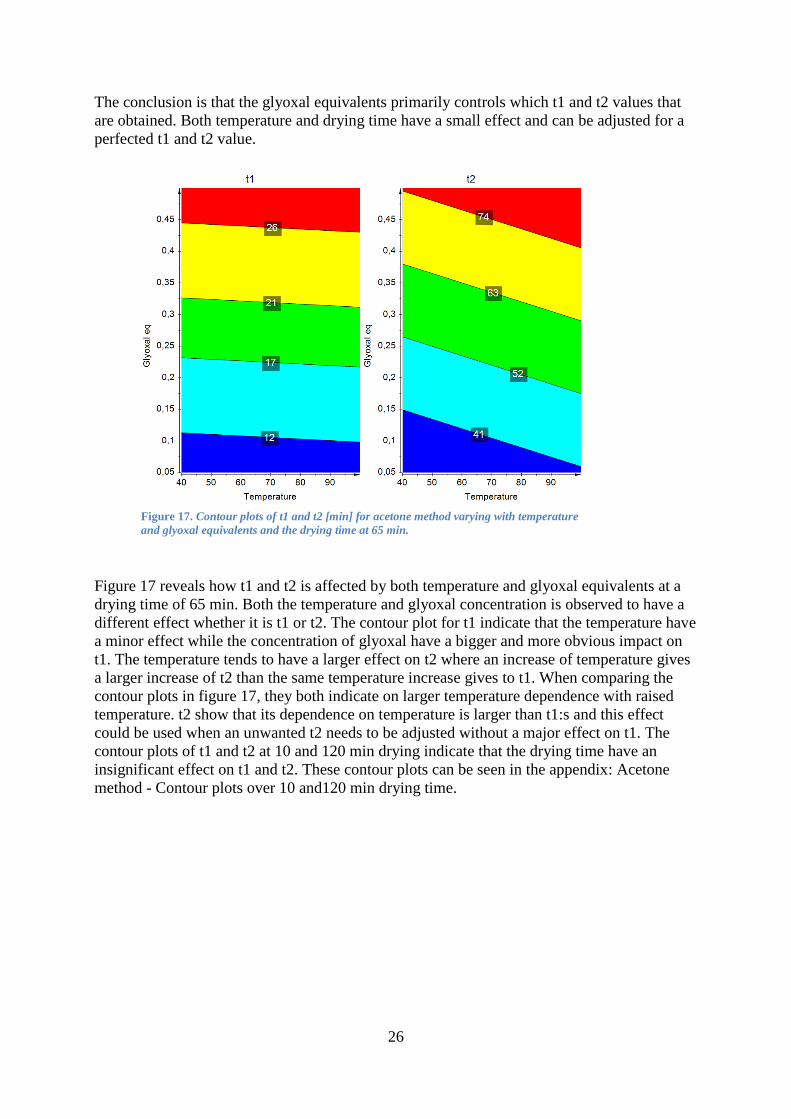
Figure 17 reveals how t1 and t2 is affected by both temperature and glyoxal equivalents at a
drying time of 65 min. Both the temperature and glyoxal concentration is observed to have a
different effect whether it is t1 or t2. The contour plot for t1 indicate that the temperature have
a minor effect while the concentration of glyoxal have a bigger and more obvious impact on
t1. The temperature tends to have a larger effect on t2 where an increase of temperature gives
a larger increase of t2 than the same temperature increase gives to t1. When comparing the
contour plots in figure 17, they both indicate on larger temperature dependence with raised
temperature. t2 show that its dependence on temperature is larger than t1:s and this effect
could be used when an unwanted t2 needs to be adjusted without a major effect on t1. The
contour plots of t1 and t2 at 10 and 120 min drying indicate that the drying time have an
insignificant effect on t1 and t2. These contour plots can be seen in the appendix: Acetone
method - Contour plots over 10 and120 min drying time.
Figure 17. Contour plots of t1 and t2 [min] for acetone method varying with temperature
and glyoxal equivalents and the drying time at 65 min.
27
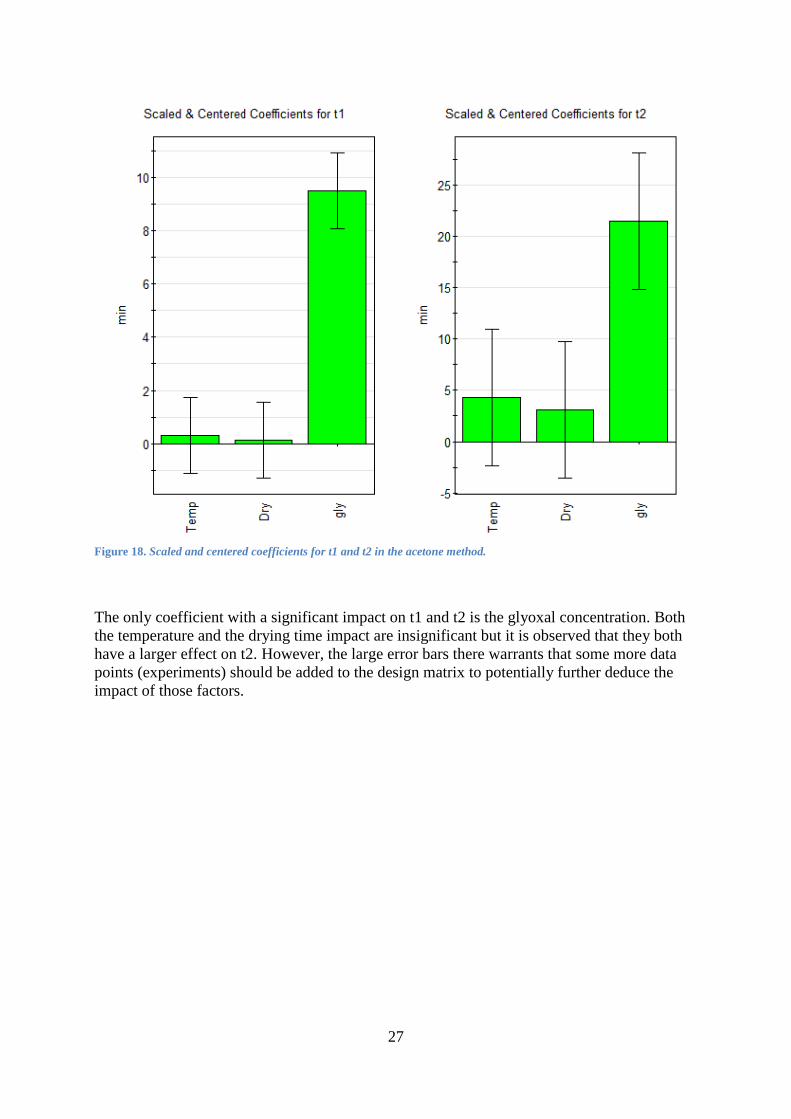
Figure 18. Scaled and centered coefficients for t1 and t2 in the acetone method.
The only coefficient with a significant impact on t1 and t2 is the glyoxal concentration. Both
the temperature and the drying time impact are insignificant but it is observed that they both
have a larger effect on t2. However, the large error bars there warrants that some more data
points (experiments) should be added to the design matrix to potentially further deduce the
impact of those factors.

28
Glyoxal
eq (%)
Drying
time
(min)
Temperature
(°C)
t1 t2 Bound
glyoxal
(%)
Yield
bound
(%)
0.05 10 40 8.3 35.0 0,043 57
0.05 10 100 9.8 36.6 0,037 50
0.05 120 40 9.5 34.4 0,048 63
0.05 120 100 8.1 35.3 0,034 45
0.275 65 70 20.6 59.4 0,146 45
0.275 65 70 20.9 57.5 0,123 38
0.275 65 70 21.8 58.8 0,112 35
0.5 10 40 27.2 71.1 0,168 32
0.5 10 100 27.8 72.1 0,235 45
0.5 120 40 27.4 69.5 0,176 34
0.5 120 100 29.2 100.3 0,202 39
Table 11. All result for the different reactions of the acetone method.
The free amount of glyoxal is indicated to increase with higher glyoxal equivalents (data not
shown). There is also a trend amongst the results that the temperature has a very clear and
significant impact on the amount of free glyoxal, where a higher temperature results in a
decreased amount of free glyoxal. This trend is also observed among the total glyoxal halt and
is probably a sign of more evaporation at higher temperature. It is also observed that the
drying time has a different big effect whether it is high or low temperature. At low
temperature the drying time have a minor effect on the total and free amounts of glyoxal
where high temperature on the other hand has a big effect (data not shown).
Table 11 shows that added glyoxal, temperature and drying time have different impact on the
bound glyoxal levels. The most obvious trend among the bound glyoxal is its dependence on
glyoxal concentration. At low glyoxal concentration (0.05) the bound glyoxal is decreasing
with higher temperature, while at higher concentration (0.5) the bound glyoxal tends to
increase with higher temperature. The amount of bound glyoxal is increased with increasing
drying time when the reaction occurs at low concentration of glyoxal and low temperature
(0.05%, 40°C), while at low concentration and high temperature (0.05%, 100°C) it is
decreasing. At high concentration this effect seems to be the opposite, where it’s observed
that the amount of bound glyoxal increases when the temperature rises and at low temperature
it is increasing with extended drying time. At high temperature on the other hand the bound
glyoxal is decreased with a longer drying time.
Yield bound represent how much of the added glyoxal that has bound with Bermocoll. Thus
are yield bound results giving the same trends as bound glyoxal.

29
Figure 19. Contour plot for bound glyoxal at 65 min drying time.
The contour plot for bound glyoxal (figure 19) indicates that the temperature dependence is
altered after reaching a certain concentration of glyoxal where it changes from having a linear
decreasing effect to a more non-linear increasing effect. When comparing the contour plot of
bound glyoxal at 65 min drying time with the contour plots at 10 and 120 min drying (found
in the appendix: Acetone method – Contour plots over 10 and 120 min drying time) it is
observed that at low drying time (10 min) and a low concentration of glyoxal the amount of
bound glyoxal is increasing with raised temperature and at high drying time (120 min) and
low glyoxal concentration the amount of bound glyoxal is decreased with higher temperature.
It is also noticed that at low temperature it is more effective with longer drying time to get
much bounded glyoxal, where on the other hand, a shorter drying time is more effective when
having high temperature.

30
Figure 20. Scaled and centered coefficients for total (left), free (middle) and bound glyoxal (right).
Not surprisingly is the amount of total, free and bound glyoxal significantly dependent on the
glyoxal concentration (Figure 20). For total and free amount of glyoxal have both temperature
and drying time a negative effect while for bound glyoxal only drying time have a negative
effect. The interaction between temperature and drying time has a negative effect on the
amount of free glyoxal. For bound glyoxal it is observed that the interaction between
temperature and glyoxal equivalents has a positively significant effect. These interactions
have previously been ablated because they had a miniscule impact.

31
Figure 21. Contour plots for yield bound and yield total at 65 min drying time.
For yield bound (figure 21) a very irregular contour plot was observed, in general was
increased temperature decreasing the amount of bound glyoxal. At 0.3 glyoxal equivalents on
the other hand, it shows that a temperature has a minor effect on the amount of yield bound. It
also indicates that at this point it gives a yield bound between 40-45% independently of the
reaction temperature. This tendency to have a certain glyoxal concentration where the yield
bound is independently on the temperature was also seen in the contour plots at 10 and 120
min where for 10 min that certain point was 0.23 glyoxal equivalents which gave a yield of
45%. At 120 min were that point at 0.4 glyoxal equivalents and resulted in a yield of
approximately 38%. The glyoxal concentration has a big negative effect on the yield bound
hence it is dramatically lowered at increasing concentrations. Above this point were an
increase of temperature resulting in a higher yield bound and below was it resulting in a
lowered yield bound.
The contour plot of yield total in figure 21 demonstrates a much more regular effect for both
glyoxal equivalents and temperature. Same as for yield bound, increasing temperature gives a
lower yield total independently of the glyoxal concentration but an increase in concentration
also result in a lowered yield total. The contour plot for yield total at 10 min showed a similar
point as was found in yield bound and was at just over 0.3 glyoxal equivalents. At 65 min
there were no point indicating this behavior but it denote that a point is coming at higher
glyoxal equivalents. On the other hand, at 120 min there were no signs that could be
interpreted in such a way that the point was coming at higher glyoxal equivalents.
For both yield bound and yield total the optimum conditions are at low temperature and low
glyoxal concentration. The contour plots at 10 and 120 min are also indicating the best
conditions at low temperature and concentration.

32
Figure 22. Scaled and centered coefficients for yield bound and yield total in the acetone method.
For both yields have all three coefficients and the interaction between temperature and drying
time a negative effect while the interaction between temperature and glyoxal equivalents has a
positively significant effect. For yield bound have glyoxal concentration the only significant
effect that is negative. On the other hand have all coefficients and interactions a significant
effect for yield total whether it is a negative or positive effect.

33
Figure 23. Sweet spot plot for the acetone method at 65 min drying time. Criteria’s: t1 [min] (10-25), t2 [min] (30-60) and
Yield bound [%] (50-100). Blue indicates where two criteria’s are met, pale green indicates three criteria’s are met and
bright green indicate all four criteria’s are met.
For the acetone method has the same criteria’s been selected as in the dry method sweet spot
(figure 14) to be able to compare the different sweet spot plots. The sweet spot plot for the
acetone method indicates that low glyoxal concentration and low temperature are the
optimum conditions for reaching these criteria’s. Sweet spot plots at 10 and 120 min drying
indicate both on the same optimum conditions meaning that drying time has a minor effect on
the resulting t1, t2 and yield bound.
3.5 Testing the acetone method
The acetone method was also tested to see how well it predicts. The chosen temperature and
glyoxal equivalents were 120°C and 0.65% and drying time of both 10 and 120 min. This
point was outside the model since the temperature interval for the acetone method was
between 40-100°C and the glyoxal concentration interval between 0.05-0.5 %. The model
obtained from MODDE predicted a t1 of 35.3 min, a t2 of 97 min, 0.30% bound glyoxal
content and a 44% yield bound for the reaction at 10 min drying time. For the reaction at 120
min drying time the model predicted a t1 of 36 min, a t2 of 103 min, 0.30% bound glyoxal
content and a 44% yield bound.

34
Glyoxal
eq (%)
Temperature
(°C)
Drying
time (min)
t1 t2 Bound
glyoxal
(%)
Yield
bound
(%)
0.65 120 10 35.4 95 0.307 45
0.65 120 120 13.9 67 0.062 9 Table 12. The results from when the acetone method was tested.
The real results are shown in table 12 where the reaction at 10 min drying time has a very
good predictivity on all the parameters. On the other hand, the reaction at 120 min drying time
shows an extremely poor predictivity. This poor predictivity is probably due to evaporation.
Considering the high temperature under that long period of time it is most likely that almost
all glyoxal have been evaporated and thereby causes the poor predictivity. This reaction gives
information about where evaporation disturbs the models’ predictivity.
3.6 Dry method vs. acetone method
When comparing both methods it is noticed that t1 for the dry method have larger temperature
dependence while for t2 it is more equal. In both methods have the glyoxal concentration a
significant effect, which is of course obvious on t1 and t2 while the temperature has an
insignificant effect. Nevertheless is a longer t1 and t2 value obtained for both methods when
either the temperature or glyoxal concentration is increased which indicates that both methods
are able to achieve the wanted dissolution time.
Increased temperature leads to an increase of all three amounts of glyoxal for the dry method
while for the acetone method it leads to increased amount of bound glyoxal and decreased
amount of total and free glyoxal which separates the two methods from each other. Have in
mind that the dry method is providing a lower amount of free glyoxal at low temperature
while the acetone method requires more heating to achieve the same low halt of free glyoxal
(data not shown). In the acetone method there is correlations that are significant to the amount
of free and bound glyoxal which aren’t significant to the amounts in the dry method. The
correlation between temperature and glyoxal concentration which has a significant effect on
bound glyoxal explains the non-parallel development with increased temperature seen in the
contour plot.
In good reaction conditions the added glyoxal should end up as bounded glyoxal as much as
possible, and both methods have increased amount of bound glyoxal when the temperature
and glyoxal concentration is increased. Here have the dry method an advantage, at low
glyoxal concentration the difference between the methods is minimal but with increasing
glyoxal concentrations the dry method gains more bounded glyoxal than the acetone method.
When looking at yield total and yield bound the methods differs a lot. The dry method
indicates that there are no coefficients that are significantly affecting the different yields while
the acetone method has several coefficients that are significantly affecting the yields.
However, the dry method also gives a poor Q2-value for the yield predictions. Glyoxal
concentration is affecting the yields negatively for both methods while the temperature only
has a negative effect on the acetone method. The correlation between temperature and glyoxal
concentration is the only coefficient that has a positive effect on the yields. The acetone
method significant dependence on the different correlations is resulting in a huge difference in
the two methods contour plots.

35
When comparing the two methods “summary of fit” it is very clear that the acetone method
show a higher reproducibility with only one of the responses (variables) having a value below
0.9. The dry method also shows some high peaks of reproducibility but also some really low
ones. The two methods indicate a markedly difference in reproducibility for t1, free glyoxal
and the two yields while t2, total glyoxal and bound glyoxal show a smaller difference. The
Q2 value for the two methods is also showing a favor for the acetone method which, overall,
has higher Q2 values. Thus, in further studies of the glyoxal reaction, or other cross-linking
reactions, the acetone method should give more reliable results.

36
4. Conclusions
In this work there are no results which indicate on that the temperature has a significant effect
on the glyoxal reaction with EHEC-LW in either of the two methods that was tested. That
means that the temperature is a factor that is not affecting the results very much. Both high
and low temperature could give the wanted results by just changing other factors.
In the acetone method it was shown that the drying time overall had a minor effect, with its
highest impact on the yield total. The drying time is, due to its insignificance, of no big
importance where a long drying time results pretty much in the same results as when a short
drying time is used.
The added glyoxal equivalents had a major impact on all responses analyzed with the
exception on yields in the dry method where there were no significant coefficients. This
indicates that a small change in glyoxal concentration can give a large difference in the
results. Considering the major effect of added glyoxal equivalents this is the primary factor
that should be changed to achieve a different result. The fact that added glyoxal has a large
impact on the reaction outcome is of course not very surprising, but importantly it has here
been shown that both methods give reproducible responses with regards to added glyoxal.
Furthermore, this work has helped to define the desired range of cross-linker to be used in the
two methods in order to obtain desired dissolution times.
The two methods showed a large difference in their predictivity. Both methods illustrate good
predictivity in t1, t2, free glyoxal, total glyoxal and bound glyoxal. For the different yields the
dry method provided a very poor predictivity. On the other hand the acetone method provided
a substantially higher predictivity for the yields. The dry methods predictivity were
investigated empirically by a reaction which overall resulted in the same t1, t2, free glyoxal,
total glyoxal and bound glyoxal as was predicted by the model. The reaction also illustrated
on the dry method poor ability to predict yields. The acetone method was also investigated
empirically but at conditions outside the model. These reactions further strengthened the high
predictivity of the acetone method. They also showed that the predictivity of the model can’t
be trusted above certain temperatures where too much glyoxal content had been evaporated.
To achieve the best result from a customers’ perspective the sweet spot plots is a good general
overview on the different reactions. The sweet spot plot for the acetone method indicates, as
mentioned, that the reaction is possible at low concentration of glyoxal and low temperature
to meet all set criteria. To achieve satisfactory t1 and t2 results by using the acetone method
an interval between 0.06-0.19 glyoxal eq should be used. This interval combined with a
temperature between 40-78°C will result in satisfactory t1 and t2. Have in mind that the sweet
spot plot for the acetone method illustrates a decreased glyoxal interval that could be used for
satisfactory results with increased temperature. For example, a chosen temperature of 76°C
can’t be combined with more than 0.06 glyoxal equivalents to achieve the wanted t1 and t2.
The dry method also demonstrates that the reaction is possible with low glyoxal
concentration, but this method could not meet all set criteria for the defined sweet spot at a
low temperature. To achieve satisfactory t1 and t2 results the sweet spot plot showed that a
glyoxal concentration interval of 0.1-0.25 should be used. This glyoxal concentration interval
combined with a temperature above 54°C results in satisfactory t1 and t2. Also here the sweet
spot plot for the dry method illustrates a decreased glyoxal interval at higher temperatures. It

37
can be seen that a temperature of 80°C can’t be combined with glyoxal equivalents over 0.21
to achieve the wanted results.
From the moisture dependency experiments using the dry method it is indicated that the
amount of water is reducing t1 and t2 and also how much added glyoxal end up bound to the
EHEC.
The findings that glyoxal reaction can work efficiently at low temperature using EHEC with a
low moisture content potentially allows for a lowered energy consumption in the industrial
production of Bermocoll®.
38
5. Future work
This diploma work has been comparing two different methods to analyze which of them is
best for optimal full scale settings for the reaction in terms of glyoxal equivalents, reaction
temperature and reaction time.
The starting material that was used for the two methods proved to be infected with glyoxal
which means that the material already had some free and bounded glyoxal when the reaction
started. Adjustments were made so that the yields of glyoxal corresponded to the real yields.
A control reaction with the starting material could be made to get a clearer view what happens
to the free amounts of glyoxal in the starting material when it is reacting with the added
glyoxal.
To draw more certain conclusions from the models, extra data points should be added. In the
three dimensional acetone method, data points in the middle point of the sides of the cubes
can be added to obtain what is called an optimization design that can pick up curvature and
square terms in the estimated model (polynom). Also in the two dimensional dry method, data
points in the middle of the sides of the rectangular can be added to obtain such an
optimization design.
Because of the reaction at 0.65 glyoxal equivalents, 120°C and 10 min drying time, that
illustrated the good predictivity of the acetone method, it is necessary to test the method at
conditions inside the model to further verify its predictivity.
The interesting finding that yield bound glyoxal decreases with moisture in the reacting
EHEC also needs some further experiments, data points, to strengthen these findings.
Potentially it could be advantageous to make a new DoE matrix having moisture as a factor.

39
6. Bibliography
[1] A. Carlsson, "General Introduction," in Nonionic Cellulose Ethers Interactions with
surfactans, solubility and other aspects, Lund, Lund University Sweden, 1989, p. 2.
[2] A. Carlsson, "Chemical Modification of Cellulose," in Nonionic Cellulose Ethers
Interactions with surfactans, solubility and other aspects, Lund, Lund University
Sweden, 1989, p. 5.
[3] A. Carlsson, "Applications," in Nonionic Cellulose Ethers Interactions with surfactans,
solubility and other aspects, Lund, Lund University Sweden, 1989, pp. 10-11.
[4] P. Bhargava, G. T. Carrol, T. T. Nguyen and K. A. Vaynberg, "Water soluble polymer
powder formulation having improved dispersing properties". U.S. Patent 122153, 13
September 2012.
[5] P. Bhargava and K. A. Vaynberg, "Methods for dispersing water soluble polymer
powder". U.S. Patent 0233205, 12 September 2013.
[6] M. Kjellin and I. Johansson, "Surface-Active Polymers from Cellulose," in Surfactans
from Renewable Resources, WILEY, 2010, p. 253.
[7] L. Karlson, "Hydrophobically modified polymers in aqueous solution," in
Hydrophobically Modified Polymers Rheology and Molecular Associations, Lund, Lund
University, 2002, pp. 19-20.
[8] M. Kjellin and I. Johansson, "Cellulose Ethers in Aqueous Solution," in Surfactants from
Renewable Resources, WILEY, 2010, p. 258.
[9] L. Karlson, "Populärvetenskaplig sammanfattning," in Hydrophobically Modified
Polymers Rheology and Molecular Associations, Lund, Lund University, 2002, p. 59.
[10] Z.-h. Ou, B.-g. Ma and S.-w. Jian, "Effect of non-ionic cellulose ethers on fresh cement-
based materials and its research progress," ACS abstract paper, vol. 110, pp. 96-98,
2012.
[11] H. Schlesiger, W. Dannhorn, J.-B. Pannek, V. Muller and F. Hohl, "Process of preparing
delayed-dissolution cellulose ethers". U.S. Patent 0130500, 10 July 2003.
[12] E. I. Jullander, "Preparation of aqueous solutions if Bermocoll". U.S. Patent 2 879 268,
24 Mars 1959.
[13] R. Adden, T. V. Drovetskaya och E. M. Partain, ”Glyoxal-free cellulose derivates for
personal care compositions”. U.S. Patent 058670, 17 April 2014.
[14] AkzoNobel Functional Chemicals, "Preparation of aqueous solotions of Bermocoll;
Hydration behaviour for different qualities," in Bermocoll Cellulose ethers, Handbook on
40
Bermocoll, AkzoNobel Functional Chemicals, 2010, pp. 8-9.
[15] A. Carlsson, "Nonionic Cellulose Ethers," in Nonionic Cellulose Ethers Interactions with
surfactans, solubility and other aspects, Lund, Lund University Sweden, 1989, p. 3.
[16] J. Rojas and E. Azevedo, "Functionalization and crosslinking of microcrystalline
cellulose in aqueous media: A safe and economic approach," vol. 8, no. 1, p. 28, 2011.
[17] A. Carlsson, "Chemical Modification of Cellulose," in Nonionic Cellulose Ethers
Interactions with surfactans, solubility and other aspects, Lund, Lund University
Sweden, 1989, p. 4.
[18] A. Carlsson, "Chemical Modification of Cellulose," in Nonionic Cellulose Ethers
Interactions with surfactans, solubility and other aspects, Lund, Lund University
Sweden, 1989, pp. 4-5.
[19] "Carboxymethyl cellulose produced at different mercerization conditions and
characterized by NIR FT Raman spectroscopy in combinations with multivariate
analytical methods," p. 1918.
[20] P. Arisz, F. Wilhelmus and K. M. Lusvardi, "Water-soluble, low substitution
hydroxyethylcellulose, derivates thereof, process of making, and uses thereof". U.S.
Patent 094211, 8 September 2006.
[21] AkzoNobel, "AkzoNobel Performance Additives; Fine-tuning the characteristics of
water-borne paint," 2014. [Online]. Available:
https://www.akzonobel.com/cs/market_segments/paint/index.aspx. [Accessed 16 April
2014].
[22] S. R. Bonney and H. H. Rmaile, "Process of making cold-water dispersible cellulose
ethers and uses thereof". USA Patent 0175361, 2 August 2007.
[23] E. Perplies and M. Erdler, "Method for producing temporarily cross-linked cellulose
ethers". USA Patent 0261490, 24 November 2005.
[24] J. Rojas and E. Azevedo, "Functionalization and crosslinking of microcrystalline
cellulose in aqueous media: A safe and economic approach," vol. 8, no. 1, pp. 28-29,
2011.
[25] L. Eriksson, E. Johansson, N. Kettaneh-Wold, C. Wikström and S. Wold, "Preface," in
Design of Experiments, Principles and Applications, Umeå, Umetrics, 2008, pp. 1-4.
[26] Cefic, "Method for the determination of the glyoxal content in cellulose ethers," Cefic,
Brussels.

41
Acetone method – Contour plots for 10 and 120 min drying time
Figure 24. t1 and t2 results from the acetone method at 10 min drying time.
Figure 25. t1 and t2 results from the acetone method at 120 min drying time.

42
Figure 26. Bound glyoxal for the acetone method at 10 min drying time.
Figure 27. Bound glyoxal for the acetone method at 120 min drying time.

43
Figure 28. Yield bound and yield total for the acetone methpd at 10 min drying time.
Figure 29. Yield bound and yield total for the acetone method at 120 min drying time.