surface transport panel date: 11 february 2015
TRANSCRIPT
Surface Transport Panel
Date: 11 February 2015
Item: Managing Director’s Report
This report will be considered in public
1 Summary
1.1 The purpose of this report is to update the Panel on Surface Transport’s performance for Periods 7, 8 and 9 in 2014/15 (14 September to 6 December 2014) and to provide an overview of recent major issues and developments within Surface Transport.
2 Recommendation
2.1 The Panel is asked to note the report.
3 Delivery
Buses
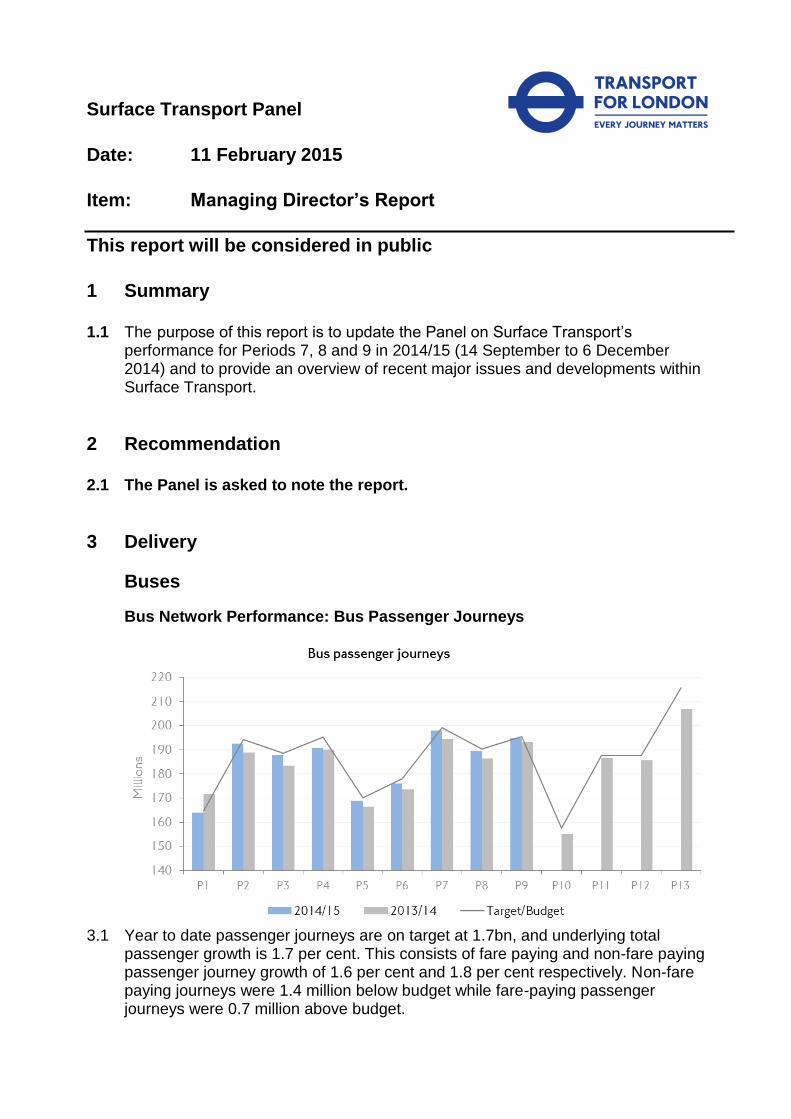
Bus Network Performance: Bus Passenger Journeys
3.1 Year to date passenger journeys are on target at 1.7bn, and underlying total passenger growth is 1.7 per cent. This consists of fare paying and non-fare paying passenger journey growth of 1.6 per cent and 1.8 per cent respectively. Non-fare paying journeys were 1.4 million below budget while fare-paying passenger journeys were 0.7 million above budget.
3.2 The non-fare paying passenger journey reductions are mostly due to the 11-15 year old and 16+ passenger journeys. The Greater London Bus Passenger Survey (GLBPS) has found that our previous information on non-validation was not realistic. This has left an artificially high target that has not been met.
3.3 In Periods 7, 8 and 9 (2014/15) bus passenger journeys were higher than the
same Periods in 2013/14.
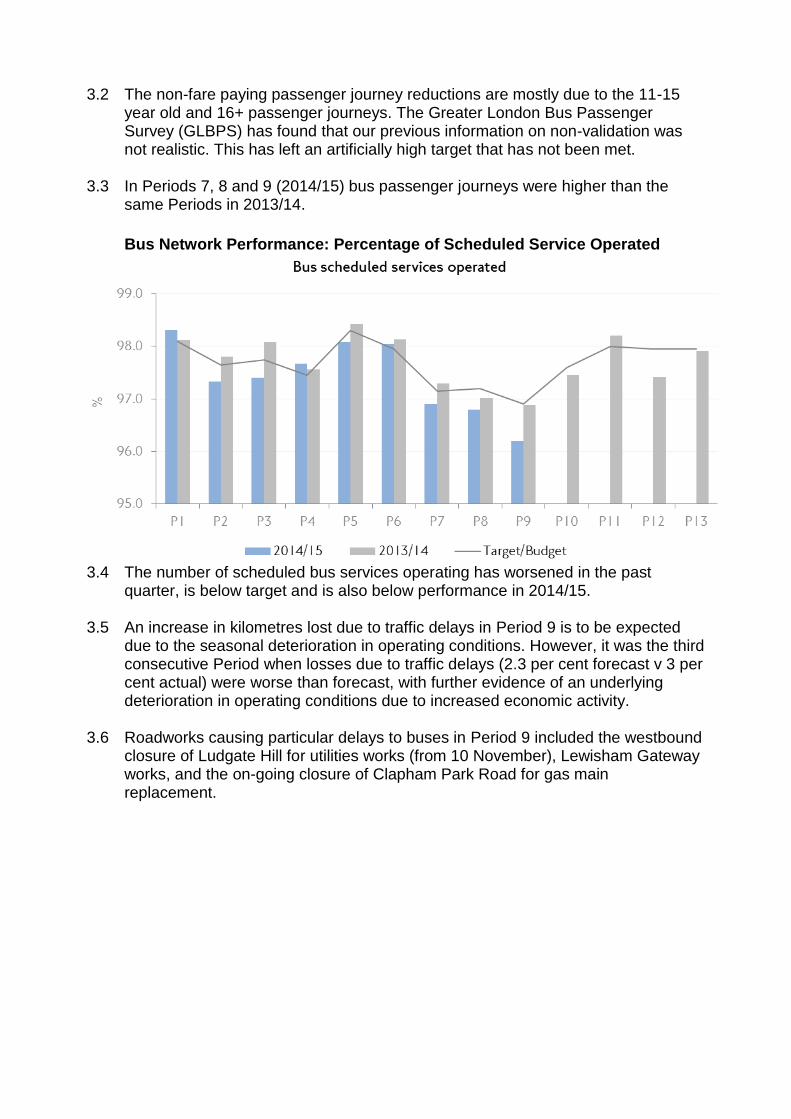
Bus Network Performance: Percentage of Scheduled Service Operated
3.4 The number of scheduled bus services operating has worsened in the past
quarter, is below target and is also below performance in 2014/15.
3.5 An increase in kilometres lost due to traffic delays in Period 9 is to be expected due to the seasonal deterioration in operating conditions. However, it was the third consecutive Period when losses due to traffic delays (2.3 per cent forecast v 3 per cent actual) were worse than forecast, with further evidence of an underlying deterioration in operating conditions due to increased economic activity.
3.6 Roadworks causing particular delays to buses in Period 9 included the westbound
closure of Ludgate Hill for utilities works (from 10 November), Lewisham Gateway works, and the on-going closure of Clapham Park Road for gas main replacement.

3.7 Bus excess wait time in Quarter 3 overall was worse than target and a year ago.
The normal deterioration in operating conditions at this time of year was greater than anticipated, due to increased economic activity, road works and town centre improvements. The ‘best ever’ reliability score, of one minute, was maintained over four consecutive years by the use of enhanced service control facilities used by bus operators. In the Quarter the use of such facilities has not fully mitigated the increase in congestion as a result of population growth and construction of major highway and urban improvement schemes. A series of resource enhancements and route changes to further assist is now underway.
3.8 In Period 9 bus excess wait time was 1.44 minutes compared to a target of 1.35
minutes. The forecast for 2014/15 now assumes excess wait time will be 1.1 minutes, as reliability on London’s roads continues to suffer from the impact of renewed economic growth, and the resulting increase in flows on the network.

Managing London’s Bus Network
New Routemasters, new routes
3.9 Bus routes 55, N55 and 15 are the most recent routes in London to be entirely served by New Routemaster buses.
3.10 Route 55, which runs between Oxford Circus and Leyton, and route N55, which runs from Oxford Circus but continues from Leyton to Woodford Wells, were converted in January 2015. Route 15, which runs from Trafalgar Square to Blackwall DLR, began its conversion at the beginning of this month and will be complete by the end of February 2015.
3.11 During peak hours, the 27,000 people who travel on the route 55 every week day will be served by 34 of the New Routemaster buses. Route 15 will be served by a further 22 of the buses, carrying the 14,500 people who travel on the route each week day.
Additional New Routemasters Purchased
3.12 TfL is purchasing an additional 200 New Routemaster buses from Wrightbus at £349,500 per unit – a saving of £5,000 per bus on the current price. The buses will have the new ultra-low emission Euro VI engine, meeting the requirements of TfL’s Ultra Low Emission Zone proposals. The 200 new buses will bring the number of New Routemasters up to a total of 808, almost 10 per cent of the entire TfL bus fleet. Delivery is expected in April 2016.
Hybrid Buses Programme
3.13 The proportion of the bus fleet served by low-carbon emission and quieter diesel-electric buses is now at 11.5 per cent. There are currently just over 1,000 hybrids

in the fleet and TfL forecasts this number growing to 1,250 by spring 2015 and making up around 20 per cent by 2016 when 1,700 hybrids (including a revised target for 800 New Routemasters) will have been introduced. Switching over to this cleaner technology has been supported by external funding from the Department for Transport. In addition, the bus fleet now has more than 300 of the latest ultra-low emission Euro VI engine vehicles, many of which are hybrids.
Technology Demonstration Projects
3.14 The number of all-electric single-deck buses in the fleet now stands at eight following the roll out of two Optare MetroCity vehicles to route 312 between South Croydon and Norwood Junction on 10 December. TfL is currently evaluating route tender bids for the 312 which includes a potential full conversion option and is studying proposals to widen network roll out to a third supplier. On top of the latest two all-electric vehicles in the fleet, four MetroCity buses operate on route H98 and two BYD vehicles on routes 507 and 521. All vehicles are being assessed for operational performance and their potential for contributing to wider emissions reduction.
3.15 TfL will also demonstrate rapid inductive-charging and range-extended diesel-electric hybrid buses in east London from 2015. The Alexander Dennis E400 buses will operate on route 69 between Canning Town and Walthamstow bus stations and part of the assessment will look at their ability to operate in all-electric mode for a significant period of passenger service.
3.16 The capital and maintenance costs of the project called ZeEUS (Zero Emission Urban-Bus System) are part funded by the European Commission. TfL continues to demonstrate medium-term options for zero-emission vehicles including eight hydrogen fuel-cell buses on Route RV1 between Covent Garden and Tower Hill.
Europe’s Greenest Bus Fleet 3.17 A further 800 buses are to be fitted with selective catalytic reduction (SCR)
equipment to bring the planned total upgrade of Euro III generation buses to 1,800 by the end of 2015. TfL has already fitted 1,019 to date, including those funded by the Olympic Delivery Authority and is starting the next phase of the programme. This will leave the number of unmodified Euro III buses in the fleet at around 1,000 by March 2015 as part of plans to reduce this to zero by the end of 2015. The SCR kit developed for London cuts individual vehicle exhaust NOx by up to 88 per cent. Remaining un-retrofitted Euro III buses in the fleet will be replaced with the new ultra-low emission buses fitted with the Euro VI engine or better which will cut individual vehicle exhaust NOx by up to 95 per cent compared to a standard Euro III vehicle. The two measures will deliver a 20 per cent cut (equivalent to 1,000 tonnes) of NOx a year from the bus fleet by 2015 compared to 2012 levels.
Year of the Bus Update Final Display for Year of the Bus Sculptures
3.18 Members of the public were invited to view all 60 Year of the Bus sculptures at a free family fun weekend (24 and 25 January) at Queen Elizabeth Olympic Park, before being auctioned for charity. The event was one of TfL’s final celebrations to

mark the 2014 Year of the Bus, in partnership with London Transport Museum and the capital’s bus operators, and was funded entirely by sponsorship.
3.19 Painted and adorned by well-known and aspiring artists, the sculptures captured the imagination of Londoners and visitors to the city from October 2014 to January 2015, and prior to their arrival at the Olympic Park were on display on four walking trails across the Capital. Capital’s Bus Network Inspires Poetic Response
3.20 On 15 January, Art on the Underground - TfL’s acclaimed public arts programme - unveiled 100, a new artwork consisting of one hundred one-line poems inspired by the capital’s bus network.
3.21 Two London-based artists, Jay Bernard and Yemisi Blake, were commissioned by Art on the Underground to create visual artworks based on people’s experiences of travelling by bus. The resulting artworks are on display at Walthamstow, Greenwich and Kingston (Cromwell Road) bus stations and will remain in place until spring 2015.
4 River London River Services Scheduled Services Operated
4.1 The number of passengers carried on London River Services (LRS) (including the
Woolwich Ferry) was higher in Quarter 3 than the same Period last year. Passenger numbers were also above target in Periods 7 and 8, but below target in Period 9.
4.2 Performance on services (excluding the Woolwich Ferry) remained good in Period 9, with unseasonably good weather and a post-summer boost in TfL Marketing

river promotional activity contributory factors to a total of 506,000 passenger journeys in the Period.
4.3 Demand at Tower Pier was unprecedented for the time of year in Period 8, as
visitors flocked to the area to visit the 'Blood Swept Land and Seas of Red' commemorative poppy installation in the moat of the Tower of London.
4.4 However, Woolwich Ferry passenger journeys fell by 24 per cent year on year in Period 9 due to the increase in vessel dwell times while the linkspan refurbishment works were carried out.
4.5 LRS scheduled services operated were above target throughout Quarter 3. For the year to date they are running at 99.5 per cent, one per cent above the target of 98.5 per cent .
5 Taxi and Private Hire
Taxi and Private Hire Operational Update
5.1 The total number of licensees at the end of Period 9 (2014/15), compared with Period 7 was:
License Type Taxi P7
2014/15
Taxi P9
2014/15
Private Hire P7
2014/15
Private Hire P9
2014/15
Drivers 25,512 25,428 71,837 74,222
Vehicles 22,606 22,666 56,764 59,018

European Court of Justice Judgement on Bus Lane Policy 5.2 TfL welcomed the judgment from the European Court of Justice (ECJ) on the case
brought by Eventech, a subsidiary of Addison Lee, that challenged TfL’s policy of allowing taxis, but not private hire vehicles, to use bus lanes in the Capital. The ECJ noted that TfL’s policy does not appear to the ECJ to involve state aid nor confer, through State resources, a selective economic advantage. It is now for the Court of Appeal to decide, taking into account this judgment.
5.3 In its judgment, the ECJ recognised that taxis are distinct from minicabs, noting the former’s “legal status are in a factual and legal situation which is distinct from that of minicabs, and consequently those two categories of vehicles are not comparable”. The ECJ noted that drivers of taxis are subject to strict standards in relation to their vehicles, their fares and their knowledge of London, whereas those standards do not apply to minicabs.
5.4 The ECJ went on to recognise that only taxis can ply for hire, they are subject to
the rule of ‘compellability’, they must be recognisable and capable of conveying persons in wheelchairs, and their drivers must set the fares for their services by means of a taxi meter and have a particularly thorough knowledge of London. They concluded that, in that context, the bus lane policy does not confer a selective economic advantage on taxis.
Zero Emission Taxi Trials
5.5 TfL has licensed four Metrocab taxis as part of a three month trial to test the zero emissions capable technology. The taxis are being inspected every fortnight.
6 Victoria Coach Station
Operational Update 6.1 Victoria Coach Station departures recorded in Period 9 were 17,044, slightly down
from Period 7, which was 17,306. Overall Coach Departure numbers in comparison to 2013/14 for Quarter 3 were also down, due to a number of factors but especially due to the loss of one Oxford Express high frequency service; however other operators’ services are providing sustained departure numbers. Overall income target is being maintained due to additional peak time departure slots, additional flexible slot allocation and extra Coach Parking activity from all coach operators.
6.2 Overall, the coach station continues to work with all commercial partners to further explore opportunities for innovative network developments and confirmed permanent timetabled departures. Megabus has continued to have a sustained increase in its departures from the station, particularly on their mainland Europe operations, which has increased by 30 per cent on previous years.

7 Dial-a-Ride
Operational update
7.1 In Period 9 Dial-a-Ride scheduled 123,940 of the 137,520 trip requests made, which at 90.1 per cent was 0.1 per cent above target. The Period continued the increase in seasonal peak activity for Dial-a-Ride, with requests around 4,000 per Period higher than in the early part of the year. Scheduled trip requests were on target in Period 8, after a below target performance in Period 7 of 88.2 per cent, which was affected by vacancies in some key front line roles during that time.
8 Cycling
Cycle Journeys
8.1 More than 580,000 cycle journeys are made every day in London, and cycling in London has more than doubled in the last decade. Cycling levels on London’s main roads in Quarter 3 of 2014/15 were 10 per cent higher than in the same quarter last year. This is the highest level of cycling seen in Quarter 3 since 2000 and just over eight per cent above target. This is now the fifth consecutive quarter we have seen the highest cycling levels recorded on the TLRN.
8.2 With the future growth of cycling expected to take place not only on the TLRN, but on all the capital’s roads, TfL has developed a new methodology for recording cycling journeys that currently runs in parallel with the existing TLRN cycling index. Monitoring using this metric covers the central London congestion zone and shows that a daily average of 526,829 kilometres, or about 172,000 journeys, were cycled during calendar Quarter 3 of 2014, which is 31 per cent higher than during the first calendar quarter of 2014, partly reflecting seasonal trends in cycling.

Cycle Superhighways 8.3 Cycle Superhighways was presented to the TfL Board on 4 February 2014, asking
for project authority of £161.7m within our Business Plan to undertake construction for a number of new and upgraded Cycle Superhighways which include:
a) CS route 1 (Tottenham to City); b) CS route 2 upgrade (Bow to Aldgate); c) CS routes 3, 7 and 8 upgrades; d) CS5 inner (Oval to Pimlico); e) CS East-West (Westbourne Terrace to Tower Hill); and f) CS North-South (Elephant and Castle to Kings Cross).
8.4 The consultation report for Barclays Cycle Superhighway 2, which proposes full
and semi segregation installed along the whole route between Whitechapel High Street and Bow, has been published. The proposals include the installation of eleven pioneering cycle-priority junctions, at locations such as Aldgate East, Mile End and Whitechapel, and the introduction of bus stop bypasses, which would direct cyclists behind bus stops.
8.5 More than 90 per cent of people who responded to the consultation supported the plans for the full and semi-segregated cycle track, and earlier research found that 89 per cent of cyclists and 70 per cent of bus passengers and pedestrians support bus bypasses. Some changes have been made to the scheme as a result of the consultation, to help address local concerns regarding access to Whitechapel market and the loading bays outside Whitechapel Gallery. Subject to the approval of the TfL Board, construction will begin shortly.
Quietways
8.6 On 11 December 2014, TfL presented the Quietways Signing Guidance, which will ensure the consistent implementation of signage and road markings on all Quietways routes, to London Council’s Transport Environment Committee. Further stakeholder engagement was undertaken in early January 2015 to agree updates to the draft document. Subsequently, a working draft of the Quietways Signing Guidance was issued to delivery partners and is now being implemented on the first two pilot Quietways routes.
8.7 Monitoring of wayfinding signage will take place this summer and any
amendments will be incorporated into a final version of the Quietways Signing Guidance.
New Cycle Hire Tariff
8.8 The new tariff structure was introduced on 2 January 2015. The change, which is in response to customer feedback, simplifies the extra ride charges, setting the cost at a flat £2 each half hour, rather than the current steeply rising costs. The first half hour of each journey remains free. The confusing late return charge, which has led to many complaints among customers and stakeholders, has been removed. The £300 non-return charge remains, and TfL is now able to charge anything up to that amount if a bike is returned after more than 24 hours.

Cycle Hire ‘Pop-up Dock’ 8.9 The Pop-up dock was available at the Winterville Christmas event at Victoria
Park, and proved so popular that although it was only due to be used at the weekend it was left in place throughout the remainder of the event.
Cycle Training
8.10 New and experienced cyclists were urged to start the New Year by taking up TfL supported cycle training through their local borough councils. The training, which is available from most London boroughs for free or a small fee, provides advice and safety tips to cyclists of all ages and abilities. All cycle trainers are accredited through Bikeability - the 'cycling proficiency for the 21st century' - and the training is designed to give people the skills and confidence to ride their bikes on London’s roads. Information on how and where to book cycle training can be found on the TfL website at www.tfl.gov.uk/cycletraining.
8.11 Of those who participated in cycle training last year, around 60 per cent were beginners but only around 20 per cent were regular cyclists, cycling multiple times a week. The aim is to increase this in 2015.
9 Walking
Winter Wanders
9.1 Londoners were urged to get on their walking shoes over the weekend of Saturday 24 and Sunday 25 January and take part in one of 40 free-guided walks exploring the magic of London in winter.
9.2 The wide range of walks on offer showcased London's ever changing landscape, taking in some of London’s famous landmarks, parks and canals as well as many hidden gems. Experienced walk guides led the way, providing fascinating facts that highlighted London’s curiosities, history and culture.
9.3 All walks started and finished within easy reach of public transport and explored
sections of the city’s seven popular Walk London Network routes; Capital Ring, Green Chain, Jubilee Greenway, Jubilee Walkway, Lea Valley, London Outer Orbital Path (LOOP) and Thames Path.
10 Safety
Crime on the Bus Network
10.1 The level of crime on the bus network is at a historic low and was 1.8 per cent lower in Quarter 3 than the same quarter last year, with 84 fewer offences. Notable reductions were seen in robbery (41.5 per cent, 179 fewer offences) and theft and handling (14.5 per cent, 356 fewer offences). These results build on the significant reductions in bus-related crime over recent years and reflect the work done by TfL. Sexual offences have seen a rise of 47.6 per cent (68 additional reported offences). Violence Against the Person (VAP) offences have also risen 27.1 per cent (333 offences) and reflects at a slightly smaller scale the 35 per cent London-wide rise seen by the MPS overall during the same time Period. The work of the Metropolitan Police Service Roads and Transport Policing Command
(RTPC) in reducing VAP is being scrutinised and supported through regular performance monitoring meetings.
New Roads and Transport Policing Command Unveiled
10.2 A new, single police command has been created to further improve the safety and security of London’s roads, bus network and other surface transport services. More than 2,300 Police and Police Community Support Officers are now working closely with TfL as part of a new Metropolitan Police Service (MPS) Roads and Transport Policing Command (RTPC), making it the largest police command in the UK.
10.3 The command was created following one of six commitments published by the Mayor and TfL to reduce the number of people killed and seriously injured on London’s roads every year. Capable of delivering hundreds of thousands more hours a year of road safety activity than before, the new part TfL funded command is more flexible, with all officers having the responsibility for reducing crime, congestion and collisions. The Command will make roads safer for cyclists and pedestrians, further improving the safety of the taxi and private hire trades and clamping down on illegal touting.
10.4 TfL figures continue to show that numbers of people killed and seriously injured are at their lowest on record, which means that London remains on track to achieve the Mayor's road safety target to reduce the number of people killed or seriously injured on London's roads by 40 per cent by 2020.
11 Freight
Over 1,000 Fixed Penalty Notices issued to unsafe / non-compliant HGVs 11.1 London’s Industrial HGV Taskforce (IHTF), funded by TfL and the DfT, issued
1,013 Fixed Penalty Notices to the drivers of unsafe or non-compliant HGVs since it began operating in October 2013
11.2 More than 4,000 vehicles have been stopped by the Task Force, with 47 taken off the road and 2,000 roadworthiness prohibitions issued. Established by the Mayor, TfL and the DfT, the IHTF has carried out over 200 roadside operations over the last 16 months, complementing the working of the newly formed RTPC. The main aim of the IHTF is to drive up industry standards and deter non-compliance by conducting targeted, intelligence led enforcement operations. Concessionaire selected for Fleet Operator Recognition Scheme
11.3 On 15 January 2015, TfL announced that AECOM had been selected as the concessionaire to take over the management and operation of the TfL-developed Fleet Operator Recognition Scheme (FORS). AECOM will operate, develop and grow FORS as the concessionaire for the next five years, with the option of a two year extension to 2022.
11.4 Under the concession AECOM will manage and develop FORS in partnership with the Chartered Institute of Logistics and Transport (CILT) and Fleet Source. TfL will retain an integral role in the scheme as the industry-led accreditation scheme becomes national. FORS’ direction will be overseen by a governance board that will include TfL and key industry representatives.

11.5 TfL launched FORS in April 2008 to improve road safety and help reduce the
wider environmental and traffic impacts of freight and fleet operations. More than 210,000 vehicles from 2,400 companies are now accredited to FORS.
12 Keeping London Moving Traffic Flows
12.1 Overall traffic flows have increased since Quarter 3 2013/14 and continue to rise,
driven by economic growth and population increases. There was a 0.1 per cent increase in the volume of traffic on London’s major roads between Quarter 3 this year and last year. As a result, London wide traffic speeds (07:00 to 19:00) decreased by 0.6 mph to 17.6 mph, with speeds falling across the quarter into Period 9. The corresponding fall in network speeds tells us that increased traffic flows as opposed to incident and event disruption are the current primary driver of network impacts on journey time reliability.

Journey Time Reliability on the TLRN in the AM Peak
12.2 Journey time reliability (JTR) is a key measure for monitoring traffic flow and is
defined as the percentage of journeys completed with an allowable excess of five minutes for a standard 30 minute journey during the AM Peak. Increasing traffic flows have continued to contribute to a decrease in TLRN journey time reliability.
12.3 JTR on the TLRN in the AM peak in all directions for Quarter 3 was 87.5 per cent, 0.1 percentage points above the target and 0.1 points lower than the same quarter last year. Within the Quarter performance was mixed; Period 7 was 0.1 points below target, Period 8 was 0.6 percentage points above target; and Period 9 was 0.1 percentage points below target. JTR in Period 7 stood at 88.6 per cent, a decrease of 0.3 percentage points from the same Period in 2013/14, whereas Period 8 stood at 87.8 per cent
Planned and Unplanned Disruption on the TLRN

12.4 Across Quarter 3 there were a number of planned and unplanned incidents that
contributed to a large number of disruption hours across Periods 7, 8 and 9. The increase in planned disruption was due to an increase in Highway Authority and Utility works. The main drivers for the 135 hours increase in unplanned serious and severe disruption include increased traffic collisions, breakdowns, hazards and traffic volumes.
12.5 Overall in Quarter 3 2014/15 there were 896 hours of serious and severe disruption resulting from unplanned and planned events spread across 399 separate incidents. This is an increase of 324 hours compared to Quarter 3 2013/14; attributable to an increase of 148 planned serious and severe disruption hours and 176 unplanned serious and severe disruption hours. This compares to 572 hours spread across 281 incidents in Quarter 3 of the previous year.
12.6 Because of the significant contribution of planned events in Quarter 3, as with
Quarter 2, it remains difficult to estimate the full year forecast for unplanned and planned events. The best forecast at the moment is that unplanned serious and severe hours will be 2,660 hours and planned serious and severe hours will be 1,000. Both of these forecasts take into account the fact that significant new construction activities are continuing to occur throughout the remainder of the year.

Road Works on the TLRN
12.7 The number of road works which started on the TLRN in Periods 7, 8 and 9 (2014/15) all fall below 2013/14 numbers, showing a reduction in expected levels in comparison with the permissible total number of road works allowed on the TLRN, which is capped at 3,250 in any one Period.
12.8 In Period 9 the total number of road works reported on the TLRN was 2,845, in Period 8 there were 2,941 and in Period 7 there were 2,690. Respectively, they were 4.5 per cent, 1.9 per cent and 5.2 per cent lower than their equivalent periods in 2013/14. The number of road works on the TLRN was 12 per cent lower than the cap in Period 9, 10 per cent lower than the cap in Period 8, and 17 per cent lower than the cap in Period 7.
13 Road Modernisation Plan
13.1 As part of the Road Modernisation Plan, TfL is investing more than £4bn to improve London’s roads, the biggest investment in a generation. The Plan is a consolidation of a number of TfL programmes and initiatives, including TfL’s responses to the Roads Task Force and the Mayor's Cycling Vision. It will deliver hundreds of projects to transform the Capital’s junctions, bridges, tunnels and pedestrian areas, supporting new jobs and homes and making London's roads (which already have 26 million journeys start on them every day) more reliable, safer and greener.
13.2 Road Modernisation Plan projects include Hammersmith Flyover, Fore Street Tunnel, Woodlands Retaining Wall, Hogarth Flyover, Malden Rushett (A243 Leatherhead Road), Highbury Corner Bridge, Chiswick Bridge, A215 Spring Lane Bridge, Cycle Superhighway East-West, Cycle Superhighway North-South, and Cycle Superhighways upgrades to routes 2, 3, 7 and 8. Hammersmith Flyover
13.3 TfL is currently working to complete the final phase of strengthening works on the Hammersmith Flyover. This is in addition to the strengthening works carried out during 2012, which repaired five of the 16 spans of the flyover. The bearings,

drainage, safety barrier, waterproofing and resurfacing will be replaced during the final phase.
13.4 Since late November 2014, TfL has been carrying out frequent full night time closures of the Hammersmith Flyover to replace the movement bearings. These bearings allow the flyover to expand in the summer and shrink in the winter by up to 180mm; replacing them is a crucial part of the work to extend the life of the flyover. Each of the fifteen piers supporting the structure require four jacking closures, to allow the existing bearings to be removed and replaced. These jacking closures will continue throughout the summer, with the overall project expected to complete by the end of the year.
13.5 Six of the 60 planned jacking closures of the flyover have now been successfully
completed, and were all carried out overnight to minimise disruption to drivers.
Major Maintenance Works to Fore Street Tunnel 13.6 TfL continued major maintenance works to the Fore Street Tunnel, which forms
part of the A406 North Circular Road and runs underneath Silver Street Station, across three weekends in January and February.
13.7 The work, which followed an initial weekend closure in November 2014, took place on 9-12 January and will also take place from 13-16 February 2015. During the weekend closures, engineers have worked 24 hours a day to install new concrete plinths. The work, which cannot be undertaken while traffic is using the tunnel due to the length of time the concrete takes to set, will help extend the tunnel’s life and improve safety, ensuring this vital part of the road network can continue serving London for years to come.
13.8 Work on the Tunnel is progressing well, with upgrades to the electrics and a new
fire main installed, as well as new waterproofing to the walls. Temporary cabling for new, energy efficient lighting and improved CCTV cameras has also been installed, allowing for the systems to be fully upgraded this year.
A3 Huguenot Bridge
13.9 Work has begun on major maintenance works to the 35 year old A3 Huguenot Bridge in Wandsworth. The bridge, which carries westbound traffic from Battersea Rise to Wandsworth High Street over the A214 Trinity Road, is being re-waterproofed and resurfaced.
13.10 As part of the scheme, overnight work to refurbish the bearings supporting the structure and to install new pigeon netting to the underside of the bridge will also be carried out from 16 February until late May 2015. Both these and the carriageway works will be carried out by the London Highway Alliance, a joint initiative between TfL and London's boroughs to deliver road maintenance and improvements across London.
Elephant and Castle Northern Roundabout
13.11 TfL’s plans for the Elephant and Castle Northern Roundabout were presented to the Finance and Policy Committee in January. Works are planned to start in April 2015.

13.12 The scheme to transform the northern roundabout is part of the overall regeneration of this area which will create 5,000 homes and 4,000 jobs, and is an enabler to the delivery of the London Underground Northern Line Ticket Hall. The junction currently acts as a major barrier to development in the area, being an unattractive and dangerous environment for people walking, cycling and using public transport, with the highest level of collisions of any junction in London.
Brent Cross Highway Works
13.13 On 22 January 2015 the Finance and Policy Committee noted the delivery approach for the £286 million Brent Cross s.278 Highways works, which will allow for additional traffic capacity at the junctions between the A5/M1/A406 and A41/A406, provide a new pedestrian and cycle “living bridge” and a bridge replacement across the A406 to increase permeability between the southern development and the new Brent Cross shopping centre. TfL will spend around £40m on the highway works, which will be recovered from the developer. The highways improvements, which will be delivered between 2016 and mid-2021, are part of the £4.5bn Brent Cross Cricklewood Regeneration Programme (which will create 7,500 homes and 27,000 jobs in the area).
13.14 The delivery approach will see the third party developer undertake the highway works on both our roads and the M1. The decision is subject to establishing strong controls for TfL, particularly in relation to the reliability of the road network. Project Authority for £4.5m (fully funded by the developer) has been granted to proceed with the concept design for the scheme.
Silvertown Tunnel
13.15 TfL’s non-statutory consultation for the Silvertown Tunnel closed on 19 December 2014, receiving over 4,300 responses. Of these, 84 per cent supported the need for the tunnel (up from 76 per cent in the last consultation) and 38 per cent supported road user charging. 12 drop-in sessions were also held in parallel with the consultation. Following receipt of licenses from the Port of London Authority and Marine Management Organisation, ground investigation using overwater boreholes and landside works have now both been successfully completed.
13.16 A full consultation report is being produced and TfL is reviewing the responses and will reflect any changes in the statutory consultation for the Development Consent Order in summer 2015. TfL is working with industry experts to develop the Design, Build, Finance and Maintain procurement process.
List of appendices to this report:
None
List of Background papers:
None
Contact Officer: Leon Daniels, Managing Director, Surface Transport Number: 020 3054 0178 Email: [email protected]