surface finish optimization of magnesium pieces obtained by dry turning based on taguchi techniques...
TRANSCRIPT
This article was downloaded by: [University of Newcastle (Australia)]On: 01 September 2014, At: 09:56Publisher: Taylor & FrancisInforma Ltd Registered in England and Wales Registered Number: 1072954 Registered office: Mortimer House,37-41 Mortimer Street, London W1T 3JH, UK
Materials and Manufacturing ProcessesPublication details, including instructions for authors and subscription information:http://www.tandfonline.com/loi/lmmp20
Surface Finish Optimization of Magnesium PiecesObtained by Dry Turning Based on Taguchi Techniquesand Statistical TestsM. Villeta a , E. M. Rubio b , J. M. Sáenz De Pipaón b & M. A. Sebastián ba Department of Statistics and Operation Research III , UCM , Madrid, Spainb Department of Manufacturing Engineering , UNED , Madrid, SpainAccepted author version posted online: 24 May 2011.Published online: 19 Oct 2011.
To cite this article: M. Villeta , E. M. Rubio , J. M. Sáenz De Pipaón & M. A. Sebastián (2011) Surface Finish Optimization ofMagnesium Pieces Obtained by Dry Turning Based on Taguchi Techniques and Statistical Tests, Materials and ManufacturingProcesses, 26:12, 1503-1510, DOI: 10.1080/10426914.2010.544822
To link to this article: http://dx.doi.org/10.1080/10426914.2010.544822
PLEASE SCROLL DOWN FOR ARTICLE
Taylor & Francis makes every effort to ensure the accuracy of all the information (the “Content”) containedin the publications on our platform. However, Taylor & Francis, our agents, and our licensors make norepresentations or warranties whatsoever as to the accuracy, completeness, or suitability for any purpose of theContent. Any opinions and views expressed in this publication are the opinions and views of the authors, andare not the views of or endorsed by Taylor & Francis. The accuracy of the Content should not be relied upon andshould be independently verified with primary sources of information. Taylor and Francis shall not be liable forany losses, actions, claims, proceedings, demands, costs, expenses, damages, and other liabilities whatsoeveror howsoever caused arising directly or indirectly in connection with, in relation to or arising out of the use ofthe Content.
This article may be used for research, teaching, and private study purposes. Any substantial or systematicreproduction, redistribution, reselling, loan, sub-licensing, systematic supply, or distribution in anyform to anyone is expressly forbidden. Terms & Conditions of access and use can be found at http://www.tandfonline.com/page/terms-and-conditions
Materials and Manufacturing Processes, 26: 1503–1510, 2011Copyright © Taylor & Francis Group, LLCISSN: 1042-6914 print/1532-2475 onlineDOI: 10.1080/10426914.2010.544822
Surface Finish Optimization of Magnesium Pieces Obtained by DryTurning Based on Taguchi Techniques and Statistical Tests
M. Villeta1, E. M. Rubio
2, J. M. Sáenz De Pipaón
2, and M. A. Sebastián
2
1Department of Statistics and Operation Research III, UCM, Madrid, Spain2Department of Manufacturing Engineering, UNED, Madrid, Spain
Magnesium is one of the lightest metallic materials and is used in industries such as aeronautics or aerospace because of its excellent weightto resistance ratio. The surface finish is a key quality characteristic in dry turning of magnesium pieces and is often affected by multiple factorswithin the machining process. Factors such as feed rate, cutting speed, tool coatings, and the interactions among these were investigated in thisexperimental study. The objectives of this work were to identify the main factors that influence the dry turning of magnesium and to select theoptimal manufacturing conditions that result in minimum surface roughness. To achieve these objectives, the “smaller-the-better” characteristicfrom the Taguchi method was applied to the average roughness Ra. Using an orthogonal experimental design approach, the signal-to-noise �S/N�
ratio was used to quantify the amount of variation present in the surface roughness. Then, graphical exploratory data analysis was conducted, andthe variability in the S/N ratio of surface roughness was modeled via analysis of variance (ANOVA) fixed-effect analysis and Snedecor’s F-tests.This statistical modeling, together with Least Significant Difference testing permitted different combinations of cutting conditions to be classifiedinto two groups: (I) optimal combinations and (II) the remaining combinations.
Keywords ANOVA; Least Significant Difference test; Magnesium; Optimization; Signal-to-noise; Snedecor’s F-test; Surface finish; Taguchitechniques; Turning.
Introduction
Magnesium is one of the lightest metallic materials, andas such, it is widely used in industries, such as aeronautics,aerospace, automotive, medicine, sports, and portabledevices, in applications where the density to resistance ratiomust be low [1–3]. Because the melting temperature ofmagnesium alloys is higher than its autoignition temperature(650�C and 430�C, respectively), chips can easily auto igniteduring machining and create critical problems. If such a fireoccurs, water should not be used to extinguish a magnesiumfire because water is decomposed by magnesium to formhydrogen gas, which is highly explosive; only dry sandor a suitable extinguisher for fires involving metals shouldbe utilized. For the same reasons, the use of water-basedcoolants can also be a risk factor. Additionally, the use oflubricants or coolants in the machining process can entailundesirable economic and environmental consequences.Therefore, machining of magnesium should be conductedunder dry conditions, not only for safety reasons, but alsobecause of economic and environmental considerations.Low variability of processes and maintenance of product
quality characteristics close to target values are universalobjectives in manufacturing [4]. In machining processes,the surface roughness of workpieces is a key qualitycharacteristic. Surface roughness is often affected bymultiple factors, such as cutting speed, feed rate, depth of
Received September 10, 2010; Accepted November 11, 2010Address correspondence to M. Villeta, Department of Statistics and
Operation Research III, UCM, Av, Puerta de Hierro s/n, Madrid E-28040,Spain; E-mail: [email protected]
cut, workpiece material, workpiece length, tool nose radius,cutter geometry, cutter runout, flank, coolant, environmentaltemperature, and rake angle. Numerous experimental studiesaimed at machining process improvement have analyzedthe effects of some of these factors on the surface finishusing various methods [5–7]. To optimize the machiningprocesses required for magnesium, it is necessary toinvestigate the influence of cutting parameters and toolcoatings [8, 9]. This optimization should result in pieceswith good dimensional precision and a high quality surfacefinish obtained at the lowest possible cost and under safeconditions for the workers and the equipment.This study investigated the influence of cutting
parameters and tool type on the quality of the surfacefinish of magnesium pieces obtained by dry turning.Experimental Taguchi methods and statistical tests wereconducted to optimize the turning process with respectto surface roughness. Taguchi techniques [10, 11], suchorthogonal arrays, signal-to-noise �S/N� ratio, and factoreffect analysis, have been widely used to optimize industrialprocesses. Certain studies have been conducted usingTaguchi parameter design for optimization of surface finishin machining operations [12–16], but those studies did nottake into account that optimal machining conditions canbe achieved by more than one combination of processparameters. As seen in the present study, the combinedapplication of Taguchi techniques with statistical tests canlead to the discovery of several optimal combinationsof machining parameters that do not have a statisticallysignificant difference from each other (instead of only one asis the usual result in experimental machining-optimizationstudies based on Taguchi parameter design). This flexibilityin the optimization results allows consideration of other
1503
Dow
nloa
ded
by [
Uni
vers
ity o
f N
ewca
stle
(A
ustr
alia
)] a
t 09:
56 0
1 Se
ptem
ber
2014
1504 M. VILLETA ET AL.
criteria when selecting parameters for dry turning ofmagnesium, including economic, environmental, and safetycriteria. This result is especially valuable in the industrialmanufacturing of magnesium material workpieces dueto their high manufacturing costs and the possibility ofautoignition.The main objectives of this study were to
identify the most important factors and interactionsthat influence the dry turning of magnesium and,subsequently, to select the optimal manufacturingconditions that produce minimum surface roughness.To achieve these objectives, the “smaller-the-better”characteristic of the Taguchi method was applied to theaverage roughness Ra. The use of the S/N ratio in analysisof variance (ANOVA) allowed the combined influence ofdeviation of the mean from the target and the variationaround the mean to be measured and controlled [11]. Forthis reason, the S/N ratio of the roughness Ra was employedfor statistical analysis in the present study instead of directuse of roughness measurements. Based on an orthogonalexperimental design, graphical exploratory data analysis ofthe S/N ratio values was first conducted to obtain a rapidview of key aspects of the distribution of factors. Then,the variability in the S/N ratio of surface roughness wasmodeled via ANOVA fixed-effect analysis and Snedecor’sF -tests to identify the most influential factors.Additionally, classification of the various combinations
of cutting parameter levels and tool coatings was obtainedas a result of this statistical modeling and application of theLeast Significant Difference (LSD) test. This classificationconsists of two groups of combinations of process parameterlevels: (I) the optimal combinations and (II) the rest of thecombinations.
Experimental procedures and S/N ratio
This experimental study focused on measurement of thesurface finish of magnesium workpieces obtained by dryturning with different types of tools and various cuttingparameter levels. The workpieces used in the experimentalturning tests were cylindrical bars with a diameter of40mm and a length of 125mm (useful length of 100mm)made from the UNS M11311 magnesium alloy, with acomposition shown in Table 1.To satisfy the study objectives, it was necessary
to establish an adequate experimental design thataccommodated a model that would explain the surfaceroughness variability of these types of pieces. Cutting speed,feed rate, and tool coating were previously considered aspotentially influential factors; therefore, they were includedin the experimental design. Moreover, because possibleinteractions were anticipated, an experimental design wasselected that allowed the effect of all possible interactionsbetween two of the three factors to be estimated inisolation from the other main effects. In industry, it is often
Table 1.—Chemical composition of experimental pieces (mass%).
Al Ca Cu Fe Mg Mn Ni Si Zn
2.5–3.5 ≤0�04 ≤0�05 ≤0�005 97 ≥0�2 ≤0�005 ≤0�1 0.6–1.4
necessary to carry out repair and maintenance operations onmagnesium alloy workpieces due to the high manufacturingcosts of such pieces. For this reason, low values of cuttingconditions are generally used, and therefore, low cuttingspeeds, feed rates, and depth of cut were also used in thepresent study. Specifically, three levels were selected forfeed rate (0.05, 0.10, 0.15mm/rev) and for cutting speed(75, 150, 225m/min). The depth of cut was kept constantat 0.25mm. These cutting conditions were been expressedin units commonly employed in manufacturing workshops.Although they are not listed in System International units(S.I.), they give a more intuitive description of the valuesused. In addition, three different types of tools with identicalgeometry and different coatings were used, one type for non-ferrous metals and two for steel; the manufacturer referencesfor the tools are HX, TP200, and TK2000, respectively. Thereason for this selection is that magnesium is normally usedas part of a hybrid material (e.g., magnesium-aluminumand magnesium-steel). The factor codes assigned and levelsselected for the experiment are shown in Table 2.The use of Taguchi designs produces robust experimental
results [10]. These designs use prior information fromthe process to improve the design efficiency. Orthogonalarrays created by Taguchi methods assist in determinationof a design that is better suited to the process understudy. These methods take into account the desiredmain effects and estimation of the interactions, with anorthogonal experimental array designated by the letterL with a subindex indicating the number of proposedtreatments. Taking into account the number of selectedfactors, the number of levels set for each factor, and theinteractions to be estimated, and with the goal of seeking themaximum information with minimum experimentation, anL27 orthogonal Taguchi design was selected for the presentstudy, which agrees with a 33 factorial design in this case[17]. Table 3 illustrates the orthogonal array of this designand the order of the randomized experiments. In general,the experimental runs of the experimental design should beconducted in randomized order to avoid the influence ofuncontrollable factors.The cylindrical magnesium bars were dry turned on an
EMCO Turn 120 CNC lathe equipped with an EMCOTronic T1 numerical control module, and a MitutoyoSurftest SJ-401 surface roughness tester was used tomeasure the roughness of each workpiece. The roughnesswas measured four times in each experimental run.The average roughness Ra was used to describe surfaceroughness, defined as the integral of the absolute value ofthe departure of the roughness profile from its mean linealong a sampling length:
Ra =1L
∫ L
0�Y �x��dx� (1)
Table 2.—Factors, codes, and levels for the experimental design.
Factor Code Level 1 Level 2 Level 3
Feed rate (mm/rev) A 0.05 0.10 0.15Cutting speed (m/min) B 75 150 225Tool coating C HX TP200 TK2000
Dow
nloa
ded
by [
Uni
vers
ity o
f N
ewca
stle
(A
ustr
alia
)] a
t 09:
56 0
1 Se
ptem
ber
2014
FINISH OPTIMIZATION OF DRY TURNED Mg PIECES 1505
Table 3.—Randomized experiment orthogonalarray L27.
Experimentalrunnumber A B C
1 2 3 12 3 1 23 3 3 14 1 1 35 3 3 26 1 2 37 1 1 18 2 3 29 1 3 310 2 3 311 2 2 112 3 2 213 2 2 314 3 3 315 3 1 116 1 3 217 3 2 118 1 2 119 2 1 220 1 3 121 2 1 322 3 2 323 3 1 324 1 2 225 2 2 226 1 1 227 2 1 1
The results of the surface roughness values measured in eachexperimental run are presented in Table 4. The repeatedexperimental measurements allowed the use of a varianceindex called the S/N . Taguchi methodology employs theS/N ratio to quantify the amount of variation present in thequality characteristic:
S/N = −10 log10�MSD�� (2)
where MSD is the mean squared deviation from thetarget value of the quality characteristic. When the qualitycharacteristic variance around the target value is smaller, theS/N value is greater. Process operations consistent with thehighest S/N always yield the optimal quality with minimumvariance [11]. Therefore, the S/N ratio was used in thestatistical analysis of this experimental study.Several applicable S/N ratios exist depending on
the particular type of characteristic involved: one for“smaller-the-better” characteristics, one for “nominal-is-the-best” characteristics, and one for “larger-the-better”characteristics. For each of these types of characteristics, ahigher S/N ratio indicates a better result. Because surfaceroughness is the quality characteristic in this study, andminimum values of surface roughness are preferred, the“smaller-the-better” model from the Taguchi method wasused:
S/N = −10 log10
(1n
n∑i=1
y2i
)� (3)
where y1� y2� � � � � yn are the average roughness valuesobserved in experimental runs, and n is the number ofrepetitions. In the present experiment, the number ofrepetitions �n� is four.
Data analysis and discussion of results
Once the experimental data collection has beenconducted, the S/N ratio values can be computed fromthe surface roughness measurements by means of Eq. (3).Table 4 presents the surface roughness values measured ineach experimental run and the calculated S/N ratio values.The statistical analysis was conducted using SAS® software[18].First, graphical exploratory data analysis of the S/N ratio
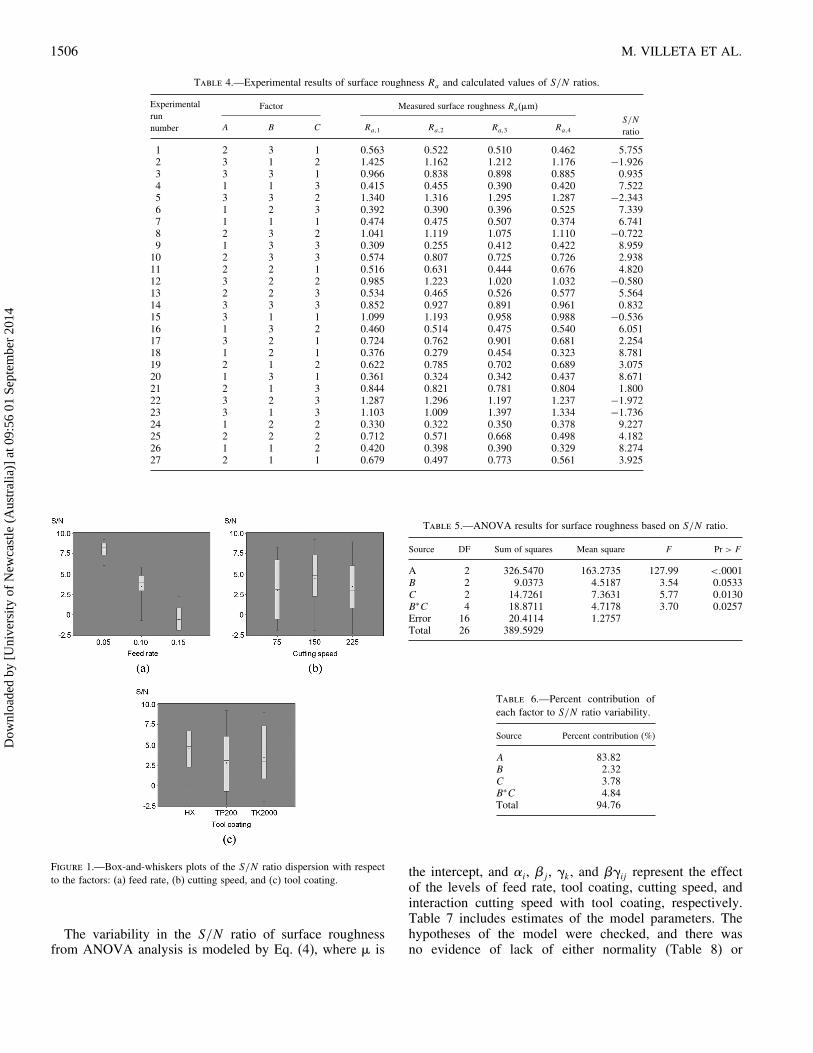
values was conducted to obtain a rapid view of key aspectsof the distribution of experimental factors. The box-and-whiskers plots in Fig. 1 illustrate the dispersion of thethree factors under study (feed rate, cutting speed, and toolcoating) considered in isolation, that is, without taking theirinteractions into account. Graph (a) of Fig. 1 clearly showsthat the feed rate is the most influential factor on the S/Nratio of the surface roughness. When the feed rate is lower,the S/N ratio is higher and thus less surface roughness withminimum variance.Next, ANOVA was applied to model the variability
in the S/N ratio of surface roughness and identify theinfluential factors. Specifically, an ANOVA fixed-effectanalysis based on the S/N data was performed by removingone factor (with a p-value greater than 0.05) each time usingSnedecor’s F as the statistical test. In this analysis, each Fvalue is obtained as the quotient of two sums of squaresdivided by its degrees of freedom (DF); the numerator isobtained from the sum of squares of the effect or interactionto be estimated, and the divisor is obtained from the sumof squares of errors. The sums of squares follow a �2
distribution assuming the residual of the model follows anormal distribution, and the quotient of two �2 distributions(considering the null hypothesis) divided by their freedomdegrees gives a Snedecor’s F. Thus, Snedecor’s F statisticaltest was the test used in the ANOVA, and the results arelisted in Table 5. The interactions A∗B and A∗C do notappear in the final ANOVA table because both interactionswere not significant. The last column of this table contains,for each factor, the probability that Snedecor’s F distributionwith degrees of freedom indicated in column DF has a valuegreater than the computed F value. If this probability isgreater than 0.05 (p-value > 0�05), it was considered inthis work that the effect corresponding to this factor is notstatistically significant. The cutting speed �B� was retainedbecause it was present in a significant interaction �B∗C�and has a p-value near the fixed value. The most influentialparameter was the feed rate �A�. This statistical result isin accordance with the graphs in Fig. 1 and with otherliterature results [9]. Tool coating �C�, the interaction ofcutting speed with tool coating �B∗C�, and cutting speed�B� also had influences, but less so. From the results of theANOVA, in Table 6 the percent contribution of each factorthat was found to statistically influence the variability inthe S/N ratio of surface roughness is shown. Indeed, nearly84% of the variability of the S/N ratio is due to the feedrate (88% of the controlled variability).
Dow
nloa
ded
by [
Uni
vers
ity o
f N
ewca
stle
(A
ustr
alia
)] a
t 09:
56 0
1 Se
ptem
ber
2014
1506 M. VILLETA ET AL.
Table 4.—Experimental results of surface roughness Ra and calculated values of S/N ratios.
Factor Measured surface roughness Ra(�m)Experimentalrunnumber A B C Ra�1 Ra�2 Ra�3 Ra�4
S/N
ratio
1 2 3 1 0.563 0.522 0.510 0.462 5�7552 3 1 2 1.425 1.162 1.212 1.176 −1�9263 3 3 1 0.966 0.838 0.898 0.885 0�9354 1 1 3 0.415 0.455 0.390 0.420 7�5225 3 3 2 1.340 1.316 1.295 1.287 −2�3436 1 2 3 0.392 0.390 0.396 0.525 7�3397 1 1 1 0.474 0.475 0.507 0.374 6�7418 2 3 2 1.041 1.119 1.075 1.110 −0�7229 1 3 3 0.309 0.255 0.412 0.422 8�95910 2 3 3 0.574 0.807 0.725 0.726 2�93811 2 2 1 0.516 0.631 0.444 0.676 4�82012 3 2 2 0.985 1.223 1.020 1.032 −0�58013 2 2 3 0.534 0.465 0.526 0.577 5�56414 3 3 3 0.852 0.927 0.891 0.961 0�83215 3 1 1 1.099 1.193 0.958 0.988 −0�53616 1 3 2 0.460 0.514 0.475 0.540 6�05117 3 2 1 0.724 0.762 0.901 0.681 2�25418 1 2 1 0.376 0.279 0.454 0.323 8�78119 2 1 2 0.622 0.785 0.702 0.689 3�07520 1 3 1 0.361 0.324 0.342 0.437 8�67121 2 1 3 0.844 0.821 0.781 0.804 1�80022 3 2 3 1.287 1.296 1.197 1.237 −1�97223 3 1 3 1.103 1.009 1.397 1.334 −1�73624 1 2 2 0.330 0.322 0.350 0.378 9�22725 2 2 2 0.712 0.571 0.668 0.498 4�18226 1 1 2 0.420 0.398 0.390 0.329 8�27427 2 1 1 0.679 0.497 0.773 0.561 3�925
Figure 1.—Box-and-whiskers plots of the S/N ratio dispersion with respectto the factors: (a) feed rate, (b) cutting speed, and (c) tool coating.
The variability in the S/N ratio of surface roughnessfrom ANOVA analysis is modeled by Eq. (4), where � is
Table 5.—ANOVA results for surface roughness based on S/N ratio.
Source DF Sum of squares Mean square F Pr > F
A 2 326�5470 163�2735 127�99 <�0001B 2 9�0373 4�5187 3�54 0�0533C 2 14�7261 7�3631 5�77 0�0130B∗C 4 18�8711 4�7178 3�70 0�0257Error 16 20�4114 1�2757Total 26 389�5929
Table 6.—Percent contribution ofeach factor to S/N ratio variability.
Source Percent contribution (%)
A 83�82B 2�32C 3�78B∗C 4�84Total 94�76
the intercept, and �i, �j , k, and �ij represent the effectof the levels of feed rate, tool coating, cutting speed, andinteraction cutting speed with tool coating, respectively.Table 7 includes estimates of the model parameters. Thehypotheses of the model were checked, and there wasno evidence of lack of either normality (Table 8) or
Dow
nloa
ded
by [
Uni
vers
ity o
f N
ewca
stle
(A
ustr
alia
)] a
t 09:
56 0
1 Se
ptem
ber
2014
FINISH OPTIMIZATION OF DRY TURNED Mg PIECES 1507
Table 7.—Estimates of the parameters in the model of Eq. (4).
Parameter Estimate Standard error t value Pr > �t�
Intercept � −3�191515943 0.72092677 −4�43 0.00040.05 �1 8�515040831 0.53243971 15.99 <0�00010.10 �2 4�045242366 0.53243971 7.60 <0�00010.15 �3 0�000000000 . . .HX �1 4�125190094 0.92221263 4.47 0.0004TK2000 �2 3�247894424 0.92221263 3.52 0.0028TP200 �3 0�000000000 . . .75 1 2�145650838 0.92221263 2.33 0.0334150 2 3�280869565 0.92221263 3.56 0.0026225 3 0�000000000 . . .75-HX ���11 −3�889517006 1.30420561 −2�98 0.008875-TK2000 ���12 −3�860221507 1.30420561 −2�96 0.009275-TP200 ���13 0�000000000 . . .150-HX ���21 −3�116488734 1.30420561 −2�39 0.0295150-TK2000 ���22 −3�880591285 1.30420561 −2�98 0.0089150-TP200 ���23 0�000000000 . . .225-HX ���31 0�000000000 . . .225-TK2000 ���32 0�000000000 . . .225-TP200 ���33 0�000000000 . . .
Table 8.—Tests for normality.
Test Statistic p-value
Shapiro–Wilk W 0.963409 Pr < W 0.4404Kolmogorov–Smirnov D 0.129109 Pr > D >0�1500Cramer–von Mises W-Sq 0.071275 Pr > W-Sq >0�2500Anderson–Darling A-Sq 0.435461 Pr > A-Sq >0�2500
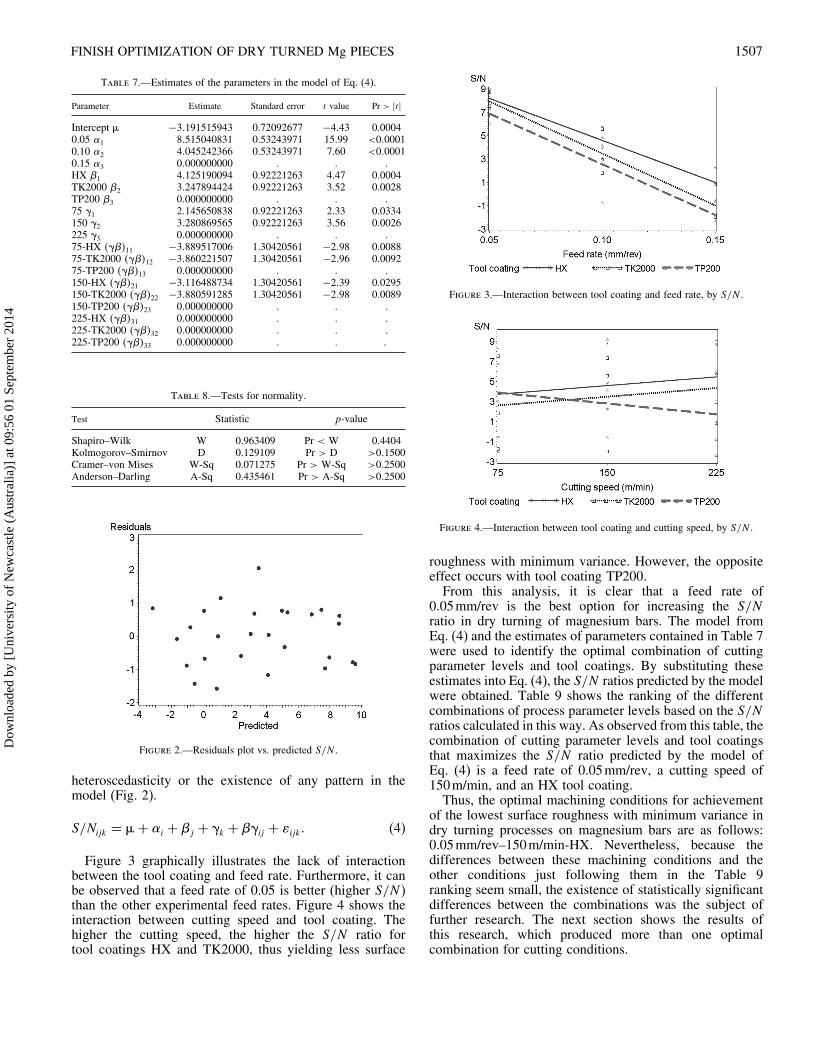
Figure 2.—Residuals plot vs. predicted S/N .
heteroscedasticity or the existence of any pattern in themodel (Fig. 2).
S/Nijk = �+ �i + �j + k + �ij + ijk� (4)
Figure 3 graphically illustrates the lack of interactionbetween the tool coating and feed rate. Furthermore, it canbe observed that a feed rate of 0.05 is better (higher S/N )than the other experimental feed rates. Figure 4 shows theinteraction between cutting speed and tool coating. Thehigher the cutting speed, the higher the S/N ratio fortool coatings HX and TK2000, thus yielding less surface
Figure 3.—Interaction between tool coating and feed rate, by S/N .
Figure 4.—Interaction between tool coating and cutting speed, by S/N .
roughness with minimum variance. However, the oppositeeffect occurs with tool coating TP200.From this analysis, it is clear that a feed rate of
0.05mm/rev is the best option for increasing the S/Nratio in dry turning of magnesium bars. The model fromEq. (4) and the estimates of parameters contained in Table 7were used to identify the optimal combination of cuttingparameter levels and tool coatings. By substituting theseestimates into Eq. (4), the S/N ratios predicted by the modelwere obtained. Table 9 shows the ranking of the differentcombinations of process parameter levels based on the S/Nratios calculated in this way. As observed from this table, thecombination of cutting parameter levels and tool coatingsthat maximizes the S/N ratio predicted by the model ofEq. (4) is a feed rate of 0.05mm/rev, a cutting speed of150m/min, and an HX tool coating.Thus, the optimal machining conditions for achievement
of the lowest surface roughness with minimum variance indry turning processes on magnesium bars are as follows:0.05mm/rev–150m/min-HX. Nevertheless, because thedifferences between these machining conditions and theother conditions just following them in the Table 9ranking seem small, the existence of statistically significantdifferences between the combinations was the subject offurther research. The next section shows the results ofthis research, which produced more than one optimalcombination for cutting conditions.
Dow
nloa
ded
by [
Uni
vers
ity o
f N
ewca
stle
(A
ustr
alia
)] a
t 09:
56 0
1 Se
ptem
ber
2014
1508 M. VILLETA ET AL.
Table 9.—Ranking of the combinations of process parameter levels basedon the predicted S/N ratios.
A (mm/rev) B (m/min) C Predicted S/N ratio
0.05 150 HX 9�6130.05 225 HX 9�4490.05 150 TP200 8�6040.05 225 TK2000 8�5710.05 150 TK2000 7�9720.05 75 HX 7�7050.05 75 TP200 7�4690.05 75 TK2000 6�8570.05 225 TP200 5�3240.10 150 HX 5�1430.10 225 HX 4�9790.10 150 TP200 4�1350.10 225 TK2000 4�1020.10 150 TK2000 3�5020.10 75 HX 3�2350.10 75 TP200 2�9990.10 75 TK2000 2�3870.15 150 HX 1�0980.15 225 HX 0�9340.10 225 TP200 0�8540.15 150 TP200 0�0890.15 225 TK2000 0�0560.15 150 TK2000 −0�5430.15 75 HX −0�8100.15 75 TP200 −1�0460.15 75 TK2000 −1�6580.15 225 TP200 −3�192
Optimal combinations of cutting conditions
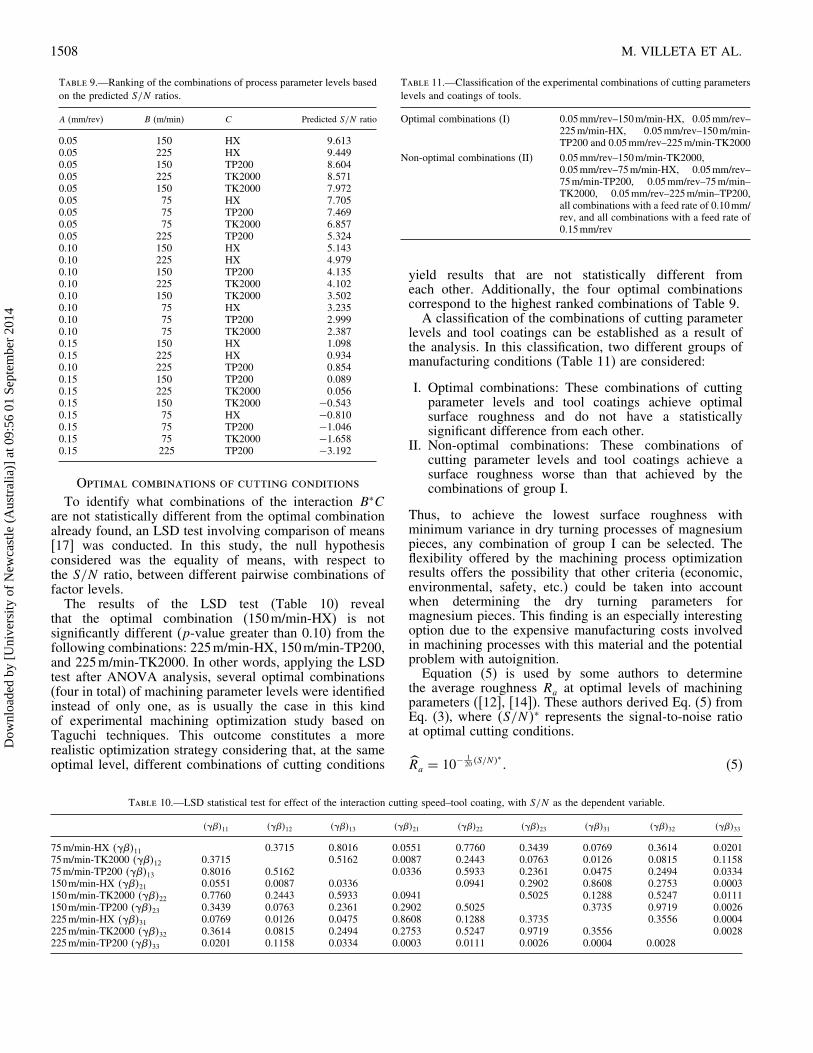
To identify what combinations of the interaction B∗Care not statistically different from the optimal combinationalready found, an LSD test involving comparison of means[17] was conducted. In this study, the null hypothesisconsidered was the equality of means, with respect tothe S/N ratio, between different pairwise combinations offactor levels.The results of the LSD test (Table 10) reveal
that the optimal combination (150m/min-HX) is notsignificantly different (p-value greater than 0.10) from thefollowing combinations: 225m/min-HX, 150m/min-TP200,and 225m/min-TK2000. In other words, applying the LSDtest after ANOVA analysis, several optimal combinations(four in total) of machining parameter levels were identifiedinstead of only one, as is usually the case in this kindof experimental machining optimization study based onTaguchi techniques. This outcome constitutes a morerealistic optimization strategy considering that, at the sameoptimal level, different combinations of cutting conditions
Table 11.—Classification of the experimental combinations of cutting parameterslevels and coatings of tools.
Optimal combinations (I) 0.05mm/rev–150m/min-HX, 0.05mm/rev–225m/min-HX, 0.05mm/rev–150m/min-TP200 and 0.05mm/rev–225m/min-TK2000
Non-optimal combinations (II) 0.05mm/rev–150m/min-TK2000,0.05mm/rev–75m/min-HX, 0.05mm/rev–75m/min-TP200, 0.05mm/rev–75m/min–TK2000, 0.05mm/rev–225m/min–TP200,all combinations with a feed rate of 0.10mm/rev, and all combinations with a feed rate of0.15mm/rev
yield results that are not statistically different fromeach other. Additionally, the four optimal combinationscorrespond to the highest ranked combinations of Table 9.A classification of the combinations of cutting parameter
levels and tool coatings can be established as a result ofthe analysis. In this classification, two different groups ofmanufacturing conditions (Table 11) are considered:
I. Optimal combinations: These combinations of cuttingparameter levels and tool coatings achieve optimalsurface roughness and do not have a statisticallysignificant difference from each other.
II. Non-optimal combinations: These combinations ofcutting parameter levels and tool coatings achieve asurface roughness worse than that achieved by thecombinations of group I.
Thus, to achieve the lowest surface roughness withminimum variance in dry turning processes of magnesiumpieces, any combination of group I can be selected. Theflexibility offered by the machining process optimizationresults offers the possibility that other criteria (economic,environmental, safety, etc.) could be taken into accountwhen determining the dry turning parameters formagnesium pieces. This finding is an especially interestingoption due to the expensive manufacturing costs involvedin machining processes with this material and the potentialproblem with autoignition.Equation (5) is used by some authors to determine
the average roughness Ra at optimal levels of machiningparameters ([12], [14]). These authors derived Eq. (5) fromEq. (3), where �S/N�∗ represents the signal-to-noise ratioat optimal cutting conditions.
Ra = 10−120 �S/N�∗ � (5)
Table 10.—LSD statistical test for effect of the interaction cutting speed–tool coating, with S/N as the dependent variable.
���11 ���12 ���13 ���21 ���22 ���23 ���31 ���32 ���33
75m/min-HX ���11 0.3715 0.8016 0.0551 0.7760 0.3439 0.0769 0.3614 0.020175m/min-TK2000 ���12 0.3715 0.5162 0.0087 0.2443 0.0763 0.0126 0.0815 0.115875m/min-TP200 ���13 0.8016 0.5162 0.0336 0.5933 0.2361 0.0475 0.2494 0.0334150m/min-HX ���21 0.0551 0.0087 0.0336 0.0941 0.2902 0.8608 0.2753 0.0003150m/min-TK2000 ���22 0.7760 0.2443 0.5933 0.0941 0.5025 0.1288 0.5247 0.0111150m/min-TP200 ���23 0.3439 0.0763 0.2361 0.2902 0.5025 0.3735 0.9719 0.0026225m/min-HX ���31 0.0769 0.0126 0.0475 0.8608 0.1288 0.3735 0.3556 0.0004225m/min-TK2000 ���32 0.3614 0.0815 0.2494 0.2753 0.5247 0.9719 0.3556 0.0028225m/min-TP200 ���33 0.0201 0.1158 0.0334 0.0003 0.0111 0.0026 0.0004 0.0028
Dow
nloa
ded
by [
Uni
vers
ity o
f N
ewca
stle
(A
ustr
alia
)] a
t 09:
56 0
1 Se
ptem
ber
2014
FINISH OPTIMIZATION OF DRY TURNED Mg PIECES 1509
Because the present experimental study identified severaloptimal combinations, the �S/N�∗ value in Eq. (5) shouldbe replaced with the weighted mean of the predicted S/Nratios of all optimal combinations, or �S/N�∗ = �9�613 +9�449 + 8�604 + 8�571�/4 = 9�059, and the expectedsurface roughness Ra for the optimal combinations ofmachining parameters is then 10−�1/20��9�059� = 0�352�m.Equation (6) can then be used to determine a confidence
interval for this optimal surface roughness �CIRa� [11]:
CIS/N = �S/N�∗ ±√F0�05�1�ve
MSE/ne� (6)
where an F distribution with 1 and ve degrees of freedom,respectively, is evaluated at a risk � = 0�05; ve representsthe degrees of freedom for the error; MSE is the errorvariance; and ne is the effective number of replications. Inthis study, ve = 16, the value of Snedecor’s F distributionis equal to 4.494, MSE = 1�276, and ne = N/�vT + 1� =27/7, where N is the total number of experiments andvT is the total main factor degrees of freedom. Therefore,CIS/N = �7�840� 10�278� is the 95% confidence interval forthe weighted mean of the predicted signal-to-noise ratioof the optimal combinations �S/N�∗. Finally, the 95%confidence interval of the expected value of optimal surfaceroughness, CIRa, can be obtained by applying Eq. (5) to thelower and the upper confidence limits of the CIS/N interval:
CIRa = �10−120 �10�278� �m� 10−
120 �7�840� �m�
= �0�306�m� 0�406�m�� (7)
Therefore, if an optimal combination of cutting conditions(group I of Table 11) is used in a magnesium dry turningprocess, the expected average roughness value will fallbetween 0.306�m and 0.406�m with a probability of95%. In other words, the optimal combinations of cuttingparameter levels and tool coatings lead to an expectedoptimal minimum value for the surface roughness Ra
that falls inside an accurate confidence interval at a highconfidence percentage.The accuracy and flexibility in the optimization results
confirm the relevance for the described approaches fordry turning of magnesium. Furthermore, manufacturingprocesses with costly machining processes (as relatedto economic, safety, or environmental levels) couldbe managed using the optimization method applied inthe present study to improve the efficiency of suchmanufacturing processes in practice.
Conclusions
This study investigated the influence of dry turningparameters on the surface finish of magnesium pieces andoptimized the machining process based on a methodologythat combines the application of Taguchi techniques andstatistical tests such as the LSD test. The experimentalresults led to the conclusion that such combined applicationconstitutes an optimization method for dry turning processesthat is accurate, flexible, and of undoubted practicalvalue to industry. On one hand, the method led to an
expected optimal minimum value for the average roughnessthat falls inside an accurate confidence interval at highconfidence percentage. On the other hand, the method isflexible because it identifies several optimal combinationsof machining parameters instead of only one. This flexibilityin the optimization results has an added practical value tothe industry because it allows other criteria to be consideredwhen selecting parameters for dry turning of magnesium,such as economic, environmental and safety concerns.Therefore, the optimization method applied in this paperconstitutes an efficient method and could be extended toother workpiece materials and machining processes.The following conclusions can also be extracted from the
analytical results:
(1) The process parameter with the greatest influence onthe surface finish was feed rate (p-value lower than0.0001). In fact, feed rate had a contribution to thevariability of the surface roughness of around 84%.Lower feed rates led to better surface finish on themagnesium workpieces.
(2) The process parameters of tool coating (p-valueof 0.01), cutting speed (p-value of 0.05), and theinteraction of cutting speed with tool coating (p-valueof 0.03) were also influential but to a lesser extent.The remaining interactions considered (feed rate withcutting speed and feed rate with tool coating) had nosignificant influence on the surface roughness.
(3) The combinations of cutting parameter levels and toolcoatings that achieved the optimal surface finish wereas follows: 0.05mm/rev–150m/min–HX, 0.05mm/rev–225m/min–HX, 0.05mm/rev–150m/min–TP200, and0.05mm/rev–225m/min–TK2000. The best dry turningprocess was obtained with these combinations, whichseem to have insignificant statistical differences fromeach other (p-value greater than 0.10).
(4) The optimal combinations of cutting conditions led toan expected optimal value for the average roughness Ra
between 0.306 �m and 0.406�m with 95% confidence.
Acknowledgments
Funding for this work was provided in part by the SpanishMinistry of Science and Innovation (Directorate Generalof Research) Project DPI2008-06771-C04-02 and by theIndustrial Engineering School (UNED) Project REF2010-ICF03. The material used in the machining tests wasobtained from the Engine Overhaul Shop of the companyIBERIA L.A.E.S.A.
References
1. Yang, Y.K.; Tzeng, C.J. Die-casting parameter sizing for AZ91Din notebook computer base shell. Mater. Manuf. Process. 2006,21(5), 489–494.
2. De Damborenea, J. New Materials in the 21st Century; Chapter 2:New metallic materials; CNIM-CSIC: Madrid, 2007 (in Spanish).
3. Cao, X.; Xiao, M.; Jahazi, M.; Fournier, J.; Alain, M.Optimization of processing parameters during laser cladding ofZE41A-T5 magnesium alloy castings using Taguchi method.Mater. Manuf. Process. 2008, 23(4), 413–418.
Dow
nloa
ded
by [
Uni
vers
ity o
f N
ewca
stle
(A
ustr
alia
)] a
t 09:
56 0
1 Se
ptem
ber
2014
1510 M. VILLETA ET AL.
4. Montgomery, D.C. Statistical Quality Control: A ModernIntroduction, 6th ed.; Wiley: New York, 2009.
5. Puertas, I.; Luis, C.J. A study of optimization of machiningparameters for electrical discharge machining of boron carbide.Mater. Manuf. Process. 2004, 19(6), 1041–1070.
6. Saikumar, S.; Shunmugam, M.S. Parameter selection basedon surface finish in high-speed end-milling using differentialevolution. Mater. Manuf. Process. 2006, 21(4), 341–347.
7. Horng, J.-T.; Liu, N.-M.; Chiang, K.-T. Investigating themachinability evaluation of Hadfield steel in the hard turningwith Al2O3/TiC mixed ceramic tool based on the response surfacemethodology. J. Mater. Process. Technol. 2008, 208, 532–541.
8. Tönshoff, H.K.; Winkler, J. The influence of tool coatings inmachining of magnesium. Surf. Coat. Technol. 1997, 94–95,610–616.
9. Guo, X.H.; Teng, L.J.; Wang, W.; Chen, T.T. Study on thecutting properties about magnesium alloy when dry turning withkentanium cutting tools. Advanced Materials Research 2010,102–104, 653–657.
10. Taguchi, G. System of Experimental Design, Vol. 2; AmericanSupplier Institute: New York, 1987.
11. Ross, P.J. Taguchi Techniques for Quality Engineering: LossFunction, Orthogonal Experiments, Parameter and ToleranceDesign; Mc-Graw Hill: New York, 1996.
12. Kopac, J.; Bahor, M.; Sokovic, M. Optimal machining parametersfor achieving the desired surface roughness in fine turning of coldpre-formed steel workpieces. Int. J. Mach. Tools Manuf. 2002,42, 707–716.
13. Lin, Y.C.; Cheng, C.H.; Su, B.L.; Hwang, L.R. Machiningcharacteristics and optimization of machining parameters ofSKH 57 high-speed steel using electrical-discharge machiningbased on Taguchi method. Mater. Manuf. Process. 2006, 21(8),922–929.
14. Gologlu, C.; Sakarya, N. The effects of cutter path strategieson surface roughness of pocket milling of 1.2738 steel basedon Taguchi method. J. Mater. Process. Technol. 2008, 206,7–15.
15. Lien, C.H.; Guu, Y.H. Optimization of the polishing parametersfor the glass substrate of STN-LCD. Mater. Manuf. Process. 2008,23(8), 838–843.
16. Lin, Y.C.; Wang, A.C.; Wang, D.A.; Chen, C.C. Machiningperformance and optimizing machining parameters of Al2O3-TiC ceramics using EDM based on the Taguchi method. Mater.Manuf. Process. 2009, 24(6), 667–674.
17. Montgomery, D.C. Design and Analysis of Experiments, 6th ed.;Wiley: New York, 2005.
18. SAS® (Statistical Analysis System) Software, Version 9.1 forWindows; SAS Institute Inc.: Cary, NC, 2004.
Dow
nloa
ded
by [
Uni
vers
ity o
f N
ewca
stle
(A
ustr
alia
)] a
t 09:
56 0
1 Se
ptem
ber
2014