surface energetics of lithographic printing plate and
TRANSCRIPT
Lehigh UniversityLehigh Preserve
Theses and Dissertations
1-1-1983
Surface energetics of lithographic printing plate andprinting inks.Yonezo Kato
Follow this and additional works at: http://preserve.lehigh.edu/etd
Part of the Polymer Science Commons
This Thesis is brought to you for free and open access by Lehigh Preserve. It has been accepted for inclusion in Theses and Dissertations by anauthorized administrator of Lehigh Preserve. For more information, please contact [email protected].
Recommended CitationKato, Yonezo, "Surface energetics of lithographic printing plate and printing inks." (1983). Theses and Dissertations. Paper 2342.
SURFACE ENERGETICS OF LITHOGRAPHIC
PRINTING PLATE AND PRINTING INKS
by
Yonezo Kato
A Thesis
Presented to the Graduate Committee
of Lehigh University
in Candidacy for the Degree of
Master of Science
in
Polymer Science and Engineering /^' 1
Lehigh University
October 1980
ProQuest Number: EP76618
All rights reserved
INFORMATION TO ALL USERS The quality of this reproduction is dependent upon the quality of the copy submitted.
In the unlikely event that the author did not send a complete manuscript and there are missing pages, these will be noted. Also, if material had to be removed,
a note will indicate the deletion.
uest
ProQuest EP76618
Published by ProQuest LLC (2015). Copyright of the Dissertation is held by the Author.
All rights reserved. This work is protected against unauthorized copying under Title 17, United States Code
Microform Edition © ProQuest LLC.
ProQuest LLC. 789 East Eisenhower Parkway
P.O. Box 1346 Ann Arbor, Ml 48106-1346
CERTIFICATE OF APPROVAL
This thesis is accepted and approved in partial ful-
fillment of the requirements for the degree of Master of
Science.
: J-l /?&> (date)
John W. Vanderhoff Professor in Charge
Jfcmn A. I in A. Manson Chairman of Polymer Program Committee
Leonard At. Wenzel Chairman of Chemical Engineering Department
11

ACKNOWLEDGEMENTS
Thanks are expressed to Professor J. W. Vanderhoff
for his interest and helpful suggestions throughout the
author's graduate studies- Special thanks are accorded to
Professor F. M. Powkes for his helpful discussions regard-
ing this research. Sincere thanks are also extended to
faculties, staffs, and colleagues at Lehigh University who
contributed in many ways to the completion of this work.
Financial support from the National Printing Ink
Research Institute and Oji Paper Company Ltd. is also
gratefully acknowledged. In addition, the author wishes
to express his appreciation to the following companies for
providing materials during the work:
Lehigh Litho Inc.
Meer Corporation x
111
TABLE OF CONTENTS
V
Page
LIST OF TABLES vii
LIST OF FIGURES X
ABSTRACT 1
Chapter
1. INTRODUCTION 4
2. THEORY 6
2-1. Dispersion Force , 6
2-2. Intermolecular Interaction 9
2-3. Acid Base Interaction 11
2-4. Kaelble Theory 13
3. SAMPLE PREPARATION 15
3-1. Samples ♦ . . . . 15
3-1-1. Image Area and Non-Image Area of Lithographic Plates 15
3-1-2. Photo-Oxodized Polystyrene Films . . 15
3-1-3. Dry Offset Ink Films 16
3-1-4. Fountain Solutions . . 16
3-1-5. Surfactant Solutions . 17
3-1-6. Gum Arabic Solutions 17
3-2. Surface Tension of the Solutions . , . . 18
3-3. Interfacial Tension. . . , 20
iv

Page
3-3-1, Method ..,.,,,.,..,..» 20
3-3-2, Density of the Solutions 21
3-3-3. Calibration of the Traube Stalagmometer. , 21
3-3-4, Result 23
4. SAMPLE CHARACTERIZATION 26
4-1, Dispersion Component and Non-Dispersion Component of Solids, , , . , 26
4-1-1. Method 26
4-1-2, Image Area and Non-Image Area of Lithographic Plates. ,,.,,,,, 27
4-1-3, Photo-Oxidized Polystyrene Films , . 30
4-1-4, Dry Offset Ink Film. ,.,,,.,. 31
4-2. Dispersion Component of Liquids 33
4-2-1. Characterization of Paraffin Wax and Polyethylene ..... 33
4-2-2. Dispersion Component of the Fountain Solutions , , . , 34
5. CONTACT ANGLE MEASUREMENT 38
5-1. With Water 41
5-2. With Fountain Solution , 46
5-2-1. In Air ,,..,.,.. 46
5-2-2. In Octane. , . 48
5-2-3. In Fountain Solution ... 54
5-3. With Surfactant Solution .,,.,,,. 61
5-3-1. Cationic Surfactant. ,..,,,,. 61
5-3-2. Nonionic Surfactant. . „ 67
v
Page
V 5-4. With Gum Arabic Solution 69
6. DISCUSSION , 74
6-1. Spreading Coefficient 74
6-1-1. Original Method 74
6-1-2. Kaelble Method 83
6-2. Work of Adhesion . , 89
6-2-1. Initial Inking Process 89
6-2-2. During Printing 93
6-3. Work of Adhesion in Octane or in the Fountain Solutions ..... 95
6-4. Tinting and Scumming 98
7. CONCLUSIONS 103
REFERENCES 108
VI
LIST OF TABLES
Table Title Page
3.1 Surface tension and pH of the diluted foun- tain solution 18
3.2 Surface tension and pH of cationic surfactant solution (hexadecyltrimethylammonium bromide) . 19
3.3 Surface tension and pH of the nonionic sur- factant solution (Triton X-100) 19
3.4 Surface tension and pH of the gum arabic solution 19
3.5 Density of the fountain solutions 21
3.6 Experimental interfacial tension between octane and the fountain solutions ....... 24
4.1 Dispersion component and non-dispersion inter- action energy of Image and Non-Image Areas. . . 29
4.2 Surface energetic characterization of photo- oxidized polystyrene films 30
4.3 Surface energetic characterization of dry ink film 33
4.4 Dispersion component and non-dispersion inter- action energy of paraffin wax and polyethylene. 34
4.5 YT of tne fountain solutions (Lot NO. 1) from
paraffin wax 35
4.6 YT of tne fountain solutions (Lot NO. 2) from
polyethylene. 35
/ 4.7 Non-dispersion interaction energy, I „ calculated by using average Y^C • • • * 37
5.1 Non-dispersion interaction energy of the photo- oxidized polystyrene films with water measured in octane and octane in water 42
vn

Table Title Page
5.2 Non-dispersion interaction energy of Image and Non-Image Areas in octane and in water. . . 45
5.3 Non-dispersion interaction energy and work of adhesion of Image and Non-Image Areas in octane with the fountain solutions 49
5.4 Non-dispersion interaction energy and work of adhesion of the photo-oxidized poly- styrene films in octane with the fountain solutions 50
5.5 Non-dispersion interaction energy and work of adhesion of Image or Non-Image Area in the fountain solutions with octane after one minute immersion 55
5.6.1-3 I_w and WA of the photo-oxidized polystyrene films in the fountain solutions with octane drop after one and five minutes immersion ... 56
6.1 Spreading coefficient S2« .' 77
6.2 Spreading coefficient S, . . . . . 81
6.3 Square root of dispersion component and polar component for Image Area and Non-Image Area ... 84
6.4 Comparison of the non-dispersion interaction energy obtained from experimental results and Kaelble method. (Image Area) 88
6.5 Non-dispersion interaction Energy of Non- Image Area with the fountain solutions obtained from experiment and Kaelble method 88
6.6 Works of adhesion between the solids and the fountain solutions or the solids and ink. ... 91
6.7 Works of adhesion of ink and ink or the fountain solutions 94
6.8 Works of adhesion of the fountain solution and fountain solution or ink 94
Vlll
Table Title Page
6.9 Works of adhesion of solids with octane in the fountain solution media 96
6.10 Works of adhesion of solids with fountain solutions in octane medium. , . . 97
xx

LIST OF FIGURES
Figure Title Page
*2.1 Diagram of two monolayers at liquid-liquid interface in which tension resides 8
3.1 The Traube stalagmometer 22
4.1 Non-dispersion component from contact angle of water on photo-oxidized polystyrene films in air 32
4.2 Dispersion force component of fountain solu- tion from contact angle on Paraffin and Polyethylene 36
5.1 Schematic diagram of contact angle measurement in both water and octane phases 39
5.2 Non-dispersion interaction-from contact angle of water on solids in octane and of octane in water s . 43
5.3 Contact angle of fountain solution on solids in air 47
5.4 Contact angle of fountain solution on solids in octane 51
5.5 Work of adhesion and non-dispersion inter- action energy of fountain solution on solids in octane 53
5.6 Contact angle! of octane on solids in fountain solution after 1 minute immersion 59
5.7 Contact angle of octane on solids in fountain solution after 5 minutes immersion 60
5.8 Work of adhesion and non-dispersion inter- action energy of octane on solids in fountain solution 62
5.9 Contact angle of cationic surfactant solution on solids in air 63
x

Figure Title Page
5.10 Contact angle of cationic surfactant solu- tion (Hexadecyltrimethylammonium bromide) on solids in octane 65
5.11 Contact angle of octane on solids in cationic surfactant solution (Hexadecyltrimethyl- ammonium bromide) 66
5.12 Contact angle of nonionic surfactant solu- tion (Triton X-100) on solids in octane .... 68
5.13 Contact angle of octane in nonionic surfactant solution (Triton X-100) ..... 70
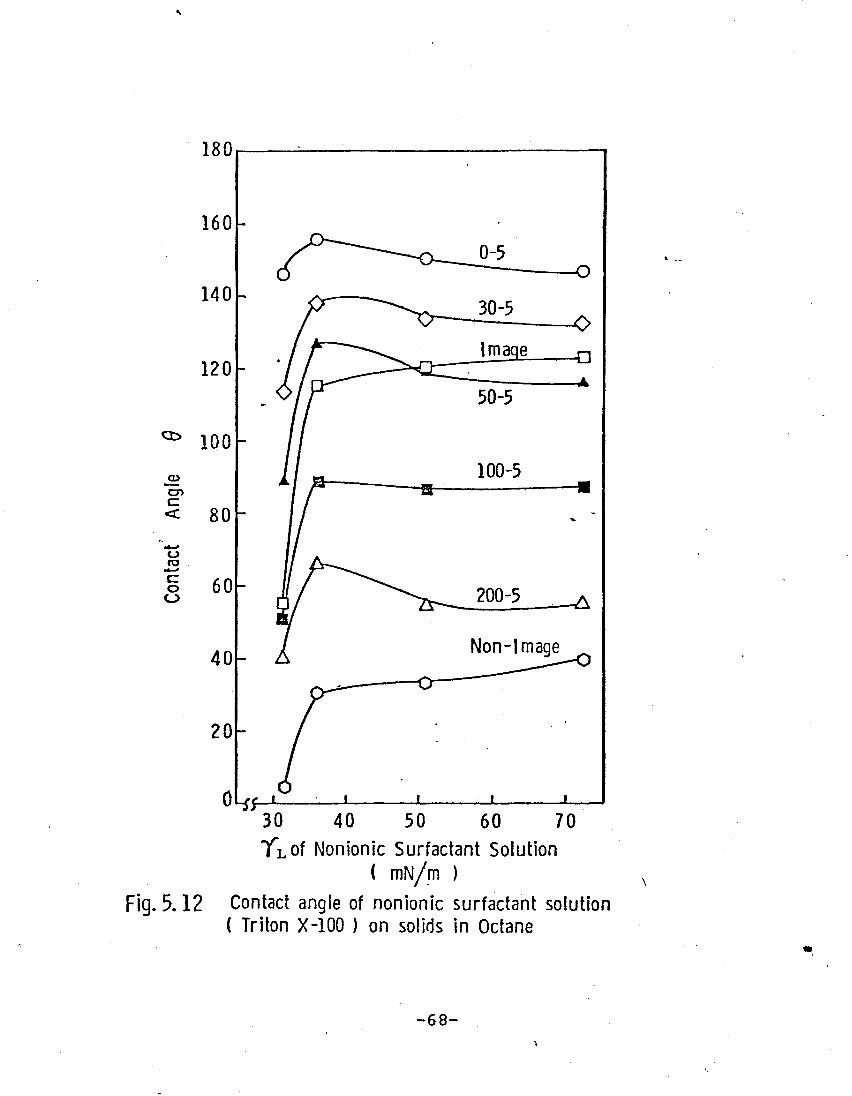
5.14 Contact angle of gum arabic solution on solids in octane 72
5.15 Contact angle of octane on solids in gum arabic solution after 1 and 5 minutes immersion , 73
6.1 Spreading coefficient S~ as a function of sur- face tension of fountain solution ....... 78
6.2 Spreading coefficient S-i as a function of sur- face tension of fountain solution . t 82
6.3 Griffith's surface energy for fracture, and graphical determination of the tolerance range for the surface properties of the fountain solution (Kaelble method) 86
XI

ABSTRACT
The surface energetic interaction of lithographic
printing plates, printing inks, and fountain solutions were
defined to determine the mechanism of lithographic printing.
Kodak Polymatic Plates were exposed and prepared as
directed to give a practical hydrophobic image area and a
hydrophilic non-image area. To cover the range between the
low-surface energy image area and the high-surface energy
s£ non-image area, polystyrene films were photooxidized to
varying degrees by exposure to ultraviolet light. A typi-
cal lithographic printing ink was used as the practical
component and n-octane as a model component. A typical
aqueous-based fountain solution was used as the practical
component, and pure water, water-surfactant, and water-gum
arabic mixtures as the model components.
The surface energy of a substrate can be divided into
dispersion and non-dispersion components. The dispersion
component was determined by measuring the contact angle of
methylene iodide or a-bromonaphthalene on the substrate.
However, the non-dispersion interaction energy was deter-
mined instead of non-dispersion component by measuring the
contact angle of water.
Contact angles of fountain solutions on solids in air
or in octane were measured. Similarly, the contact angle
-1-

of octane on solids in fountain solutions were measured.
Then, the following results were found:
1. Cationic surfactants cannot be used as one of
the ingredients of a fountain solution since
the adsorption of a cationic surfactant on
surfaces makes them hydrophobic.
2. Nonionic surfactants can be used. However,
the surface tension of the solution should
not be lower than a critical point (about
32 mN/m) at which emulsification of ink may
be severe and cause tinting.
3. Gum arabic adsorption on non-image areas at
low pH can help repell ink adhesion on non-
image areas. One to two percent glim" arabic
solution may be needed for this purpose.
4. Spreading coefficients S, and S2 of fountain
solution and octane, respectively, never be-
come positive.
5. It is found that non-dispersion interaction
energies are overestimated when using Kaelble
method. These spreading values do not give a
solution for the mechanism of lithographic
printing.
6. After the initial inking process, W (ink-ink)
> Wn (ink-FS) for image areas and W (FS-FS) >
W. (FS-ink) for non-image areas should be
-2-

satisfied provided that non-image areas
are wetted by the fountain solution.
7. The surface tension of fountain solution
should be chosen according to the nature of
image part and non-image part. The more-'''
hydrophobic the image part and the more
hydrophilic the non-image part, the wider
is the latitude for the surface tension of
the fountain solution.
8. The minimum surface tension can be decided
upon consideration of the contact angle of
fountain solutions on the ink film, and
adjusted by nonionic surfactants and iso-
propylalcohol to avoid tinting and scumming.
-3-
1. INTRODUCTION
In the lithographic process, the printing plate com-
prises a hydrophobic image area and a hydrophilic non-image
area; hydrophilic fountain solution is applied to the plate,
followed by hydrophobic ink, so that the non-image area is
covered with a thin film of fountain solution and the image
area, with a thin film of ink; this composite film is trans-
fered to a rubber blanket and then to the paper substrate.
Many studies have been reported on the mechanism of
this printing process, but only a few on its surface
energetics. The mechanism of lithographic printing has
been explained by various ways.
Tollenaar [1] and K. Schlapfer [2] explained it by
wetting phenomena or wettability phenomena such as critical
surface tension.
Padday [3] tried to explain the mechanism by the work
of adhesion and work of cohesion between image area, non-
image area, ink, fountain solution, blanket and paper, and
obtained approximate values of the surface energy of the
image area, non-image area, ink and water.
Badescu [4] calculated the work of mechanical adhesion
and interfacial tension in the presence of water at various
pH values for copper-chromium bimetal plates. He reported
that the work of mechanical adhesion decreased with an
-4-
increase of pH from 5.6 to 7, and offset printing should be
done in neutral media. The printing mechanism is dependent
on the pH value of the fountain solution.
Recently, Kaelble [5] combined surface energetics and
fracture theory and explained the mechanism by the value of
the spreading coefficient. This theory has been accepted
as the first theory which depends upon measurable surface
properties of the ink and dampening solution.
This paper presents the results of a quantitative
surface energetics analysis of lithographic printing
plates, printing inks, and fountain solutions. Tinting
and scumming phenomena are related to the characteristics
of fountain solution, considering the mechanical movement
of the printing press.
-5-
2. THEORY
2-1. Dispersion Force
The intermolecular forces which are the cause of sur-
face tension depend on a variety of well-known intermolecular
forces. Most of these forces, such as the metallic bond or
the hydrogen bond, are a function of specific chemical
nature. On the other hand, London dispersion forces exist
in all types of matter and always give an attractive force
between adjacent atoms or molecules no matter how dissimilar
their chemical natures may be.
The London dispersion forces arise from the inter-
action of fluctuating electronic dipoles with induced di-
poles in neighboring atoms or molecules. These forces
depend on electrical properties of the volume elements in-
volved and the distance between them, and are independent
of temperature. Fowkes [6] proposed that, in a liquid
such as mercury, there are two main interatomic forces—
the metallic bond and the London dispersion forces. Con-
sequently, the surface tension of mercury can be divided
into two parts—the part due to dispersion forces and the
part due to metallic bonds:
d , m /o -i \ VJ = YHg + YHg (2'1)
A similar equation may be written for the surface tension
-6-
of water or any other polar liquid
Y = yd + YP + y
h + Ym + (2.2)
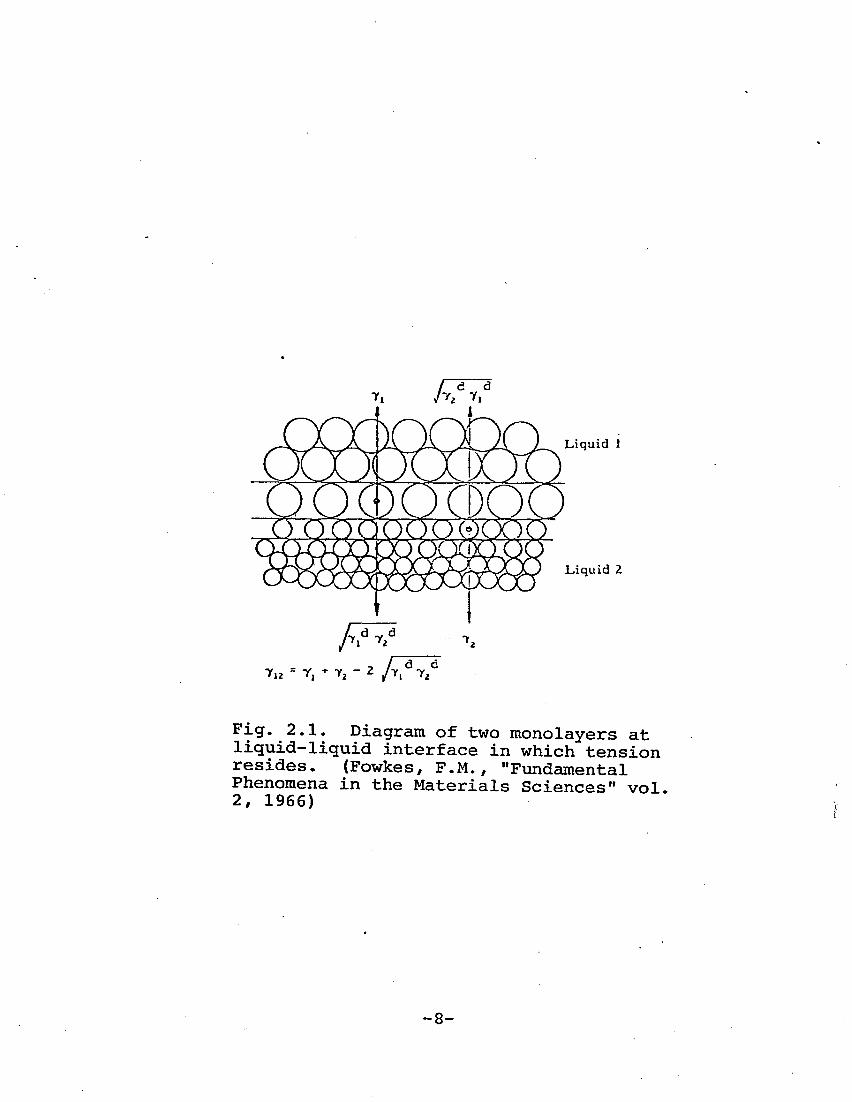
Figure 2.1 [7] shows a model of the interface between
a liquid hydrocarbon and mercury. The interface is com-
posed of the two adjacent interfacial regions, and the
interfacial tensions, therefore, must be the sum of the
tensions in each of these regions. In the interfacial
region of the hydrocarbon, the molecules are attracted to-
ward the bulk hydrocarbon by intermolecular forces which
tend to produce a tension equal to the surface tension of
the hydrocarbon (Y-.) . However, at the interface there is
also an attraction by the London dispersion forces of the
mercury for those hydrocarbon molecules in the interfacial
region. These molecules are in a different force field
than those at the surface of the hydrocarbon because of
this interaction and, therefore, the tension in this layer
is a function of the difference between surface tension
of the hydrocarbon and the attractive force exerted by
the London dispersion force interaction between hydro-
carbon and mercury.
The effect of interfacial attraction on the tension
in the interface can be predicted by the geometric mean of
the dispersion force components of the surface tension of
the hydrocarbon and of the mercury (vy, Y2 ) [8]. Thus,
-7-
Liquid 1
Liquid 2
-> /"~d d
Fig. 2.1. Diagram of two monolayers at liquid-liquid interface in which tension resides. (Fowkes, P.M., "Fundamental Phenomena in the Materials Sciences" vol. 2, 1966)
-8-
the tension in the interfacial region of the hydrocarbon
^ Y-, Y, • Similarly, in the interfacial
region of mercury, the attractive force of bulk mercury is
partially balanced by the attractive force of the hydro-
carbon, and the tension in this layer is equal to
Y2 ~A"i Y? • Since the interfacial tension Y-i 2 ^s tne sum
of the tensions in these two layers:
Y12 = Yl + Y2 " 2^\^2 (2'3)
2-2. Intermolecular Interaction
Since intermolecular attractions result from several
fairly independent phenomena (such as dispersion forces (d),
dipole interactions (p) hydrogen-bond (h), etc.), it is
reasonable to separate out such terms in the work of
adhesion:
W* = W.d + WAP + WA
h + (2.4) A A A A
This principle leads to the widely used equation:
with which interfacial tensions, contact angles, free
energies of adsorption, and Hamaker constants have been
successfully calculated. There is also some reason to
treat dipole-dipole interactions separately with the
geometric mean expression:
-9-

WA = 2^'1PY2
P (2.6)
The interaction energy between two dipoles is
2 ? 6 -2y, y? /3kTY,?, so if the distance between dipoles Y12
is the geometric mean of Y-.-, and Y-, « of the pure materials,
then Eq. (2.6) is correct.
The extension of Equations (2.4)(2.5) and (2.6) to
try to predict hydrogen-bonding with a geometric mean ex-
pression is quite incorrect, for hydrogen-bond acceptors
such as ethers, esters, or aromatics cannot themselves form
hydrogen-bonds and, therefore, y is zero for such materials,
even though these materials have a large W with hydrogen-
donors. Similarly, some hydrogen-donors such as chloroform
have zero values of y /but large values of W .
In solution studies, the separation of heats of mix-
ing into several terms soon followed. Blanks and Prausnitz
[9] used only two terms (polar and non-polar) while Gardon
[10] and Meyer and Wagner [11,12] included terms for dipole-
dipole and for dipole-induced dipole interaction. Although
hydrogen-bonding had been recognized much earlier [13-16],
it was Hansen [17] who brought forth the widely used three-
dimensional solubility parameter:
d p h AHM = AHR„ + AHM + AHM + (2.7) M M M M
and
S2 = 62 + 62 + 6? (2.8) a p h
-10-

_3 J
The dispersion force term (AH ), or more properly (AU ),
can be correctly evaluated by means of the geometric mean;
iHM » A0M " Vl*2(4+S2-2>/^f) (2-9)
and perhaps a dipole-dipole term (AU*j could also be esti-
mated from:
AUM = Vl*2(6l+62-2/^f> (2*10)
but for the reasons described before, there is no way that ■L. TTT—cr
AUM can be predicted with a term 2/6,62 and, consequently,
any two sets of correlations are in serious disagreement.
2-3. Acid Base Interaction
*■ Recently, Drago [18] has treated the hydrogen-bond as
an acid-base interaction (AH ) :
"iHMb = CACB + EAEB (2-11)
where
CA and CR = the susceptibility of the acid and base, respectively, to form covalent bonds.
EA and E = the susceptibility of the acid and base, respectively, to under- go electrostatic interaction
ab Drago measured AH„ in CC1. as a neutral solvent and deter- M 4
mined C, and E for each acid and C_ and E for each base.
He assumed that AH and AH*? were negligibly small for the
-11-
ab acids and bases, and in his correlation all predicted AH. M
values (up to 80 KJoules/mole) agreed with measured values
within about 5% or less.
Drago's correlation (treating interactions as due only
to dispersion forces and acid-base interactions) is much
more successful than Kaelble's [5] and Hansen's [17] corre-
lations (treating interactions as due only to dispersion
forces and polar interactions predictable from geometric
mean equations). It is of especial interest that in Drago's
correlation the neglect of dipole-dipole interactions gave
no problems, suggesting that dipole-dipole interactions are
negligibly small compared to acid-base and dispersion force
interactions.
Fowkes [19] proposes that the heat of mixing (AH ) be
given by:
AHM = PAVM + Vl*2(4-62)2-Xp(CACB+EAEB) + AU12 (2-12)
where X is the mole fraction of acid-base pairs per mole
of components present. Similarly, the work of adhesion
is:
WA = 2/fi*.- f(CACB+W * -noles °^cia-base pair
-' > W^ (2.13)
in which the constant f (near unity) converts enthalpy per
unit area into surface free energy, and the last term is
usually small.
-12-
These concepts combined with contact angle measure-
ments of liquids on the surface of solids lead to the work
of adhesion expressed as:
WA = YL(1 + COS 6) + 7re = WA + WAb + WA + "•• (2-14)
where Tre is any reduction of the surface energy of the solid
resulting from adsorption of the vapor of the test liquid.
Although Adamson [20,21] reported that a large contact
angle, in other words, a low surface-energy-solid, does
not necessarily imply a low fre; in general, ire is expected
to be negligibly small for high-energy liquids on low-
energy solids.
2-4. Kaelble Theory
As described before, Kaelble [5] proposed that inter-
facial tension between two phases can be expressed in the
following relation:
*12 = (a:Ta2>2 + <B1-B2)2 +712 (2-15»
= Yl + Y2 " 2/7T^ + 712 (2-16)
where a.. , $_ = square root of the respective (London)
dispersion Y,f and (Keesom) polar Y? parts of Y-,. Inter-
faces dominated by London dispersion interactions are
termed regular interfaces and the value of the excess term
A 2 of Eq. (2.15) can be considered negligible.
-13-

Kaelble's main concept is that the intermolecular
interaction can be expressed by two terms, dispersion com-
ponent and polar component, and both of them are expressed
with the geometric mean.
Surface tensions (y-j and y_) of phase 1 and 2 are:
y1 = a* + Bj2 (2.17)
y2 = a2
2 + B22 (2.18)
The work of adhesion (W ) between a liquid (L) and a solid
(S) is expressed as:
WA = 2(aLaS + BL3S) = YL(1 + COS 9) (2.20)
-14-
J

3. SAMPLE PREPARATION
3-1. Samples
3-1-1. Image Area and Non-Image Area of Lithographic Plates
For an image area, a commercial lithographic printing
plate, Kodak Polymatic Plate, was exposed by passing it three
times (net exposure time is 1.0 sec) under a Hanovia 200
watt/inch UV lamp. The exposed plate was cut into smaller
2 plates (3.3x2 cm ) and soaked in a soap solution for ten
minutes.u These plates were cleaned by the ultrasonic wave
cleaner (SONIFIER W-350 Bramson Sonic Co.), then rinsed
vigorously in the distilled deionized water by the ultra-
sonic wave cleaner again. These cleaned plates were dried
in a vacuum dryer for two and one half hours at room tempera-
ture, then kept in a desiccator.
For a non-image area, the photosensitive polymer
layer of the unexposed Kodak Polymatic Plate was removed
by Kodak Polymatic LN developer; then the plate was cut 2
into smaller samples (3.3x2 cm ) and rinsed vigorously with
the distilled deionized water by the ultrasonic wave cleaner
as well. These cleaned plates were dried and kept in a
desiccator in the same way as the image plate.
3-1-2. Photo-Oxidized Polystyrene Films
The 4.5 wt % of polystyrene (MW=35,000) solution was
-15-
prepared using methylene chloride as a solvent. This solu-
tion was applied on aluminum plates by a #18 wire-wound rod
applicator. These coated plates were kept in a vacuum
dryer for two and one half hours at room temperature. To
get various degrees of photo-oxidation of the polystyrene
films, the plates were exposed by passing under the Hanovia
UV lamp as many times as required to obtain the desired sur-
face energies, taking care that the temperature of a plate
would not rise above the thermal decomposition temperature
of polystyrene. The different degrees of photo-oxidized
polystyrene film were obtained by exposing as many times as
0, 30, 50, 100, 150, and 200. These plates were cut into
smaller samples (3.3x2 cm2) and kept in a dark box.
3-1-3. Dry Offset Ink Film
A commercial offset ink (SYN-DRY quick set black ink)
was applied, to an aluminum plate (3.3x2 cm2) using the Quick
Peek roller. The amount of ink on the Quick Peek plate
(20.2x5.5 cm ) was about 0.6g. These ink-coated plates
were dried for two and one half hours in an oven at 85°C.
3-1-4. Fountain Solutions
A commercial fountain solution (WESTERN TRI-FOUNTAIN
ETCH) was diluted with distilled deionized water to differ-
ent concentrations (0.2, 0.5, 2, 8, 20, 50 vol %) so as to
get a series of different surface tensions. However, the
-16- A

diluted fountain solutions had to be used within 24 hours
since they were unstable. Some sedimentation took place at
the bottom of the solution if the solution was kept for more
than 48 hours at room temperature.
3-1-5. Surfactant Solutions
Since anionic surfactants are unstable at low pHf a
cationic and a nonionic surfactant were examined.
(A) Cationic Surfactant
Hexadecyltrimethylammonium bromide (C,gH33N(CH3) Br~;
-4 C.M.C. = 9.2x10 M) was used as a cationic surfactant.
Three different concentrations of cationic surfactant solu-
-4 -4 -3 tion (1.57x10 M, 5.49x10 M and 1.10x10 M) were prepared.
The pH value of the solutions were adjusted to 3.0 by
phosphoric acid.
(B) Nonionic Surfactant
Isooctylphenoxy polyethoxyethanol (TRITON X-100; _3
C.M.C. = 1.25x10 M) was used as a nonionic surfactant.
Three different concentrations of nonionic surfactant
solutions (3.30xlO~6M, 3.30xlO""5M and 1.24xl0~"3M) were
prepared. The pH value of the solutions were also ad-
justed to 3.0 by phosphoric acid.
3-1-6. Gum Arabic Solutions
As one of the modified fountain solutions, three
-17-

different concentrations of gum arabic solutions (0.2 g/%,
1 g/% and 2 g/%) were prepared by dissolving 2 g of gum
arabic (Meer Gum Arabic Type G-150) in one liter of dis-
tilled deionized water at 60°C for three hours. The pH
was also adjusted to 3.0 by phosphoric acid.
3~2. Surface Tension of the Solutions
The surface tensions of the solutions were measured
by the Du Noiiy Ring method. The temperature of the solu-
tions was 23 ±0.5°C. These results are tabulated in Tables
3.1-3.4. The pH values of the solutions are also indicated,
Table 3.1. Surface tension and pH of the diluted fountain solution.
Concentration Surface Tension pH Vol % Wt % mN/m
0 0 72.3 5.9
0.2 0.05 66.5 3.48
0.5 0.14 58.5 3.20
2 0.55 53.0 2.92
8 2.2 42.7 2.64
20 5.5 38.0 2.46
50 13.7 34.2 2.23
100 27.3 34.2 2.07
-18-

Table 3.2. Surface tension and pH of the cationic surfactant solution,
(hexadecyltrimethylammonium bromide)
Concentration g/£ mole/£
Surface Tension mN/m
PH
0.057 1.57X10⁻⁴ 59.4 3±0.1
0.2 5.49X10"4 44.5 3±0.1
0.4 l.lOxlO"3 38.5 3±0.1
Table 3.3. Surface tension and pH of the nonionic surfactant solution.
(Triton X-100)
Concentration q/l mole/Z
Surface Tension mN/m
PH
2.3xl0~3 3.30xl0~6 51.5 3±0.1
2.13xl0~2 3.30xl0~5 35.7 3±0.1
8.0X10"1 1.24xl0~3 31.7 3±0.1
Table 3.4. Surface tension and pH of the gum arabic solution.
Concentration Surface Tension mN/m
PH
0.2 64.5 3±0.1
1.0 62.0 3±0.1
2.0 61.0 3±0.1
-19-
3-3. Interfacial Tension
3-3-1. Method
The interfacial tensions of octane and the fountain
solutions were measured by the drop weight method [22J,
There are several methods [23] to measure interfacial
tensions; however, the drop weight method was applied since
this method is the most accurate and relatively simple of
the available methods.
The relationship for calculating interfacial tensions
in terms of drop weight may be expressed as;
where
W = 2TrrByf (r/V173) (3,1)
W(mg) : the weight of a drop
r : the tip radius a
f (r/V1/'3) : the correction factor
so, the interfacial tension Y: »
Y = {v|P;L-p2|g/rB}-F (3.2)
where
V : the volume of a drop
p, : the density of a phase 1
p2: the density of a phase 2
F : the correction value related to r/V '
The correction factor, F, is in Table VI-B (Matijevic,
Surface Colloid Science Vol. 1) [22].
-20-
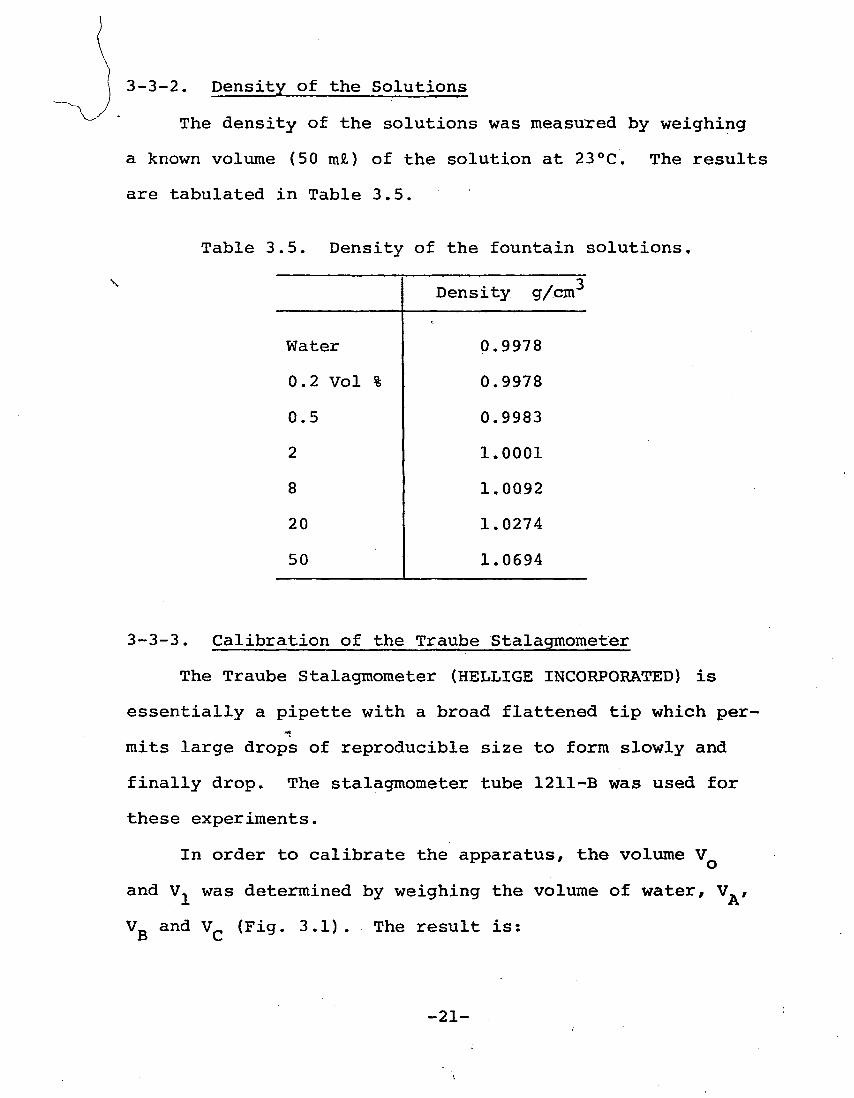
3-3-2. Density of the Solutions
The density of the solutions was measured by weighing
a known volume (50 mi) of the solution at 23°C. The results
are tabulated in Table 3.5.
Table 3.5. Density of the fountain solutions,
\ Density g/cm
Water 0.9978
0.2 Vol % 0.9978
0.5 0.9983
2 1.0001
8 1,0092
20 1.0274
50 1.0694
3-3-3. Calibration of the Traube Stalagmometer
The Traube Stalagmometer (HELLIGE INCORPORATED) is
essentially a pipette with a broad flattened tip which per-
mits large drops of reproducible size to form slowly and
finally drop. The stalagmometer tube 1211-B was used for
these experiments.
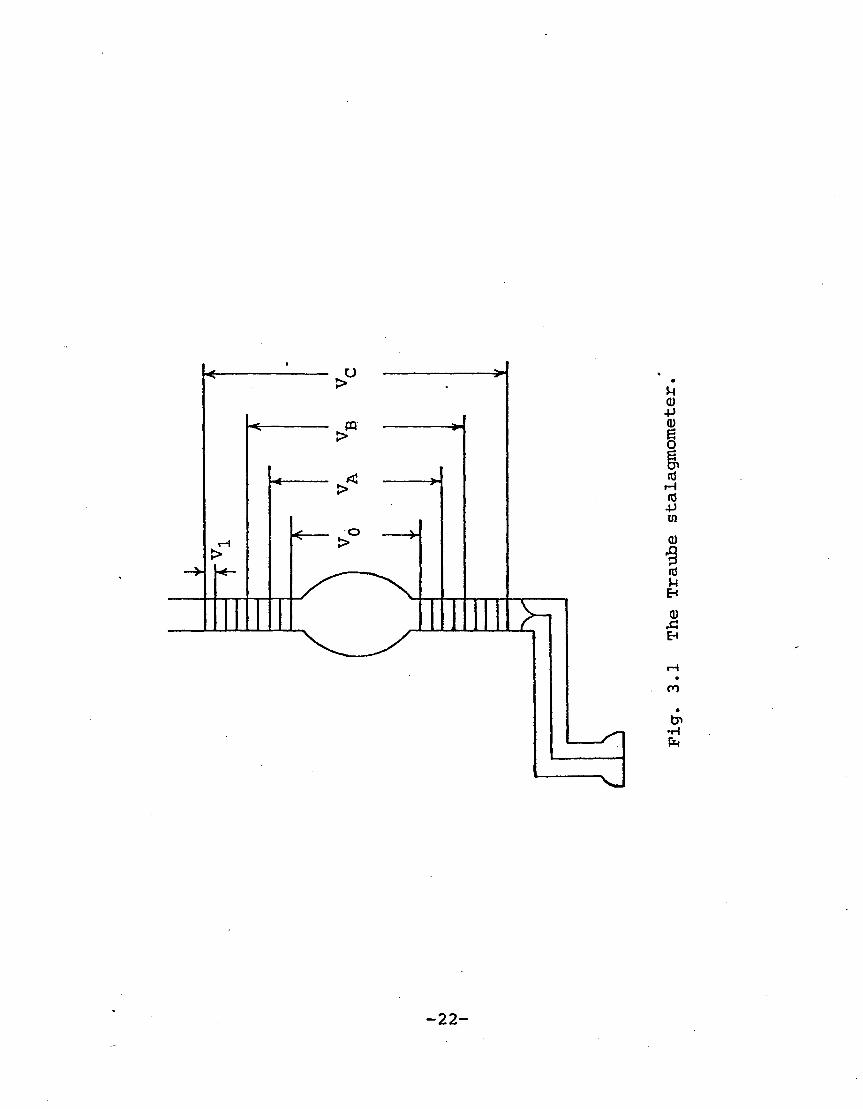
In order to calibrate the apparatus, the volume V
and V, was determined by weighing the volume of water, V_,
V_ and V_ (Fig. 3.1). The result is:
-21-
>
o
PQ
LFf
u •P
§
rH
•P CO
a)
m
•H En
-22-
Therefore,
VA = 4.2513 g/p (water)
VB = 4.4085 g/p (water)
Vc = 4.6987 g/p (water)
VQ = 4.1009 g/p (water)
V, = 0.03779 g/p (water)
3-3-4. Result
As for the interfacial tension of octane and fountain
solution, the time-dependence after contacting two liquids
was found by pre-experiment. Octane is insoluble in water;
however, octane dissolves some surfactant in the fountain
solution. Then, if this octane is used for a different
concentration of fountain solution, a different value of
interfacial tension will be obtained, compared with the value
by using fresh octane since this used octane contains a Urn
certain amount of surfactant depending on the concentration
of the previous fountain solution contacted. The volumes
of the phase 1 (fountain solution) and the phase 2 (octane)
were about 200 m£ and 75 mi, respectively. The measurement
of the interfacial tension of octane and water was done
first. This octane was used for the next measurement for
0.2% fountain solution. Then, this octane was used for
0.5% fountain solution and then up to 50% fountain solution.
These results are tabulated in Table 3.6 and compared with
theoretical values.
\ ■
-23-

C cd •P O O
0) Q)
-P <D
CO
o •H •P P iH O W
(0
o •H
CO CJ (U C •P-H
H -P id a
•H p u o rd m
fc a) •p +>
•H TJ
(d •P
a) g
•H H a) ft W
vo
n
<u rH .Q Cd
<d
H Cd CN O rH ^-»
•H ^~ CN -p 6 in CN r> CN r>- r^ CN a) a) ^ n 3 h> o VO VO r-i CN in CN OH £ in ■** CO CO CN rH rH a) (d .c > B
^ CN
CN g 00 C\ m CN CO r4 CO rH
>- h> CJ\ 00 in l> "* en O £ ■** ■<* ^ CO CN rH vH
r^ en r^ CO in r-i -* rH rH CN <tf "* 1-4 co vo VO VO VO vo VO <3«
p4 CM CN CN CN CN CN CN
o O o O o O O
S-. •sp O rH <# o VO VO 00 CO r-i <sr vo CN en
> en O CN r^ en en rH CO-** VO r^ r- r*- CO en CN
H o o O o o^ o rH
,_, CO co co CO vo r^ en en
CN g in in in r~ VO ** vo CL o en en en en o CN vo
1 ^. CN CN CN CN CO CO CO H 5 Q. o o o o o O o
ft O U *a
<D a 0
en CO vo r^ en in vo IH o •^J*. CN 00 CO rH CN o .—» rH o 00 CN x* r-i vo
&> CO CO CN CN rH rH o •p •—• .d O o o o O O o tn
•H o £
m o w
ft "SJ< in vo en O rH in • o rH rH rH r-i CO ^l« r^
o u 53 »a
w 0 U fe
i-t a ft -P e*> <*> g <d CN in df> <*> <*> <K> S3 & • • CN CO O o w o o CN in
-24-

The theoretical values of the interfacial tension were
calculated as follows:
*12 = Yl + Y2 - 2/yf Y2d (3.3)
There is only a dispersion force working between two liquids
where one of them is octane, as mentioned in Chapter 2-1.
However, it is provided that the dispersion component of
the fountain solutions is the same value as 21,8 mN/m
value for water. Some discussion on this problem will be
given in Chapter 4-2-2.
-25-
4. SAMPLE CHARACTERIZATION
In order to characterize solids in terms of surface
energetics, Zisman [24,25] and others [26-29] did intensive
work on the critical surface tension. However, to deal with
the critical surface tension is quite empirical, but not
theoretical. Several others [30-36] tried to determine the
surface tensions of solids and liquids which comprise the
dispersion component and non-dispersion component, and to
correlate experimental results with theory.
4-1. Dispersion Component and Non-Dispersion Component of Solids
4-1-1. Method
According to the theory of Fowkes, the work of ad-
hesion can be described as follows:
WA = WA + WAb + WA + C4-1)
when methylene iodide is used as the standard for deter-
mining the y values:
*CH2I2 = *CH2I2 "
50-8 mJ/m2 <4-2)
Since the work of adhesion of solids and methyleneiodide
comes only from the dispersion force, the values of Ys
have been established as follows from contact angle
-26-

measurements of CR^l? on s°U-ds<
WA " WA " YCH,I, <* + COS 9) " 2/YCH,I 4 <4'3)
2. 2. Z S
■ {T
CH2I2U
+ cos ft>}2/4T! Y
S = rcH,i,<i + c°s s->r/4YcH2i2 <4-4»
a-bromonaphthalene, which is also considered to have only
d 9 a dispersion component (y =44.6 mJ/m^) , was used to Li J
determine the values of y .
By contact angle measurements of water on solids, the
value of W^ + W^ - TT (this term is called the non-dis- A A e
persion interaction energy, IqWf in the case of water) can
be defined. From Equation (2.13):
wai> + WP-TT =1 =Y(1 + cos 6) - W (4.5) A A e SW i/ ; A l*. 3/
= YL(1 + cos 9) - 2AgY^ (4.6)
4-1-2. Image Area and Non-Image Area of Lithographic Plates
A sample was placed in a cell (rame-hart, inc), which
is made of metal and has two glass windows so that light
can penetrate through the cell. Sessile drops of a liquid
on the Image Area were formed with a pipette, and the cell
was sealed by the lid; the contact angle measurements were
made of both sides of each drop with a goniometer. The
size of the drops was more than 3 mm diameter to avoid
the effect [37] of the nonuniformity of the solid surface.
-27-
In the case of water drops, a small amount of water was
placed in the cell beforehand in order to avoid the evapo-
ration of water from water drops and ensure that the water
vapor pressure reached equilibrium as quickly as possible
after sealing. The average value was calculated by the
measurements of at least six drops,
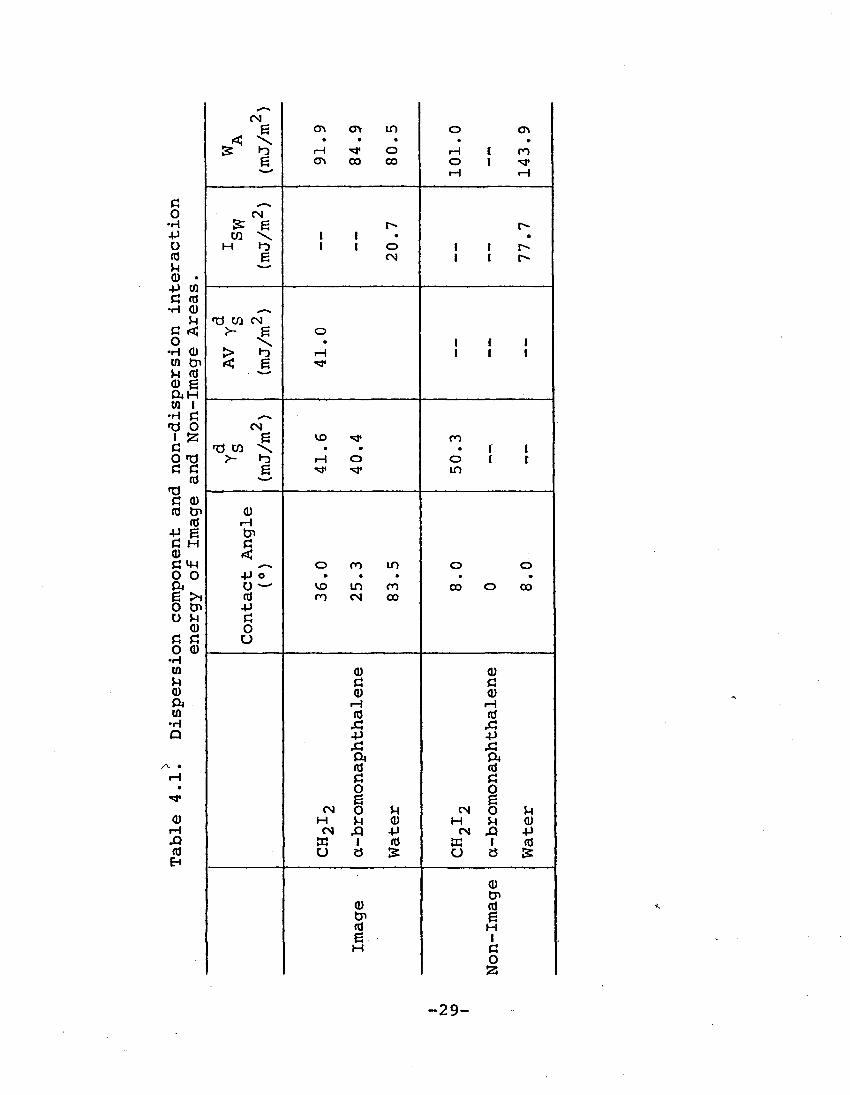
For Non-Image Area, the same procedure was used. The
results are tabulated in Table 4.1.
Sharpies [38] reported that the plastics whose surface
free energies are larger than 38 mJ/m2, adhere to the ink
well. The surface free energy of the Image Area is also
o d larger than 38 mJ/mz. The experimental value of Y_ of the
Non-Image Area, AI2O3, seems small compared with those of
other metal oxides determined from gas adsorption [39] . \
Kaelble [5] reported that the value of YC of News-paper
plate (pre-sensitized 3M Type "S") was 25.5 mJ/m''. This
value is much smaller than the value obtained in this study.
The contact angle of methylene iodide and a-bromonaphthalene
on the Non-Image Area was also measured in water; the dis-
persion energy was 47.0 mJ/m2 and the non-dispersion inter- 2
action energy with water was 109,0 mJ/m , Judging from
these results, the value of y^ of anodized Al203 may be
about 50 mJ/m2. The wetting properties of the Non-Image
Area with respect to the contact angle and dye adsorption
capacity have been dealt with by Severn [40]. However, he
did not explain it in terms of surface energetics.
-28-
r-
,_^ CN
g CT> <Ti to o <T*
K/S ^ • • • • »
S «2 rH ■<* O H 1 ro £ (Tl 00 00 O 1 ■^
rH rH
CJ o CN •H ^ e r^ r^ +J to \ I 1 • • O H »"D | 1 o 1 1 r^ fd £ C\) 1 1 i^ U
C (d •H 0 . .
U <X3 CO CN G < J- 6 O O \ • 1 r I -H (D > h> iH 1 i 1 to tr> < g, •<* Vt <d <D g CUH W 1
•H G ^^ 'd o <N
1 ^ e V© ^ CO c TJ CO \ • • • r 1 o fd >- *s rH o o i t C G £ •^ ■># in
(d 13
<d en a fd rH
+> e tn fi H C <D •< CJ *H O ro in o o 0 0 -P o • • • • • a O — «JD IT) n CO o 00 e >i rd CO CN CO O tn -P O H G
<D o fi C u 0 <u
•H (0 <D <D fc a C Q) 0) <D & rH rH 10 cd (d
■H si A Q •P
a, -p
ft V • rd (d rH G C • o o vf 6 e
CN o H eg o u (D H rH O H M <D rH CN XI •P CM X} •P & s 1 flj w 1 fd
EH o a & O 3 5
<D CP
<D (d u> g (d H g 1 H
o 53
-29-

4-1-3. Photo-Oxidized Polystyrene Films
The same procedure was used for the surface energetic
characterization of the photo-oxidized polystyrene films.
The values of yq were determined by only methylene iodide.
The results are summarized in Table 4.2.
Table 4.2. Surface energetic characterization of photo-oxidized polystyrene films.
Sample d YS •W WA
mJ/m2 mJ/m mJ/m
0-3 48.3 9.0 73.9
30-3 45.5 16.4 79.4
50-3 47.5 23.7 88.1
100-3 45.0 40.6 103.2
150-3 44.6 69.1 131.4 ,
200-3 43.8 71.4 133.2
0-4 47.0 12.1 76.1
30-4 47.0 20.9 84.9
50-4 46.9 28.3 92.3
100-4 46.6 47.6 111.4
150-4 44.2 66.6 128.7
200-4 43.9 71.8 133.7
The first number of the sample stands for the number of
passes under the UV lamp and the second for the lot number
-30-
of the sample.
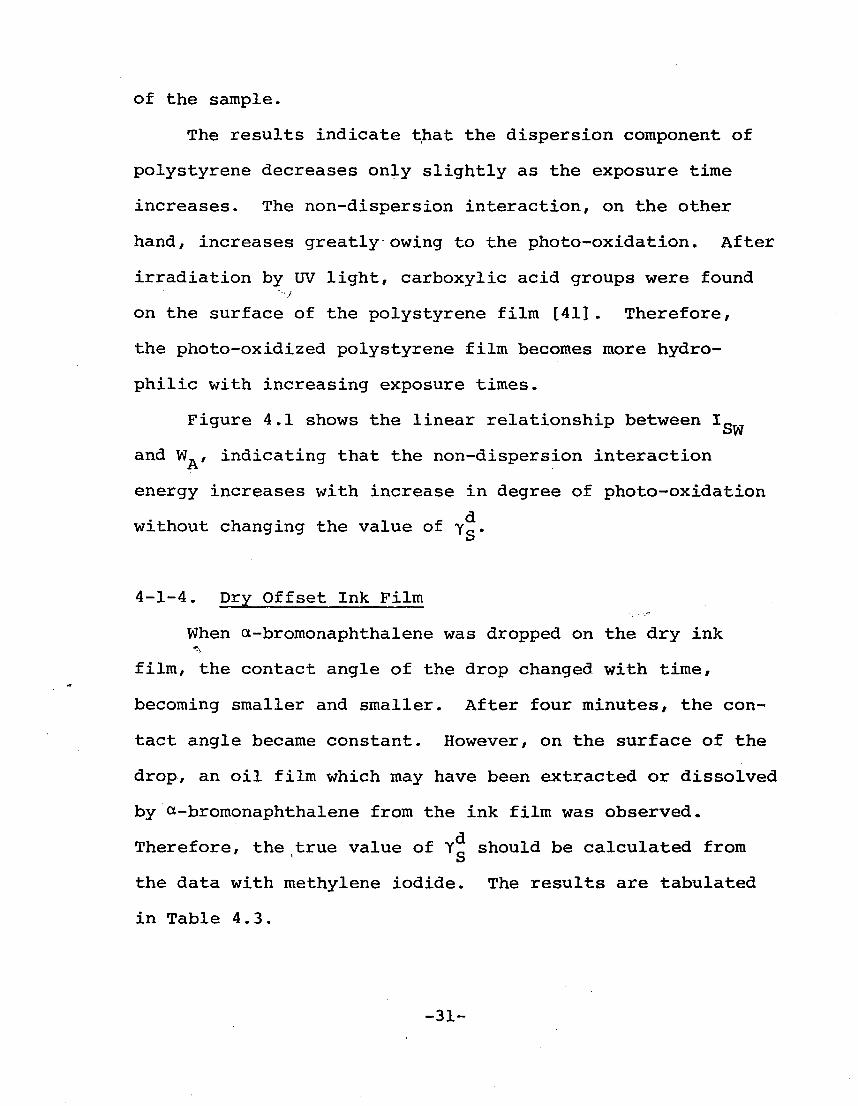
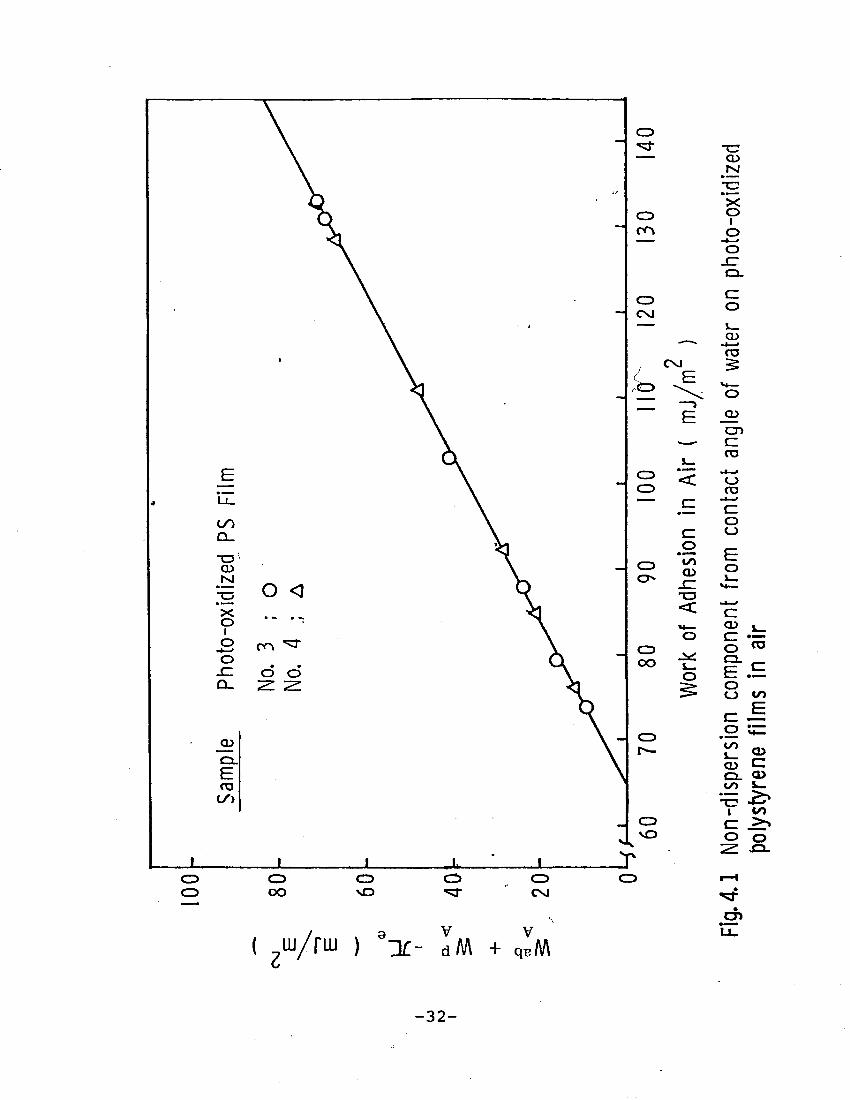
The results indicate that the dispersion component of
polystyrene decreases only slightly as the exposure time
increases. The non-dispersion interaction, on the other
hand, increases greatly owing to the photo-oxidation. After
irradiation by UV light, carboxylic acid groups were found
on the surface of the polystyrene film [41] . Therefore,
the photo-oxidized polystyrene film becomes more hydro-
philic with increasing exposure times.
Figure 4.1 shows the linear relationship between Ig
and WA, indicating that the non-dispersion interaction
energy increases with increase in degree of photo-oxidation
without changing the value of y„.
4-1-4. Dry Offset Ink Film
When ot-bromonaphthalene was dropped on the dry ink
film, the contact angle of the drop changed with time,
becoming smaller and smaller. After four minutes, the con-
tact angle became constant. However, on the surface of the
drop, an oil film which may have been extracted or dissolved
by ot-bromonaphthalene from the ink film was observed.
Therefore, the true value of Yc should be calculated from
the data with methylene iodide. The results are tabulated
in Table 4.3.
-31-
C\J
E ™
CD
X o _o "o sz o. cz o
CD
<T3
O
CD cz CO
< o ro cz cz
o c o o
CD E o
< M— o
cz
o ro
E .E o o t/»
"to _.
CD C Q_ CD
cz >* o o
( uj/rw > ^ V
+ v
quM
-32-

;
Table 4.3. Surface energetic characterization of dry ink film.
Contact Angle d
YS ■""SW WA
e,° mJ/m2 mJ/m2 mJ/m2
CH2I2 58.1 29.7 — 77.6
a-bromo 8.0 44.2 — 88.8
Water 105.6 — 2.0 52.9
4-2. Dispersion Component of Liquids
In order to define the values of the dispersion compo-
nent of the fountain solutions, two standard solids were
chosen, paraffin wax and polyethylene, which have mainly
the dispersion component.
4-2-1. Characterization of Paraffin Wax and Polyethylene
The dispersion component and the non-dispersion inter-
action energy of these two solids were deterjaiaesL iy the" 'V
same method described in Chapter 4-1-1.
Paraffin wax films were prepared by dipping a cleaned
aluminum plate into the hot melted paraffin wax and cooling
it at room temperature. For the polyethylene film, poly-
ethylene was dissolved in toluene at 85°C in 8% concentra-
tion. Cleaned aluminum plates (3.3x2 cm2) were dipped into
the solution and dried in a vacuum dryer for two and one
-33-

half hours at room temperature. After drying, the plates
were kept in a dark box.
The results are tabulated in Table 4.4.
Table 4.4. Dispersion component and non-dispersion interaction energy of paraffin wax
and polyethylene.
CH2I2
e,°
Water yt mJ/m2
Jsw mJ/m2
WA
mJ/m2
Paraffin Wax
Polyethylene
66.9
62.4
109.3
107.5
24.6
27.2
2.1
1.9
48.4
50.6
Although the non-dispersion interaction energies, ICrTf be- t>W
tween the solids and water are quite small, they exist.
4-2-2. Dispersion Component of the Fountain Solutions
The dispersion component of the fountain solutions
(Lot NO. 1) was determined by using paraffin wax as a model
solid. For the fountain solution (Lot NO. 2), polyethylene
was used for this experiment. The results are summarized
in Tables 4.5 and 4.6. The values of yT were calculated
assuming that there is no non-dispersion interaction be-
tween the solids and the fountain solutions. The average
values of yT were determined from Fig. 4.2.
Judging from these results, it seems that the dis-
persion component of the fountain solutions increases with
increasing concentration. However, negative values of the
. -34-
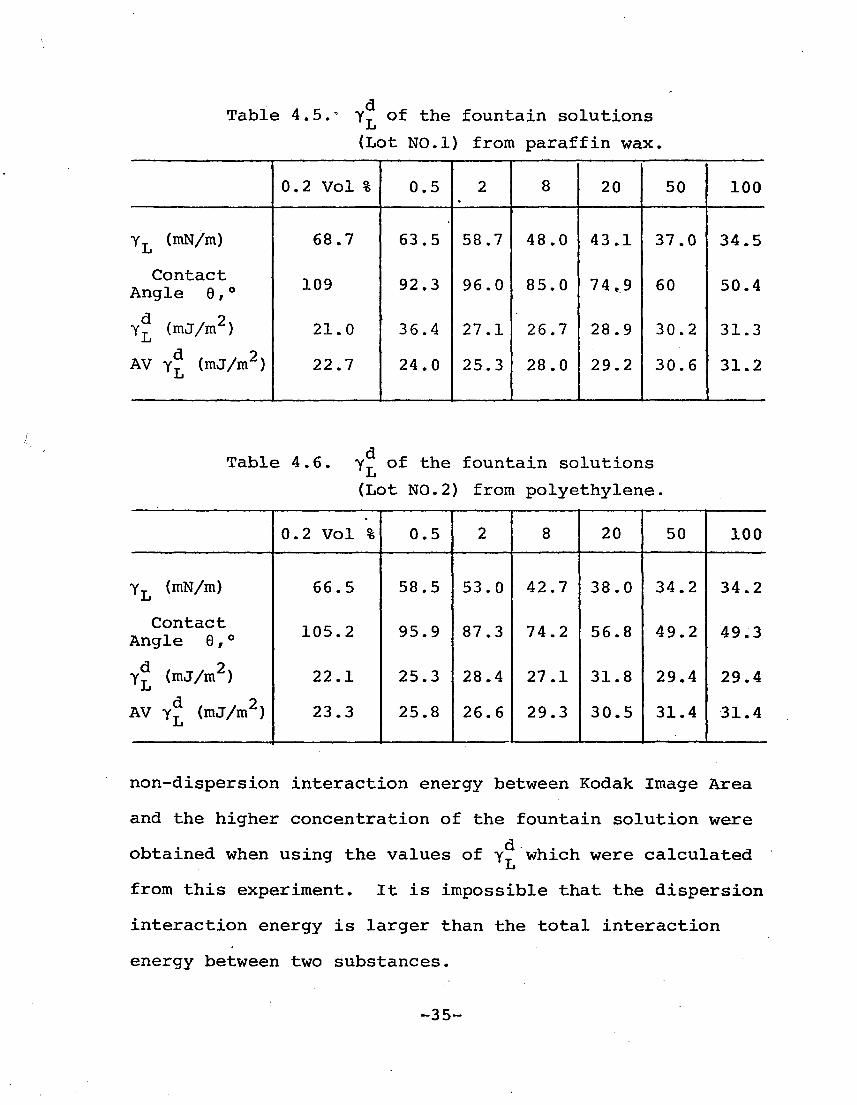
Table 4.5.* yT of the fountain solutions
(Lot N0.1) from paraffin wax.
0.2 Vol % 0.5 2 *
8 20 50 100
YL (mN/m) 68.7 63.5 58.7 48.0 43.1 37.0 34.5
Contact Angle 0,° 109 92.3 96.0 85.0 74,9 60 50.4
3 / -r / 2X YL (mj/m ) 21.0 36.4 27.1 26.7 28.9 30.2 31.3
AV YL (mJ/m2) 22.7 24.0 25.3 28.0 29.2 30.6 31.2
Table 4.6. YT °f tne fountain solutions
Li
(Lot NO. 2) froir i polyethylene.
0.2 Vol % 0.5 2 8 20 50 100
YL (mN/m) 66.5 58.5 53.0 42.7 38.0 34.2 34.2
Contact Angle 8,° 105.2 95.9 87.3 74.2 56.8 49.2 49.3
Y£ (mj/m2) 22.1 25.3 28.4 27.1 31.8 29.4 29.4
AV YL (mJ/m2) 23.3 25.8 26.6 29.3 30.5 31.4 31.4
non-dispersion interaction energy between Kodak Image Area
and the higher concentration of the fountain solution were
obtained when using the values of YT which were calculated Li
from this experiment. It is impossible that the dispersion
interaction energy is larger than the total interaction
energy between two substances.
-35-

80 CVI
- 60 CD c o £ o o >-, en i_ CD
CD O CO
M— S—
40
20
0
Total Surface Energy,
Non-dispersion Surface E
Dispersion Surfa Energy
0 20 40 60
Surface Tension ( ml\l/m )
Fig.4.2 Dispersion force component of fountain solution from contact angle on Paraffin and Polyethylene Paraffin ; o Polyethylene ; A
80
-36-

Table 4,7 shows the calculated values of I0 __ from b.ilb
the contact angle measurement of the fountain solution (Lot
NO. 1) on Kodak Image Area in air. The values of average
YT were used for this calculation.
Table 4.7. Non-dispersion interaction energy, Ic „c,
calculated by using average Yps»
0.2 Vol % 0.5 20 50 100
JS.FS (mJ/m2) 18.8 21.8 22.1 9.6 3.7 -4.0 -6.7
These negative values obtained are probably the result,
not only of disregarding the non-dispersion component of
paraffin wax or polyethylene, but also the adsorption of
surfactants or gum arabic in the fountain solution on the
solids. Therefore, the values of y„c calculated from these
experiments are apparent values. Since the fountain solu-
tion consists of several chemicals, the dispersion component
of the fountain solution cannot be defined by measuring
contact angle of the fountain solution on paraffin wax or
polyethylene. However, the value of the dispersion compo-
nent of the fountain solutions may be defined as the same
value as that of water, 21.8 mJ/m . This value may not be
far from the true value. Therefore, this value, 21.8 mJ/m2,
was used as the dispersion component of the fountain
solutions for surface energetic calculations.
-37-
5. - CONTACT ANGLE MEASUREMENT
Two methods of contact angle measurement besides in
air were carried out to determine the interaction energy
between solids and liquids. One method is to measure the
contact angles of liquids such as water and the fountain
solutions in octane medium. The other method is to measure
the contact angle of octane in a liquid media such as water
or the fountain solutions. In the latter case, an octane
drop was applied, on the solid using a syringe with a
hooked needle.
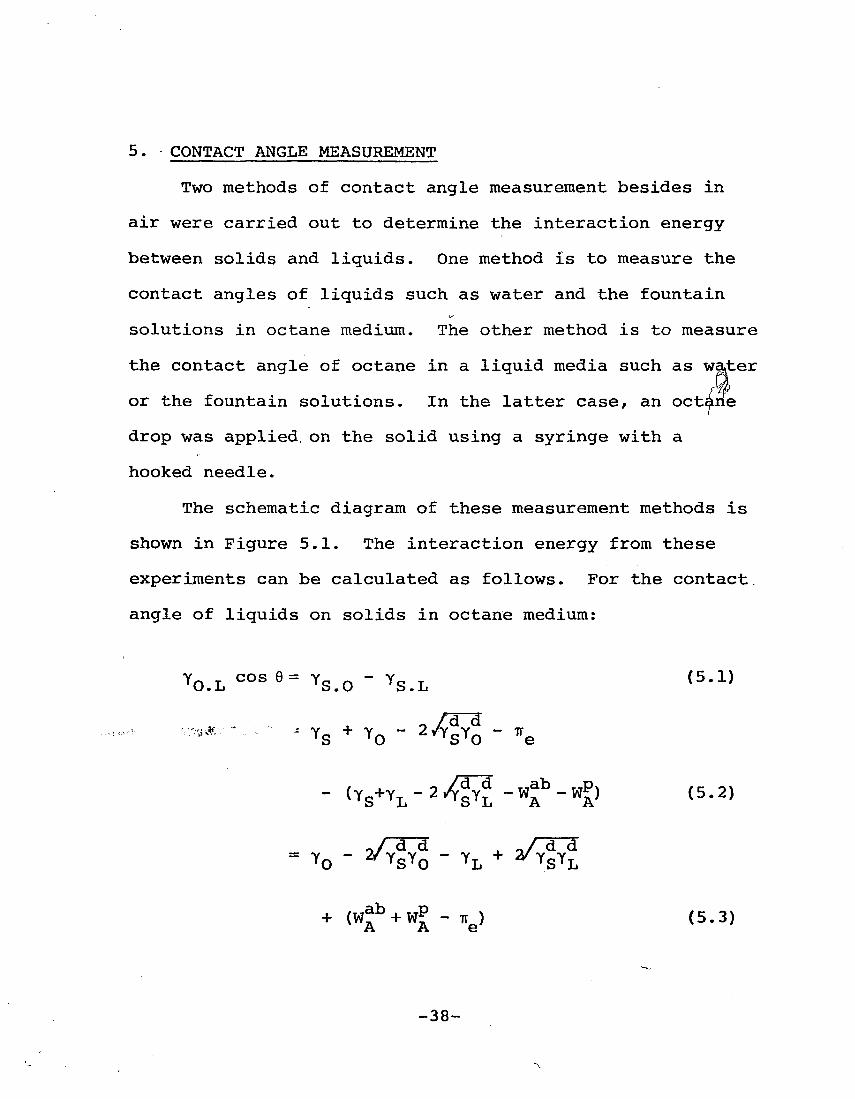
The schematic diagram of these measurement methods is
shown in Figure 5.1. The interaction energy from these
experiments can be calculated as follows. For the contact
angle of liquids on solids in octane medium:
Y0.L COs9= YS.0 " YS.L (5-1)
»,«•■ * -= Yo + Y~ ~ 2/YCY_ - IT S'O
- <VYL-2^-*f-Wj) (5.2)
Y0 ~ 2/ySY0 " YL + VWL
+ (W^b + wP - 7re) (5.3)
-38-

octane
A aqueous liquid
777/7777777- solid Y S.L Y S.O
<LF solid
octane
th aqueous media
O.L
Fig. 5.1 Schematic diagram of contact angle measurement in both water and octane phases.
-39-
\

^O-2-^- *L + 2l/V^+IS.L (5"4>
where
Y0 L = the interfacial energy between octane and the liquid
Y_ n = the interfacial energy between octane b,u and the solid
Yq j = the interfacial energy between the solid and the liquid
I_ L = the non-dispersion interaction energy between the solid and the liquid
7T = the film pressure due to the adsorption of water vapor in air
TX should be considered when the solid has a high surface
energy. The effect of water vapor adsorption in air con-
tributes to the non-dispersion interaction energy even if
the solid is immersed in octane. The work of adhesion can
also be calculated as follows:
WA = Y0.L + ^S.O " YS.L (5'5)
= Y0 L (1 + cos 6) + ire (5.6)
For the contact angle of octane on solids in liquid media:
y0Jj cos 6 = YS.L - YS.0 (5.7)
. 0 /d d r-rS't) TTP = YS + YL-2/YsYL - WA -WP
o /d~d - <Ys+Y0-2/YsY0 " V (5.8)
-40-
0 /d~~d , 0 /d~d YL ~ 2/VL " Yo + 2/¥o
- (W^b + WP - TTe) (5.9)
/d~d ^ 0 /d; d /Y^Y, - Y~ + 2/Y " ^L-^VL^O^VO-^L (5'10)
WA = YS.L + YO.L " YS.O (5-i:L)
= Y^ T (1 + cos 9) + TT (5.12) 'O.L e
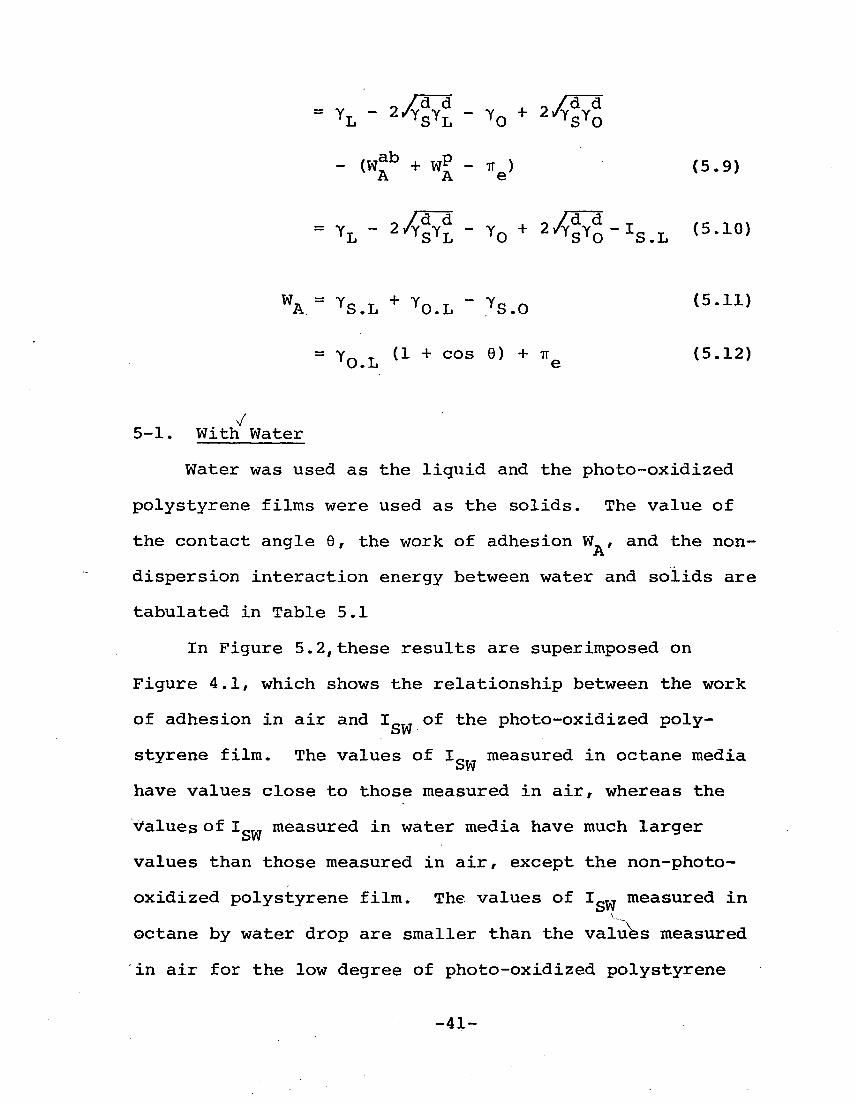
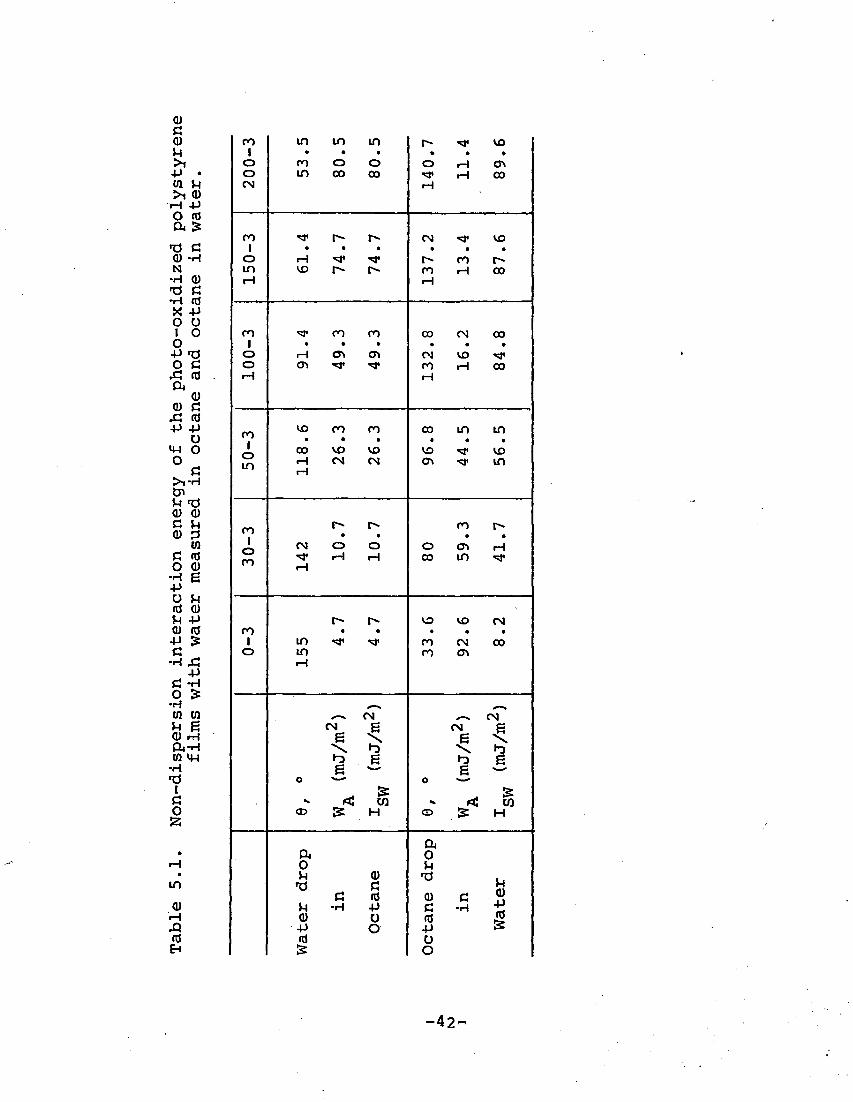
5-1. With Water
Water was used as the liquid and the photo-oxidized
polystyrene films were used as the solids. The value of
the contact angle 9, the work of adhesion W , and the non-
dispersion interaction energy between water and solids are
tabulated in Table 5.1
In Figure 5.2, these results are superimposed on
Figure 4.1, which shows the relationship between the work
of adhesion in air and I of the photo-oxidized poly-
styrene film. The values of l_, measured in octane media Sw
have values close to those measured in air, whereas the
Values of I measured in water media have much larger
values than those measured in air, except the non-photo-
oxidized polystyrene film. The values of Igw measured in
octane by water drop are smaller than the values measured
in air for the low degree of photo-oxidized polystyrene
-41-
Q) C Q) U >i -P • 01 *H >i Q) M -p O (0 P4 S
»o G o -H N •H <D -0 C -rl nJ X -P o o 1 0 o •P «o o C
XJ (0 cu
<D <D C x: f0 -P -P
O m O o
c >i-H Cn U T3 (1) <D C J4 QJ 3
to C (0 O a)
■H e ■P O u (d a) JH •P <D « -P £ c -HX:
-P c: -H o £ •H 01 to U £ <U rr| &-H co m
•H 13 I a o s
in
a> H
EH
1 O
in in m r~ "<* VO
ro o o o rH Crt O in CO CO ^ f~\ CO CN rH
ro ■
-tf r- r^ CM tr VD
o rH •** ^ r> ro r> IT) V£> r- r-~ ro rH CO rH rH
ro 1 o
^r co ro CO CM CO
H o> en CM VO •^ o CJ1 •** <* ro H CO rH rH
n <£> en ro CO in in
I o m
• • • • • • 00 vo 10 \o ■^ vo H CM CM C\ •*r in
co r~ r- ro r- 1
o ro
• • • • CM o o o en H
rH r-i H CO in ■^r
r- t>- vo KO CM co
1 in •<* <tf ro CM CO o in
rH ro en
*—* ^—% ^~» CM ^^ CN
(N g CM g e \ g S. \ ^ \ •o •2 ^ rD ^g g ^
o w &
o & ^ »< CO ^ < CO
CD & H o .as H
& a 0 0 •n u <D -d
'O C >H (U •P cd
C <tf a) c u •H ■P c -H (0 O tf -p O ■p (d o & o
-42-

>§OOD
CD CD CZ i_ r~ 1—
"co
CO
o
CD
CD
"ca
CO
o o
CD
CO
CZ cz c CZ CZ CZ
. i_ i^_ co CO Q_ D_
CD CD CD CD CO CO
E E i CZ o
m
CZ S— CD CO CD
*4-_' 1 a 111*
r~» o CO
E o ^
CO CZ c. I/) •— • ■>—.
CD
CD
CD CVJ
CD E
S <
CZ5 CZ
"to CD
< CZ) CO »,_
o
i_ o
CD
CO
O
CO jo "o CO
CD
CO
VI o CD
CD CZ ca
CO
o o E o
CZ o "o — CO CD V_ CD
c =- — E CZ O CD '^ cz
CO
CO CO
CD NO
X CD CD
CD OO
CD vO
( ^/rw ) V
CD ^3-
M
CD CVi
V
CD 0
V o CZ -o o CZ Z CO
CM
CD
-43-

films; however, Igw increases and becomes larger than the
values in air for higher degrees of photo-oxidation of the
polystyrene films. The difference between these two values
of I for the latter case may be explained by the IT
effect. The values of I_ from the octane drop on the poly-
styrene film in water media increase strongly from almost
the same value as in air up to 90 mj/m • Since these values
are calculated from advancing contact angles of octane, i.e.,
receding angles of water, the values are larger than those
obtained in air in most cases. This phenomenon indicates
that the octane drop behaves on the polystyrene films as if
the polystyrene films had large values of Iq„ compared with
those measured in air or octane media. Therefore, as
Hamilton [42,43] suggested that the hydrophilicity of a
solid can be characterized by this method, the value of
Iq is quite sensitive to hydrophilicity of the solid,
especially in the region where the solid has a small value
of the non-dispersion component.
The same procedure was used for Ima^e Area and Non-
Image Area. The results are tabulated in Table 5.2 and
compared with the values obtained in air.
In the case of Image Area, the value of Ig in octane
media was almost equal to the value in air. On the other
hand, the value of I__7 in octane for the Non-Image Area
is much larger than that in air. These values are also
shown in Figure 5.2. This difference in I_w of the
r- -44-

ti G (d
cu n Di CU id •p e (d H £ in G o •H
s^d tr> G ^ td o G cu 0 G
td G -P o o
-H O •p o G td •H U o CO -P id G cu
•H u <
G O o •H Cn 0) td M £ CD H ft l 10 G
•H 0 13 3
1 G o z
• CM
• in
<D iH A td EH
Non-Image
in air
•
cu tn td e H
1 G O
32.3
93.2
93.2
175 0.19
100.8
Image in
air
« o CM
0)
td e 1
23.9
22.3
22.3
105.8
36.7
64.3
^ CM CM g
a s O —'
•* r< CO CD & H
^-s CM CM g
a & IS
- < CO CD ^ M
Water drop
in
Octane
Octane drop
in
Water
-45-

Non-Image Area can be explained by the change in the u
value. In the case of the octane media, the value of IT is e
relatively small since the sample was immediately immersed
in octane after removal from the desiccator. On the other
hand, the value of TT in air is relatively large since the
cell was sealed after making a sessile drop on it. By
exposing water vapor in the sealed cell for more than ten
minutes before the sessile drops of water were formed on
the Non-Image Area in octane media, the value of I_ up to
54.6 mJ/mz (AV 0 = 73.8°; water drops in octane media) was
observed. Therefore, the increase in the IT value due to e
water vapor exposure is 38.6 mj/m compared with the value
without water vapor exposure provided that the value of y
of the sample exposed by water vapor had not been changed.
5-2. With Fountain Solution
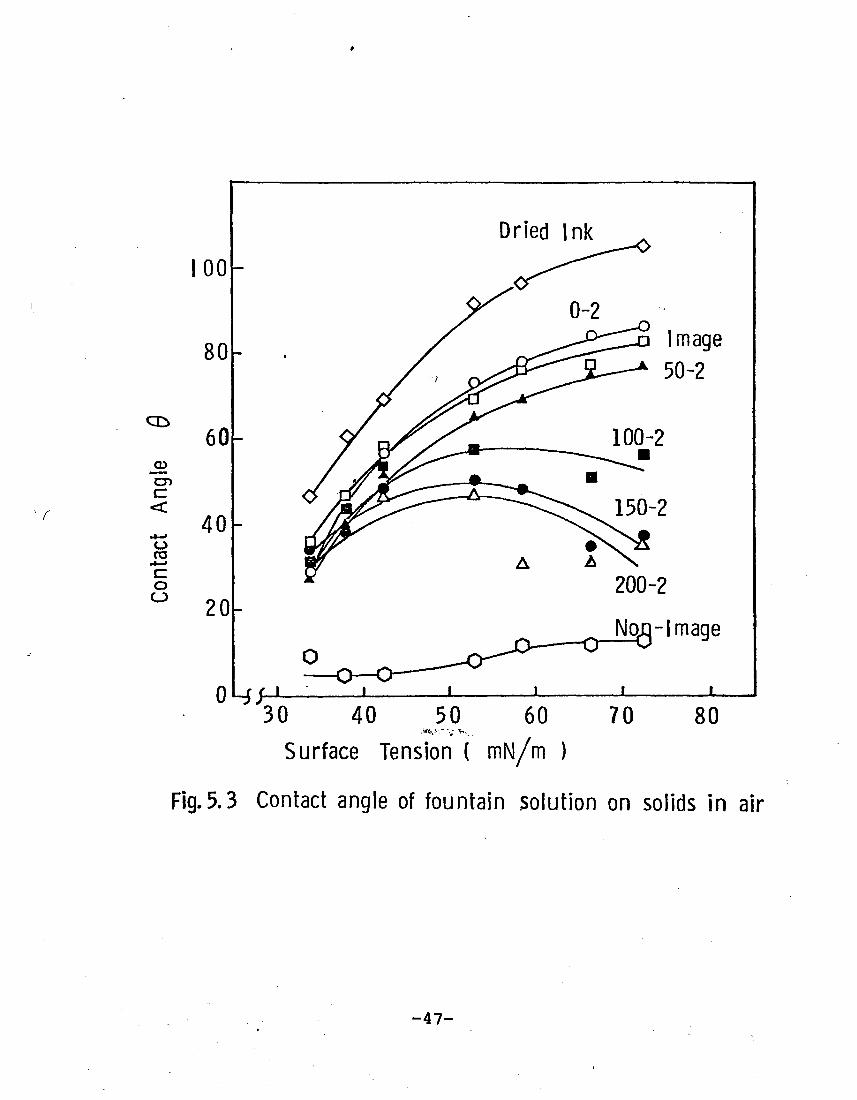
5-2-1. In Air /
The sessile drop of the fountain solution was formed
on solids (the photo-oxidized polystyrene films, Image
Area, Non-Image Area, and dry offset ink film) in air.
The results are shown in Figure 5.3. An interesting
observation can be seen. When a solid is highly hydro-
phobic, the contact angle decreases as the surface tension
of the fountain solution decreases. However, if a solid
has a relatively large non-dispersion component except the
Non-Image Area, the contact angle tends to increase to a
-46-
Q^
CD
CD c
o
o O
30 40 50 60 70 80
Surface Tension ( mN/m )
Fig.5.3 Contact angle of fountain solution on solids in air
-47-

maximum and decrease again. In the case of the Non-Image
Area, the contact angle tends to decrease moderately with a
decrease in the surface tension. As the surface tension of
the fountain solution decreases, the contact angles tend to
converge regardless of degree of hydrophilicity of solids.
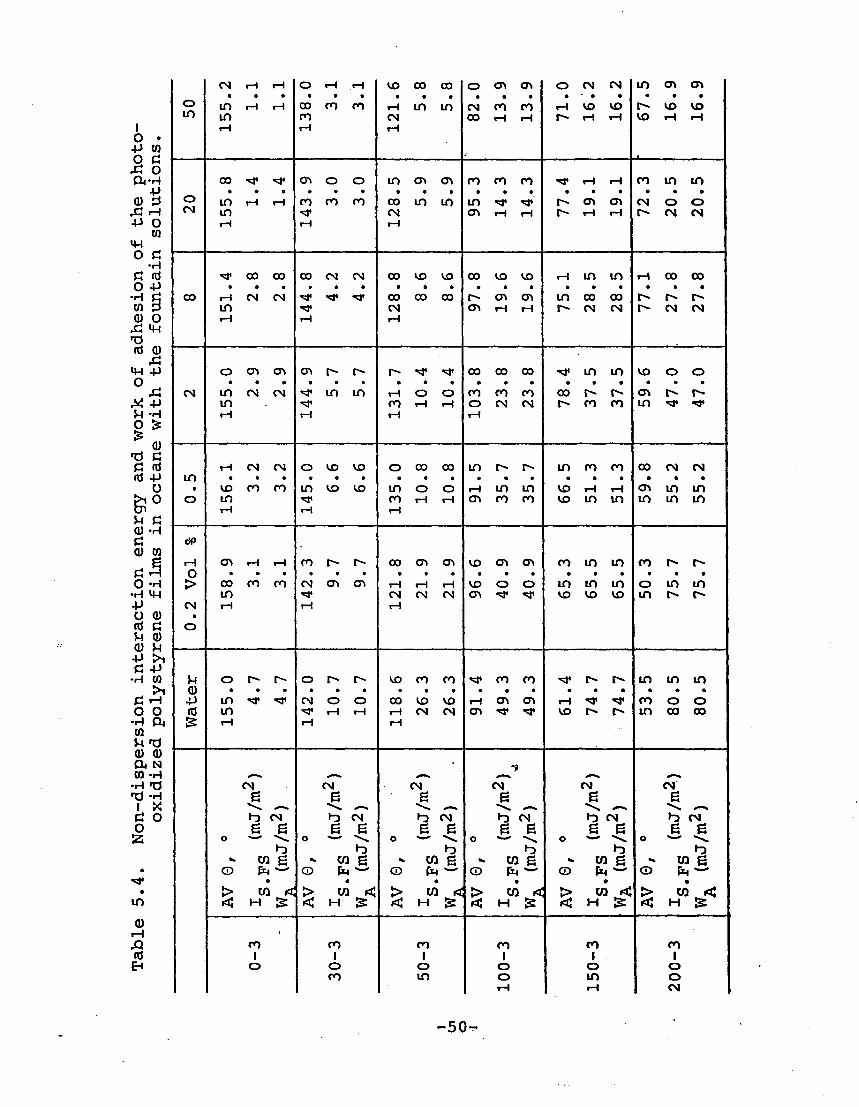
5-2-2. In Octane
The average contact angle 8, I_ „_ and the work of'
adhesion for the Image Area and Non-Image Area are tabulated
in Table 5.3 and for the photo-oxidized polystyrene films in
Table 5.4. For Tables 5.3 and 5.4 the calculated inter-
facial tensions between octane and the fountain solutions
from the theoretical equation were used.
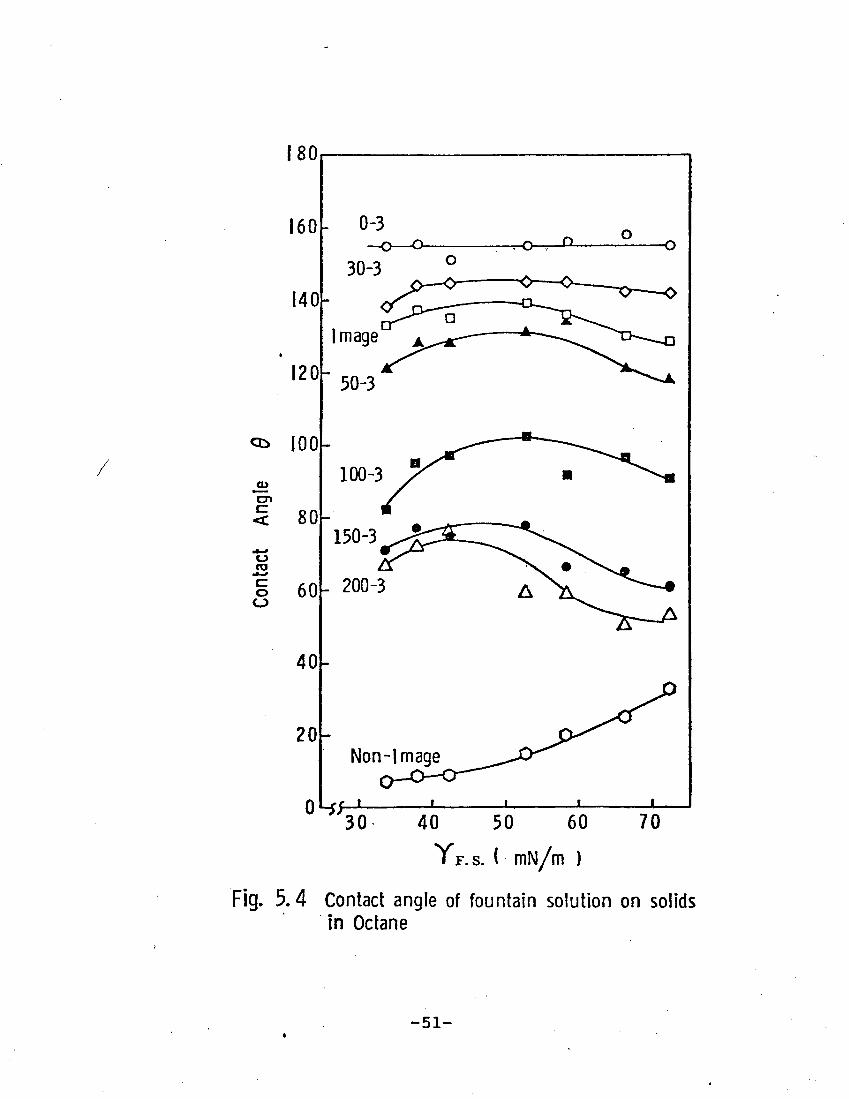
Figure 5.4 shows the change in contact angle as a
function of the surface tension of the fountain solution.
For the photo-oxidized polystyrene film composed mainly of
the dispersion component, the contact angle was almost con-
stant or slightly increased as the surface tension decreased.
For solids with a high non-dispersion component except the
Non-Image Area, the contact angle increased first and then
decreased. This trend is similar to that obtained in air
with the fountain solution for the highly photo-oxidized
polystyrene film. For the Non-Image Area, the contact
angle constantly decreased as the surface tension of the
fountain solution decreased. The behavior of the Non-Image
Area and the highly photq-oxidized polystyrene films for
-48-

<D t^ (d e • H 05
c »H O O -H
+> C 3 O H
•H 0 W CO Q)
XJ C «d -H (d td
•P m c o 0
o A: IH M O 0) £.c
■p *d G.C td +>
•H
&* M Q) CD C G fd CD +J
o C O
2« o w fd (d H <D o n +»<: c •H CJ
fr C td o e
•H H (0 1 U G CD O ASS to
•H T3 ■d c
i «d G o 53
• CO
in
0 rH .Q (d H
en a\ <T> rH r- r^
o en en en r^ <• ^ m en
rH CM CM
vo CM CM en CM CM
o r>- •^ ** a\ CM CM CM m
rH en en
•«* en en CM in in
CO 134.
vo VO o\ rH •>*
rH
r^ *# ■^ rH in in
cr» r^ r~ -a* rH rH CM m
rH rH vo vo
m CM CM O CM CM in
• vo o o O rH rH o m
rH rH rH CM r> r--
dP
iH CM CTl a\ cr> CM CM
O > O in m «tf m in
m rH rH CM 00 CO CM rH
O >-
5-1 CD
00 <Ti en en CM CM
00 00 CO CM en en cd CM rH rH en <T> m & rH
^ CM CM
6 g ^ *«•* """"^V *—* »o CM fo CM £ .6 ^ ,6
o ^
0 r?
w CO £ w CO ,6 CD fa
• CD fa
• > CO < > CO
►.** < H 3= < H
O CT> (d 6
(1) H tP 1 (d c g 0 H 53
-49-
I o •P O ,a
CD
■P
m o
o •H
CO CD A fd
«W O
M U O
•d
rd
&
(I) -H
0) CO
«3 O-H
•H m •p
CO a o
■H •P
rH O CO
•H rd -P f4
O m
a)
■p
A ■p •H &
CD
fd •P O o
o fd u CD •p C
•H
O •H
CO H CD
CD
CD M >i •P CO >1
rH O ft
*a CD
CU N to
•H ^d
I
o
H
•H
O
m CD
rH ,Q fd
CN rH rH o rH rH VO 00 00 o en en o CN CM in a\ en
o in rH rH 00 CO CO rH in in CM co co rH VO VO r- VO VO in in
rH CO rH
CM rH
CO rH rH r~» rH rH vo
•
rH rH
00 •«* -* Cn O O in en <T» co CO co rr rH rH CO in in
o in rH rH CO CO CO 00 in in in ■** ** r~ en en CM o o CN m
rH rH CM rH
en rH rH r>- rH rH r^ CM CM
»* CO CO 00 CM CN 00 VO VD 00 VO VO rH in in rH CO 00
00 rH CN CM ■■# "* •*J« 00 00 00 r- en en m CO 00 r^ r^ r-» in ■sr CM Cn rH rH r^ CM CM r- CM CM rH rH rH
O Ch <S\ CT> r- r- r- •^ ^* 00 CO CO ^j» in in vo o o
CM in CN CM •<* in m rH o o co CO co CO t^ r- en r^ r^ in -* CO rH rH o CM CM r- co co m •* rr rH rH rH rH
rH CN CM O VD VO O 00 00 in r^ r» m co CO 00 CM CM in
• VO CO CO in VO VD in O o rH in in VO tH rH en m in o in
rH rH CO rH
rH rH <T> co co VO in in in in in
<x>
rH CX> rH rH CO r- r- 00 CT» en VO en en co in in CO r^ r» o > 00 CO CO CM en en rH rH rH VO o o in in in o in m
in "tf CM CM CM en •** "tf VO VO VO in r*» r- CM rH rH rH
O
u O r- r- O r-» r^ VO CO CO *& CO co ■<* r» r^ in in in CD
■P in •«* "^ CN o o 00 VO VO rH en en rH ■^p ^r CO o o rd in •>* rH rH rH CN CM en •«*• ^r VO t^ r- in 00 00 & rH rH rH
• i *—* ^—* ^^ ^^H «—* CM CM CM CM CM CM
g g 6 g e g "V, .-» ^ *—* ■^ «*^ *—* ^s «M^ \ ^■^
fO CM io CM h> CM h> CM ^ CM ^ CM g g g g g g g 6 g g g g
o •^
o w O w hi
o h)
o w o
•» w g ^ w g «h w g *» CO g ^ CO g ^ CO g © En — © |X4 *"■"' © Jx, **"' © fc >~' CD fe-- © h'-'
• « « • * 1
> CO < > CO ► •< J> M ^ > CO < > CO < > CO <
< H & < H & "U H & < H & < H & < H &
CO CO CO co CO CO 1 1 1 1 1 1 o O
CO O in
o o rH
O in rH
o o CM
-50-r
180
160
140
120
<c> 100
CD
cn c: <
o CO
o o
40-
20 Non-Image
Ohtf-* 30 40 50 60 70
YF. S. ( mN/m )
Fig. 5.4 Contact angle of fountain solution on solids in Octane
-51-
this experiment is quite different even though they are
both hydrophilic. The reason for this is unknown; however, v
it may be the difference in their nature, the Non-Image
Area (Al^Oo) being basic, and the photo-oxidized polystyrene
film being acidic. Therefore, the acid-base interaction
between the acidic fountain solution and the basic Non-Image
Area is greater than that between the acidic fountain solu-
tion and the acidic photo-oxidized polystyrene film. The
fact that the photo-oxidized polystyrene films and the Image
Area are acidic has been proven by dyeing with Nile plue or
Methyl Violet. The color of the polystyrene films and Image
Area which were dyed by Nile Blue was reddish-blue and the
density of color of the films increased with the degree of
photo-oxidation. However, Tetrabromophenolphthalein Ethyl
Ester for basic sites could not dye the Image Area or poly-
styrene films. This indicates that only acidic sites exist
in the photo-oxidized polystyrene films and the Image Area.
Figure 5.5 shows the work of adhesion and I_ pg as
a function of the surface tension. In this case, the work
of adhesion has the same value as I„ „„. The work of ad- fa . £ o
hesion as well as I0 _„ decreased constantly as the surface
tension decreased. However, this decrease is mainly due
to the decrease in the interfacial tension between octane
and the fountain solution.
-52-

CV!
40 50 60
YF.S. ( mN/m )
Fig. 5.5 Work of adhesion and non-dispersion interaction energy of fountain solution on solids in Octane
-53-

5-2-3. In Fountain Solution
A sample was immersed in the fountain solution, and an
octane drop was released from a syringe with a hooked needle
to deposit on the inverted sample surface, one minute and
five minutes after immersion.
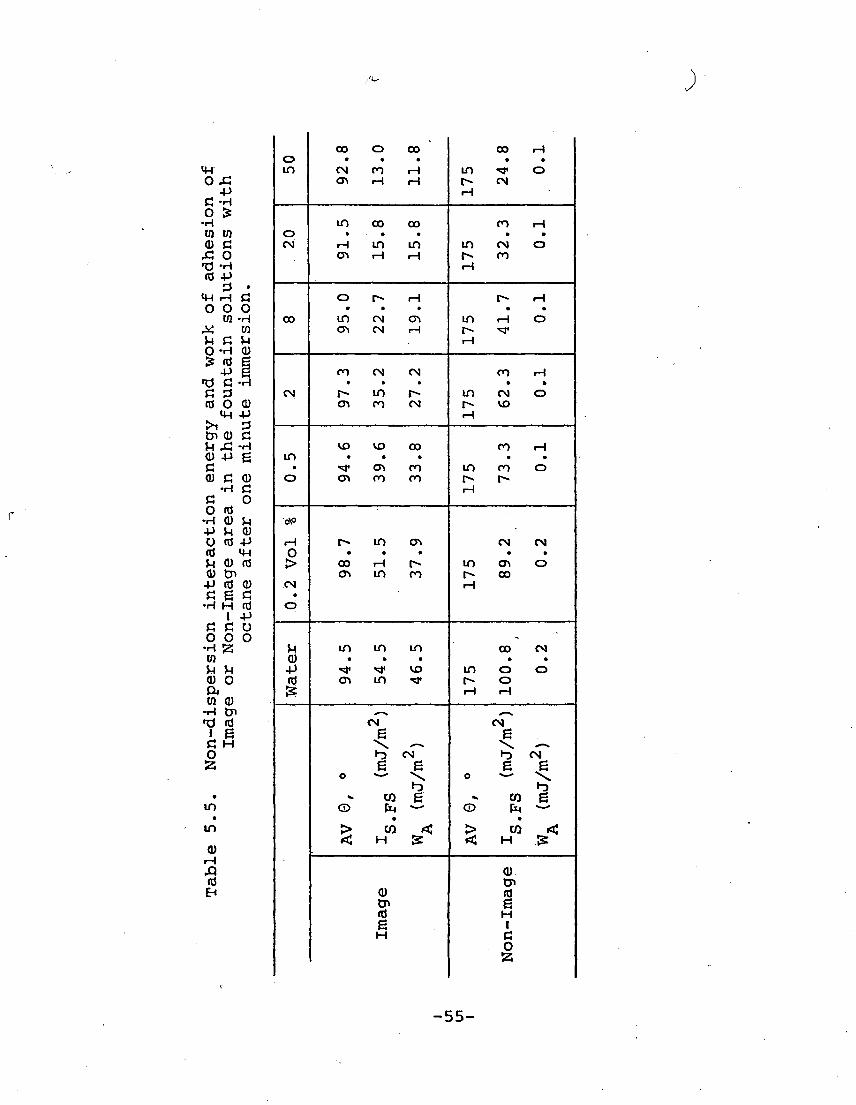
For the Image Area and Non-Image Area, the results
after one minute immersion are tabulated in Table 5.5. For
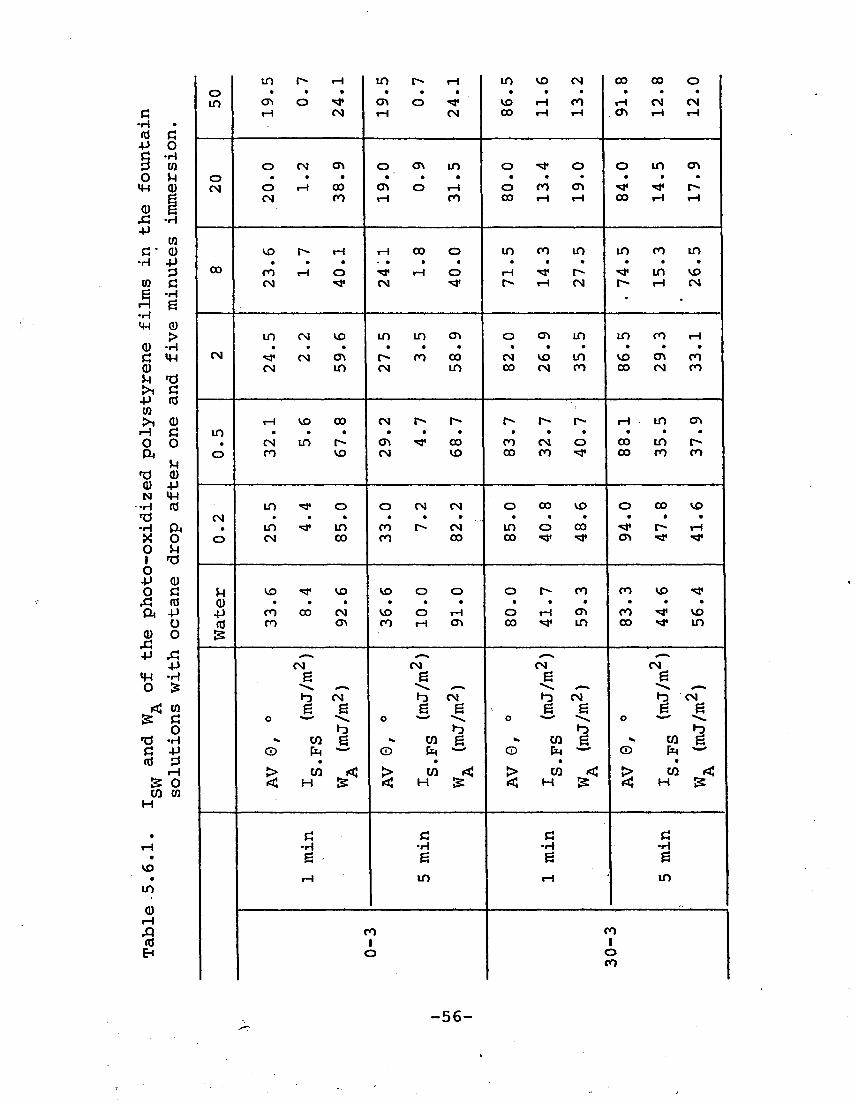
the photo-oxidized polystyrene films, the results after one
minute and five minutes immersion are tabulated in Table
5.6.1-3.
In Figure 5.6, the contact angles after one minute
immersion are plotted as a function of the surface tension
of the fountain solution. The contact angles for solids
which have mainly the dispersion component remained con-
stant or decreased slightly; on the other hand, the contact
angle for the highly photo-oxidized polystyrene increased
with increasing concentration of the fountain solution as
expected. Figure 5.7 shows the change in contact angle
after five minutes immersion.
In general, the contact angles are shifted to higher
values after five minutes immersion. Generally, the con-
tact angle increased and leveled off at about 50 mN/m
(corresponding to 2 vol %) surface tension. So, a fountain
solution at more than 2 vol % concentration would be useful
in terms of adsorption of water-soluble polymer such as
gum arabic contained in this commercial fountain solution.
-54-
/I*. ;
MH ox:
-P c -H o s
•H w w (U c x: o <d -H (0 +>
3 • <H rH C o o O
tn -H x W u C H O-H <D £ rt g
+) g •a c •H c a (0 o a)
m -P >i P Cn <D G MX5 -H (D -P g C <D C (D
•H C G O O (0 •H (D ?H •P M a) O f0 -P (0 m u o rd <D tn •P td <u C g C •H H rd
1 ■P c c o o o O •H -S (0 H V4 <u o & to a)
-H CP T3 rd
i g C H o !3
•
in
<u rH A <d EH
oo O CO CO rH o • • • • • m CM CO ■H in •^r o
as rH rH CM
in CO CO CO rH o • • • • • CM rH in in in CM O
as iH rH rH
CO
o r- rH r- r-t • • • • •
00 in CM as in rH O <Ti CM iH r--
iH •^
co CM CM CO T-i • • • • •
CM r- in r^ in CM o en CO CM
rH VD
VD VO CO CO rH in t • • • •
• •<* as CO in CO O o as CO CO r-
<K>
iH r- in cr» CM CM o • • • • • > CO H r* m as o
OS in CO r^- CO CM rH
O
H in in in 00 CM <D • • • • • ■P •«* ** vo in o o rd as in ■«* r- o !? rH rH
^.^ ^^ CM CM
g g \ *~. \ .»-» •o CM •^ CM Js g & g
o 1-}
0
^ CO G ^ CO £ CD
• © E>4
•
> to < > CO < < H £ < H ,3=
<D tn
<0 (d en g rd H g 1 H
0 53
-55-
ti -H • a c -P o c* •H 3 w 0 u m CD
<D g A -H +>
to a- CD
•H -p 3
(0 c a •H H g •H IH (U
> a) -H a m o n tJ >i c •P cd CO >i a) r-i c O o ft
u •d CD a) •p N H-l
•H rd •d •H ft X o o }-l 1 Tf o •P CD o G ^ rd a -p
o a) o .c •P -a
-p m •H o &
*! w & c
o >a •H G +J rd 3
1-i & o M CO
VO
in
CD rH
in r*- rH in r^ rH m vo CM CO 00 o o IT) <r» o ■<* CT» o ■^ VD rH CO r-i CM CM
rH CM rH CM 00 rH T-i CT> rH rH
o (N o\ O C\ in o ■^f o O in <7\ O CM o rH CO cr> o rH o co en ^ ^r r^
CN n rH ro 00 rH rH CO t-t rH
vo r» rH rH 00 o in ro in in co in
00 CO rH O "tf r-i o r~\ •^ r^ ^ in VO CN "tf CM ■^ r» rH CM r~ t-i CM
m CN vo in in cr> o CT> in in CO rH
CM ■^< CM a\ r^ co 00 CM VD in VD en CO CN in CM in 00 CM co CO CM CO
rH VD 00 CN r- r- r^ r- r- rH in en lO
• CN in r- o\ •*r 00 co CM o CO in r*» o co vo CN VD 00 co •** 00 co co
in •^ o o CM CM o 00 VD o CO vo CN
• m •>* in n r^ CM in o 00 ■^ r<» rH o CN 00 co 00 00 "^ ■^ a\ •<# *#
U vo ^ VO vo o o o r^ co CO vo ■<*
CD -p co CO CM VD o rH o rH CTl CO •^ VD rd co o\ co rH cr> 00 ^ in CO •"# in &
^^ ,_» ^ ^^ CN CM CN CM
g g _ g ^.^^ *»■»
»-D CM h> CM h) CM io CM 6 g g 6 i g 6 g g
o o o h>
o ^
^ CO g k* CO g ^ to g ^ CO g © fa
• o fa
• © fa
• CD fa
• > CO <: > CO < > 03 *< > w < < H & < H & < H IS < H ^
G C C a •H •H •r» •H g g 6 g rH in rH in
« ■o < ■o 1 1
< o « o co
-56-

rH o CO in r-> rH •"* ro in 00 00 o o r- 00 VO in r- r> rH ro rH VO CO rH in rH
rH rH rH
rH rH in
rH CM in
rH CM
o O «* in •«* o <T» rH CO 00 rH CO
o rH CM o VO co <X» 00 O CM VO rH rH CM rH rH
CM rH rH rH
CM rH
CO in rH
CO
o •^ ■^ O CT» a> CT* CO O m CM VO
00 00 r- "* in CM CO 00 00 co r- O rH o CM rH CM ro ^ ro in 'C* rH rH rH rH
O ^ o O r- r- ro rH CO CO m o\
CM l""- m r- CM r» •>* ro CT> CO in cr> CM rH ** r-\ CM ■^ rH in in m m rH rH rH rH
O o ■<* O CO VO in <J\ in CTi rH CO in
• CO 00 m VO CM O in VO vo CO 00 m o O
rH ^ CM rH
rH in CM
rH vo
rH vo
O in a\ O CM CM CO r* r*- in r- r- CM CO 00 o CO CM r*» in vo CM rH o\ cr> o o in co rH vo CM ro r* rH *tf r-
rH rH rH rH
U CO in in ro o o CO 00 CM CO in in Q +» vo VO «* -* ro 00 CM ■^ VO CO in in (0 cr> in ■«* O vo ro ro CO rH CO CO rH 5 rH rH * rH
^. ,_^ ^^ ___ CM CM CM CM
g g g g -^ ^-^ -^ ,^-N "^s. ,«* ^m^
hs CM r? CM ID CM r} CM g g g g g g g g
o r3
o p 1— O
K CO g ^ CO g •« CO g ^ CO g ©
• <*—*• ©
• ©
• ©
• CM >, en *< > CO <: > CO £ > CO < • V£>
< H £ < H & <J H &■ < H S
in
<a G a a C H •H •H •H •H g g g g
EH iH in rH in
ro r 0 ,
1 1 o c 3 m c
r H -
•57-
vo r- rH cr» ro in o rH r» in in ro o in
in ro rH co •<* o o ■** o r» ^ o in CM vo CM vo CM vo CM iH rH tH rH
rH m O CO CO vo CO rH ro ro en in o CM CM o CM ro rH o VO rH rH vo rH o
in ro vo ro m ro vo ro rH rH rH rH
CM •<* ■^ CO ^J< •^r CO CO in en ro in .
00 <y» o rH CO rH o t-» O rH r- rH o in ■<# vo ^f in •^ vo ■<*
iH rH rH rH
CM r^ r~ in ^ o m CM CM «* ro rH
C\J rH o rH in rH rH CO O CM «tf rH rH VD vo vo VO in VO vo VO t-H rH rH rH
r^ o "tf "tf CO VD rH r-» r^ CO ro rH in
• in r^ VD •<* a\ CO CM in r~ CO vo r^ o
rH vo in
rH vo
rH vo
rH VD
CX) CO VO O CO rH rH o <* in vo CO CM
• CO o CO in rH CO CM o en co o CO o
rH CO
rH CO
rH CO
rH CO
U CM vo ■<* CO in in r>» vo ■>* O en rH Q) -P r^ r>- ro <tf rH en o en rH r» CM CO (d ro CO rH •^ CT> ^ CO rH «* en £ rH rH rH rH
^^ _ ,_^ CM CM CM £ ^_^ g ^ CM hi CM CM h> CM g e e a g g g
0
^ O O *««.
^ o "S.
^ CO e ^ en g ^ CO g ^ CO g © P4
• o
• o EM
• CD
• ro > co ,*$ > CO < > CO <! > CO < • < H J2 < H & < H & < H & vo
• in
<D G C G £ rH •H •H •H •H
6 6 g g En rH in rH in
c ) i ■o 1 1 c ) < D If ) c O
i- t— i C M
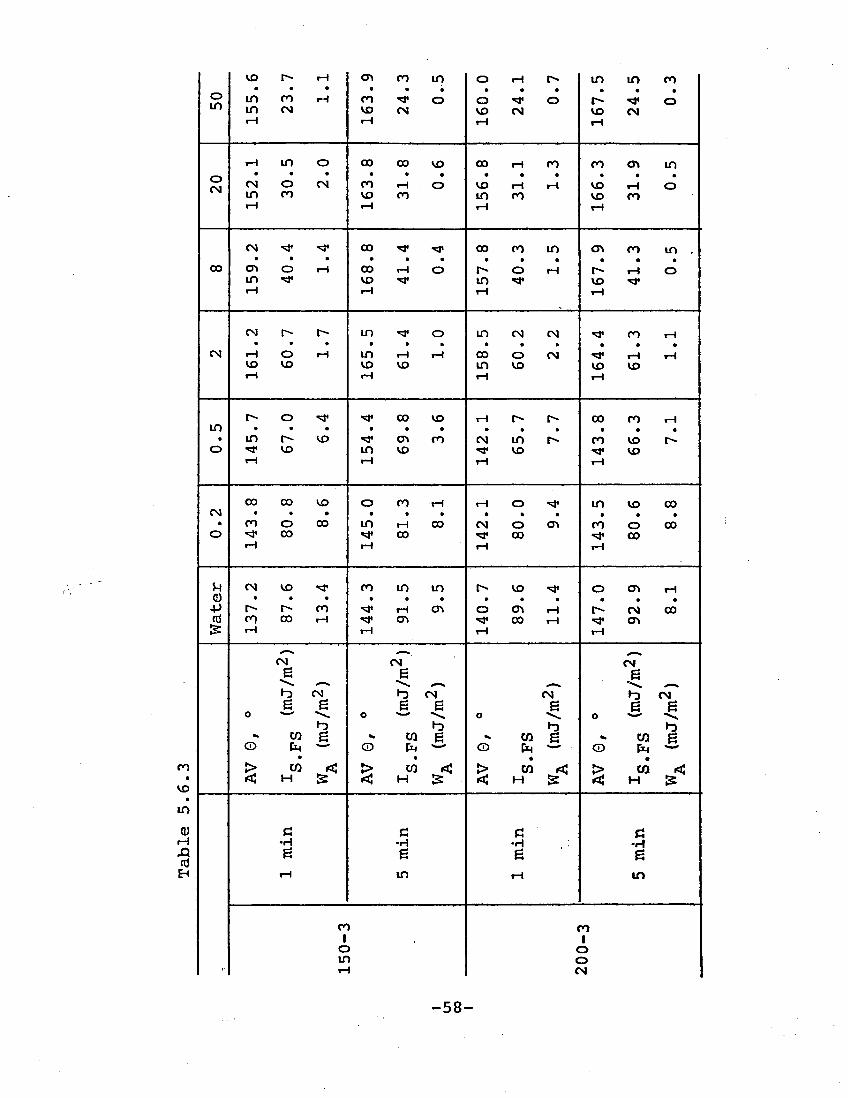
-58-

Q>
cr> C <
o CO
O O
180
160
140
120
100
80
A 150-3 *
Non-Image 200-3
A £ -
100-3 •
50-3
Image
o
30-3
40
20
Ohtf- 30 40 50 60
YF.S. < mN/m )
-O O
70
Fig. 5. 6 Contact angle of Octane on solids in fountain solution after 1 minute immersion
-59-

CE>
CD
en C <
o CO
c o O
30 40 50 6fi 70
YV.s. ( mN/m )
Fig. 5. 7 Contact aTigle of Octane on solids in fountain solution after 5 minutes immersion
-60-

It was reported [44] that a contact angle of 165-170° is
needed to repel printing ink from non-image area. There-
fore, the highly photo-oxidized polystyrene film, for ex-
ample 200-3, may be used as a non-image area when 2 vol %
fountain solution is used.
The contact angle for the Non-Image Area is constant
and quite high independent of the surface tension of the
fountain solution. In this case, the octane drop can
hardly be in contact with the plate since the interaction
energy is very small. An octane drop slides away on the
plate if the plate is slightly slanted. From this experi-
ment, it was not determined whether gum arabic adsorbed
on Non-Image Area because the contact angle is so large,
even for pure water.
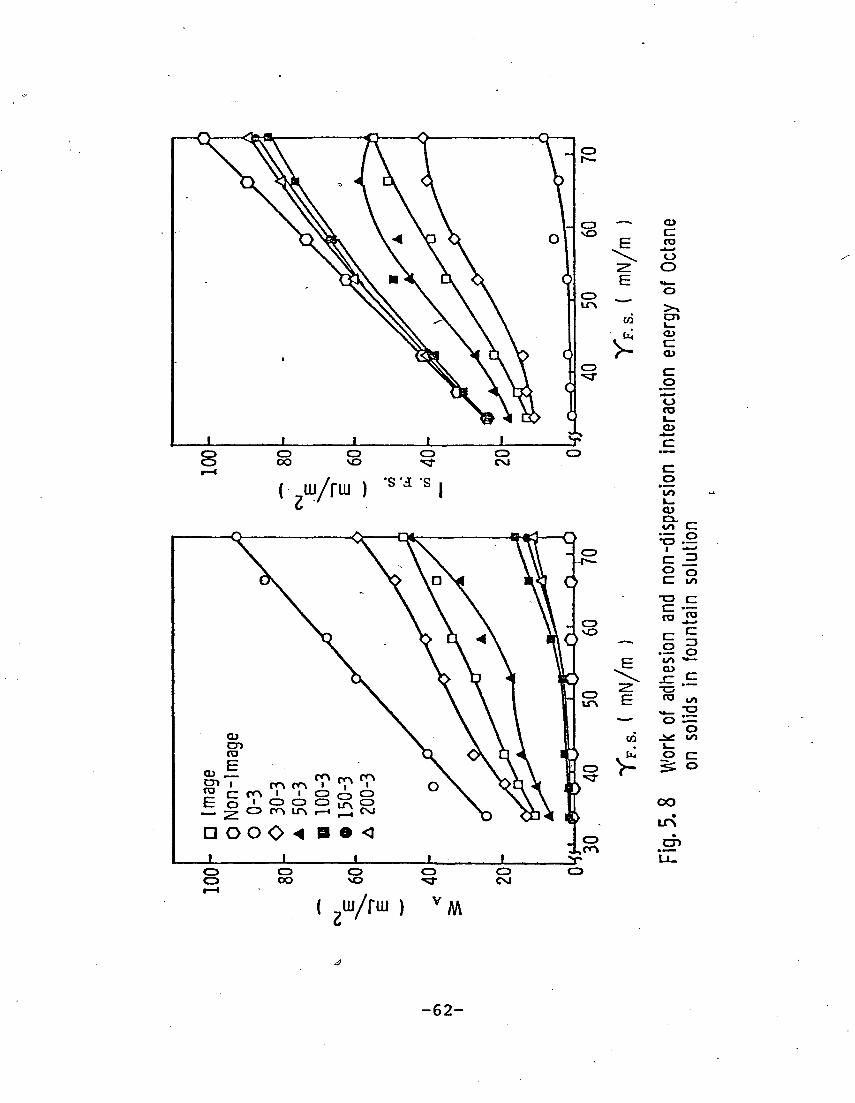
Figure 5.8 shows the work of adhesion and the non-
dispersion interaction energy as a function of the surface
tension of the fountain solution. The work of adhesion,
as well as the non-dispersion interaction energy, decreased
with the decreasing interfacial tension since the contact
angle is relatively constant.
5-3. With Surfactant Solution
5-3-1. Cationic Surfactant
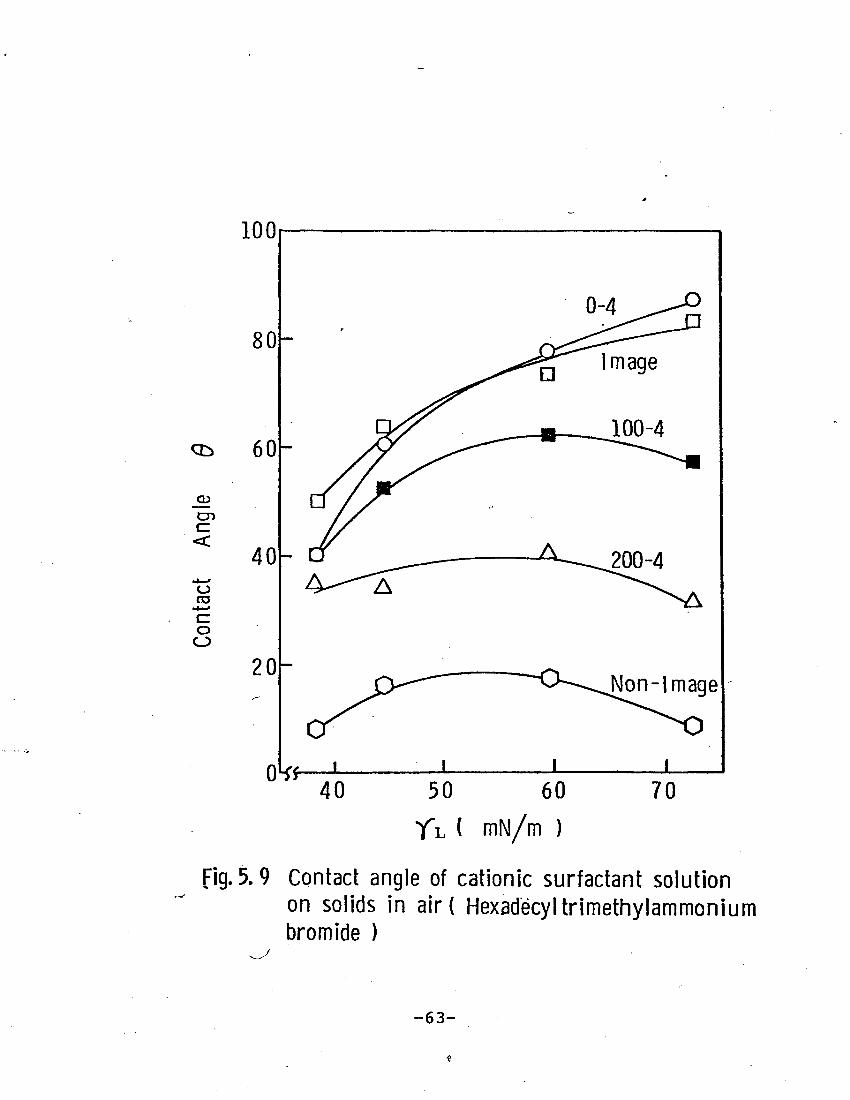
Sessile drops were formed on the solids in air, and
their contact angles were measured. The results are shown
in Figure 5.9. The same trend as observed for the
-61-
>-
«v i/rui ) 'S'd s
CD c CO
"o O
>-* en i_ CL> c
c JO
"o CO I— CD
c o v_ a>
^o •—
O o C bo
■a c
CO ro
.— o cr> *•—
CO ^
o
oo
( uj/ruj) M
-62-
C£>
ct> en d
o to d o o
50 60
rL l mN/m )
Fig. 5.9 Contact angle of cationic surfactant solution on solids in air ( Hexadecyltrimethylammonium bromide )
-63-

r
commercial fountain solution in air was observed except for
the Non-Image Area. For the Non-Image Area, the contact
angle increased to a maximum and then decreased again.
In octane media, sessile drops of cationic surfactant
solution were formed on the solids (Fig. 5.10). In this
case, the contact angle increased strongly with increasing
surfactant concentration without exception as compared with
the case of the fountain solution. Even for Non-Image Area,
there was no change in contact angle down to a surface
tension of about 45 mN/m; however, the contact angle abruptly
increased for lower surface tensions.
As it is said that cationic surfactants make everything
hydrophobic, the apparent hydrophobicity of a solid increases
with an increase in the concentration of cationic surfactant
solution.
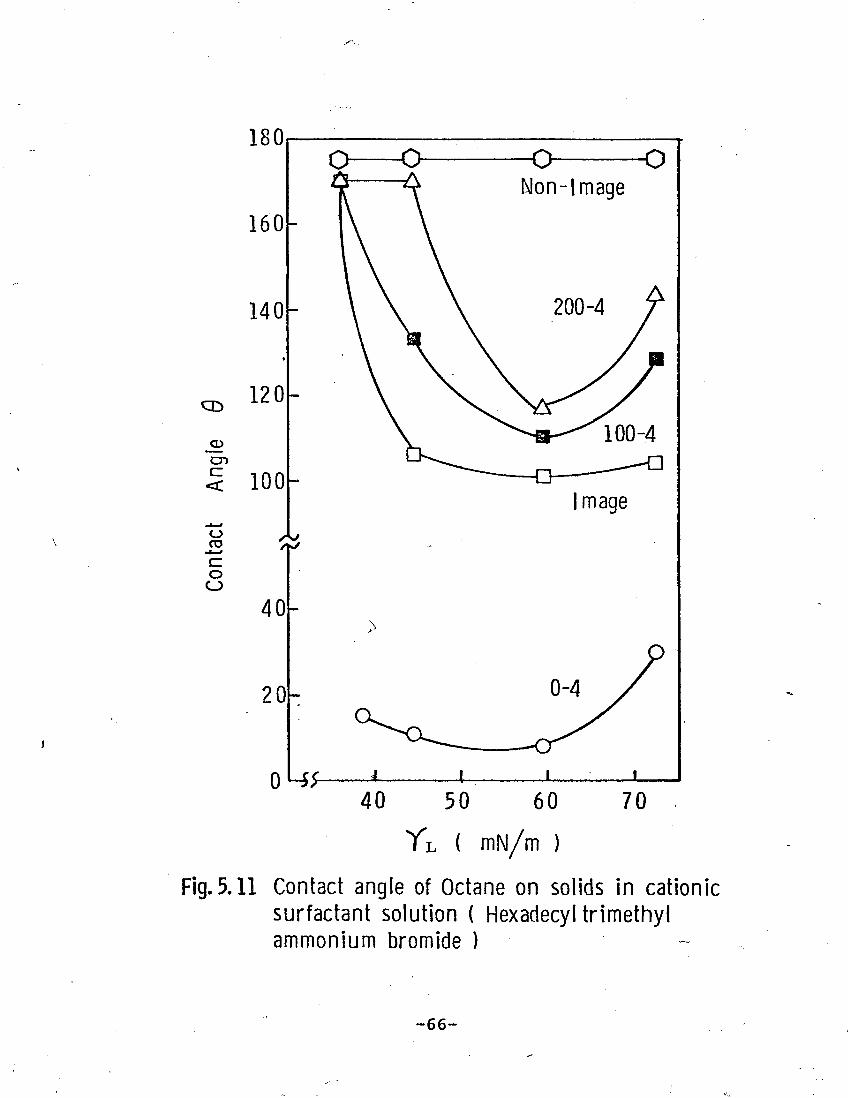
There is also an interesting trend in the contact angle
of octane on the solids in cationic surfactant solution (Fig.
5.11). The contact angle decreased with increasing concen-
tration to a minimum and then increased, except for the
Non-Image Area where contact angle did not change at all.
The more hydrophilic the solid is, the faster the con-
tact angle increases and reaches to the constant value^of
about 170°. Therefore, the octane drop behaves as if the
solid were more hydrophobic up to a certain concentration
of cationic surfactant and then became more hydrophilic
for a higher concentration. This trend may be explained
-64-

<£>
CD
o
cz o o
YL ( mN/m )
Fig. 5.10 Contact angle of cationic surfactant solution ( Hexadecyl trimethylammonium bromide ) solids in Octane
-65-
180
CD
CD
CD C
o to
o O
160
140
120
100
/**J ns
40
20
0 h*P
Image
40 50 60
YL ( mN/m )
70
Fig. 5.11 Contact angle of Octane on solids in cationic surfactant solution ( Hexadecyl trimethyl ammonium bromide )
-66-
by considering the number of adsorption sites on the sur-
face of a solid and the cationic surfactant concentration.
The highly, photo-oxidized polystyrene film has a large j
number of adsorption sites, whereas a highly hydrophobic
solid such as non-photo-oxidized polystyrene film has only
a few adsorption sites. The adsorbed cationic surfactant
makes an adsorbed film which is a barrier that prevents the
actual contact of the octane drop and the solid. For
sample 200-4, the barrier formation is easier than for the
sample 0-4, which has an adsorbed cationic surfactant film
not thick enough to prevent contact of the octane drop with
the true surface, even at a concentration of 1.10x10
mol/Jl.
(
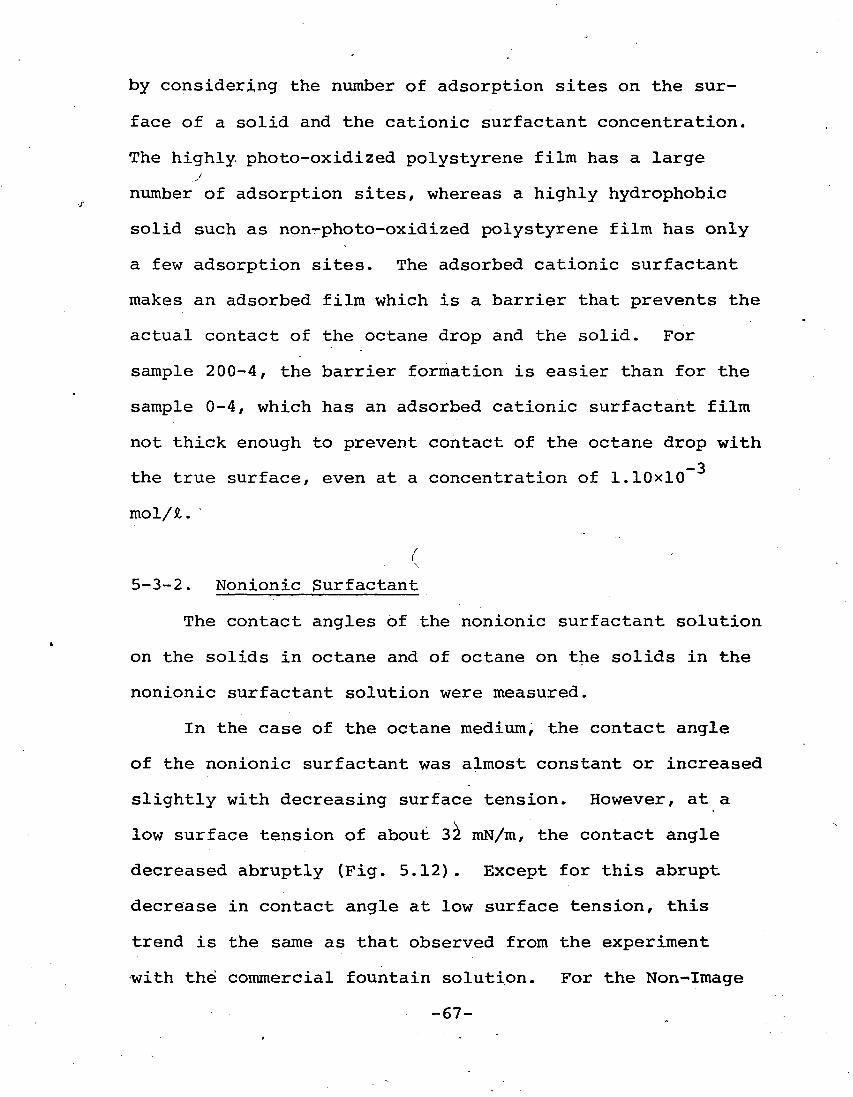
5-3-2. Nonionic Surfactant
The contact angles of the nonionic surfactant solution
on the solids in octane and of octane on the solids in the
nonionic surfactant solution were measured.
In the case of the octane medium, the contact angle
of the nonionic surfactant was almost constant or increased
slightly with decreasing surface tension. However, at a
low surface tension of about 32 mN/m, the contact angle
decreased abruptly (Fig. 5.12). Except for this abrupt
decrease in contact angle at low surface tension, this
trend is the same as that observed from the experiment
with the commercial fountain solution. For the Non-Image
-67-
180
Fig. 5.12
30 40 50 60 70
YLOf Nonionic Surfactant Solution ( mN/m )
Contact angle of nonionic surfactant solution { Triton X-100 ) on solids in Octane
-68-

Area, the contact angle at surface tension 32 itiN/m is as
low as 4°, indicating that the nonionic surfactant solution
spreads on it and can repel octane from the surface. How-
ever/ at this condition the contact angle on the Image
Area also decreased from about 125° to about 55°, which
indicates this concentration of nonionic surfactant solu-
tion makes Image Area hydrophilic. Therefore, the nonionic
surfactant solution at this high concentration cannot be
used as a dampening solution.
In the case of the octane drop on the solids in the
nonionic surfactant solution, the contact angle of octane
remained constant or decreased slightly with increasing
.nonionic surfactant concentration (Fig. 5.13). However, ©
at a low surface tension of about 32 mN/m (close to the
C.M.C.), the contact angle increased suddenly up to 170°,
except for sample 0-5. This abrupt increase in contact
angle is the same trend observed in the system of cationic
surfactant at surface tension of 38.5 mN/m. This phenomena
may be also explained by the adsorption of nonionic surfac-
tant on the surface of the solid, creating a barrier to
prevent the contact of the octane drop with the solid.
5-4. With Gum Arabic Solution
The same type of experiments were carried out for
the gum arabic solutions.
In octane medium, the contact angle of the gum arabic
-69-

Q>
CD
180
160
140
120
100 <.
"o 80 CO
»»!■/
£= o O 60
40
20
0
Non-Image
SJ-
30-5
30 40 50 60 70 Y"L of Nonionic Surfactant Solution
( mN/m )
Fig. 5.13 Contact angle of Octane in nonionic surfactant solution ( Triton X-100 )
-70-

solution remained constant as the concentration increased,
even though the gum arabic has a slight surface activity
(Fig. 5.14). Therefore, gum arabic has nothing to do with
spreading of the fountain solution on solids in octane
medium.
The contact angles of octane on solids in the gum
arabic solution were measured (Fig. 5.15). The octane drop
was released one minute and five minutes after the solid
was immersed in the gum arabic solution. Almost the same
trend as in the case of the commercial founta'in solution
was observed. However, with this gum arabic solution, even
for the lightly photo-oxidized polystyrene film, sample
30-5, the contact angle increased with increasing gum arabic
concentration, which indicates this solution is more active
than the commercial fountain solution. One reason for this
may be due to the pH [45], which was adjusted by phosphoric
acid. Almost all metal ions of gum arabic are dissociated
at low pH, and the H form of the gum arabic molecule
easily adsorbs, even on solids which are highly hydro-
phobic. Studies of contact angle measurements [46,47] or
adsorption studies of powders [48-51] on the non-image
areas have been reported. The adsorption of gum arabic
is effective for anti-scumming.
-71-
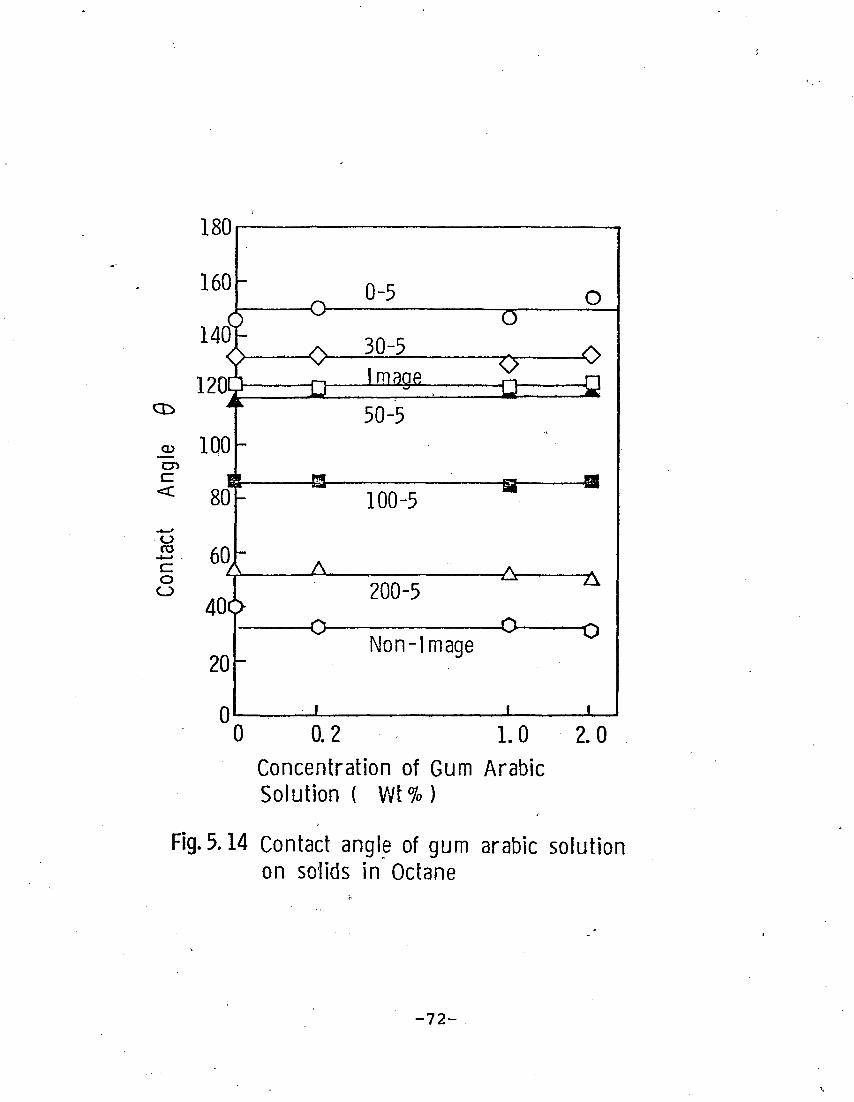
CD
0 0.2 1.0 Concentration of Gum Arabic Solution ( Wt%)
2.0
Fig.5.14 Contact angle of gum arabic solution on solids in Octane
-72-

o oo
CD NO
CD CD
CD CO
CD vO
CD CD CVJ
ITS
TO c CO
to
cz o
o in
.— !Q CO 1_ co
E ZJ en
to ■o
&
<X>
CO
O 52 «•_ to o l_
CD -°> E cf.§ CO
to
o -2 _2 =3
o — Q E
•—i
0 8|BUV PSJUOO
-73-
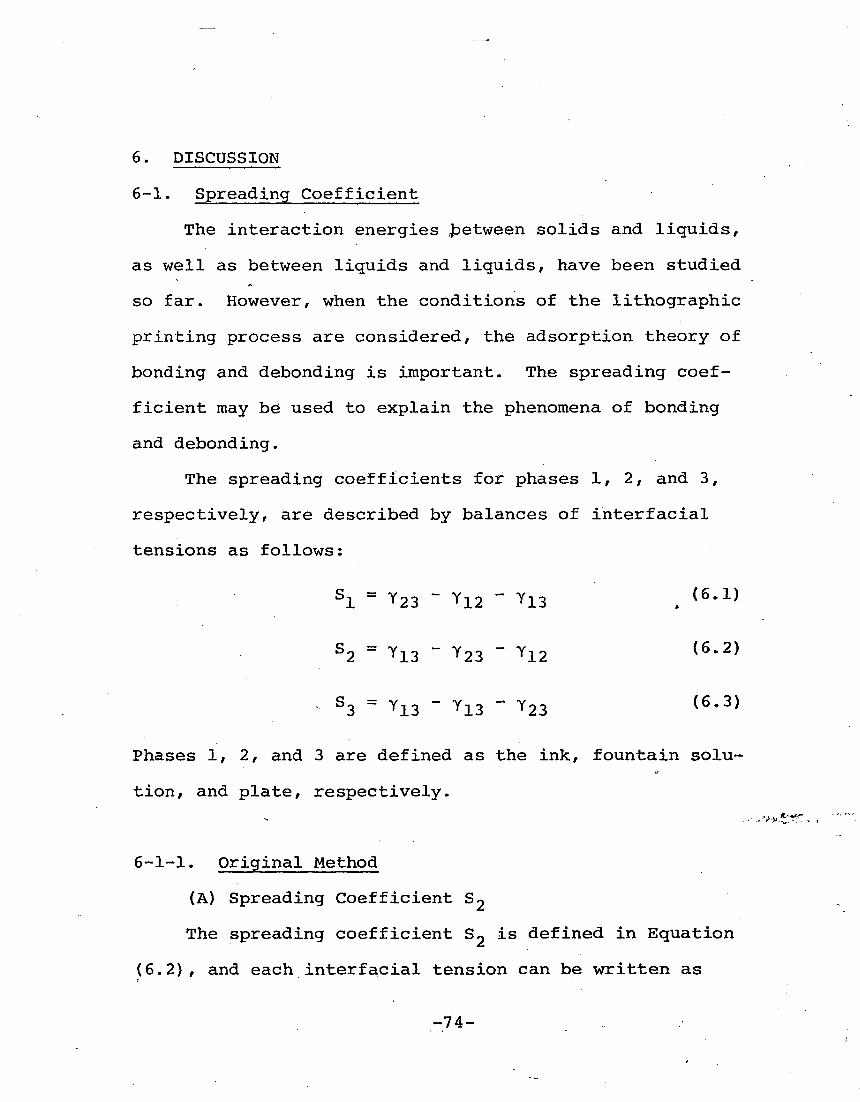
6. DISCUSSION
6-1. Spreading Coefficient
The interaction energies between solids and liquids,
as well as between liquids and liquids, have been studied
so far. However, when the conditions of the lithographic
printing process are considered, the adsorption theory of
bonding and debonding is important. The spreading coef-
ficient may be used to explain the phenomena of bonding
and debonding.
The spreading coefficients for phases 1, 2, and 3,
respectively, are described by balances of interfacial
tensions as follows:
51 = Y23 " -Y12 " Yi3 . (6*r)
52 = ^13 - ^23 " ^12 (6'2)
* S3 = Y13 " Y13 - Y23 (6*3)
Phases 1, 2, and 3 are defined as the ink, fountain solu-
tion, and plate, respectively.
6-1-1. Original Method
(A) Spreading Coefficient S2
The spreading coefficient S2 is defined in Equation
(6.2), and each interfacial tension can be written as
-74-
-.' vV*-*^-.
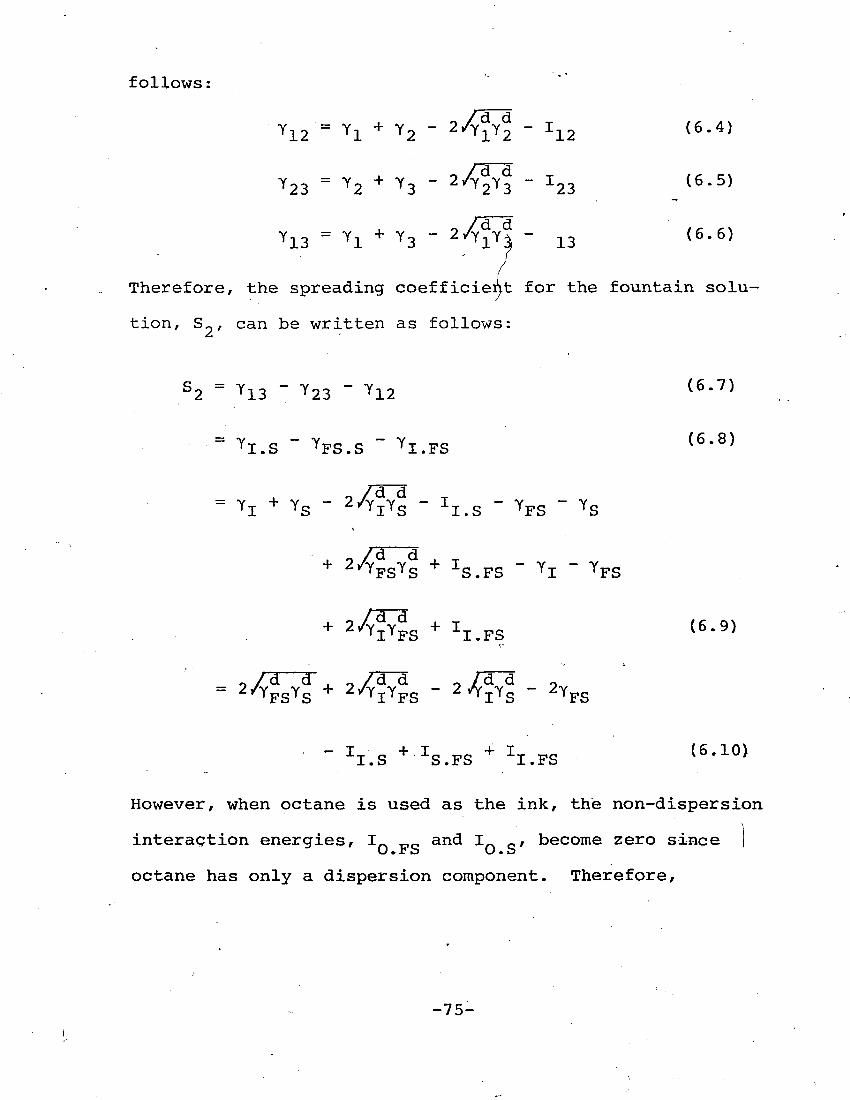
follows
Y12 = Yl + Y2 " 2/¥^ " J12 (6-4)
Y23 = Y2 + Y3 ~ 2v^2Yf " I23 (6.5)
Y13 = Yl + Y3 " 2y^M " 13 (6'6)
Therefore, the spreading coefficient for the fountain solu-
tion, S„, can be written as follows:
S2 Y13 Y23 ~ Y12 (6.7)
TT Q " Ypc c " YT TPC (6-8) I.S 'FS.S 'I.FS
/d d :/Y- YI + Ys " 2/YIYS - II>S - YFS " YS
+ 2/YFS
YS
+ ^.FS " YI " YFS v y%
+ 2^TY~c + IT ^ (6.9) d d 'lYFS " ^I.FS
2/YFSYS + 2/YIYFS ~ 2*Vs " 2YFS
" V.S + ^S.FS + ^I.FS (6'10)
However, when octane is used as the ink, the non-dispersion
interaction energies, I_ _„ and I , become zero since
octane has only a dispersion component. Therefore,
-75-

_ /a d" _,_ 0 /d~d ■ /d~~d S2 = 2*FSYS + 2/VFS " 2/Vs " 2YFS
+ ^.FS (6'11)
Since Yps = 21.8 mN/m, YQ = YQ = 21.8 mN/m,
S2 = 2^1.8xYg + 2/21.8x21.8 - 2/£l.8xYg
- 2YFS + ^.FS (6'12)
= 43.6 - 2YFS + ls>ps (6.13)
Therefore, the value of S~ is independent of the value of
Yd
The values of S2 calculated by making use of Equation
(6.13) are tabulated in Table 6.1. For the calculation,
the values of I_ _„ obtained from the contact angle measure- b.rb
menb of the fountain solution in octane medium were used.
These values are plotted in Figure 6.1. The values of S,
for the Non-Image Area were larger than any of the other
spreading coefficients, varying from -7.8\mJ/m to -0.1 V_.
mJ/m . The value of S2 approached zero as the surface
tension of the fountain solution decreased, indicating that
the fountain solutions tend to spread on the Non-Image
Area. However, since the value of S, for the Non-Image
Area does not become positive, the spontaneous separation
of octane from Non-Image Area by the fountain solution
does not take place.
-76-

CN to
-p
o -H O
-■H «R «W
CD o u CP c -K tJ 0) n ft
CO
rH
vo
CD t-« .Q rd EH
o in o
CN
rH
O 1
co CN
l
rH CN
1
o
en rH
1
en
4 VO
00 1
en
l
o C\J
CN
oo CN
1
CN
O 1
o rH CO
en CN 1
in
VD CN
1
CN
00 rH
1
CO
CO rH
1
en
rH
00
IT)
in co l
CO
o
o
CO 1
CO
CN
CO CO 1
CN
CN CN
1
CO
CO rH
1
O
H 1
CM
o
m m i
en
o 1
in
en in I
VO in
I
o CN in
VO
00 CO
1
en
CN 1
m rH
1
lO
o
CM
CO VD 1
CN
CN 1
CO
o r- I
00
VD vo 1
r-
CN VD
1 CO 1
H
CN CN
1
CN
CO rH 1
t-\ O >
CN • O
in
CO
1
CN
1
CO
VQ 00
1
00
l
VO
vo
in
CO
!
en
CO CN
1-.
CO rH
1
to <D •P
&
H
CN 00
«
00
r- l
CO
VO en 1
CO
o en
l
r-
rH in
I
CO
VO CN
1
in
o CN
l
-'-■
d)
rd e H
0)
fd e H 1 a 0
CO 1 o
CO
o CO
co 1 o m
CO
o o rH
CO 1 o in rH
CO 1 o o CN
CN
s
•P •H C D
-77-
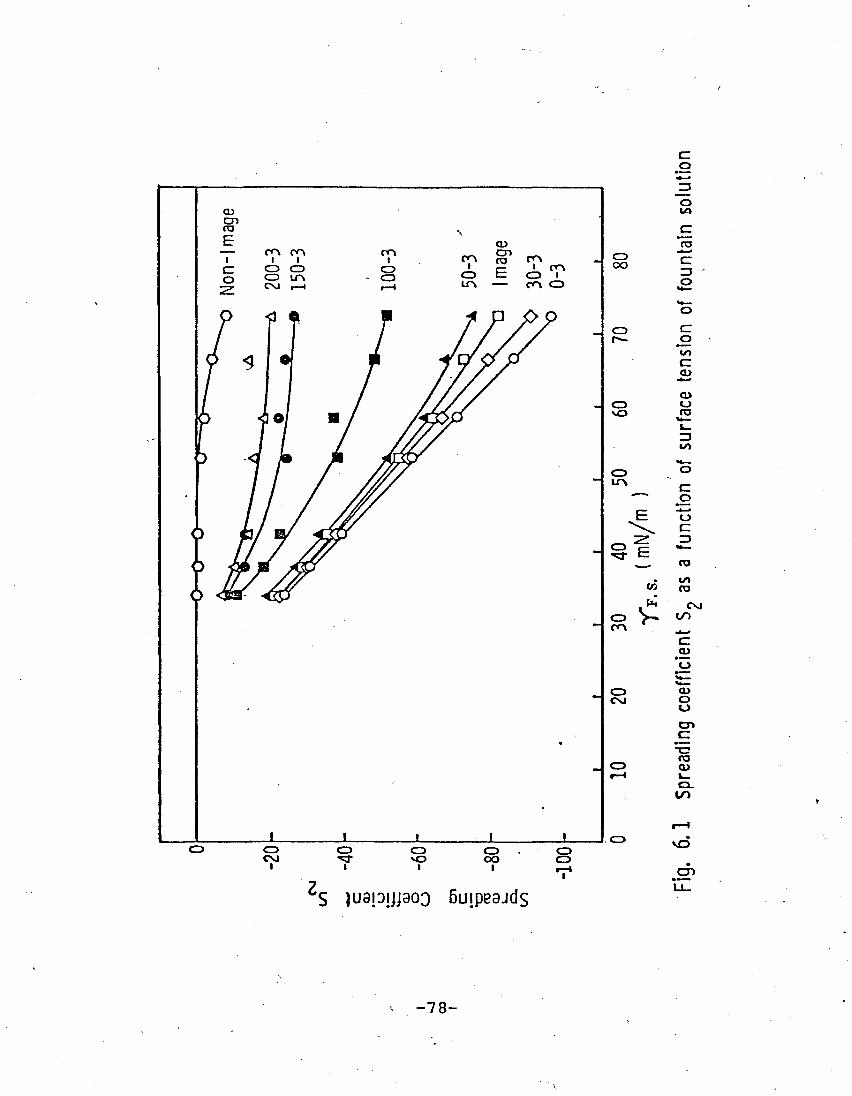
cz o
o
cz CO
cz o
cz a)
o o ro i_ zo
CZ o o
ro CO CO
CVJ CO
"c
o
o o an cz ■c ro cu »_
vO
juaiDijiaoo 6uipe9Jds
-78-
On the other hand, the value of S2 for non-photo-
oxidized polystyrene film, sample 0-3, was smaller than 2
any other spreading coefficients, varying from -96.3 mJ/m
2 to -23.7 mJ/m as the surface tension of the fountain solu-
tion decreased. The value of S2 of sample 0-3 was quite
small compared with that of Non-Image Area, indicating
that the fountain solutions have the least tendency to
spread on the polystyrene film.
The values of S2 for other solids were intermediate
between those"of two solids, the Non-Image Area and sample
0-3, showing the same trend that the value of S2 increases
as the surface tension of the fountain solution decreases.
(B) Spreading Coefficient S^
The spreading coefficient of octane on solids in the
fountain solution media, S, , can be expressed as follows:
Sl = Y23 " Y12 - Y13 (6'14)
= YS.FS - YO.FS " V.S (6-15)
+ 2/^ - T YS YFS ^S^S S.FS Y0 YSF
^&&$&yZU±Z'«*&&i£-i
dd 0TFS T0 TS ' "rT0YS (6.16)
= 2%YF"s + 2^t " 2VYSY>S " 2YO " ^.FS (6-17)
By substituting for v , y__ and yrt the values of 21.8,. 21.8
-79-
and' 21.8 raJ/m2, respectively, S1 can be expressed in a
simple form as follows:
S± = 2/21.8x21,8 + 2/21.8><Yg - 2/21.8*Y^
- 21.8x2 " ISFS (6.18)
" " ^.PS (6-19>
The calculated values of S, are tabulated in Table 6.2.
From Equation (6.19), it is obvious that the spread-
ing coefficient S,, never become positive. If the solid
has only the dispersion component, S, will be zero. How-
ever, since this is a special case, the values of S. for
common solids are usually negative.
Figure 612 shows the spreading coefficient S, as a i ■ \\
function of the surface-tension of the fountain solution.
Contrary to the case of S0, Sn for sample 0-3 was larger
than any of the other spreading coefficient, varying from
-8.4 mJ/m to -0.7 mJ/m2, and S1 for the Non-Image Area is
2 the smallest among them, varying from -100.8 mJ/m to -24.8
mJ/m2, which indicates that octane tends to spread on the
solid, sample 0-3, but not on the Non-Image Area in the
fountain solution.
However, surprisingly, the value of S, for Image Area
is rather small. Sinqe this Image Area is a commercial
2 product, the value of- S,, -55 mJ/m at Y _ = 72.3, is
assumed to be hydrophobic enough to repel fountain solution
-80-
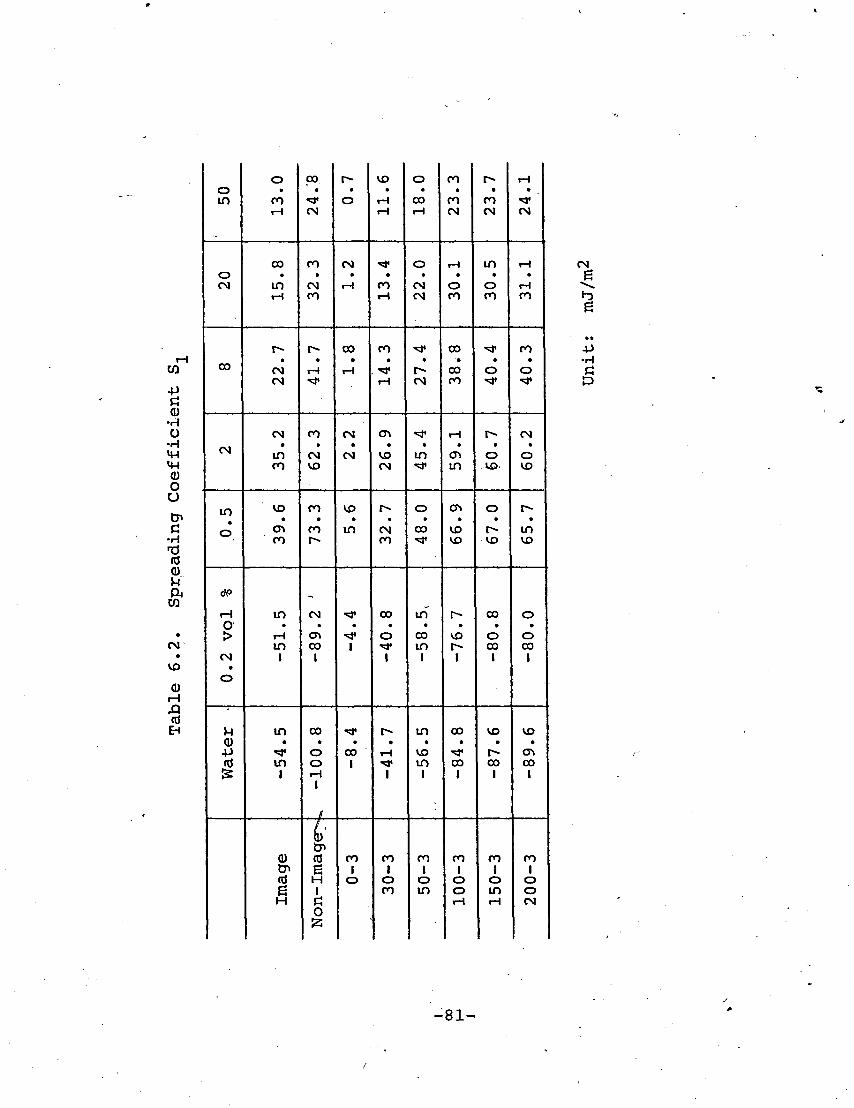
co
•p
0) •H O •H m <4H <D o o tn
•H
<u n
CO
CM
vo
d) rH
o in
o CO rH CM
o
vo
rH rH
o 00 rH
CO
co CM
r-
co CM
rH
CM
o (N
(X)
in
CO
CM CO
CM
rH co rH
O
CM CM
rH
O CO
in
o co
rH
rH CO
00 CM CM
rH
00
rH
co
rH CM
00
00 co
o
CO
O
CM in co
co
CM VO
CM
CM VD CM
in
rH
in o vo
CM
O VO
in • o
vo
CO
CO
CO in CM CO
o 00 vo
vo
o
vo in vo
tfp
rH 0 > CM
•
o
in
rH in l
CM
a\ CO
1 1
00
o •>*
1
in
00 in l
vo
l
00
o 00
l
o
o 00
1
u <a -p
in
in 1
00
o o rH
1
1
•<*
00 1
r-
rH
1
in
vo in l
00
00 1
vo
00 I
vo
ON 00 1
C7> (d e H
I (0 g H
o 55
CO 1 o
CO 1 o CO
CO 1 o in
CO
o o rH
CO 1 o in rH
co 1 o o CM
CM
-P •H
D
-81-

oo
o
o m
C~) CO.
vO co
to CD 1_ ir\
—*--. O
CD E O
^J- ^"s. -«_* 2: <J
E c:
-— 03 CD • m xn CO
CD
V 1*—
CD CO CXI 0
CD O O
CD cn c:
I—i "■0
CO co l_ 0. to
CD
CSJ
juapijjeoo 6uipB94ds On
82-
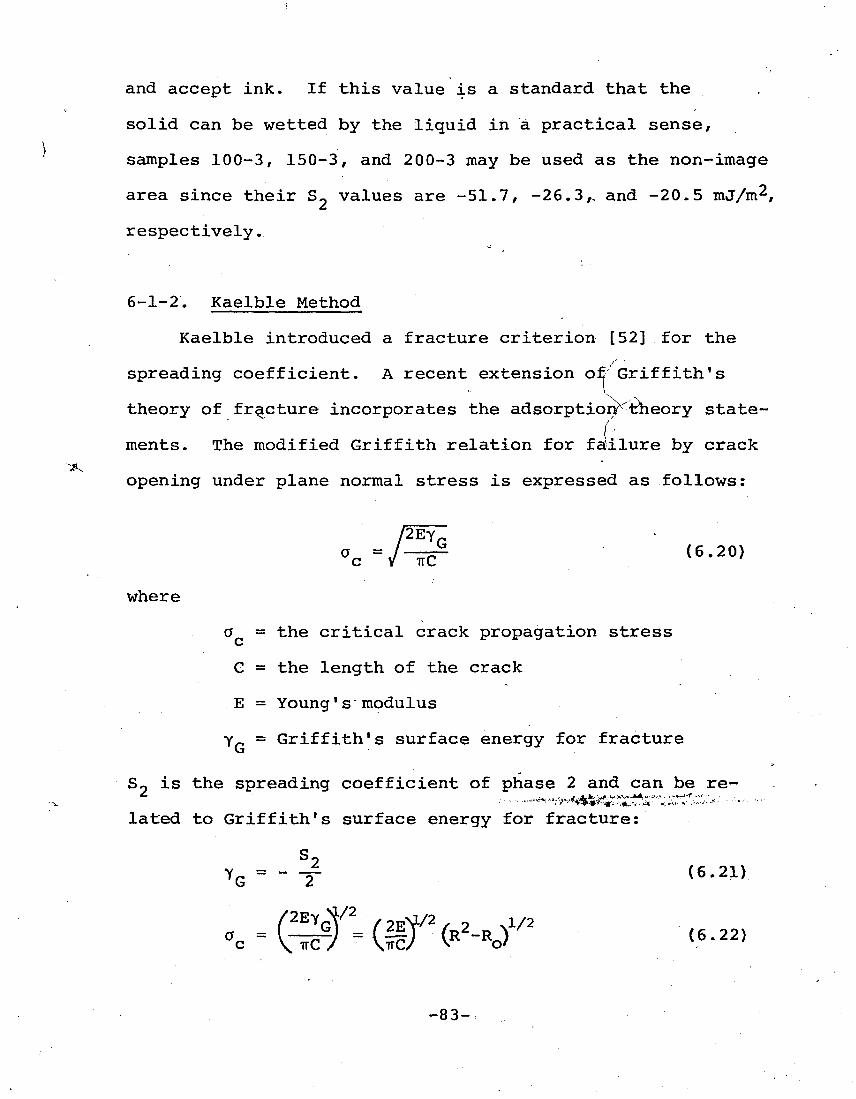
"#v
and accept ink. If this value is a standard that the
solid can be wetted by the liquid in a practical sense,
samples 100-3, 150-3, and 200-3 may be used as the non-image
area since their S» values are -51.7, -26.3,. and -20.5 mJ/m^,
respectively.
6-1-2. Kaelble Method
Kaelble introduced a fracture criterion [52] for the
spreading coefficient. A recent extension of Griffith's
theory of fracture incorporates the adsorption^theory state-
ments. The modified Griffith relation for failure by crack
opening under plane normal stress is expressed as follows:
..-/
2EY
where
a = the critical crack propagation stress
G = the length of the crack
E = Young's"modulus
y-„ = Griffith's surface energy for fracture
S0 is the spreading coefficient of phase 2 and can be re-
lated to Griffith's surface energy for fracture:
S2 vG - - -r <6-21'
-83-
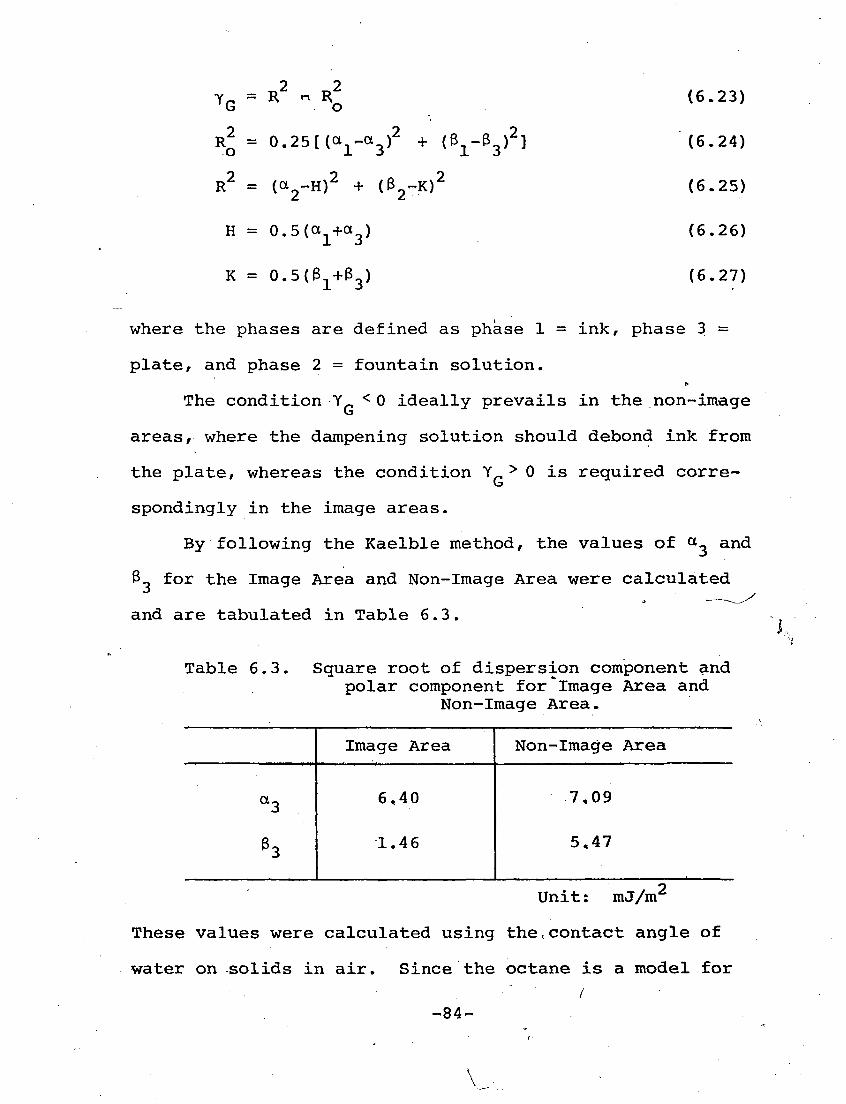
Y
R .1
R
G
2 o
2
H
K
T,2 „2 R ri R o
0.25[(ai-a3)2 + (31-&3)
2]
(a2~H)2 + (32-K)2
0.5(ai+a3)
0.5(3^33)
(6.23)
(6.24)
(6.25)
(6.26)
(6.27)
where the phases are defined as phase 1 = ink, phase 3 =
plate, and phase 2 = fountain solution.
The condition Y„ <0 ideally prevails in the non-image
areas, where the dampening solution should debond ink from
the plate, whereas the condition Yr > 0 is required corre-
spondingly in the image areas.
By following the Kaelble method, the values of «3 and
3_ for the Image Area and Non-Image Area were calculated
and are tabulated in Table 6.3.
Table 6.3. Square root of dispersion component and polar component for *Image Area and
Non-Image Area.
Non-Image Area
a.
3-
7,09
5,47
Unit: mJ/m
These values were calculated using the,contact angle of
water on solids in air. Since the octane is a model for /
-84-

J3
the ink, otl = 4.67 (y . =21.8) and 3, = 0. For the i octane l
fountain solution, a. = 4.67 (Ypq = 21.8) and $_ varies from
7.11 (Y£L =50.5 for water) to 3.52 (Y£0 = 12.4 for 50 vol %
FS) .
Figure 6.3 shows Griffith's surface energy for fracture,
and the graphical determination of the.range for the surface
properties of the fountain solution.
For Image Area, since the solid line of the fountain
solution does not intersect the circle, the octane on the
Image Area will never be separated by the fountain solution.
For the Non-Image Area, the solid line crosses the circle,
indicating that, when the surface tension of the fountain
solution is lower than 52.2 mN/m, the octane on the Non-
Image Area can be replaced by the fountain solution
spontaneously. However, in fact, the spreading coefficient,
S^, never becomes positive, and experimentally the octane
on the Non-Image Area is never replaced by the fountain
solution, as described, in Chapter 6-1-1, unless the surface
tension of the fountain solution is lower than 32 mN/m,
Therefore, the Kaelble method does not adequately explain
the experimental results.
The comparison between the values of I„ ps obtained
experimentally and those calculated using the Kaelble
theory was made. To define Yq for the Kaelb/le method, the
experimental data of the non-dispersion interaction energyt
-85-

o
CO
CD cn co
i C o
- vO
\
is)
LLI CD
""' _J"
CD c y co / o / * O /
- «NT
oo vO
( IU/NUI ) £70
0°^
CO
CD Cn CO CD
cn CO
to ^
00
f( UI/NUJ ) *?o
- CNi
CNJ
00
—,M
O]
QQ.
00
vO
CNJ
OO
CD O cz CO i_ CD -—-
o -o ■*-' o
CD -*= JZ CD
■~ E O o
.2 CD lt_> CO
CO s^* c
CD u"_
-w o .CD '-
To o
^ cz
■C O cz *— fO CD
^ JZ CD "*"^
CO CD
«*— o >^ O. cn 1— CD CD C_> CZ ro CD j_ CD Z3
CO
t: «> t/5
2=1 CD v.— cn :t= cz i_ CO
CO
cn
-86-
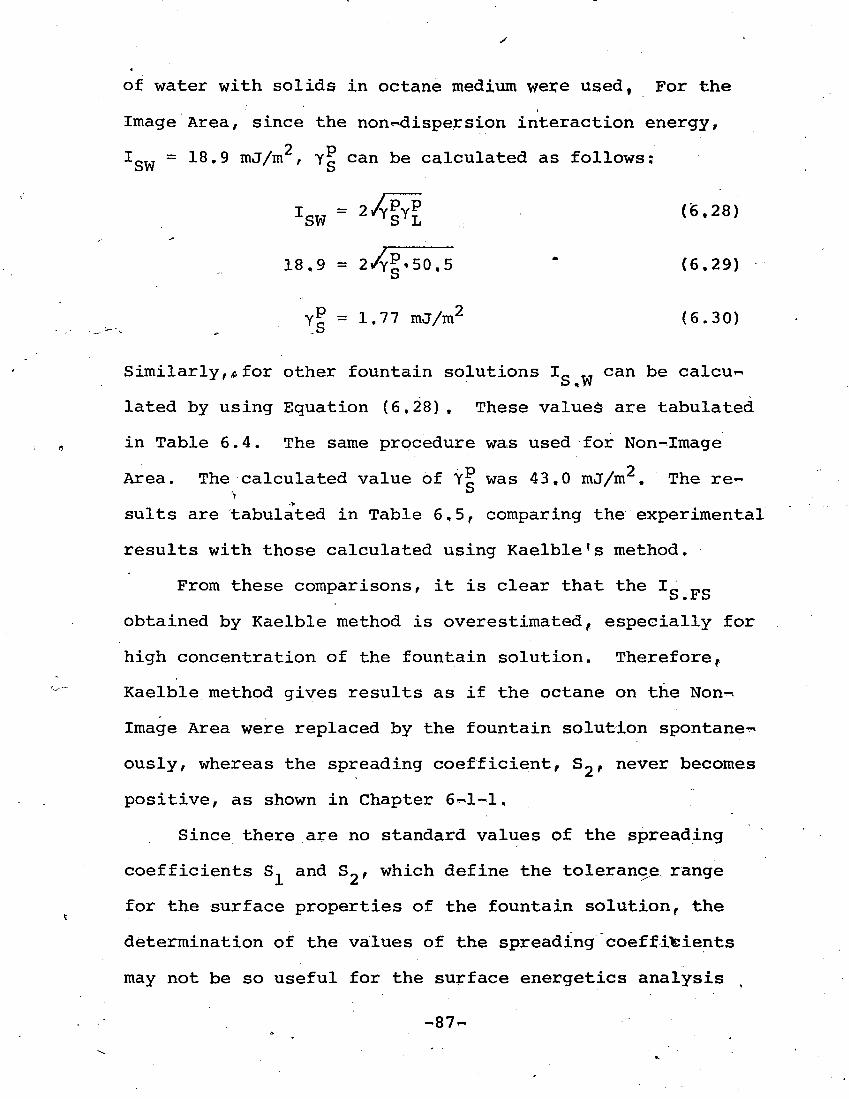
of water with solids in octane medium were used, For the
Image Area, since the non-^dispersion interaction energy,
Isw = 18.9 mJ/m , Y~ can be calculated as follows:
TSW = 2^¥l : (6-28)
18.9 = 2/^*50.5 * (6.29)
yP = 1.77 mJ/m2 (6.30)
Similarly,& for other fountain solutions I0 TT can be calcu~ b « W
lated by using Equation (6,28) , These valued are tabulated
in Table 6.4. The same procedure was used for Non-Image
Area. The calculated value of Y? was 43,0 mJ/m . The re- >
suits are tabulated in Table 6,5, comparing the experimental
results with those calculated using Kaelble!s method.
From these comparisons, it is clear that the I0 „_ b.rb
obtained by Kaelble method is overestimated, especially for
high concentration of the fountain solution. Therefore,
Kaelble method gives results as if the octane on the Non-n
Image Area were replaced by the fountain solution spontane-*
ously, whereas the spreading coefficient, S2r never becomes
positive, as shown in Chapter 6-^1-1,
Since there are no standard values of the spreading
coefficients S, and S2, which define the tolerance range
for the surface properties of the fountain solution, the
determination of the values of the spreading coefficients
may not be so useful for the surface energetics analysis
-87-
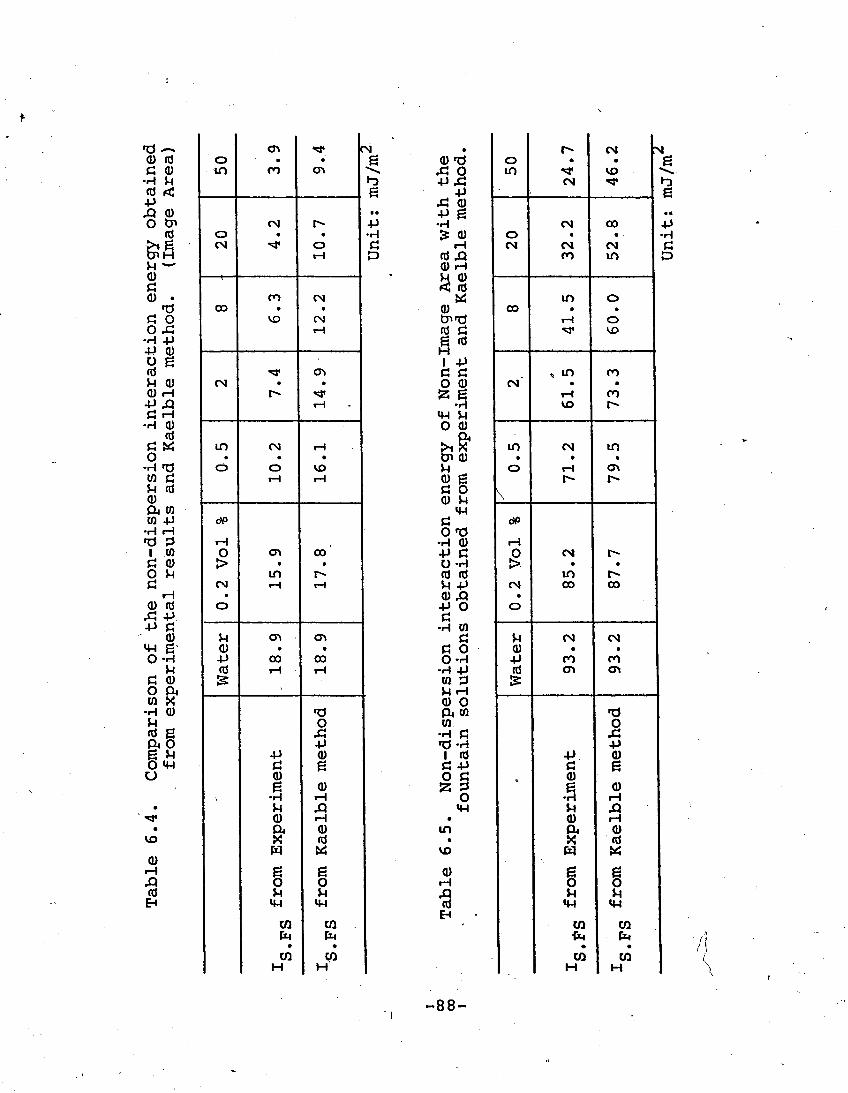
•a — en **. "N . r- CM N CD rd o • • g (U'o o • • g C <D iO ro en ^ ^o in ^ VD **^
•H U •O +»X5 CN ^ rO rd < 6 ^ .a a)
g •P ,Q a) -p g • • o o> CN r> -P -H CN 00 ■P
rd o • • •H £ (D o • * • •H
DJH (N •<* o C rH CM CN CN C
rH P rd,Q CO in D (I) rH
• ll /It vu ^ rd
a) • en CN « ir» o T3 00 • • <u 00 • •
G o VO CM Cnnd rH o o .c rH rd C •^ vo
•H -p g fd -p (1) o g
k-l
i +> rd ■*r (T) a c * m CO U 0) CN • • O <D CN • • a) IH r^ •«# s g rH CO -P,Q rH •H VO r^ C rH
0 <D -H Q) rd ft c « IT) CN rH in CN in
o • • • • • • -H TJ O o VO ^ o rH a» W G rH rH <D g r> r- ^ rd C O V O cu u d, (Q to +J C»P c dp
•H rH cd »tf 3 rH •H CD rH
1 w O en 00 •P C 0 CN r- C Q) > • • O -H > • • O V4 in f^ rd rd in r^ C CM rH rH U -P CN 00 00
rH • CD,Q • a) rd O •P 0 O ^ -p
•H CO -P c Q) u en en d u CN CN
«H g o • • C O (0 • • O -H -p CO 00 O-H ■p co CO
S-l rd rH rH -H -P rd CT» en c a) IS CQ 3 & o ft MH
Q) 0 w X •H 0 •O ft CO -0 u O W 0 rd g A ■H C Si ft o -P TJ -H •P 6 u •P a) 1 rd ■P Q) o *U C g C -P C g u a) O C <D
g a) S 3 g (1) \ •H rH 0 •H rH
• r-4 .Q *H J-» A ■** <D H • 0) rH
• &
0) in ft Q) vo rd • X rd
w W vo w « 0)
rH g g a) g g .Q o o rH o O rd M u .Q u H EH iw
CO fa
CO 1 H
CO fa
CO 1 H
rd EH •
CO fa
CO H
CO fa
CO H
-88-
of lithography.
6-2. Work of Adhesion
Since the spreading coefficient gives only an indica-
tion whether a solid £s suitable for an image area or a non-
image area, another energetic, interaction term should be
considered to clarify the mechanism of lithographic printing.
The-work of adhesion may be one of the terms which control
the printing mechanism. The printing process can be divided
into two parts, the initial inking process and during
printing.
6-2-1. Initial Inking Process
A printing plate must be inked before printing. This
initial step is called the inking process. In practice, this
process is not so important. However, if an image area is
not hydrophobic enough, it would take time to build up a
reasonable ink film thickness on the image area or the image
area cannot have a reasonable ink film thickness with the
normal feeding of ink and fountain solution. If a non-image
area is not hydrophilic enough, the ink will deposit on the
non-image area with normal feeding of fountain solution.
For image areas, W (image-ink) > W (image«rFS) , and A A
for non-image areas, W (non-image-FS) > W_ (non-image-ink)
are required to build up a sufficient ink film thickness on
the image area without tinting or scumming.
To calculate the work of adhesion, the Kaelble theory
was used since the equations for this system have not been
-89-
developed. However, since the off-^set printing ink is
composed of mainly the dispersion component, the calculated
error would be small. From Kaelble's equation, the work
of adhesion is described as follows:
WA " 2/K + 2^ (6-31)
For the system: ink = octane; plate = sample 0-2; and
FS = water, the work of adhesion of octane on sample 0-2 is:
W = 2/48x21.8 = 64,9'mJ/m2 (6.32)
The work of adhesion of water on sample 0-2 is:
W = 72.3 (1 + cos 86,4) = 76,8 mJ/m2 (6,33)
Similarly, for the system: ink = ink; plate = sample 0-2;
and FS-= water, the work of adhesion of ink on sample 0-2
is:
r W_ = 2/48x29.7 + 2/0,02x0.50 = 75.7 mJ/m2
« • -i
where
YInk = 29'7' YLk - °-02
*0-2 " 48-°' TfP_2 - 0.50
The work of adhesion of water-^3n sample 0-2 is calculated if
from the contact angle of water on it in air. These works
of adhesion of the hydrophobic solids as well as the hydro-
philic solids with octane, ink, or the fountain solutions
are calculated and tabulated in Table 6.6, The following
-90-
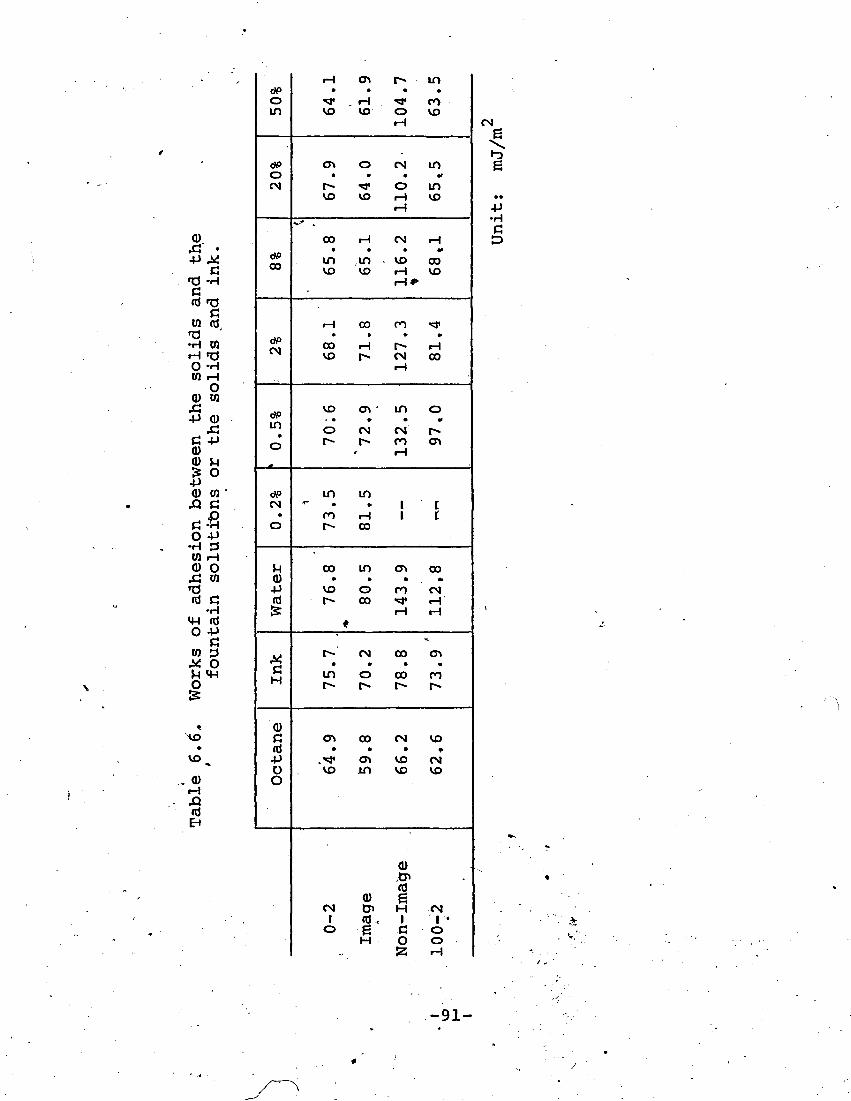
Xi • +> M
C 13 -H C rd T3
C W tO
T3 -H 01 ^T3 O -H W rH
O CD W
+i CD .a
c -P o <D 5 o ■p CD CO
P G -H O +> -H 3 W rH CD O Si W
cd C -H
«w id o +> c CO 3
o o
"vo
. cu iH .Q «d EH
rH o\ r» in <jp • • • » o ^r f\ •«* Cr» in vo vo o
rH VO
<*> o\ o CM m o • • • * CM r* rr O in
vo vo t-i rH
vo
V* .
CO rH CM rH • • • •»
OP 00 in in - VO 00
vo vo r-i vo t-i^
rH 00 m ^ • » • 1
CM 00 H r- rH VO r> CM CO
t-t
dP vo CTl ' in O • • • • *
in o CM CM r-<- o r» CO
r-i cri
_« ^
dP in in CM ** • * 1 [
• n rH 1 I O r-~ 00
u CO in a\ 00 o » •> • •» +J vo o en CM rd r- 00 ^ rH &
* rH rH
^
H
• in
CM
o
00 •
00
CT> •
t^- r* r^- r~
CD C cn 00 CM vo itf m • • »
■P .■^f o\ vo CM O vo in vo vo O
d) ,CP . fd
CD g CN tn H CM
1 cd„ 1 1 • o e c O
H o O .. 55 rH
CM
r3 g
•P •H C D
-91-
values were used for these calculations.
Y^ = 50 3 Y'P = 29 9 Non-Image " ' Non-Image
Y100-2 = 45'° ' Yl00-2 = 8a tUnit- roj/m2! >
From the results, since the work of adhesion of octane with
the Image Area is smaller than those with the fountain
solutions, octane is not suitable as an ink for this system.
On the other hand, the work of adhesion of ink with Image
Area is larger than those of the fountain solutions in con-'
centrations greater than 2 vol %. Therefore, to.lower the
surface tension of the fountain solution is preferable for
the initial inking process unless there is emulsification of
ink by the fountain solution. As for hydrophilic solids
such as the Non-Image Area or sample 100-2, the values of the
work of adhesion with octane and ink are calculated in the
absence of the fountain solutions. This is not a practical
case. » In the case of inking process, the fountain solution
wets the non-image areas before inking, so the direct inter*,
action of ink with the non-image areas can be prevented.
However/^1^|^^isJ^uld. Jhe, recognized that the work of adhesion
of the Non-Image Area with ink is quite large in the absence,
of water. To increase the surface tension of fountain solu-
tion is preferable for the adhesion of fountain solution on
non-image area,, whereas to lower the surface tension is
preferable for the work of adhesion of ink on image area,
- <-92-
6-6-2. During Printing '''■■*
Once the inking is completed, another interaction force
will take over the mechanism of printing. Since the image
area and the non-image area are covered with ink and foun-
tain solution, respectively, the fountain solution inter-
acts with ink on the image area and the ink interacts with
the fountain solution on the non-image area, and do not
interact with image area or non-image area directly any more.
Since it was found that octane cannot be used as an
ink in Chapter 6-2-1, only commercial ink is taken into con-
sideration, in this chapter. For an image area such as sample
0-2 or the Image Area, the work of adhesion of the ink is
equal to the work of cohesion of ink since it is provided
that the image area is covered with ink. Therefore, the
work of cohesion of ink is
W = W s 60 mJ/m2
On the other hand, the work of adhesion of water on ink is
as follows from the experiment:
W = 72.3 (1 + cos 105) =53,6 mJ/m2
This value is smaller than that of the ink, which indicates
that the ink adheres to ink, whereas water is repelled from
the ink film. The works of adhesion of the fountain solu-
tions were calculated from the contact angle measurements
on the dry ink film in air, and tabulated in Table 6,7.
-93-
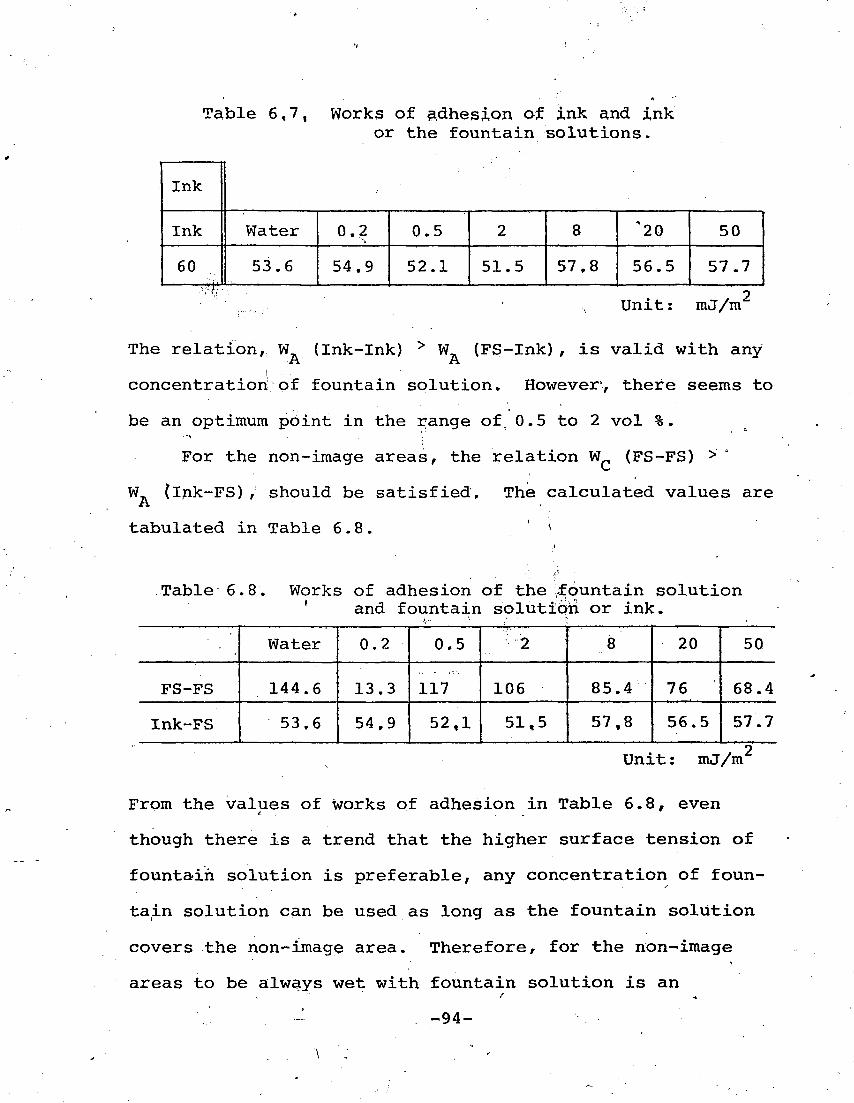
Table 6,7, Works of adhesion of ink and ink or the fountain solutions.
..... ._
Ink
Ink Water 0.2 0.5 2 8 *2Q 50
60 rrtr
53.6 54.9 52.1 51.5 57.8 56.5 57.7
Unit: mJ/m''
The relation, W (Ink-Ink) > W (FS-Ink), is valid with any
concentration of fountain solution. However*, there seems to
be an optimum point in the range of 0.5 to 2 vol %.
For the non-image areas, the relation W (FS-FS) > '
W (ink-FS)/ should be satisfied. The calculated values are
tabulated in Table 6.8. ' <
Table 6.8. Works of adhesion of the fountain solution ' and fountain solution or ink.
Water 0.2 0.5 2 8 20 50
FS-FS 144.6 13.3 117 106 85.4 76 68.4
Ink-FS 53.6 54,9 52,1 51,5 57 f 8 56.5 57.7
Unit: mJ/m
From the values of works of adhesion in Table 6.8, even
though there is a trend that the higher surface tension of
fountain solution is preferable, any concentration of foun-
tain solution can be used as long as the fountain solution
covers the non-image area. Therefore, for the non-image
areas to be always wet with fountain solution is an
_: -94-
important requirement, Since the works of adhesion of the
ink and the fountain solutions are smaller than the works
of cohesion of the ink as well as the cohesion of the
fountain solution, splitting occurs between the ink film
and the fountain solution. However, as the surface ten-
sion decreases, part of the fountain solution can be taken
away by ink.
This discussion on the work of adhesion shows that the
more hydrophobic the image.area and the more hydrophilic
the non-image area, the wider the effective range of the
fountain solution concentration when the commercial ink is
used for this system.
6-3. Work of Adhesion in Octane or in the Fountain Solutions
In Chapter 6-2, the work of adhesion of solids with
liquids in air was discussed, However, in any conditions,
the work of adhesion of the image arears should satisfy
W (image-ink) > W (image-FS) and, at the same time, A A.
W (non-image-ink) < WA (non-image-FS) for the non^image
areas. For-example, in the fountain solution media, the
fountain solution on the fton-Image Area must not be re-
placed by octane, whereas the fountain solution on the
Image Area must be replaced by octane. In Table 6.9, the
values of W of solids with octane JLn the presence of
water, 2% fountain solution and 8% fountain solution are
-95-
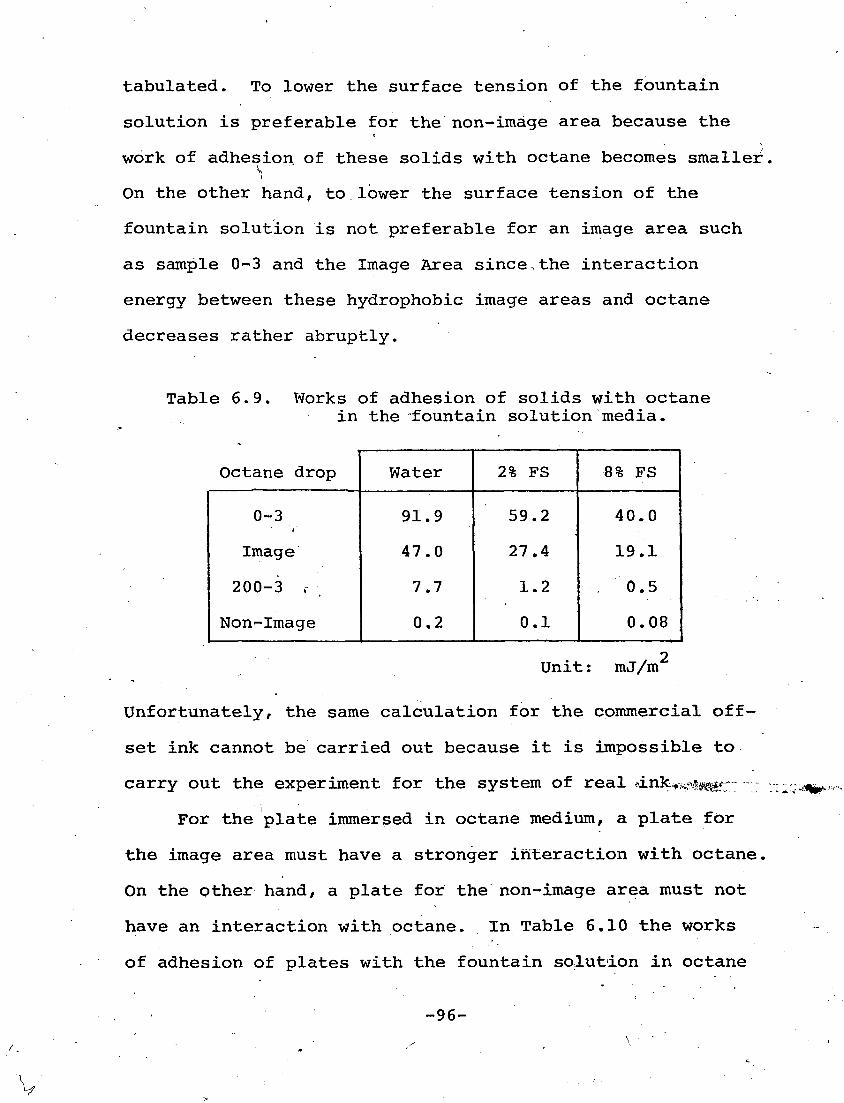
tabulated. To lower the surface tension of the fountain
solution is preferable for the non-image area because the
work of adhesion of these solids with octane becomes smaller.
On the other hand, to.lower the surface tension of the
fountain solution is not preferable for an image area such
as sample 0-3 and the Image Area since,the interaction
energy between these hydrophobic image areas and octane
decreases rather abruptly.
Table 6.9. Works of adhesion of solids with octane in the fountain solution media.
Octane drop Water 2% FS 8% FS
0-3 91.9 59.2 40.0
Image 47.0 27.4 19.1
200-3 r 7.7 1.2 . 0.5
Non-Image 0.2 0.1 0.08
Unit: mJ/m
Unfortunately, the same calculation for the commercial off-
set ink cannot be carried out because it is impossible to
carry out the experiment for the system of real dnk^^r-
For the plate immersed in octane medium, a plate for
the image area must have a stronger interaction with octane,
On the other hand, a plate for the non-image area must not
have an interaction with octane. In Table 6.10 the works
of adhesion of plates with the fountain solution in octane
-96-
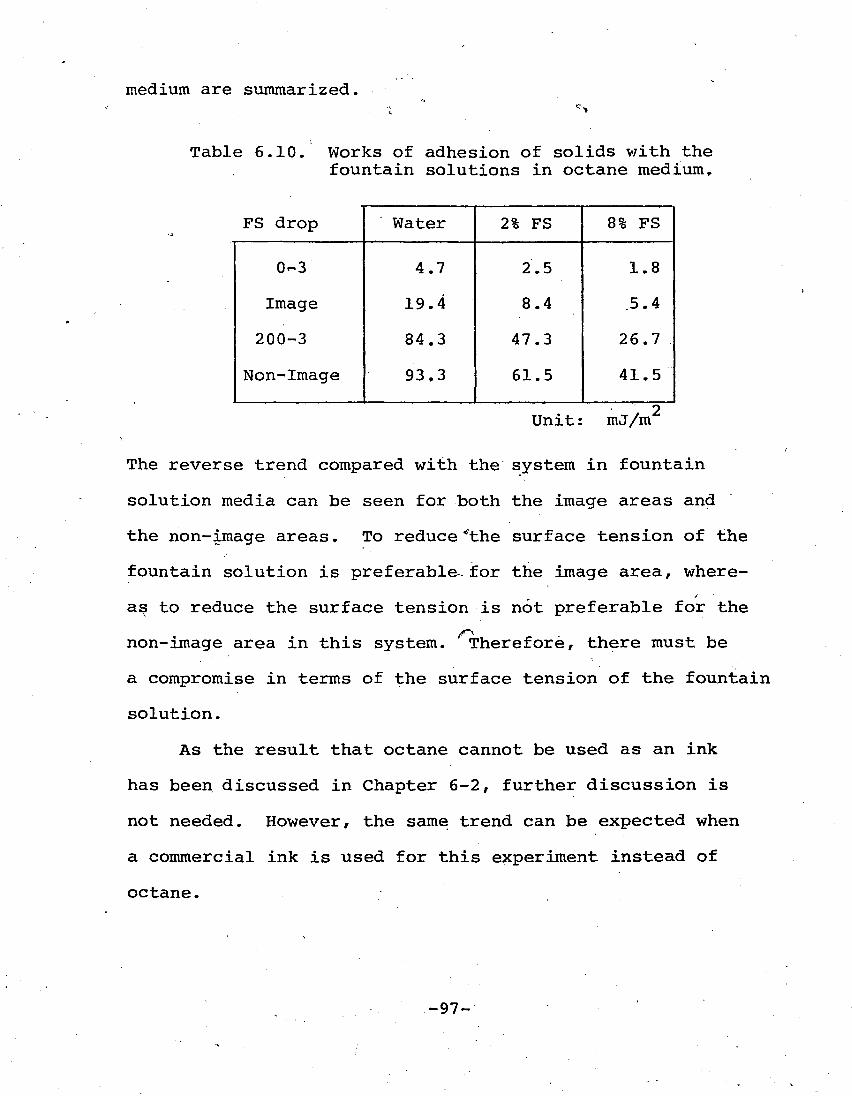
medium are summarized. ^
Table 6.10. Works of adhesion of solids with the fountain solutions in octane medium.
FS drop Water 2% FS 8% FS
0-3 4.7 2.5 1.8
Image 19.4 8.4 .5.4
200-3 84.3 47.3 26.7 .
Non-Image 93.3 61.5 41.5
Unit: 2 mJ/m
The reverse trend compared with the system in fountain
solution media can be seen for both the image areas and
the non-image areas. To reduce ""the surface tension of the
fountain solution is preferable- for the image area, where-
as to reduce the surface tension is not preferable for the
non-image area in this system. Therefore, there must be
a compromise in terms of the surface tension of the fountain
solution.
As the result that octane cannot be used as an ink
has been discussed in Chapter 6-2, further discussion is
not needed. However, the same trend can be expected when
a commercial ink is used for this experiment instead of
octane.
-97-
6-4. Tinting and Scumming
In this chapter, practical problems such as tinting
and scumming are related to the experimental results and
an explanation for these problems will be given.
From the experimental results, as long as there is
water on the non-image area, scumming will not take place,
since the work of adhesion of oil (octane) on the non-image
area in fountain solution is quite small. Wilkinson et al.
[53-57] proposed that scumming and tinting are regulated
by water leavel, w,hich affects the area of the image and
non-image part on the print, from the study on the spreads,
ing and wetting phenomena- in four-phase configurations.
However, because of the other factors such as blinding,
water mark, emulsification of ink, and picking, a large
amount of water canot be fed to the plate. A reasonable
feed of water should be taken into consideration. There-
fore, the first requirement is that the fountain solution
should wet non-image areas with normal feeding. This re-
quirement can be attained by means of lowering the surface
tension of fountain solution to a certain- extent. The rer>
quired value of the surface tension of fountain solution
varies according to the hydrophilicity of the non-image
area-. When the hydrophilicity of the non^image area is
low, the lower surface tension of the fountain solution
should be required. However, some other unfavorable
phenomena would be involved in this system such as
-98-
"~A
?4
enhancement of ink emuls;if i,cationf blindingf and tinting.
Blinding can be easily understood as the result of the
spreading coefficient of the fountain solution on the Image
Area, S2, increasing to the value which is close to the
value for the Non-Image Area as the surface tension of
fountain solution decreases. Thereforef some compromise
must be made to satisfy all these factors/
Besides these factors, the mechanical movement of
the off-set press should be considered. The plate normally
passes through four inking rollers, one after another.
Therefore, even though there is enough water on the nonr*
image areas, these inking rollers squeeze out the water
On the non-image areas as well as some water on the ink
film on image areas, Therefore, the print density does
not change too much within the tolerance limits of the
ink-water balance [58] , And the ink would adhere to the
non-image areas unless there is tightly adsorbed water on
the non-image areas. In this sense, the adsorbed gum
arabic has an important role to avoid scumming, even though
the scumming tendency of modern anodized plates is very
low, for both mechanical and chemical reasons [59] , go,
if the non-ima^e areas are not hydrophilic enough to hold
a minimum amount of water, the non^-image areas will be
adhered to by ink with the normal feed of fountain solution,
Banks et al, [60] proposed the mechanism of scumming
as follows. Ink components may shed films onto non-ima,ge
-99-
areas covered with water/t Scumming takes place on rerunning
after stoppage of the press. They show that a practical
way of avoiding this type of scumming is to use nonionic
surfactants or very low volatile alcohols such as 2-ethyl-
1,3-hexanediol in the fountain solutions. However, at
concentrations as high as 2,5% of this alcohol, there was
occasional evidence that ink transfer was reduced to such
levels as to give "weak" prints, Zettlemoyer et al. [61^
63] also studied the adsorption of hydrophobic substance
such as octanoic acid on aluminum plates. Bock 164] point-*
ed out some unique features of alcohols, such as rapid
wetting ability, volatility, lubricant and non^emulsifying
roles—which explain why tinting does not occur with alco-
hols, although there is a problem of tinting with nonionic
surfactants of low volatility (the surface tension of the
tested solution with nonionic surfactant was 16-27 mN/m).
On the other hand, Alexander [65] states that (1) a foun-
tain solution should have a high surface tension on the
plate, and (2) that a low surface tension is advantageous
only in the dampening system. The results/of this work
lead to the same conclusion as Alexander's, as described
in Chapter 6-2, i.e., the cohesion of water is the largest
value among dampening solutions and much larger than the
work of adhesion of ink and dampening water. However,
this conclusion is correct only if the water can wet the
surface of the non-image areas with the normal feeding.
-100-

As for tinting, several reasons—many of them almost
opposite—have been suggested for it,
1. Excessive emulsification of water in ink
[2,64,66] or ink in water [49,64,66,67],
2. Insufficient water feed [53,64,66,68] and
even excessive water feed [53] and, naturally,
excessive ink feed,
3. Excessive [5] and insufficient [68] surface
tension of the water and interfacial tension
[2,66] between the water and ink. i
It has also been postulated that tinting is the lower limit
of water feed tolerance [68f69].
However, considering all these reasons and our experi-
mental results, a clear picture for the mechanism of scum-?-,
ming and tinting can be obtained. Nonionic surfactant is
effective for preventing scumming in such a way that the
nonionic surfactant can emulsify the oil film transfered
from the ink into the fountain solution, so that the eimilsi*
' fied oil film can be easily removed from the non^-image area
by the dampening water on rerunning, even though the pla.te
is dried due to stoppage. Too much nonionic surfactant
can emulsify even the ink itself, causing tinting or a
weak image [70,71]. Volatile alcohols such as isopropyl i
alcohol are effective for lowering the surface tension
of the dampening solution without emulsifying the ink.
^101-
This helps wet the non-image areas completely, so that ad-
hesion of ink on the non-image areas can be avoided.
Therefore, a nonionic surfactant should be included
in the dampening water to a sufficient extent to emulsify
the oil film from the ink.' Alcohols can be added to this'
dampening water to lower the surface tension to the level
at which the dampening water can spread on the non-image
areas. However, there are two factors which limit this
value of the surface tension. One is that the gum arabic
should not be precipitated owing to the presence of alco-
hols [72], since gum arabic cannot be dissolved by alcohols.
The other factor is that the dampening water should not wet
the ink film on the image areas, since the inking process
may be hindered and give a weak imaget The contact angle
of the dampening water on the ink film should not be less
than 45-50°'.' According to the experimental- results of the .
dry ink film (Fig, 5.3), the surface tension of the dampen-
ing water should not be lower than 34 mN/m for this ink.
Therefore, the surface tension may be adjusted by nonionic
surfactant and isopropylalcohol. The amount of nonionic
surfactant depends on the composition of the ink used.
*102-
7. CONCLUSIONS
Several experiments have been carried out to determine
the mechanism of lithographic printing. The following find-
ings were obtained from these experiments,
1. The non-dispersion interaction energy of
photo-oxidized polystyrene film increases
greatly, whereas the dispersion component
decreases only a little as the exposure time*
increases. r
2. The non-dispersion interaction energy of
water and solid measured in octane has al*-
most the same value as that in air, whereas
the non-cjispersion interaction energy mea-
sured in water by octane has higher values.
The difference between those measured in air
or in octane, and those measured in water,
comes from measuring the advancing contact
angles of water or receding contact angles of
water, respectively. However, the differ-
ence of non-dispersion interaction values
measured in air and in octane medium may
be explained by the film pressure effect,
TT . The non-dispersion interaction energy
of a solid measured in water media is more
-103-
sensitive to the degree of hydrophilicity
of the solid.
3. The dispersion component of the Non-Image
Area of a Kodak Polymatic lithographic plate
was 50.3 mJ/m by methylene iodide. This
value seems small compared with the dis-
persion component of other metal oxides
determined from gas adsorption. However, by
measuring the contact angle of methylene
iodide and a-bromonaphthalene on the Nonr*
Image Area in water, its dispersion energy
was 47,0 mJ/m and the nonr-dispersion inter-
action energy with water was 109,0 mJ/m2.
4. Cationic surfactants cannot be used as
one of the ingredients of a fountain solu.ry
tion since the adsorption of a cationic sur-
factant on surfaces makes them hydrophobic.
This was demonstrated by measuring the contact
angle of the cationic surfactant solution on
solids in octane,
5. Nonionic surfactants can be used in a foun-
tain solution as-one of the ingredients.
However, the surface tension of the solution
should not be lower than a critical value at
which emulsification of ink may be severe
and cause tinting,
-104-

6. Gum arabic adsorption on the non-dmage areas
at low pH can help repel ink adsorption on
the non-image areas. One to two percent
gum arabic solution may be needed for this
purpose.
7. The spreading coefficients S, and S^ never
become positive. These values do not give
a solution for the mechanism of lithographic
printing, According to the Kaelble method,
at certain concentrations of the fountain
solution, octane should be repelled from
the Non-Image Area by the fountain solution
spontaneously. However, experimentally,
the split did not take place with any con^
centration of the fountain solution; in<-
stead, it gave a finite contact angle. It
. was found that the non-dispersion inter-
action energy was overestimated by' using
the Kaelble method.
2--c.v:'maffl printing process can be divided into
an initial printing and a during printing
stage. For the initial printing process,
W (image-ink) > W (image-FS) should be
satisfied for image areas; otherwise, it
will take too long a time for the image
areas to build up an ink film of sufficient
-105-
thickness^ or the ink film may be very thin.
After the initial inking process, W (ink"
ink) > W (ink-FS) for the image areas, and
W (FS-FS) > WA (FS-ink) for the non^image
areas, should be satisfied provided that the
non-image areas are wetted by the fountain
solution. In general, once the image areas .
and non-image areas are covered with ink
and fountain solution, respectively, thiss
requirement will be satisfied,
9. The surface tension of the fountain solu-
tion should be chosen according to the
nature of the image* area and the non-image
area. The more hydrophobic the image area
and the more hydrophilic the non-image area,
the wider the latitude for the surface
tension of the fountain solution,
10, With consideration of the contact angle of
the diluted commercial fountain solution
on the ink film, the minimum surface tension
can be decided and adjusted by nonionic sur-
factants and isopropylalcohol (for this
system y = 34 mN/m), The amount of nonionic
surfactant required depends on the nature of
the ink used. The role of the nonionic
surfactant is to emulsify oil leached from the
-106-
ink, whereas the role of the isopropyl alco^
hoi is to spread on the non^-image areas
easily without emulsifying the ink. This
consideration may avoid tinting and scumming,
J\.
-107T
REFERENCES
1. Tollenaar, D., 12th IARIGAI Conference, Versailles 1973.
2. Schlapfer, K., 13th IARIGAI Conference, Wildhous 1975.
3. Padday, J. F., Printing Technology 1969, 13 (1), 23. » • ' ' ' ■■■■■I "i i ™ ■ i »i . i
4. Badescu, Th.; Papahagi, L., Bui. Inst. Politeh. Bucuresti, 1969, 31, 37.
5. Kaelble, D. H., Dynes, P. J., "Adhesion Science and Technology" Vol. 9B, Plenum Publ., New York, 1975.
6. Fowkes, F. M., Ind. Eng. Chem., 1964,* 56, 40.
7. Fowkes, F. M., "Fundamental Phenomena in the Materials Sciences" Vol. 2, Plenum Press, New York, 1966.
8. Girifalco, L. A.., Good, R. J., J. Phys. dhem., 1957, 61, 904.
9. Blanks, R. F, Prausnitz, J. M., Ind. Eng. Chem., 1964, 3, 1.
10. Gardon, J. L. , Paint Technol., 1966, 38, 43. 1 * ■ ?^. *
11. Meyer, E. F., Wagner, R. E., J. Phys. Chem., 1966, 70, 3162. .~
12. Meyer, E. F., Wagner, R, E.f ibid., 1971, 75, 642.
13. Goody, W., J. Chem. Phys., 1939, 7, 93.
14. Goody, W., ibid., 1949, 8, 170.
15. Goody, W., ibid., 1941, 9, 204.
16. Small, P. A., J. Appl. Chem,, 1953, 3_, 71,
17. Hansen, C. M., J. Paint Technol., 1967, 39^ 104f '505,
18. Drago, R. S., Vogel, G. C, and Needham, T. E,, J. Am. Chem. Soc., 1971, 93, 6014. ^
-108-

19. Fowkes, F. M,, AICHE Meeting, New York, 1977.
20. Tadros, M. E., Hu, P., and Adamson, A. W,, J. Colloid. Interface Sci., 1974, 49 (2), 184.
21. Hu, P., Adamson, A. W., ibid., 1977, 59 (3), 605.
22. Matijevic, E.f "Surface and Colloid Science Vol. 1", Wiley-Interscience, New York, 1969.
23. Andreas, J. M., Hauser, E. A., and Tucker, W. B., J. Phys. Chem., 1938, £2, 1001^
24. Zisman, W. A., Advan. Chem. Ser., 1964, 43, 1.
25. Ellison, A. H\ , Zisman, W. A., J. Phys. Chem., 1954, 58, 260.
26. Lee, L. H., "Adhesion Science and Technology Vol. 9B", Plenum Publ., New York, 1975.
27. Wu, S., CT. Phys. Chem., 1968, 72^ 3332.
28. Dann, J. R., J. Colloid. Interface Sci., 1970, 32 (2), 302., :
29. Dann, J. R., ibid., 1970, 32 (2), 321.
30. Tamai, K., Makuuchi, K., and Suzuki, M., J. Phys. Chem., 1967, 71 (13), 4176.
31. Tamai, K., Matsunaga, T., and Horiuchi, K., J. Colloid. Inteface Sci., 1977, 60 (1), 112. ' \t
32. Panzer, J., ibid., 1973, 44 (1), 142.
33. Wu, S., J. Adhesion, 1973, 5, 39.
34. El-Shimi, A., Goddard, E^y D; r3^^^^^^—- " ^rjjaterf ace Sci., 1974, 48 (2), 242.
35. El-Shimi, A., GOddard, E. D., ibid., ~1974, 43 (2), 249.
36. Good, W. R., ibid., 1973, 44_ (1), 63.
\ 37. Good, R. J., Koo, M. N., ibid., 1979, 71 (2), 283.
38. Sharpies, L. K., Plast. Polym., 1969, 37, 135.
39, Hiemenz, P. C, "Principles of Colloid and Surface Chemistry" Chapter 6.12, Marcel Dekker, New York, 1977.
-109-

«&
40. Severn/ I, D., Burring, S, L,{ "Wetting, Spreading, & Adhesion", Academic Press, London, 1978.
41. Fox, R. B., Price, T. R,, and Cain, D. S., Advan. Chem. Ser., 1968, 87_, 72.
42. Hamilton, W. C, J. Colloid. Interface Sci. , 1972, 40 (2), 219.
43. Bagnall, R. D., Green, G. F., ibid., 1979, 68 (2), 387. "7
44. Coupe, R., "Science of Printing Technology" p. 92, Cassell, 1966.
45. Beatner, G. C, Proceedings Technical Assn. of Graphic Arts, May 1951.
46. Adams, R. A. C., Int. Bull, for the printing and Allied Trades, 1956, NO. 73, 30.
47. Marton, J., Lipovac, S. N., Tappi, 1974, 57 (7), 86.
48. Bassett, D. R., M.S. Thesis, Lehigh University, 1963,
49. Schaeffer, W. D», Kuo, C. Y., Zettlemoyer, A. C, "Ad~ vances in Printing Science and Technology" p, 247, Pentech Press, London, 1962.
50. Labbauf, A., GATF Research Department Report of Progress, p. 225, 1970. .*.
51. Adams, R. A. C, Print, Tech. , 1971 ^'15 (2), 29.
52. Kaelble, D. H., J. Appli. Poly. Sci,, 1974, 18, 1869.
53. Wilkinson, M, C, Aronson, M. P,, Vanderhoff, J, W,, and Zettlemoyer, A. C, "Adhesion Science and Technology" Vol 9B, Plenum Publ., New York, 19751
54. Wilkinson, M, C, Zettlemoyer, A, CM AronsQnp ^t PT, and Vanderhoff, J. W., J. Colloid. Interface Sci., 1979, 68! (3) , 508.
55. Wilkinson, M. C, Ellis, R., Aronson, M. P., Vanderhoff, J. W., and Zettlemoyer, A. C, ibid., 1979, 6£ (3) 545.
56. Wilkinson, M. C, Mattison, I. C, Zettlemoyer, A, C.f Vanderhoff, J. W., and Aronson, M. P., ibid., 1979, 68 (3), 560.
•110-
57. Wilkinson, M, C, f Ardnson, M, P., Zettlemoyer, A. C, and Vanderhoff, J. W,, ibid., 1979, £8 (3), 575.
58. Lehtonem, T., Simomaa, K., 14th IARIGAI Conference, p. 21, Marbella, 1977.
59. Manninen, M., Virtanen, J,, Graphic Arts in Finland, 1975, 4, 9.
60. Banks, W. H., Charlesworth, D, H., Smith, A. H., 10th IARIGAI Conference, Vienna, 1969.
61. Lavelle, J. A,, Schaeffer, W, D., and Zettlemoyer, A. C, Taga, 1967, 127.
62. Lavelle, J. A., Schaeffer, W. D,, and Zettlemoyer, A. C, ibid. , 1967, 277.
63. Schaeffer, W. D., Bassett, D, R., Kuo, C, Y., and Zettlemoyer, A. C, ibid, , 1965, 17.
64. Bock, R. F., 10th IARIGAI Conference, Vienna, 1969.
65. Alexander, M., FOGRA-Forschungsbericht 5, 203, Munich, 1975.
66. Karttunen, S., Manninen, M., 14th IARIGAI Conference, Marbella, 1977.
67. Rostedt, C. 0., Madsen, E. S,, Print. Tech., 1966, 10, 18.
68. Decker, P., Thesis for dissertation, Technical University Munich, 1974/
69. Pyliotis, D., FOGRA Forshungs-Bericht 3.214, Munich ;L974, p. 39.
70. Lindqvist, U,, Graphic Arts in Finland, 1976, 5, 32.
71. Rostedt, C. O., Madsen, E, S., prin. Tech., 1966, 10, 18. "~~
72. Subt, S. S. Y., Praskievicz, R. W,, and Materazzi, A. R., Tappi, 1979, ST, 95.
-Ill-
VITA
Yonezo Kato was born on February 11, 1949,
in Saitama, Japan, the son of Hideo and Kiku Kato.
He attended Kasukabe High School in Saitama and
entered Chiba University in Chiba in April, 1967.
Yonezo graduated with a Master of Science degree
in Image Science and Engineering in March, 1973
and immediately afterwardte accepted a position
as a research chemist for Oji Paper CO., Ltd.
in Tokyo, Japan. While working for Oji Paper CO.,
Ltd. he was selected as a foreign student by his
company and entered the Graduate School at Lehigh
University in August, 1978.
-112-