surface circulation and the transport of the loop current ... · bisman nababan university of south...
TRANSCRIPT

OCS Study MMS 2001-102
Surface Circulation and the Transport of the Loop Current in the Northeastern Gulf of Mexico
Final Report
x - . ~.r? .
US . Department of the Interior Minerals Management Service Gulf of Mexico OCS Region


OCS Study MMS 2001-102
Surface Circulation and the Transport of the Loop Current into the Northeastern Gulf of Mexico
Final Report
Authors
Frank E . Muller-Karger University of South Florida
Fred Vukovich SAIC
Robert Leben University of Colorado
Bisman Nababan University of South Florida
Chuanmin Hu University of South Florida
Doug Myhre University of South Florida
Prepared under MMS Contract 1435-01-97-CA-30857 by University of South Florida Department of Marine Science 140 7"' Avenue, South St. Petersburg, Florida 33701
Published by
U.S. Department of the Interior New Orleans Minerals management Service Gulf of Mexico OCS Region December 2001

DISCLAIMER
This report was prepared under contract between the Minerals Management Service (MMS) and the University of South Florida. This report has been technically reviewed by the MMS, and it has been approved for publication. Approval does not signify that the contents necessarily reflect the views and policies of the MMS, nor does mention of trade names or commercial products constitute endorsement or recommendation for use. It is, however, exempt from review and compliance with the MMS editorial standards.
REPORT AVAILABILITY
Extra copies of this report may be obtained from the Public Information Office (Mail Stop 5034) at the following address :
U.S . Department of the Interior Minerals Management Service Gulf of Mexico OCS Region Public Information Office (MS 5034) 1201 Elmwood Park Blvd. New Orleans, Louisiana 70123-2394
Telephone : (504) 736-2519 1-800-200-GULF
CITATION
Suggested citation :
Muller-Karger, F.E., F. Vukovich, R. Leben, B. Nababan, C . Hu, and D. Myhre. 2001 . Surface Circulation and the Transport of the Loop Current into the Northeastern Gulf of Mexico : Final Report . OCS Study MMS 2001-102, U.S . Dept. of the Interior, Minerals Management Service, Gulf of Mexico OCS Region, New Orleans, La. 39 pp.
iii


TABLE OF CONTENTS
Page
LIST OF FIGURES. . . . . . . . . . . . . . . . . . . . . . . . . . . . . . . . . . . . . . . . . . . . . . . . . . . . . . . . . . . . . . . . . . . . . . . . . . . . . . . . . . . . . . . . . . vii
LIST OF TABLES . . . . . . . . . . . . . . . . . . . . . . . . . . . . . . . . . . . . . . . . . . . . . . . . . . . . . . . . . . . . . . . . . . . . . . . . . . . . . . . . . . . . . . . . . . . ix
ACKNOWLEDGMENTS . . . . . . . . . . . . . . . . . . . . . . . . . . . . . . . . . . . . . . . . . . . . . . . . . . . . . . . . . . . . . . . . . . . . . . . . . . . . . . . . . . xi
1 . SUMMARY OF PROJECT RESULTS . . . . . . . . . . . . . . . . . . . . . . . . . . . . . . . . . . . . . . . . . . . . . . . . . . . . . . . . . . . . . . 1
1 .1 . Circulation . . . . . . . . . . . . . . . . . . . . . . . . . . . . . . . . . . . . . . . . . . . . . . . . . . . . . . . . . . . . . . . . . . . . . . . . . . . . . . . . . . . . . . . . . . 1
1 .2 . Sea Surface Temperature (SST) . . . . . . . . . . . . . . . . . . . . . . . . . . . . . . . . . . . . . . . . . . . . . . . . . . . . . . . . . . . . . . . . . 1
1 .3 . Sea Surface Pigment Concentration . . . . . . . . . . . . . . . . . . . . . . . . . . . . . . . . . . . .- . . . . . . . . .- . . . . . . . . . . . . . . 2
1 .4 . Altimetry. . . . . . . . . . . . . . . . . . . . . . . . . . . . . . . . . . . . . . . . . . . . . . . . . . . . . . . . . . . . . . . . . . . . . . . . . . . . . . . . . . . . . . . . . . . 2
1 .5 . Field Programs . . . . . . . . . . . . . . . . . . . . . . . . . . . . . . . . . . . . . . . . . . . . . . . . . . . . . . . . . . . . . . . . . . . . . . . . . . . . . . . . . . . . 4
1 .6 . Other MMS-Related Programs . . . . . . . . . . . . . . . . . . . . . . . . . . . . . . . . . . . . . . . . . . . . . . . . . . . . . . . . . . . . . . . . . . 5
2. ON THE SURFACE CIRCULATION OF THE NORTHEASTERN GULF OF MEXICO AS INFERRED FROM SURFACE DRIFTER, SATELLITE ALTIIVIETRY, AND NOAA AVHRR DATA . . . . . . . . . . . . . . . . . . . . . . . . . . . . . . . . . . . . . . . . . . . . . . . . . . . . . . 9
2.1 . Introduction . . . . . . . . . . . . . . . . . . . . . . . . . . . . . . . . . . . . . . . . . . . . . . . . . . . . . . . . . . . . . . . . . . . . . . . . . . . . . . . . . . . . . . . . 9
2.2 . Methods . . . . . . . . . . . . . . . . . . . . . . . . . . . . . . . . . . . . . . . . . . . . . . . . . . . . . . . . . . . . . . . . . . . . . . . . . . . . . . . . . . . . . . . . . . . . 11
2.3 . Results. . . . . . . . . . . . . . . . . . . . . . . . . . . . . . . . . . . . . . . . . . . . . . . . . . . . . . . . . . . . . . . . . . . . . . . . . . . . . . . . . . . . . . . . . . . . . 13
2.3 .1 . Satellite and Drifter Data. . . . . . . . . . . . . . . . . . . . . . . . . . . . . . . . . . .- . . . . . . . . . . . .- . . . . . . . . . . . . . . 13
2.3 .2 . Winds . . . . . . . . . . . . . . . . . . . . . . . . . . . . . . . . . . . . . . . . . . . . . . . . . . . . . . . . . . . . . . . . . . . . . . . . . . . . . . . . . . . . . . 14
2.3 .3 . Cross-Shelf SST Differences. . . . . . . . . . . . . . . . . . . . . . . . . . . . . . . . . . . . . . . . . . . . . . . . . . . . . . . . . . . 15
2.4 . Discussion . . . . . . . . . . . . . . . . . . . . . . . . . . . . . . . . . . . . . . . . . . . . . . . . . . . . . . . . . . . . . . . . . . . . . . . . . . . . . . . . . . . . . . . . . 16
2 .5 . Conclusions . . . . . . . . . . . . . . . . . . . . . . . . . . . . . . . . . . . . . . . . . . . . . . . . . . . . . . . . . . . . . . . . . . . . . . . . . . . . . . . . . . . . . . . . 24
v

3. TRANSPORT OF LOOP CURRENT WATER INTO THE NORTHEASTERN GULF OF MEXICO . . . . . . . . . . . . . . . . . . . . . . . . . . . . . . . . . . . . . . . . . . . . . . . . . . . . . . . . . 25
3 .1 . Introduction . . . . . . . . . . . . . . . . . . . . . . . . . . . . . . . . . . . . . . . . . . . . . . . . . . . . . . . . . . . . . . . . . . . . . . . . . . . . . . . . . . . . . . . 25
3 .2 . Procedures . . . . . . . . . . . . . . . . . . . . . . . . . . . . . . . . . . . . . . . . . . . . . . . . . . . . . . . . . . . . . . . . . . . . . . . . . . . . . . . . . . . . . . . . . 25
3 .3 . Process in the NEGOM. . . . . . . . . . . . . . . . . . . . . . . . . . . . . . . . . . . . . . . . . . . . . . . . . . . . . . . . . . . . . . . . . . . . . . . . . . 26
3 .4 . Frequency Analysis. . . . . . . . . . . . . . . . . . . . . . . . . . . . . . . . . . . . . . . . . . . . . . . . . . . . . . . . . . . . . . . . . . . . . . . . . . . . . . . 29
3 .5 . Summary and Discussion . . . . . . . . . . . . . . . . . . . . . . . . . . . . . . . . . . . . . . . . . . . . . . . . . . . . . . . . . . . . . . . . . . . . . . . . 32
4. SYNTHESIS AND CONCLUSION. . . . . . . . . . . . . . . . . . . . . . . . . . . . . . . . . . . . . . . . . . . . . . . . . . . . . . . . . . . . . . . . 34
5 . REFERENCES . . . . . . . . . . . . . . . . . . . . . . . . . . . . . . . . . . . . . . . . . . . . . . . . . . . . . . . . . . . . . . . . . . . . . . . . . . . . . . . . . . . . . . . . . 36
vi

LIST OF FIGURES
Pale
1 .1 . December 18, 1998, composite SST image with 17-cm SSHA contour overlaid . . . . . . . . . . . . . . . . . . . . . . . . . . . . . . . . . . . . . . . . . . . . . . . . . . . . . . . . . . . . . . . . . . . . . . . . . . . . . . . . . . . . . . . . . . . . . . . . . . 4
1 .2 . Comparison of the chlorophyll-a along the ship transect lines from ship and satellite (SeaWiFS) for several NEGOM cruises . . . . . . . . . . . . . . . . . . . . . . . . . . . . . . . . . . . . . . . . . . . . 6
1 .3 . Comparison of the CDOM absorption at 443 nm, ag443 (m-'), along the ship transect lines estimated from ship and satellite (SeaWiFS) for (a) NEGOM3 and (b) NEGOM4. . . . . . . . . . . . . . . . . . . . . . . . . . . . . . . . . . . . . . . . . . . . . . . . . . . . . . . . . . . . . . . . . . . . . . . . . 7
1 .4 . Comparison of sea surface temperature (SST, °C) along the ship transect lines estimated from ship and satellite (AVHRR) for the NEGOM cruises. . . . . . . . . . . . . . . . . . . . . . . . . . . . . . . . . . . . . . . . . . . . . . . . . . . . . . . . . . . . . . . . . . . . . . . . . . . . . . . . . . . . . . . 8
2.1 . Mean SST distribution for March 1996 . . . . . . . . . . . . . . . . . . . . . . . . . . . . . . . . . . . . . . . . . . . . . . . . . . . . . . . . . . . . 17
2.2 . Monthly mean sea-surface velocity vectors at the shelf break off the west Florida Shelf (28 °N, 85 °W) in 1996 . . . . . . . . . . . . . . . . . . . . . . . . . . . . . . . . . . . . . . . . . . . . . . . . . . . . . . . . . . . . . . . 18
2.3 . Monthly mean sea-surface velocity vectors on the Northeastern Gulf of Mexico shelf near DeSoto Canyon (30 °N, 87 °W) in 1996 . . . . . . . . . . . . . . . . . . . . . . . . . . . . . . . . . . . . 18
2.4 . Mean SST distribution for July 1996. . . . . . . . . . . . . . . . . . . . . . . . . . . . . . . . . . . . . . . . . . . . . . . . . . . . . . . . . . . . . . . . 19
2.5 . Mean SST distribution for August 1996. . . . . . . . . . . . . . . . . . . . . . . . . . . . . . . . . . . . . . . . . . . . . . . . . . . . . . . . . . . . 20
2 .6 . Monthly mean sea-surface velocity vectors on the west Florida Shelf (28 °N, 84 °W).. . . . . . . . . . . . . . . . . . . . . . . . . . . . . . . . . . . . . . . . . . . . . . . . . . . . . . . . . . . . . . . . . . . . . . . . . . . . . . . . . . . . . . . 21
2.7 . Monthly displacements of the northern boundary of the Loop Current for the period January 1994 (month #1) through March 1999 (month #63) . . . . . . . . . . . . . . . . . . . . . . 21
2.8 . Monthly mean near surface currents for the period April 1997 through March 1999 . . . . . . . . . . . . . . . . . . . . . . . . . . . . . . . . . . . . . . . . . . . . . . . . . . . . . . . . . . . . . . . . . . . . . . . . . . . . . . . . . . . . . . . . . . . . 22
2.9 . Monthly mean wind velocity vectors from NDBC buoy 42036 on the west Florida Shelf (28 .51 °N, 84 .51 °W). . . . . . . . . . . . . . . . . . . . . . . . . . . . . . . . . . . . . . . . . . . . . . . . . . . . . . . . . . . 22
2.10. Monthly mean wind velocity vectors from NDBC buoy 42039 on the Northeastern Gulf of Mexico shelf (28.78 °N, 86.03 °W). . . . . . . . . . . . . . . . . . . . . . . . . . . . . . . . . . . . . . . 23
vii

3.1 . Frequency analysis (%) of Loop Current water directly associated with the Loop Current resides in the eastern GOM. . . . . . . . . . . . . . . . . . . . . . . . . . . . . . . . . . . . . . . . . . . . . . . . . . . . 26
3.2 . NOAA/AVHRR SST analyses for A) 15-17 January 2000, B) 18-20 January 2000, and C) 21-23 January 2000. . . . . . . . . . . . . . . . . . . . . . . . . . . . . . . . . . . . . . . . . . . . . . . . . . . . . . . . 28
3.3 . SeaWiFS ocean color analyses for A) 16-17 January 2000 and B) 18 January 2000... . . . . . . . . . . . . . . . . . . . . . . . . . . . . . . . . . . . . . . . . . . . . . . . . . . . . . . . . . . . . . . . . . . . . . . . . . . . . . . . . 28
3,4 . NOAA/AVHRR SST analyses for A) 25 March 2000, B) 28 March 2000, and C) 5 April 2000. . . . . . . . . . . . . . . . . . . . . . . . . . . . . . . . . . . . . . . . . . . . . . . . . . . . . . . . . . . . . . . . . . . . . . . . . . . . . . . . . . 30
3 .5 . SeaWiFS ocean color analyses for A) 28 March 2000 and B) 4-5 April 2000 . . . . . . . . . . . . . . 30
3 .6 . Frequency at which Loop Current water that is not directly associated with the Loop Current and/or a major ring is found in the eastern GOM. . . . . . . . . . . . . . . . . . . . . . . . . . . 33
viii

LIST OF TABLES
Page
2.1 . Sites at which mean monthly surface currents were derived from the drifter data and location of the nearest National Data Buoy Center's meteorological buoy . . . . . . . . . . . . . . . . . . . . . . . . . . . . . . . . . . . . . . . . . . . . . . . . . . . . . . . . . . . . . . . . . . . . . . . . . . . . . . . . . . 13
2.2 . The east-west SST difference on the west Florida Shelf (along the 28 °N latitude line) and the north-south SST difference on the shelf near the DeSoto Canyon (along the 87 °W longitude line) and the Mississippi Delta (along the 88.5 °W longitude line) . . . . . . . . . . . . . . . . . . . . . . . . . . . . . . . . . . . . . . . . . . . . . . . . . . . . . . . . . . 15
3.1 . Daily average wind direction and speed at NDBC Buoy # 42040 located at 29.2 °N and 88.3 °W for the period 25 March-5 April 2000 . . . . . . . . . . . . . . . . . . . . . . . . . . . . . . . . . 31
ix


ACKNOWLEDGMENTS
This work was supported by the Minerals Management Service, Gulf of Mexico, OCS Region,
under Contract Number 1335-01-97-CA-30857 . SeaWiFS data are property of Orbimage
Corporation and were processed and reproduced for this report following guidelines outlined in
the Dear Colleague Letter published by the National Aeronautics and Space Administration's
(NASA) SeaWiFS Project at the Goddard Space Flight Center. Wind data were obtained from the NOAA National Data Buoy Center . We would like to thank Peter Hamilton, SAIC, for his
support with the ADCP data from the MMS DeSoto Canyon Eddy Intrusion Study . We also
acknowledge the support of Peter Niiler, Scripps Oceanographic Institute, and MMS for
providing the monthly average SCiJLP-2 surface velocity vector data . We wish to thank Tom
Berger and Peter Hamilton (SAIC) for their support in providing current meter data in the
Northeastern Gulf of Mexico. We thank Dr. Doug Biggs and Dr. Norman Guinasso (TAMU)
who help us coordinate field data collection using the R/V GYRE. We also thank the GYRE crew
and other NEGOM cruise participants who provided help during field data collection.
xi


1. SUMMARY OF PROJECT RESULTS
1 .1 . Circulation
The surface circulation on and near the continental shelf in the Northeastern Gulf of Mexico was examined using monthly mean AVHRR sea-surface temperature images, TOPEX/ERS sea-surface height data, and current data derived from surface drifters deployed in 1996 . From January through July the mean flow at the shelf break in the DeSoto Canyon region was from west to east, and in the west Florida Shelf region from north to south. An anticyclonic jet followed the curvature of the shelf off the Florida Panhandle shelf break. In August, flow reversed and the mean surface currents at the shelf break were from south to north-northwest off the west Florida Shelf, east to west in the DeSoto Canyon region, and offshore in the Mississippi Delta region . This gave the flow a cyclonic curvature. The flow reversal seen in 1996 occurred as a major eddy separated from the Loop Current, and it persisted into the fall . Potential forcing functions leading to the observed circulation patterns include pressure gradients generated by seasonal temperature differences between shelf and deep Gulf of Mexico waters, the wind, and the Loop Current . Though, all of these factors seem to play an important role in defining the circulation of the region, no single process seemed to dominate the seasonal circulation on the shelf, but the circulation there seems to show these patterns every year .
1.2 . Sea Surface Temperature (SST)
For the period covered under this study (April 1997-December 2000), we collected
approximately 10,560 Advanced Very High Resolution Radiometer (AVHRR) SST images of
the Gulf of Mexico (GOM). These images are stored in high (1x1 km2 pixel) and low resolution
(2.8x4 .1 km2 pixel) . We have also computed monthly mean SST for the Gulf of Mexico for the
period of 1993-2000 . Near-real time and monthly mean SST images for the Gulf of Mexico can
be accessed at : http://imars.maEine .usfedu .
During the period of May-July 1998, we observed unusual upwelling along the coasts of the Florida Panhandle in the northeastern Gulf of Mexico. This led to 3-6 °C lower SST than normal (discussed in Chapter 2 of the second annual report). We also observed strong upwelling near the shelf break in the northeastern Gulf of Mexico after hurricanes Earl (September 2-4, 1998) and Georges (September 25- October 1, 1998) (discussed in Chapter 3 of the second annual report).
Using monthly mean AVHRR sea-surface temperature images, TOPEX/ERS sea-surface height data, and current data derived from surface drifters deployed in 1996, we examined the surface circulation on and near the continental shelf in the Northeastern Gulf of Mexico. This study is discussed in Chapter II of this report .
Using AVHRR sea-surface temperature images, TOPEX/ERS sea-surface height data, and SeaWiFS images, we examined transport of Loop Current water into the Northeastern Gulf of Mexico for the period of January - March 2000. The detail of this study is presented in Chapter III of this report.

1.3 . Sea Surface Pigment Concentration
We collected approximately 2;400 SeaWiFS images (September 1997- December 2000) over the Gulf of Mexico and computed monthly means of chlorophyll-a concentration for the period September 1997 - December 2000. Near-real time SeaWiFS data can be accessed at : hccp://imars .marine.usf.edu (password protected site). In addition, the historical Coastal Zone Color Scanner (CZCS) data were processed to pigment products and then averaged to derive a series of 92 monthly pigment concentration means.
SeaWiFS images were collected with our local antenna and data were reprocessed when NASA introduced a new algorithm to calculate chlorophyll concentration . The NASA algorithm produces large errors in chlorophyll concentration in such coastal waters ; therefore, we have modified the algorithms to help process data over turbid waters .
Using SeaWiFS data, we found higher pigment concentration in upwelling areas during May-July, 1998, and after hurricane Georges (these findings are presented in Chapters II and III of the second annual report).
1.4 . Altimetry
At the University of Colorado, Gulf of Mexico near-real time sea surface dynamic height maps based on blended data from TOPEX/Poseidon (TOPEX) and the Second European Remote-Sensing Satellite (ERS-2) were updated continuously during the program. The Gulf of Mexico altimetry data have been available on-line at the following addresses:
" Near-Real-Time Altimeter Data: " Gulf of Mexico Near Real-Time Altimeter Data Homepape
(http://wwwccar.Colorado.edu/-realtime/gom/gom-nrt.html) " Gulf of Mexico Near Real-Time Data Viewer (http://www-ccar.colorado.edu/
-realtime/gom-real-time ssh) " Gulf of Mexico Near Real-Time Geostrophic Velocity Vector Viewer (http://www-
ccar.Colorado.edu/-realtime/tom-real-time vel) " Gulf of Mexico Along-Track Data Host (http://www-ccar.colorado.edu/
-realtime/gom data ssh/ssh.html) " Gulf of Mexico Along-Track Visualization (One Day) (http://www-
ccar.colorado.edu/-realtime/,gomdata ssh/sshpic.html) " Gulf of Mexico Along-Track Visualization (Multiple Day) (http://www-
ccar.colorado.edu/ -realtime/gom data_ssh/sshpic2.html) " Gulf of Mexico Along-Track Visualization (Multiple Day) (http://www-
ccar.colorado.edu/ -realtime/gom data_ssh/sshpic2.htm1) " Latest Gulf of Mexico sea surface height maps (http://www-ccar.colorado.edu/
research/gom/html/latest nrt.html)
2

" Historical Gulf of Mexico Altimeter Data: " Gulf of Mexico Historical Data Viewer (http://www-ccar.colorado .edul
gom-historical ssh) " Gulf of Mexico Historical Geostrophic Velocity Viewer (http ://ccar.colorado.edu/
gom-historical vel)
A CD-ROM containing all of the historical altimetry data for the Gulf of Mexico from 1993 through the end of 1999 is now available. The final version of the processed data includes both sea surface anomaly relative to the 1993-1999 time period and an estimate of the total dynamic topography. A model mean is added to the sea surface height anomaly to produce an estimate of the total dynamic topography . We have used the 1993-1999 mean from the GOM model hindcast simulation performed for the MMS Deepwater Reanalysis and Synthesis Project.
Dr . Leben has developed a Loop Current Intrusion (LCI) index based on altimetry data, which analogous in spirit to the ENSO indices used to monitor El Nino.
Several integral measures of Loop Current properties including estimates of Loop Current area,
volume and circulation have been produced from the statistics of the historical data set . The
Loop Current circulation, which is estimated by a line integral of the velocity along the 17-cm sea surface height contour, is a proposed index for continuous monitoring of the Loop Current
penetration and shedding . The 17-cm contour was chosen by experience and success tracking the Loop Current and its eddies in altimetry and with a data assimilative model .
Quantitative comparisons of altimetry-derived currents to currents estimated from Lagrangian drifters were initiated . This work was done in collaboration with Peter Niiler and Carter Ohlmann, who supplied daily averaged horizontal velocity components derived from the Sculp I, II and III data sets . The data sets used for the comparison are the Sculp I daily velocity estimates co-located with descending TOPEX tracks . Co-location was determined by identifying daily Sculp I values within a 1/4° cell that also contains a TOPEX ground track point. In all, 2770 co-located positions were identified, of which 286 were in water of depth greater than 1500 meters . The horizontal velocities were used at each co-located point to determine the component perpendicular to the TOPEX tracks . Crosstrack geostrophic velocities were computed from alongtrack sea surface slopes estimated by linear regression over data point windows of 23 points (125 km) along the TOPEX tracks . This allowed direct comparison of altimeter-derived currents with surface currents from drifters without interpolating the altimetry to a regular grid . First, we needed to examine at the altimeter/drifter crosstrack velocity correlation over the continental shelf/slope and the deep basin to determine the utility of the altimeter over those regions of the Gulf . Second, we needed to examine the correlation of the altimeter/drifter crosstrack velocities as a function of time lag between the observations . Significant correlations were found over the shelf, slope and deep basin. Decorrelation times decreased from 15 days over the continental slope and deep basin to 3-5 days over the LATEX shelf.
Dr. Leben also developed automatic eddy tracking software to track the Loop Current Eddy centers, as well as the perimeter of the eddy by using the 17-cm contour of SSH anomaly to define the areal extend of an eddy. Figure 1 .1 shows an example comparison of different data for Eddy Fourchon, shed in October 1997 .
3

1 .5 . Field Programs
We joined with Texas A&M University (MMS PM Worth Nowlin) to collect bio-optical field data on oceanographic cruises conducted in the NEGOM under the Chemical Oceanography and Hydrography Study (NEGOM-CHOS) . We participated in eight cruises : NEGOM2 (May 4-15, 98), NEGOM3 (Jul 26-Aug 8, 98), NEGOM4 (Nov 12-24, 98), NEGOM5 (May 14-28, 99), NEGOM6 (Aug 15-27, 99), NEGOM7 (Nov 12-22, 99), NEGOM8 (Apr 15-26, 00) and NEGOM9 (Jul 28-Aug 8, 00).
During these cruises, we collected water samples for Colored Dissolved Organic Matter (CDOM) or Gelbstoff Absorbance (ag), Particle Absorbance (aP), and Dissolved Organic Carbon (DOC) concentration . We also measured remote sensing reflectance (above and under water) . In addition, we measured attenuation and absorption of light at nine wavelengths at the surface with a continuous-flow a/c-9 meter and DOC fluorescence with a flow-through fluorometer. For NEGOM 6 and 7 cruises, we measured optical fluorescence of surface waters continuously using a SAFIRE instrument in collaboration
26
?4
22
20
is
ie
14
Figure 1 .1 . December 18, 1998, composite SST image with 17-cm SSHA contour overlaid . The + marks the eddy center as determined by the tracking toolbox . N-S and E-W bisections of the contour relative to the eddy center are shown by the o's.
with Carlos del Castillo (USF). During the NEGOM 7, we collected data with a Fast Repetition Rate Fluorometer (FRRF) operating in continuous flow mode in collaboration with Greg Mitchell (Scripps Institution of Oceanography) . We collected water samples for phycobiliprotein analysis in collaboration with Maria Vernet (University of Maryland) . We also participated on
4
=62 2E4 166 266 270 272 274 770 275 290
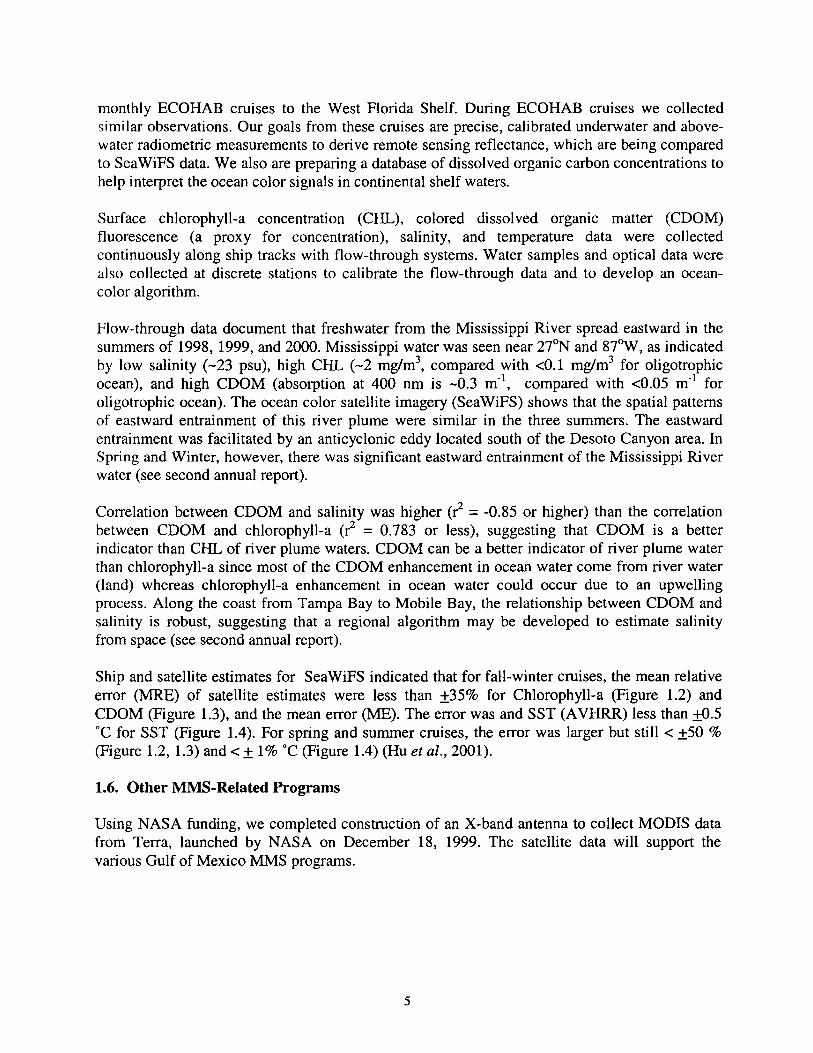
monthly ECOHAB cruises to the West Florida Shelf. During ECOHAB cruises we collected similar observations . Our goals from these cruises are precise, calibrated underwater and above-water radiometric measurements to derive remote sensing reflectance, which are being compared to SeaWiFS data. We also are preparing a database of dissolved organic carbon concentrations to help interpret the ocean color signals in continental shelf waters .
Surface chlorophyll-a concentration (CHL), colored dissolved organic matter (CDOM) fluorescence (a proxy for concentration), salinity, and temperature data were collected continuously along ship tracks with flow-through systems. Water samples and optical data were also collected at discrete stations to calibrate the flow-through data and to develop an ocean-color algorithm .
Flow-through data document that freshwater from the Mississippi River spread eastward in the summers of 1998, 1999, and 2000. Mississippi water was seen near 27°N and 87°W, as indicated by low salinity (-23 psu), high CHL (-2 mg/m3, compared with <0.1 mg/m3 for oligotrophic ocean), and high CDOM (absorption at 400 nm is -0.3 m', compared with <0.05 m' for oligotrophic ocean) . The ocean color satellite imagery (SeaWiFS) shows that the spatial patterns of eastward entrainment of this river plume were similar in the three summers . The eastward entrainment was facilitated by an anticyclonic eddy located south of the Desoto Canyon area . In Spring and Winter, however, there was significant eastward entrainment of the Mississippi River water (see second annual report) .
Correlation between CDOM and salinity was higher (r2 = -0.85 or higher) than the correlation between CDOM and chlorophyll-a (r2 = 0.783 or less), suggesting that CDOM is a better indicator than CHL of river plume waters . CDOM can be a better indicator of river plume water than chlorophyll-a since most of the CDOM enhancement in ocean water come from river water (land) whereas chlorophyll-a enhancement in ocean water could occur due to an upwelling process. Along the coast from Tampa Bay to Mobile Bay, the relationship between CDOM and salinity is robust, suggesting that a regional algorithm may be developed to estimate salinity from space (see second annual report).
Ship and satellite estimates for SeaWiFS indicated that for fall-winter cruises, the mean relative error (MRE) of satellite estimates were less than ±35% for Chlorophyll-a (Figure 1 .2) and CDOM (Figure 1 .3), and the mean error (ME). The error was and SST (AVHRR) less than ±0.5 °C for SST (Figure 1 .4). For spring and summer cruises, the error was larger but still < ±50 °Io (Figure 1 .2, 1 .3) and < ± 1% °C (Figure 1 .4) (Hu et al ., 2001).
1.6. Other NMS-Related Programs
Using NASA funding, we completed construction of an X-band antenna to collect MODIS data from Terra, launched by NASA on December 18, 1999. The satellite data will support the various Gulf of Mexico MMS programs .
5

x r2=0 .78, n=7246 MRE: -17.79'o x
~r 1 (a) 25 .9% ~ XC NEGOMI
x x x r k
1 ~9F
=0 .69, MRE: -12 .49'0 ~` (b) n7-7243 41 .2°10 x ' Nom., GOM2
3 ,
2
r r o
h C ~ x r =034n=7567 ' MRS: -32.4V. 4 ~x ~ ~ ~ lE y. )"' 52 .69'0 " ~ x n' x NAP
x x k k ~'" 4
* x a. ~ ~ x xz ~x x ~x x
1 ~ x ~ ~ " x
O X SeaWiF5 r2=0 .70, n=7926 7 k ~ ~~ ' n (d)
~,'!t ~` " iy /x Ll in situ MRE: -30 .39'0 ,~ )F.~ _ . .~ V1 ° 3 33.8% >5. k x ~e`
X x ~ '+~,
U 1 ''fir t a
r2=0.51, n=8693 MRE: -11 .89'0 (e) a � ~fi r 45.2% NEGOMS y x 3 2 x ~ r~
k r2=0 .63, n=8080 MRE: -22 .99'0
q ~ x 48 .1% x '~NEGOM6 3 r ~ ~ r '), '
y r x x x r
1 O
0 2000 4000 6000 8000 Data index along ship transect lines
Figure 1 .2 . Comparison of the chlorophyll-a along the ship transect lines from ship and satellite (SeaWiFS) for several NEGOM cruises . The OC2 algorithm (O'Reilly et al ., 1998) was used to estimate chlorophyll concentration from satellite data . The SeaWiFS data used in the comparison were composed using all the data in the corresponding cruise period .
6

0 .1
M 0.01
0 .1
0 2000 4000 6000 8000
Data index along ship transect lines
Figure 1 .3 . Comparison of the CDOM absorption at 443 nm, ag443 (m~t), along the ship transect lines estimated from ship and satellite (SeaWiFS) for (a) NEGOM3 and (b) NEGOM4. The MODIS algorithm (Carder et al ., 1999) was used to estimate CDOM absorption from satellite data .
7

24
22
20
18
16
24
az
31
30
U 0
E--~
29
26
24
22
20
18
28
26
24
32
31
30
29
V 2 r =095, n--7502 ME: -0 .44,034
NEGOMI
(b) I NEGOIVI2
(d) I
AVHRR ~ in situ r~=0.94, n=8615 ME:-0 .52.0.23
I I I
r2 =0 .59, n=9037 F~
ME: -0 .86, 0.64
RIM.
``
d NEGOMS
.52, n=8312 ME: -0 .63, 0 .19
k ~~ec~
k
I I I
x
NEGOM6 (f)
as 0 2000 4000 6000
Data index along ship transect lines soon
Figure 1 .4 . Comparison of sea surface temperature (SST, °C) along the ship transect lines estimated from ship and satellite (AVHRR) for the NEGOM cruises . The AVHRR data used in the comparison were composed using all the data in the corresponding cruise period .
8

2. ON THE SURFACE CIRCULATION OF THE NORTHEASTERN GULF OF MEXICO AS INFERRED FROM SURFACE DRIFTER, SATELLITE
ALTIMETRY, AND NOAA AVHRR DATA
2.1 . Introduction
The Northeastern Gulf of Mexico (NEGOM) is defined as the region north of 28 °N between the Mississippi River Delta and the Florida coast. This includes the Mississippi-Alabama shelf, the DeSoto Canyon region, and part of the Florida shelf known as the Big Bend. Understanding the circulation in this region is important because of the pressure for exploration for and mining of hydrocarbons on the shelf and in the adjacent deep-water region, and because this is one of the most biologically-productive areas within the Gulf of Mexico.
The circulation of waters on this continental shelf is strongly influenced by the wind and by buoyancy forces, and in the deeper water by the Loop Current and associated eddies (Vukovich, 1988; Vukovich and Hamilton, 1989). The Loop Current rarely penetrates north of 28°N in the pastern Gulf of Mexico (Vukovich et al., 1979) so that its direct influence in this region is considered occasional . The larger warm-core rings (WCRs) shed by the Loop Current typically move into the western Gulf and their influence in the NEGOM generally is short lived (Muller-Karger et al., 1991). Occasionally, errant anticyclones move into the NEGOM and lead to substantial upwelling events along the coast for periods exceeding 2-3 months (see, for example, Muller-Karger, 2000; Nowlin et al., 2000; Collard et al ., 2000; and Collard and Lugo-Fernandez, 1999).
Tolbert and Salsman (1964) and Gaul (1967) used drift bottles to study the circulation over the shelf in the NEGOM. Tolbert and Salsman released drift bottles immediately south of Panama City, and Gaul released them near the 200-m isobath south and west of Panama City . Only the beginning and ending points were reported, with the ending points being onshore. A majority of the drift bottles landed on the East Coast of Florida or between Apalachicola and the Mississippi River Delta. There were only two landings reported between Apalachicola and Key West (the west Florida Shelf.
Chuang et al. (1982) and Schroeder et al . (1987) concluded that the nearshore circulation off eastern Louisiana, Mississippi, and Alabama is strongly wind-dependent . Chuang et al. (1982) also found that winds during summer were relatively mild with magnitudes rarely exceeding about 8 m s"1, and that bursts spaced about 10 days apart were most likely associated with the passage of synoptic-scale weather systems. The Hellerman and Rosenstein (1983) climatological winds show that on average, winds in the NEGOM around 29 °N, 89 °W have a westward component on a year-round basis, with a southward component between January-March and September-December, and a northward component between April and August. The zonal component of these climatological winds has a minimum in July, and the meridional component has its minimum in August. However, if wind data are examined on an annual basis, each year may show a different mean orientation of the wind (Chuang et al., 1982). Indeed, the wind records from NDBC buoy No. 42040 show that winds in the NEGOM can be strong (>8 m s-1) and have variable direction during summers. Eastward winds >3 m s"' occurred 32% of the time between May and August only in 1998, compared to about 20-25% in 1996, 1997, and 1999 .
9

Clearly, inferences that are based on Hellerman and Rosenstein (1983) climatological wind products may be misleading because they average wind direction as well . Shifting winds can lead to an inconsistent summer circulation pattern on the shelf.
Yang and Weisberg (1999) used the Princeton Ocean Model (POM) to study the response of the west Florida Shelf to monthly mean climatological wind forcing. They found that the winter circulation (i.e ., the circulation in the period October through March) was characterized by an anticyclonic gyre in the Big Bend region, between the Alabama coast and Cape San Blas . Offshore transport occurred at the surface on the shelf near Cape San Blas, with coastal upwelling and relatively low coastal sea level . The summer shelf circulation (i.e ., the circulation in the period April through September) had a continuous northwestward flow at the surface, onshore surface transport, and relatively high coastal sea level in the Big Bend region . The depth-averaged flow on the shelf was primarily to the northwest year-round . The strongest surface flow was in the mid-shelf region along the 50-m isobath. The surface flow forced by the climatological winds on the outer shelf and at the shelf break was very weak .
Weisberg et al. (1996) described the variation of the mean monthly currents at various depths on
the west Florida Shelf at 28 °N, 84 °W from an Acoustic Doppler Current Profiler (ADCP) mooring for the period October 1993 through January 1995 . The flow at 10 m was primarily alongshore to the south-southeast January through July, with maxima between March and May.
The flow reversed and was to the northwest between August and December, with maxima between August and October. Weisberg et al . (1997) found a similar pattern in current meter
data for February 1995 through January 1996 . The flow pattern does not conform to the wind-
forced flow found in Yang and Weisberg (1999), particularly in the period January through July.
Weisberg et al. (1996) suggested that the seasonal flow patterns were baroclinically driven but
strongly modulated by the wind, particularly in the inner- and mid shelf regions. During the
winter, the water at the shelf break is warmer than that on the shelf. This configuration would
support a pressure gradient consistent with southward geostrophic flow. The density gradient is
reversed in the summer and geostrophic flow would be northward . They suggested that low salinity conditions near the coast in summer reinforced this pattern . However, they could not
adequately explain the springtime current maxima to the south-southeast.
Hetland et al. (1999) show that a southward shelf break jet is induced every year by a north-to-south pressure drop imposed on the shelf by the Loop Current (see also Csanady and Shaw, 1983). Numerical simulations of the GOM has shown that the southward shelf break jet extends onto the shelf when the Loop Current is south of 25 °N (Hsueh, Personal Communications, 2000 ; Hsueh et al., submitted) and the Loop Current approaches the west Florida Shelf nearly at a right angle .
In this study, trajectories of drifting buoys were examined with concurrent sea-surface temperature and sea-surface height observations from satellite based sensors collected in 1996 in an effort to characterize the circulation on and near the continental shelf in the NEGOM, to determine whether the observations of Weisberg et al. (1996) for 1994 and 1995 are representative of an annual circulation cycle, and whether these data support the model results of Hetland et al . (1999) .
10

2.2. Methods
Sea-surface temperature (SST) was derived from infrared observations collected by the Advanced Very High Resolution Radiometer (AVHRR) sensors flown on the NOAA polar orbiting satellites . The AVHRR images were collected using a High Resolution Picture Transmission (HRPT) antenna located at the University of South Florida, in St . Petersburg, FL. All passes (nighttime and daytime) were combined to build a time series . The navigation was manually corrected to compensate for errors in the satellite clock and orientation . SST was computed using the mufti-channel sea-surface temperature (MCSST) algorithm developed by McClain et al. (1985) . Through various comparisons (unpublished data), we have confirmed that the approximate root-mean-square error of the AVHRR SST retrievals are of the order of 0.5 °C (see also McClain et al ., 1983 ; Strong and McClain, 1984; Walton, 1988 ; Wick et al., 1992). Finally, the SST fields were remapped to a cylindrical equidistant projection covering the Gulf of Mexico at a spatial resolution of 2.8x4.1 km2. Mean monthly SST gradients between the coast and the shelf break were examined by subtracting SST values averaged within 1/2x 1/2 degree regions on : 1) the west Florida Shelf between 28 °N, 83 °W and 28 °N, 84.75 °W, and b) near the DeSoto Canyon from 30.25 °N, 87 °W to 30 °N, 87 °W.
Sea surface height (SSH) products generated at the University of Colorado incorporate data from the Ocean Topography Experiment (TOPEX) and the European Remote-Sensing Satellites (ERS) satellites . The TOPEX data were corrected using standard corrections supplied on the JPL/PO.DAAC TOPEX geophysical data records (GDR), including inverted barometer, electromagnetic bias, ionosphere and wet/dry tropospheric corrections, as recommended in the GDR handbook (Callahan, 1993). Data at each subsatellite point were differenced to the mean sea surface included on the GDRs (Basic and Rapp, 1992) to apply an implicit cross-track geoid correction . Several additional corrections not found on the original GDRs were also applied to the TOPEX data. These corrections included improved orbits based on the gravity model of Marshall et al. (1995) and the empirical ocean tide model of Desai and Wahr (1995) .
The ERS-1 and ERS-2 Altimeter Ocean Products (ALTOPR) CD-ROMs were obtained from CERSAT (the "Centre ERS d'Archivage et de Traitement") . The ERS altimeter data were corrected using standard corrections supplied on the GDRs as well, and were also corrected using the Desai and Wahr (1995) tide model to be consistent with the TOPEX processing .
Each cycle of corrected 10-day repeat TOPEX and 35-day repeat ERS data was linearly interpolated to reference ground tracks based on computed emphemerides for the satellites . The TOPEX reference track was based on a ground track computed for cycle 18, with a fixed spacing of the subsatellite reference points at one second along-track, which is approximately a 7 km spacing. The ERS 35-day reference ground track was based on 1/second along-track points computed for cycle 6 of the ERS-1 Multidisciplinary 1 mission phase. No gridding of the nonrepeat ERS-1 data was performed. An empirical orbit error correction was applied to the ERS along-track data, after gridding when appropriate, to remove residual ERS orbit error. An empirical correction of the TOPEX data was not needed. However, to consistently "filter" both data sets, the empirical correction was also applied to the TOPEX data . This correction was based on an along-track "loess" filter, which removes a running least squares fit of a tilt plus bias within a sliding window from the along-track data . The filter window was approximately 15
11

degrees of latitude (200 second along-track), passing the short wavelength mesoscale signals while filtering the longer wavelength orbit and environmental correction errors .
After extracting the data from the GDRs, applying the corrections, and along-track gridding/detrending, the corrected sea surface heights were referenced to an accurate high resolution mean sea surface based on altimeter data collected from the TOPEX/POSEmON, ERS-1 and GEOSAT Exact Repeat missions (Yi, 1996). By referencing the altimeter data to an independent mean sea surface, the climatology based on the blended TOPEX/POSEIIDON and ERS-1 data can be extended to include past climatologies referenced in the same manner as far climatologies produced from the historical GEOSAT data (Berger et al., 1996a,b) and those currently produced from the TOPEX/POSEIDON and ERS-2 data sets .
Monthly mean currents at 29.07 °N and 86 .33 °W and 12 m depth were computed based on ADCP data for April 1997 through March 1999 . The monthly means from the current meter data, the drifter data, and the wind data were calculated by computing the daily u- (positive to the east) and v- (positive to the north) components of the current vector and averaging them for each month .
Monthly mean displacements of the Loop Current's northern boundary were derived by ave~~~gging the distance between the northern boundary of the Loop Current and 30 °N measured using satellite SST, altimetry, and available in-situ data. The average distance for a given year was subtracted from each corresponding monthly average to produce de-trended monthly displacement anomalies . Positive values indicate a mean displacement to the North.
Surface drifters were released in 1996 and 1997 as part of a year-long effort sponsored by the Minerals Management Service (i.e ., SCL7LP-2). The surface drifters were released every two weeks between the 20-m and 60-m isobaths . Monthly mean surface currents were derived by spatially binning vectors of buoy trajectories within 1/2x1/2 degree areas (Muller-Karger et al., 1998). Three specific shelf locations were examined (Table 2.1). One location on the west Florida Shelf coincided with the location of the 1994 ADCP deployment of Weisberg et al. (1996). Other locations were one degree to the west on the shelf break of the West Florida Shelf and near DeSoto Canyon.
Mean monthly winds for 1996 were computed from wind records collected by meteorological buoys from the National Data Buoy Center (NDBC) (Table 2.1). Specifically, NDBC buoy numbers 42036 and 42039 were used since these were the closest to the areas where the mean monthly currents were estimated .
12
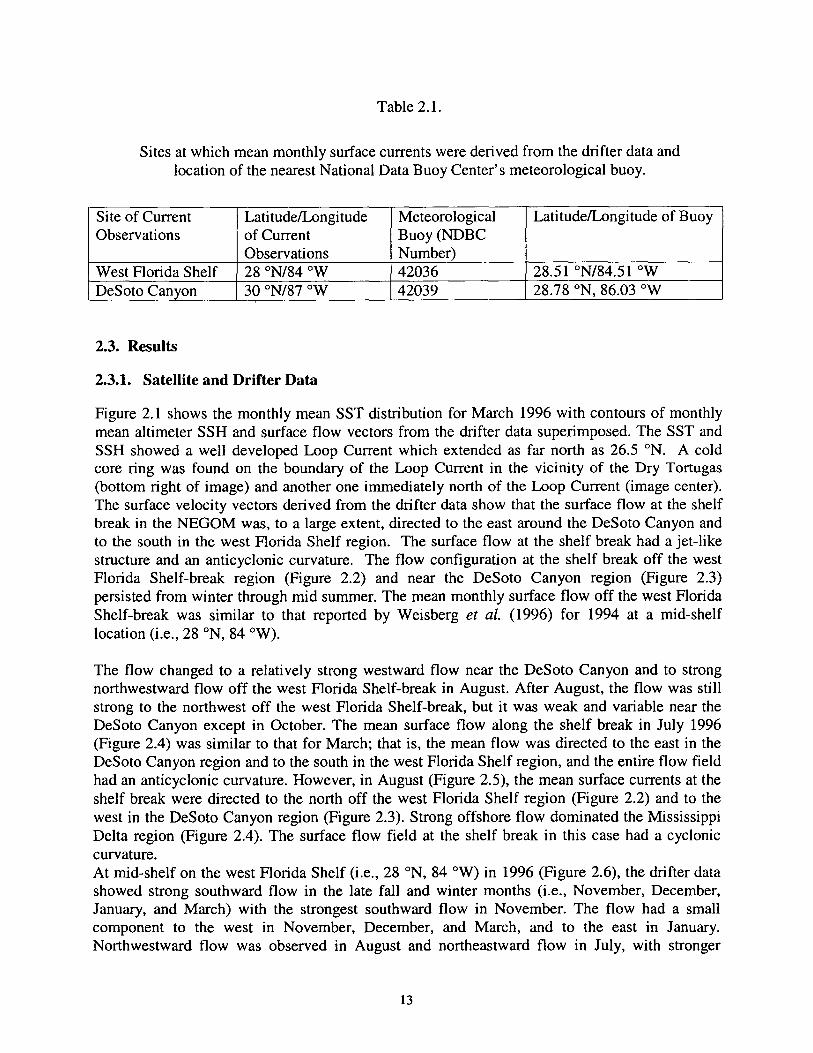
Table 2 .1 .
Sites at which mean monthly surface currents were derived from the drifter data and location of the nearest National Data Buoy Center's meteorological buoy.
Site of Current Latitude/Longitude Meteorological Latitude/Longitude of Buoy Observations of Current Buoy (NDBC
Observations Number) West Florida Shelf 28 °N/84 °W 42036 28.51 °N/84.51 °W DeSoto Canyon 30 °N/87 °W 42039 ~ 28.78 °N, 86.03 °W
2.3 . Results
2.3.1 . Satellite and Drifter Data
Figure 2.1 shows the monthly mean SST distribution for March 1996 with contours of monthly mean altimeter SSH and surface flow vectors from the drifter data superimposed . The SST and SSH showed a well developed Loop Current which extended as far north as 26 .5 °N. A cold core ring was found on the boundary of the Loop Current in the vicinity of the Dry Tortugas (bottom right of image) and another one immediately north of the Loop Current (image center) . The surface velocity vectors derived from the drifter data show that the surface flow at the shelf break in the NEGOM was, to a large extent, directed to the east around the DeSoto Canyon and to the south in the west Florida Shelf region . The surface flow at the shelf break had a jet-like structure and an anticyclonic curvature. The flow configuration at the shelf break off the west Florida Shelf-break region (Figure 2 .2) and near the DeSoto Canyon region (Figure 2 .3) persisted from winter through mid summer. The mean monthly surface flow off the west Florida Shelf-break was similar to that reported by Weisberg et al. (1996) for 1994 at a mid-shelf location (i.e ., 28 °N, 84 °W).
The flow changed to a relatively strong westward flow near the DeSoto Canyon and to strong northwestward flow off the west Florida Shelf-break in August. After August, the flow was still strong to the northwest off the west Florida Shelf-break, but it was weak and variable near the DeSoto Canyon except in October. The mean surface flow along the shelf break in July 1996 (Figure 2.4) was similar to that for March; that is, the mean flow was directed to the east in the DeSoto Canyon region and to the south in the west Florida Shelf region, and the entire flow field had an anticyclonic curvature . However, in August (Figure 2.5), the mean surface currents at the shelf break were directed to the north off the west Florida Shelf region (Figure 2.2) and to the west in the DeSoto Canyon region (Figure 2 .3). Strong offshore flow dominated the Mississippi Delta region (Figure 2.4). The surface flow field at the shelf break in this case had a cyclonic curvature . At mid-shelf on the west Florida Shelf (i .e ., 28 °N, 84 °W) in 1996 (Figure 2.6), the drifter data showed strong southward flow in the late fall and winter months (i.e ., November, December, January, and March) with the strongest southward flow in November . The flow had a small component to the west in November, December, and March, and to the east in January. Northwestward flow was observed in August and northeastward flow in July, with stronger
13

northward component in August. For April, September, and October, the flow was weak. The flow was stronger and better organized at the shelf break than over the shelf. Within the limits of the data, the surface flow at the mid-shelf location appeared similar to that at the shelf break only in March and August, and was not consistent with the mean, near-surface flow observed by Weisberg et al. (1996) at the same location in 1994 .
Figure 2.7 shows the variation of the Loop Current northern boundary from January 1994 through March 1999. From January (month number 25) through July (month number 32) 1996, the Loop Current penetrated far north into Gulf of Mexico. Its northern boundary was found as far north as 26.5 °N. In that period, the northern boundary made a number of north-south excursions, which were as large as 80 km. A major warm-core-ring (WCR) separated from the Loop Current in August - September 1996 (months number 32-33) . As the WCR separated, the Loop Current and the WCR drifted westward. The August satellite image (Figure 2.5) does not show eddy separation in the SSH field because the SSH contours were derived as a running mean for the middle of the month for the overlay on the monthly mean SST data . The Loop Current had indeed drifted westward, however, away from the west Florida Shelf. When the strongest southward flow was noted at mid shelf (i .e ., November), the Loop Current was located in its southernmost position (i.e ., south of 25 °N), which normally occurs when a major ring separates.
In both 1994 and 1995, major warm rings also separated from the Loop Current in July-September (months 8 and 21 in Figure 2.7). Weisberg et al. (1996) noted a transition from southward to northward flow on the west Florida Shelf in July-August 1994. Weisberg et al. (1997) noted a similar transition in July-August 1995. Furthermore, monthly mean near surface currents (i.e ., currents at the 12-m depth) obtained from an ADCP mooring located at 29.07 °N and 86.33 °W (or about 60 km west of the shelf break in the northern portion of the west Florida Shelf for the period April 1997 through March 1999 (Figure 2.8), showed relatively strong flow to the south except when an eddy separated from the Loop Current. When eddy separation occurred, the relatively strong flow to the south was interrupted with weak flow, example were seen in September-October 1997 (months 6 and 7 in Figure 2 .8, and month 46 in Figure 2.7) and March 1998 (month 12 in Figure 2.8 and month 52 in Figure 2.7). In 1997, the weak flow had a northward component, but in 1998, it had a southward component. A strong northward near-surface flow was only noted in September 1998 (month 18 in Figure 2.8). Although an eddy did not separate from the Loop Current at that time, the Loop Current surged northward in the months prior to September 1998 and then moved back to the south around September 1998 (months 54 through 58 in Figure 2.7), analogous to what happens to the Loop Current when an eddy separates from the Loop Current. Furthermore, during the entire period when this oscillation took place, the Loop Current's northern boundary remained south of 25 °N. The oscillations of the Loop Current noted in 1996 took place while the Loop Current's northern boundary was north of 25 °N.
2.3.2 . Winds
Wind data were missing at NDBC Buoy 42036 from April through June in 1996 . The mean monthly surface airflow was to the southwest in October, November, December, January, and March (Figure 2.9). In February, the mean flow was to the southeast. In July through September, the winds had a northerly component and the northerly component in July was strong. At Buoy
14

42039, winds showed a westward component in January, March, April, May, June, July, August, October, November and December (Figure 2. 10). The strongest winds were west-southwestward in October-November . The strongest summer winds, with a mean northward component, occurred in July .
2.3.3 . Cross-Shelf SST Differences
The east-west SST difference (Table 2.2) on the west Florida Shelf was relatively large and negative (colder water near the coast relative to offshore) in the fall and the winter months (i.e ., October, November, December, January, February, and March) . The largest magnitude differences were found in the January-February period . From May through September, the east-west gradient was positive, but small (i.e ., < 1 °C). Only in May was the SST difference around +1 .0 °C. The north-south SST differences in the vicinity of the DeSoto Canyon (Table 2.2) were negative (i.e ., lower SSTs near the coast and higher values offshore) for most of the period . The difference was large in late fall and winter and was largest in February, but the magnitude of the differences were never greater than 2 .0 °C during 1996. The difference was negative, but small (i .e .y < -1 .0 °C or zero) in the summer months.
Table 2.2 .
The east-west SST difference on the west Florida Shelf (along the 28 °N latitude line) and the north-south SST difference on the shelf near the DeSoto Canyon (along the 87 °W
longitude line) and the Mississippi Delta (along 88.5 °W longitude line).
West Florida Shelf
DeSoto Canyon
Month T (°C) T (°C) Jan . -6.2 -1 .8 Feb. -6.8 -2.1 Mar. -4.7 -1 .5 A pr. -0.7 -1 .0 Ma 1 .1 -0.3 Jun. 0 0 Jul. 0.6 -0.3 Aug. 0.6 -0.2 Se p. 0.1 0 Oct. -1 .3 -0.5 Nov. -3.0 -1 .4 Dec. -5.2 -1 .6
15

2.4. Discussion
The mean monthly surface currents derived from the SCLTLP-2 drifter data for the 1996-1997 period indicated a coherent surface circulation feature along the length of the shelf break (i .e ., about 600 km) in the NEGOM. The transition from flow in the NEGOM having an anticyclonic curvature to one having a cyclonic curvature in 1996 occurred when a major warm ring separated from the Loop Current. Similar effects were noted in 1994 and 1995, and to a lesser extent in 1997 and 1998 .
The northern boundary of the Loop Current generally moves north of its mean annual position when the current penetrates into the eastern Gulf of Mexico. Upon separation of an anticylonic eddy, the northern boundary moves abruptly south of its mean annual position because the eddy is no longer part of the Loop Current. Thus, the Loop Current's northern boundary moves north and south of its mean annual position with a frequency which is, for the most part, associated with the eddy shedding frequency. During periods when the Loop Current penetrates into the eastern Gulf of Mexico, the eastern boundary of the Loop Current is adjacent to the west Florida Shelf. When a major warm ring separates from the Current, the Loop Current tilts to the west and moves away from the west Florida Shelf (Vukovich, 1997). Large amounts of Gulf of Mexico Common Water must be transported at that time to the region off the west Florida Shelf to replace the Loop Current water mass that has been displaced . The Loop Current northern boundary is found south of 25 °N at this time and the current is nearly perpendicular to the southern part of the west Florida Shelf.
The wind has a significant effect on the shelf currents, but, generally, has little or no effect on the flow at the shelf break as Yang and Weisberg (1999) have shown using climatological wind data . There were no indications in the available wind data for 1996 that mean monthly wind forcing in the region was significantly different from the climatology, and therefore there was no reason to believe that the wind forcing would have a significantly different effect on the flow in the NEGOM. The characteristics and scale of the flow feature at the shelf break would support the conclusion of Weisberg et al. (1996) that circulation in this area is dominated by baroclinic forcing mechanisms .
SST differences across the shelf in the NEGOM in the fall and the winter could support a pressure gradient consistent with geostrophic flow directed to the east in the DeSoto Canyon region and to the south in the west Florida Shelf region . Since the SST differences were largest in the winter, the geostrophic flow should be strongest at that time . At the shelf break, however, the strongest surface flow to the south in the west Florida Shelf region was observed in the spring, similar to that found by Weisberg et al. (1996) at the mid shelf in 1994. In the DeSoto Canyon region, the strongest surface flow to the east was in the winter. In the summer, the SST differences across the west Florida Shelf could support a pressure gradient consistent with geostrophic flow directed to the north, but the SST differences were small suggesting the currents would be weak. In the DeSoto Canyon region, the north-south SST differences were small and remained negative in summer, and therefore would not support a pressure gradient consistent with geostrophic flow directed to the west. The shelf in the NEGOM is stratified in the summer and strong positive cross-shelf temperature gradients may exist in the subsurface and there are fresh-water discharge all along the coast (Schroeder et al ., 1987 ; Weisberg et al., 1996) .
16

Figure 2 .1 . Mean SST distribution for March 1996 . Contours [cm] show altimeter-derived sea surface height rendered for the 15"' day of the month using objective spatial interpolation of TOPEX and ERS data calibrated with a numerical model and interpolated in time . White contours represent high elevations relative to the geoid while black contours represent depressions. Vectors represent monthly-mean velocities derived from drifter positions within 25x25 km boxes . Vectors are colored black if they have a northward component and white if they have a southward component .
17
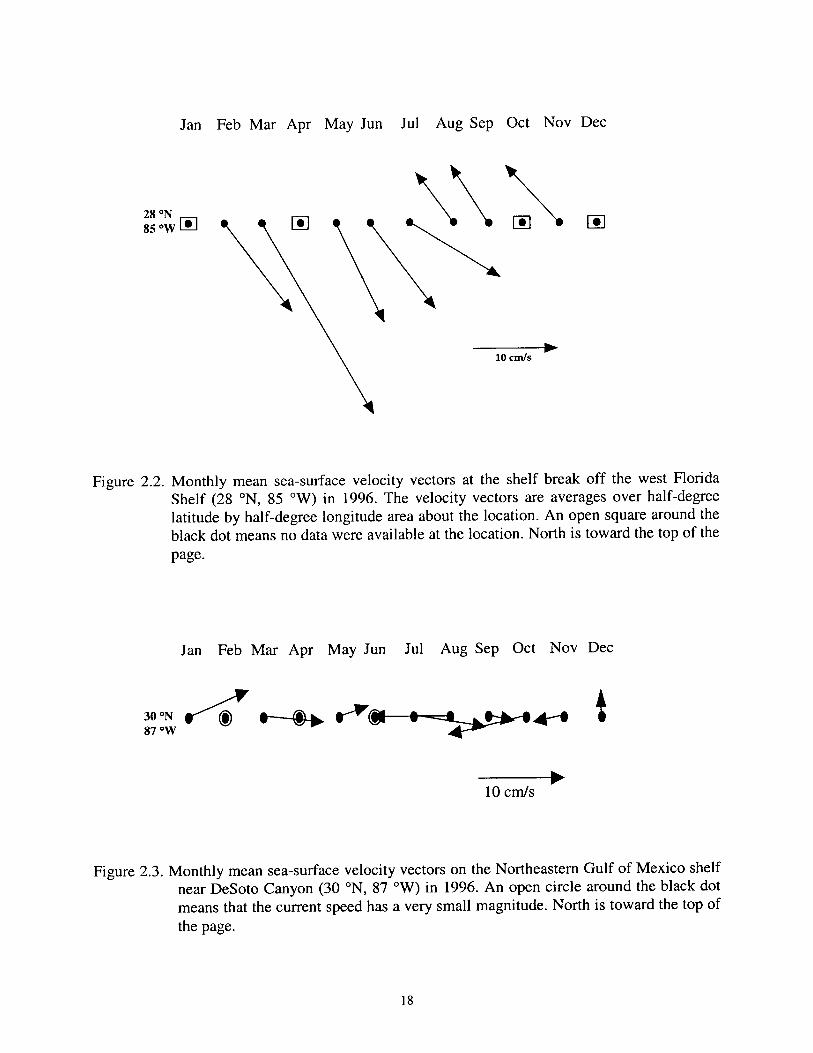
Jan Feb Mar Apr May Jun Jul Aug Sep Oct Nov Dec
28 °N 85 -W
1o cn,,s
Figure 2.2 . Monthly mean sea-surface velocity vectors at the shelf break off the west Florida Shelf (28 °N, 85 °W) in 1996. The velocity vectors are averages over half-degree latitude by half-degree longitude area about the location . An open square around the black dot means no data were available at the location . North is toward the top of the page .
Jan Feb Mar Apr May Jun Jul Aug Sep Oct Nov Dec
30 °N 87 Ow
10 . 10 cm/s
Figure 2 .3 . Monthly mean sea-surface velocity vectors on the Northeastern Gulf of Mexico shelf near DeSoto Canyon (30 °N, 87 °W) in 1996 . An open circle around the black dot means that the current speed has a very small magnitude. North is toward the top of the page .
0 0 0
18

Figure 2.4 . Mean SST distribution for July 1996. Contours [cm] show altimeter-derived sea surface height rendered for the 15`" day of the month using objective spatial interpolation of TOPEX and ERS data calibrated with a numerical model and interpolated in time. White contours represent high elevations relative to the geoid while black contours represent depressions . Vectors represent monthly-mean velocities derived from drifter positions within 25x25 km boxes. Vectors are colored black if they have a northward component and white if they have a southward component .
19

Figure 2.5 . Mean SST distribution for August 1996 . Contours [cm] show altimeter-derived sea surface height rendered for the 15`x' day of the month using objective spatial interpolation of TOPEX and ERS data calibrated with a numerical model and interpolated in time . White contours represent high elevations relative to the geoid while black contours represent depressions. Vectors represent monthly-mean velocities derived from drifter positions within 25x25 km boxes. Vectors are colored black if they have a northward component and white if they have a southward component.
20

Jan Feb Mar Apr May Jun Jul Aug Sep Oct Nov Dec
is N 84 °W Fe-1 0 00-40 "
10 cm/s
Figure 2.6 . Monthly mean sea-surface velocity vectors on the west Florida Shelf (28 °N, 84 °W). An open square around the black dot means no data were available at the location . North is toward the top of the page .
Sao goo
160 a izo y
80 0
40 n
0 R o 40
y -80 t U'-120 a -160
-200
-240
Loop Current Eddy $eponlion
. ~ Loo p Current
Loop Current EddySeparatbn Eddy SepanSP.-Ho
.
Loop Current Loop Currsnt Eddy Sepantfon Loop Currsnl Eddy Seponibn
Eddy Separation
s bu o 5 1o 1 s 2 o u 3o 35 4o 4 s w 5 Month
Figure 2.7 . Monthly displacements of the northern boundary of the Loop Current for the period January 1994 (month #1) through March 1999 (month #63) . The displacements of the Loop Current's northern boundary are relative to its annual mean position .
21

Current Meter Morring t 29.07_W86.33 °W
5-10 cm/s
Months
1 2 3 4 5 6 7 8 9 10 11 12 13 14 15 16 17 1 19 20 21 22 23 24
-~ i
771
Figure 2.8 . Monthly mean near surface currents for the period April 1997 through March 1999 . The current meter was located at 29.07 °N and 86.33 °W. Month #1 is April 1997, month #12 is March 1998, and month #24 is March 1999 . The isobaths in this region are oriented approximately north-south (170°) . North is toward the top of the page.
Jan Feb Mar Apr May Jun Jul Aug Sep Oct Nov Dec
50 cm/s 1
28.51 °N 84.51 °W
z
o D o v~ " Z
Figure 2.9 . Monthly mean wind velocity vectors from NDBC buoy 42036 on the west Florida Shelf (28 .51 °N, 84.51 °W). An open square around the black dot means no data were available at the location . North is toward the top of the page .
22

Jan Feb Mar Apr May Jun Jul Aug Sep Oct Nov Dec
so CM/s t
28.78 °N 86.03 °W
R
Figure 2.10 . Monthly mean wind velocity vectors from NDBC buoy 42039 on the Northeastern Gulf of Mexico shelf (28.78 °N, 86.03 °W) . North is toward the top of the page.
These factors taken together could support a pressure gradient consistent with geostrophic flow directed to the west in the DeSoto Canyon region and to the north in the west Florida Shelf region . However, if the seasonal SST difference was influential on the flow at the shelf break, it is not clear why the transition occurred in August when it is likely that large positive subsurface temperature differences would also exist in July . Furthermore, the seasonal cross-shelf pressure gradient that is developed by the seasonal cross-shelf SST gradients might influence the flow on the shelf, but there is no reason to believe they would create a coherent circulation feature at the shelf break.
The northern portion of the Loop Current has an anticyclonic curvature, suggesting that the Loop Current could have forced the anticyclonic flow at the shelf break. However, the shelf break jet was found north of 28 °N and the Loop Current remained largely south of 26 .5 °N in 1996. If the cold core ring (CCR) that was located north of the Loop Current had influenced the surface flow in the region, the flow would have been cyclonic, such as that observed in August. That CCR persisted in the NEGOM from January through July, when the surface flow at the shelf break in the NEGOM was anticyclonic . In August, the Loop Current and the CCR drifted to the west, leaving considerable doubt that the CCR affected the surface flow at the shelf break when flow was cyclonic .
The structure of the flow field when there was southward flow at the shelf break in the west Florida Shelf region appears to be consistent with the modeling results of Hetland et al. (1999), Hsueh (Personal Communication, 2000), and Hsueh et al., (submitted). In the models, the southward jet was produced by a north-to-south pressure drop imposed on the shelf by the Loop
23

Current . However, the feature did not extend to the Mississippi Delta, and flow did not reverse (i .e ., northward flow at the shelf break in the west Florida Shelf region). Hsueh et al. (submitted) and Hsueh (Personal Communication, 2000) suggested that the southward flowing jet is strong and that the influence of the jet extends deeper onto the shelf when the Loop Current is in its southernmost position . The WCR separated in August-September 1996 and the Loop Current remained south of 25 °N through the fall 1996 . The SCULP-2 data indicated that the strong southward surface currents were found at mid shelf at 28 °N in November, conforming to results of Hsueh et al . (submitted) and Hsueh (Personal Communication). However, the flow at the shelf break was still northward at that time . Furthermore, southward flow comparable to that in November was noted at 28 °N in January and March 1996 at which time the Loop Current had penetrated deep into the eastern Gulf of Mexico.
2.5 . Conclusions
The surface circulation at the shelf break in the Northeastern Gulf of Mexico had a jet-like
structure, with water flowing eastward in the DeSoto Canyon region and southward off the west
Florida Shelf, in the winter, spring, and mid summer of 1996 . The surface flow at the shelf break
reversed in August and was northward off the west Florida Shelf, westward in the DeSoto Canyon region, and seaward near the Mississippi Delta. The flow reversal occurred as a major
eddy separated from the Loop Current and it persisted into the fall . The data available were
insufficient to explain the shelf break jet or to explain whether eddy separation affected the
surface flow at the shelf break in the NEGOM. No single process seemed to dominate the
seasonal circulation on the shelf, but the circulation there seems to show these patterns every
year.
The 1996 drifter observations show that southward flow over the west Florida Shelf is persistent but that it can be interrupted for short periods of time when an anticyclone separates from the Loop Current. These conclusions are supported by similar patterns seen in 1994 and 1995 (observations described in Weisberg et al ., 1996; Weisberg et al., 1997) and in the 1997 and 1998 SAIC/MMS current meter observations reported here . We do not have sufficient observations near DeSoto Canyon to say that the eastward flow observed there in 1996 is persistent from year to year .
24

3. TRANSPORT OF LOOP CURRENT WATER INTO THE NORTHEASTERN GULF OF MEXICO
3.1 Introduction
The Loop Current and associated warm water penetrates as far north as 27 .5 °N about 10 percent
of the time (i .e ., about 2 events every 3 years) and 28 °N about 5 percent of the time (i .e ., about 2
events every 5 years) (Figure 3 .1) . In the 24-year period 1976-1999, it did not penetrated as far
as 29 °N. The analysis in Figure 3 .1 is based on NOAA satellite sea-surface temperature (SST)
data, Coastal Zone Color Scanner (CZCS) and Sea-viewing Wide-Field-of-view Sensor
(SeaWiFS) ocean color data, Ocean Topography Experiment (TOPEX) and European Remote-
Sensing Satellites (ERS) altimetry data, and in-situ data obtained in the 24-year period 1976-
1999; and is an extension of the work of Vukovich et al . (1979) . However, there are processes
that occur in the eastern Gulf of Mexico (GOM) through which Loop Current water that is not
directly part of the Loop Current and/or a major ring that separated from the Loop Current, is
also found in the eastern GOM, and in particular the northeastern GOM (NEGOM) or north of
28 °N. This paper provides examples of the processes that transport warm Loop Current water
into the NEGOM, and also provides an analysis of the spatial distribution of the frequency of at
which pools of warm Loop Current water, and therefore processes that transports warm Loop
Current water into the NEGOM, are found in that region. These processes at times lead to the
transport of Loop Current water onto the Florida and the Alabama-Mississippi-Louisiana shelves
with simultaneous transport of shelf water into the deep portions of the NEGOM. Such factors
have relevance to the exchange of suspended mass (e.g . nutrients, oil, diatoms, pollution, etc .)
between the shelf and the deep Gulf.
3.2 . Procedures
SST was derived from infrared observations by the Advanced Very High Resolution Radiometer (AVHRR) sensors flown on the NOAA polar orbiting satellites . AVHRR data were collected using a High Resolution Picture Transmission (HRPT) antenna located at the University of South Florida, in St . Petersburg, FL, and were used to construct the images used to examine processes that cause a transport of warm Loop Current water into the NEGOM. All satellite passes (nighttime and daytime) were combined to build a time series of relatively clear-sky images. The navigation was manually corrected to compensate for errors in the satellite clock and orientation. SST was computed using the multi-channel sea-surface temperature (MCSST) algorithm developed by McClain et al . (1985) . The approximate root-mean-square error of the AVHRR SST retrievals are of the order of 0.5 °C (McClain et al., 1983; Strong and McClain, 1984; Walton, 1988; Wick et al., 1992). The SST fields were remapped to a cylindrical, equidistant projection covering the GOM at a spatial resolution of 2.8x4.1 km2 .
SeaWiFS images were processed using the algorithms of Gordon and Wang (1994) and O'Reilly et al . (1998) . These algorithms generate errors in estimates of chlorophyll-a in coastal zones. Therefore for this study, we only used the data to infer relative changes and spatial patterns of dispersal.
25

31
30
29
28
27
26
25
Za
23
22
Figure 3.1 . Frequency analysis (%) of Loop Current water directly associated with the Loop Current resides in the eastern GOM. The 200-m isobath is indicated in the analysis .
To produce the analysis of the spatial distribution of the frequency at which Loop Current water that is not directly associated with the Loop Current and/or a major ring is found in the eastern GOM, a 0.25° latitude by 0.25° longitude grid was created for the eastern GOM. The frequency was determined at each grid-point by overlaying the grid on characteristic monthly ocean frontal analyses created for the GOM using AVHRR SST, SeaWiFS and CZCS ocean color, TOPEX and ERS SSH, and in-situ data. At each grid point, the number of times that detached warm Loop Current water encompassed that grid-point was determined over the analysis period . The analysis period was the 24-year period from 1976-1999. Contours of constant frequency were then established as shown in Figure 3.6 .
3.3 . Processes in the NEGOM
Isolated "pools" of Loop Current water can be established in NEGOM by minor, short-lived rings that separate from the Loop Current and dissipate in the NEGOM, by the advection of Loop Current water into the NEGOM by the circulation in cold core rings (CCR) that are found on the northern boundary of the Loop Current, or by dragging surface water from the Loop
26
-91 -90 -89 -88 -87 -86 -85 -84 -83 -82

Current northward through the action of a strong wind stress . In the periods 15-28 January 2000 and 25 March-3 April 2000, two separate events took place, which are examples of the transport of Loop Current water into the NEGOM by a CCR.
Between 15 and 28 January 2000, the NOAA/AVHRR SST data indicated that the Loop Current's northern boundary was located at about 26 .8 °N (Figure 3 .2). A CCR was located at the Loop Current's northern boundary and was centered at about 27.5 °N and 86.5 °W . Warm Loop Current water was being advected northward along the shelf break off the west Florida Shelf by the circulation of the CCR. The transport of Loop Current water by the circulation of a CCR located on the boundary on the Loop Current has been well documented in the literature (O'Connor, 1981 ; Vukovich and Maul, 1985 ; Vukovich, 1986). The averaged speed of movement of the 23 °C isotherm at the northern edge of the warm water being advected northward varied from 5 to 11 cm/s over the period, and the direction of motion was to the north northwest. The average northward speed of the 23 °C isotherm varied from 2 to 5 cm/s over the period. The northern edge of the advected warm water was located north of 28 °N toward the end of the period . Loop Current water was transported a distance of about 200 km (i.e . the distance from the edge of the Loop Current to its position in the 21-23 January image) . This distance is about equivalent to the north-south scale of the CCR in the SSH data (i .e ., about 170 km).
The SeaWiFS ocean color data (Figure 3 .3) that were available for the period, show the complete circulation in the CCR ; that is, the northward advection of warm Loop Current water along the shelf break on the east side of the CCR and the southward advection of the water mass that is found north of the CCR, on the west side of the CCR . This aspect is best described in the SeaWiFS image for 18 January 2000. The water mass being advected on the west side of the CCR has been labeled NEGOM water. Its color characteristics, however, are very similar to that of the water mass that is found on the shelf in the Florida panhandle area and off the Alabama-Mississippi-Louisiana coast. It is not possible to state for certain that this water mass is shelf water nor that this water has been advected southward from the shelf without in-situ observational evidence, which was not available ; but there is strong indications in the SeaWiFS
data that a water mass having color characteristics similar to that on the shelf in the NEGOM is being advected southward by the circulation of the CCR.
In the period 25 March to 5 April 2000, the NOAA/AVHRR SST data indicated that there was again northward transport of Loop Current water into the NEGOM, and in this case, onto the shelf off the Mississippi-Louisiana coast. The northern boundary of the Loop Current was again located at about 26 .8 °N (Figure 3 .4). A CCR was located at the northern boundary of the Loop Current and was centered at about 27.2 °N and 88.0 °W. Warm Loop Current water began moving northward around 25 March 2000. The northward transport of the warm Loop Current water occurred on the east side of the CCR, which is where the currents would normally support northward transport. By 28 March, the northern edge of the warm water was about 25 km south of the Mississippi-
27

B C
Figure 3 .2 NOAA/AVHRR SST analyses for A) 15-17 January 2000, B) 18-20 January 2000, and C) 21-23 January 2000. TOPEX/ERS SSH contours are superimposed on the SST analysis . When a period of days is shown for the date of the analysis, the period of days represent the period over which images were composited to remove a major fraction of the cloud influence .
A B
Figure 3 .3 . SeaWiFS ocean color analyses for A) 16-17 January 2000 and B) 18 January 2000 . TOPEX/ERS SSH contours are superimposed on the SST analysis . When a period of days is shown for the date of the analysis, the period of days represent the period over which images were composited to remove a major fraction of the cloud influence .
28

Louisiana shelf, and by 5 April, the warm water had been transport onto the Mississippi-Louisiana shelf. During this period (i .e ., 25 March to 5 April), the 23 °C isotherm at the northern edge of the warm water moved at speeds that varied from 6 to 12 cm/s over the period, and the direction of motion was north northwest . The northward speed of the 23 °C isotherm varied from 5 to 6 cm/s over the period . The warm Loop Current water was transported a distance of about 250 km (i .e . the distance from the location of the northern boundary of the Loop Current to the Mississippi-Louisiana shelf over the period . The transport scale was almost twice the north-south scale of the CCR that is indicated in the SSH data, which is about 130 to 150 km. Wind data from the National Data Buoy Center's (NDBC) meteorological buoy number 42040, located at 29.2 °N and 88.3 °W, indicated that during the period 25 March through 3 April, the wind had a component from the south (Table 3.1), and on 3 April, the wind component from the south was very strong compared to the early part of the period . On 3 April, the hourly values of the wind speed were as high as 7 m/s, and the daily average wind speed was 6 m/s. These data suggest that conditions existed such that the transport scale of this feature could have been augmented by the action of the wind stress dragging the surface water to the north.
The SeaWiFS ocean color images (Figure 3 .5) that were available for the period, show no direct
evidence of the northward transport of Loop Current water . There is, however, water that appears to have its origin on the Louisiana shelf protruding into the deep Gulf immediately south
of the Mississippi River delta . This water mass appears to have been advected southward in an
area where the west side of the CCR should be located, which is where the circulation of the
CCR normally supports southward transport. However, this feature is considerably north of the
center of the CCR. The north-south scale of the CCR does not appear to be large enough to have
caused the southward transport of shelf water . The shelf water may have been forced off the
shelf when the Loop Current water was transported onto the shelf, and perhaps the wind stress
also played a role late in the period. The winds had a component from the north in that region on
4-5 April, and the average northward wind speed was strong on 4 April and may have dragged
surface shelf water southward .
3.4. Frequency Analysis
The spatial distribution of the frequency at which Loop Current water, that is not directly associated with the Loop Current and/or a major ring, was transported from the Loop Current into the NEGOM, has been developed for the period 1976-1999 . Pools of Loop Current water were found throughout the NEGOM in the period . The highest frequency at which these pools were found was approximately 14 percent and the center of high frequency was located immediately west of the shelf break at the west Florida Shelf at 27.25 °N and 85.25 °W (Figure 3 .6). This high frequency feature was created, for the most part, as a result of many cases in which there was advection of warm Loop Current water by the circulation associated with CCR, which was located on the boundary of the Loop Current, similar to the15-28 January 2000 case study. The 14 percent correspond to a frequency of a little more than one event per year or six events in 5 years.
29

A B C
Figure 3.4 . NOAA/AVHRR SST analyses for A) 25 March 2000, B) 28 March 2000, and C) 5 April 2000 . TOPEX/ERS SSH contours are superimposed on the SST analysis .
A B
Figure 3 .5 . SeaWiFS ocean color analyses for A) 28 March 2000 and B) 4-5 April 2000 . TOPEX/ERS SSH contours are superimposed on the SST analysis . When a period of days is shown for the date of the analysis, the period of days represent the period over which images were composited to remove a major fraction of the cloud influence .
30

Table 3 .1 .
Daily Average wind direction and speed at NDBC Buoy # 42040 located at 29.2 °N and 88 .3 °W for the period 25 March-5 April 2000.
Date Mean Wind
Direction 1
Mean Wind Speed (m/s)
25-Mar-00 SE 1 .8 26-Mar-00 SSW 1 .9 27-Mar-00 WSW 3.2 28-Mar-00 SSW 2.5 29-Mar-00 SSE 2.8 30-Mar-00 SSW 1 .8 31-Mar-00 SE 2.7 01-A pr-00 ESE 3.5 02-A r-00 SE 3.2 03-A r-00 SSW 6.3 04-A r-00 NW 5.3 OS-Apr-00 NNE 3.3
`Wind direction is reported as the direction the wind is coming from .
There is also an interesting feature in the isoline analysis centered at around 28.75 °N and 87.5 °W . The feature is described in the 4 percent isoline where it extends northwestward toward the shelf in the NEGOM. The highest frequency in this region is about 5 percent. That feature was principally a result of minor, short-lived rings, which moved northward into DeSoto canyon and then dissipated and warm water advection associated with CCR like that in the 25 March-5 April 2000 case study. It should be noted that in the spring 1977, significant amounts of surface water from the Loop Current were transported northward into NEGOM solely by the effect of a strong wind stress, which also contributed to this frequency feature. The 5-percent maximum in this region corresponds to a frequency of occurrence of about 2 event every 5 years.
At times, portions of the warm pools of Loop Current water would penetrate onto the shelf. This occurred most often on the west Florida Shelf when portions of the warm water mass being advected northward by a CCR would intrude onto the shelf. The only other location where there was any significant intrusion of these warm water masses on to the shelf was in the Mississippi-Louisiana shelf area just west of the DeSoto Canyon. These intrusions were associated with minor, short-lived rings and with warm water advection by a CCR with possible augmentation by the wind stress like that in the 25 March-5 April 2000 case study. The maximum frequency of occurrence for the events in the Mississippi-Louisiana region was about 2 percent, which corresponds to about one event every 5 years.
31

31
30
29
28
27
26
25
24
23
22
Figure 3 .6 . Frequency at which Loop Current water that is not directly associated with the Loop Current and/or a major ring is found in the eastern GOM.
3.5 . Summary and Discussion
Satellite remote sensing (i .e ., NOAA/AVHRR SST, CZCS and SeaWiFS ocean color, and TOPEX/ERS SSH data) and in-situ data for the 24-year period 1976-1999 were used to examine the frequency at which processes occur that either influence the exchange of water masses between the shelf and the deep Gulf or affect the circulation in the NEGOM. The Loop Current, at times, penetrates to 28 °N into the eastern GOM (i.e ., about 2 events every 5 years), but in the 24 years examined, it never penetrated as far north as 29 °N. The Loop Current, therefore, will at times affect the circulation in the NEGOM but only in the southern portions of that region . Other factors have had a more widespread effect on the circulation and exchange processes in the NEGOM. These included CCRs found at the northern boundary of the Loop Current; small warm core rings that separate from the Loop Current, move northward into the NEGOM, and quickly dissipate; and the action of a strong wind stress that can move surface water into the NEGOM and to/from the shelf.
Two examples of the influence of a CCR on processes in the NEGOM were presented . In one of the examples, it was shown that warm Loop Current water was transported northward along the shelf break off the west Florida Shelf on the east side of a CCR, which is the region in a CCR that supports northward transport . Furthermore, a water mass with ocean color characteristics
32
-91 -90 -89 -88 -87 -86 -85 -84 -83 -82 -81 -80

similar to that found on the shelf in the NEGOM was transported southward on the west side of the CCR . The scale of the transport was commensurate with the scale of the CCR (i .e ., about 170-200 km). This example suggested that CCR caused an exchange process between the shelf and the deep Gulf .
The second example suggested that the wind stress acted in tandem with the circulation of a CCR to transport Loop Current water northward to the shelf in the NEGOM. It was also shown that southward transport of shelf water into the deep Gulf occurred . Initially, warm Loop Current water was transported northward on the east side of a CCR, which was located on the northern boundary of the Loop Current, and the warm water reached and moved onto the Mississippi-Louisiana shelf. The scale of the transport (i.e ., about 250 km) was sufficiently larger than the scale of the CCR (i .e ., 140 km) to suggest that forcing functions other than the circulation of the CCR may have also played a role . Wind data from a nearby NDBC meteorological buoy
indicated that the northward transport by the CCR may have been augmented by the action of the
wind stress on the surface water . During the period, the wind had a component from the south
and that component was reasonably strong around the time that the warm water reached and
moved onto the shelf. This example also suggested that as the Loop Current water was being transported northward onto the shelf, a water mass that had color characteristics identical to that of the water mass on the Louisiana shelf was being transported from the shelf immediately south of the Mississippi River delta into the deep Gulf. Since the scale of the circulation of the CCR was not sufficiently large to cause the transport water off the shelf, the southward transport may have been the a direct result of mass continuity, augmented by the wind stress late in the period when the winds had a component from the north.
A statistical analysis that was developed for the period 1976-1999 showed the frequency at which Loop Current water, that is not directly associated with the Loop Current and/or a major ring, was transported from the Loop Current into the NEGOM. This analysis provides an indication of the frequency with which certain processes that affect the circulation in the NEGOM (e.g ., CCR, minor warm rings, etc .) occur. The highest frequency at which Loop Current water was found in the eastern GOM, was approximately 14 percent (i .e ., about six events in 5 years), and the center was located immediately west of the west Florida Shelf about where warm water advection associated with the CCR in the15-28 January 2000 case study was found, indicating the persistence of this feature in the eastern GOM. Actually, the CCR located on the northern boundary of the Loop Current is the most important process for the transport of Loop Current water into the NEGOM because this process occurs more often in the eastern GOM than any of the other processes that produce isolated pools of Loop Current water in the NEGOM (Vukovich et al, 1979; Vukovich, 1988). There was also an interesting feature in the analysis, which is described in the 4 percent isoline through its northwestward extension toward the shelf break in the NEGOM. The maximum frequency in this region is about 5 percent or about 2 event every 5 years. Processes that most often influenced the creation of that feature included minor, short-lived warm rings, which moved into DeSoto canyon and then dissipated, and warm water advection associated with the CCR. The frequency analysis also suggested that intrusions of warm water onto the shelf in the Mississippi-Louisiana shelf area just west of the DeSoto Canyon may be associated with this feature . The shelf intrusion had a frequency of about one event every 5 years and processes that were most often involved in the development of the shelf intrusion were similar to that in the 25 March-5 April 2000 case study.
33

4. SYNTHESIS AND CONCLUSION
The surface circulation on and near the continental shelf in the Northeastern Gulf of Mexico was examined using monthly mean AVHRR sea-surface temperature images, TOPEX/ERS sea-surface height data, and current data derived from surface drifters deployed in 1996 . These data show that from January through July the mean flow at the shelf break in the DeSoto Canyon region was from west to east, and in the west Florida Shelf region from north to south. An anticyclonic jet followed the curvature of the shelf off the Florida Panhandle shelf break. In August, flow reversed and the mean surface currents at the shelf break were from south to north-northwest off the west Florida Shelf, east to west in the DeSoto Canyon region, and offshore in the Mississippi Delta region . This gave the flow a cyclonic curvature . The flow reversal seen in 1996 occurred as a major eddy separated from the Loop Current, and it persisted into the fall . The data available were insufficient to explain the shelf break jet or to explain whether eddy separation affected the surface flow at the shelf break in the Northeastern Gulf of Mexico (NEGOM).
The circulation patterns over the west Florida Shelf described by the 1996 drifter tracks are
similar to those seen in 1994 and 1995 (Weisberg et al., 1996; Weisberg et al., 1997) and in the 1997 and 1998 SAIC/MMS current meter observations reported here. We do not have sufficient historical observations near DeSoto Canyon to conclude whether the eastward flow observed
there in the first half of 1996, or the westward flow observed generally during the second half of the year, are persistent from year to year.
Using historical satellite and in-situ data covering the 24-year period 1976-1999 we examined the northern position of the Loop Current and of major eddies that possibly influenced the exchange of water between the shelf and the deep Gulf . The Loop Current and associated warm water penetrated NEGOM as far as 27 .5 °N about 10% of the time (2 events every 3 years), and to 28 .0 °N about 5 % of the time (2 events every 5 years) . No penetration to 29 °N was detected . Other factors such as cold-core rings, warm core rings, and wind stress may play a more dominant role in affecting the shelf circulation and shelf exchange processes in the NEGOM than the Loop Current proper.
Cold-core rings found along the northern boundary of the Loop Current play an important role in defining the circulation in the NEGOM. Near the shelf break off the west Florida shelf, warm Loop Current water seemed to be transported onto the shelf on the east side of cold-core rings associated with the Loop Current or a large anticyclonic eddy. Ocean color data also showed what appeared to be shelf water streaming southward off the shelf on the western side of cold-core rings that interacted with the shelf. The scale of the transport was about 170-200 km, commensurate with the scale of the cold-core rings . Significant intrusion of Loop Current warm water on to the shelf also took place near the Mississippi-Louisiana shelf area, immediately to the west of the DeSoto Canyon. These intrusions were also associated with minor cold-core rings, with possible augmentation by the wind stress in some instances. The maximum frequency of occurrence for the events in the Mississippi-Louisiana region was about 2 percent, which corresponds to about one event every 5 years.
34

Wind stress played an important role in the circulation of waters over the continental shelf in the NEGOM. The wind can lead to significant coastal upwelling in the NEGOM, but it can also lead to enhanced water column stability by spreading river plume waters over the shelf to the east of the Mississippi delta. The wind can modify and augment the scale of transport effected by a cold-core ring . For example, warm water was seen moving northward onto the Mississippi-Louisiana shelf on the east side of a cold-core ring located on the northern boundary of the Loop Current. The scale of the transport (250 km) was larger than the scale of the cold-core ring (140 km) . Wind measured by a nearby NDBC buoy showed a component from the south indicating that the northward transport may have been augmented by wind action .
Potential forcing functions leading to the observed circulation patterns include pressure gradients generated by seasonal temperature differences between shelf and deep Gulf of Mexico waters, the wind, the Loop Current and the large anticyclones shed by it, and smaller cold-core and warm-core eddies found along the northern boundary of these features . While no single process seemed to dominate, we concluded that the cold-core rings are a significant process for transport of Loop Current and deep Gulf water onto and off the NEGOM shelf. While mesoscale details (10-100 km length scale) and timing vary from year to year, the larger-scale general patterns seem to occur every year. Because of the spatial and temporal scales of these smaller phenomena, it is clear that in order to understand the circulation on the shelf and along the shelf break in the Northeastern Gulf of Mexico, it is necessary to collect data continuously combining remote sensing and in situ instrumentation, and interpreted with the aid of a numerical model.
35

5. REFERENCES
Basic, T. and R.H. Rapp. 1992. Oceanwide prediction of gravity anomalies and sea surface heights using Geos-3, Seasat and Geosat altimeter data, and ETOPOSU bathymetric data,
report 416, Dept. of Geod. Sci ., Ohio State Univ., Columbus.
Berger, T.J ., P. Hamilton, J .J . Singer, R.R . Leben, G.H. Born, and C.A . Fox. 1996a. Louisiana/Texas Shelf Physical Oceanography Program Eddy Circulation Study: Final Synthesis Report . Volume I: Technical Report . OCS Study MMS 96-0051 . U.S . Dept . of the Interior, Minerals Management Service, Gulf of Mexico OCS Region, New Orleans, LA. 324 pp.
Berger, T.J ., P. Hamilton, J.J . Singer, R.R . Leben, G.H. Born, and C.A. Fox. 1996b. Louisiana/Texas Shelf Physical Oceanography Program Eddy Circulation Study: Final Synthesis Report . Volume II : Appendices . OCS Study MMS 96-0052. U.S . Dept. of the Interior, Minerals Management Service, Gulf of Mexico OCS Region, New Orleans, LA. 151 pp.
Carder, K.L., F.R . Chen, Z.P . Lee, S .K . Hawes, and D. Kamykowski. 1999. Semi-analytic moderate-resolution imaging spectrometer algorithms for chlorophyll a and absorption with
Bio-optical domains based on nitrate depletion temperatures . Journal of Geophysical
Research, 104:5403-5421 .
Callahan, P.S . 1993. TOPEX/POSEIIDON NASA GDR Users Handbook JPL Publ. D-8590, rev. C, Jet. Propul . Lab., Pasadena, CA .
Chuang, W.S ., W. Schroeder, and W.J . Wiseman, Jr. 1982. Summer Current Observations off the Alabama Coast. Contributions in Marine Science. 25 :121-131 .
Collard, S .B ., A. Lugo-Fernandez, G. Fitzhugh, J. Brasher, and R. Shaffer. 2000. Observations of a mass mortality event in coastal waters of the Central Florida Panhandle during spring and summer 1998 . Gulf of Mexico Science, 18(1):68-71 .
Collard, S.B . and A. Lugo-Fernandez . 1999 . Coastal Upwelling and Mass Mortalities of Fishes and Invertebrates in the Northeastern Gulf of Mexico During Spring and Summer 1998, Final Report . MMS 99-0049. Sneed B. Collard and Alexis Lugo-Fernandez . (1999) 16 pp.
Csanady, G.T. and P.T . Shaw. 1983 . The "insulating" effect of a steep continental slope. J. Geophys. Res., 88:7,519-7,524 .
Desai, S.D. and J.M. Wahr. 1995 . Empirical ocean tide models estimated from TOPEX/POSEIIDON altimetry . J . Geophys. Res., 100:25,205-25,228 . .
Gaul, R.D. 1967. Circulation over the continental margin of the northeast Gulf of Mexico. Ph.D . Dissertation, Department of Oceanography, Texas A & M University, College Station, 156
PP. Gordon, H.R . and M. Wang. 1994 . Retrieval of water-leaving radiance and aerosol optical
thickness over the oceans with SeaWiFS : A preliminary algorithm . Appl . Optics ., 33 :443-452 .
Hellerman, S . and M. Rosenstein . 1983. Normal monthly wind over the world ocean with error estimates . J. Physical Oceanography, 13:1,093-1,104 .
36

Hetland, R.D., Y. Hsueh, R. Leben, and P.P . Niiler . 1999 . A Loop Current jet along the edge of the west Florida Shelf. Geophys. Res. Letter, 26(15):2,239-2,242 .
Hsueh, Y., D. Yuan, and A.J . Clarke . 2000. A numerical study of the DeSoto Canyon intrusion in the Northeastern Gulf of Mexico. J. Physical Oceanography . submitted.
Hu , C., F.E . Muller-Karger, D.C . Biggs, K.L . Carder, B. Nababan, D. Nadeau, and J. Vanderbloemen. 2001 (In Press) . Comparison of ship and satellite bio-optical measurements on the continental margin of the NE Gulf of Mexico. Int. J. Rem. Sensing.
Marshall, J .A., NY Zelensky, S.M . Klosko, D.S . Chinn, S.B. Luthcke, K.E . Rachlin, and R.G. Williamson . 1995 . The temporal and spatial characteristics of TOPER/ POSEIDON radial orbit error. J . Geophys. Res., 100:25,331-25,352 .
McClain, E.P., W.G. Pichel, and C.C. Walton . 1985 . Comparative performance of (AVHRR) based multichannel sea surface temperatures, J. Geophys . Res., 90:11,587-11,601 .
McClain, E.P ., W.G . Pichel, C.C . Walton, Z. Ahmad, and J. Sutton . 1983 . Multi-channel improvements to satellite-derived global sea-surface temperatures, Adv. Space Res ., 2(6) :43-47 .
Miiller-Karger, F.E ., J .J . Walsh, ,R.H . Evans, and M.B . Meyers. 1991 . On the Seasonal Phytoplankton Concentration and Sea Surface Temperature Cycles of the Gulf of Mexico as Determined by Satellites . Journal of Geophys . Res., 96(C7):12,645-12,665 .
Muller-Karger F.E . 2000. The spring 1998 northeastern Gulf of Mexico (NEGOM) cold water event : remote sensing evidence for upwelling and for eastward advection of Mississippi water (or: how an errant Loop Current anticyclone took the NEGOM for a spin) . Gulf Mexico Science, 18:55-56 .
Miiller-Karger, F.E., F. Vukovich, R. Leben, B . Nababan, and D. Myhre . 1998 . Northeastern Gulf of Mexico Physical Oceanography Program : Eddy Monitoring and Remote Sensing. Technical Report of the U.S . Department of the Interior, Minerals Management Service, Gulf of Mexico OCS Region. OCS Study MMS 98-0051 . 41 pp.
Nowlin, W.D., A.E . Jochens, M.K. Howard, S.F . DiMarco, and W. W. Schroeder. 2000. Hydrographic properties and inferred circulation over the northeastern shelves of the Gulf of Mexico during spring and mid-summer of 1998 . Gulf of Mexico Science, 18 :40-45 .
O'Connor, D. 1981 . The thermal anomaly in the Gulf of Mexico observed during May 1980 . Gulf Stream, 4:6-8 .
O'Reilly, J.E., S . Maritorena, B.G. Mitchell, D.A. Siegel, K.L . Carder, S.A. Garver, M. Kahru, and C.R. McClain . 1998. Ocean color chlorophyll algorithms for SeaWiFS . Journal of Geophysical Research, 103:24,937-24,953 .
Schroeder, W., S .P . Dinnell, W.J . Wiseman, Jr ., and W.J . Merrell . 1987 . Circulation patterns inferred from the movement of detached buoys in the eastern Gulf of Mexico. Continental Shelf Research, 7(8) :883-894 .
Strong, A.E . and E.P . McClain . 1984 . Improved ocean surface temperatures from space, Comparisons with drifting buoys, Bull . Am. Meteor. Soc., 65(2) :138-142 .
37

Tolbert, W.H. and G.G . Salsman . 1964. Surface circulation in the eastern Gulf of Mexico as determined by drift-bottle studies . J. Geophys. Res., 69:223-230 .
Vukovich, F.M. 1986 . Aspects of the behavior of cold perturbations in the eastern Gulf of Mexico : A case study. J. Physical Oceanography, 16(1):175-188 .
Vukovich, F.M. 1988. Loop Current Boundary Variations. J. Geophys . Res ., 93(C12):15,585-15,591 .
Vukovich, F.M. 1997 . Comparisons between large-scale model results in the Gulf of Mexico and data derived from satellite and in-situ observations : Final Report . In : Herring, J.H., M. Inoune, G.L. Mellor, C.N.K . Mooers, P.P Niiler, L. Oey, R.C. Patchen, F.M. Vukovich, and W.J . Wiseman. Coastal ocean modeling program for the Gulf of Mexico . MMS Contract No. 15-35-00001-30631 . Pp . 5 .1-5 .20.
Vukovich, F.M. and G.A. Maul . 1985. Cyclonic eddies in the eastern Gulf of Mexico. J. Physical Oceanography, 15(1):105-117 .
Vukovich, F.M ., B .W . Crissman, M. Bushnel, and W .J . King. 1979. Some aspects of the
oceanography of the Gulf of Mexico using satellite and in situ data . J . Geophys. Res .,
84(C12) : 7,749-7,768 .
Vukovich, F.M. and P. Hamilton. 1989 . New Atlas of Front Locations in the Gulf of Mexico. Proceedings of the MMS Information Transfer Meeting, New Orleans, Louisiana, May 1989.
Walton, C.C . 1988 . Nonlinear multichannel algorithms for estimating sea surface temperature with AVHRR satellite data . Journal of Applied Meteorology, 27:115-127 .
Weisberg, R.H., B.D . Black, and H. Yang. 1996. Seasonal modulation of the west Florida continental shelf circulation . Geophys. Res . Let., 23(17) :2,247-2,250 .
Weisberg, R.H., E.M. Siegel, B.D. Black, J .C . Donovan, and R.D . Cole. 1997. The west-central Florida shelf project : A report on data collected using trans-shelf array of acoustic Doppler current profilers January 1995-February 1996. Data Report by Dept. of Marine Sci ., Univ. So . Florida, St Petersburg, 125 pp.
Wick, G.A ., W.J . Emery, and P. Schluessel . 1992. A comprehensive comparison between satellite-measured skin and multichannel sea surface temperature. Journal of Geophysical Research, 97(C4) :5,569-5,595 .
Yang, H. and R.H. Weisberg. 1999 . Response of the west Florida Shelf to climatological wind stress forcing. J . Geophys. Res., 104(C3):5,301-5,320 .
38

Yi, Y . 1996 . Determination of Gridded Mean Sea Surface from Altimeter Data of TOPEX, ERS-1, and GEOSAT. Ph . D. Thesis . Department of Geodetic Science and Surveying, The Ohio State University, Columbus, Ohio.
39


The Department of the Interior Mission PP ̀
As the Nation's principal conservation agency, the Department of the Interior has responsibility for most of our nationally owned public lands and natural resources. This includes fostering sound use of our land and water resources; protecting our fish, wildlife, and biological diversity; preserving the environmental and cultural values of our national parks and historical places ;
~"- and providing for the enjoyment of life through outdoor recreation . The Department assesses our energy and mineral resources and works to ensure that their development is in the best interests of all our people by encouraging stewardship and citizen participation in their care. The Department also has a major responsibility for American Indian reservation communities and for people who live in island territories under U.S . administration .
The Minerals Management Service Mission
Moreover, in working to meet its responsibilities, the Offshore Minerals Management Program administers the OCS competitive leasing program and oversees the safe and environmentally sound exploration and production of our Nation's offshore natural gas, oil and other mineral resources. The MMS Minerals Revenue Management meets its responsibilities by ensuring the efficient, timely and accurate collection and disbursement of revenue from mineral leasing and production due to Indian tribes and allottees, States and the U .S . Treasury .
The MMS strives to fulfill its responsibilities through the general guiding principles of: (1) being responsive to the public's concerns and interests by maintaining a dialogue with all potentially affected parties and (2) carrying out its programs with an emphasis on working to enhance the quality of life for all Americans by lending MMS assistance and expertise to economic development and environmental protection .
As a bureau of the Department of the Interior, the Minerals Management Services (MMS) ' primary responsibilities are to manage the mineral resources located on the Nation's Outer Continental Shelf (OCS), collect revenue from the Federal OCS and onshore Federal and Indian lands, and distribute those revenues .