sure urban assessment guidelines may 2017 - flagship...
TRANSCRIPT

1
Strengthening Urban Resilience &
Engagement (SURE) programme
Nepal
Urban Assessment (VCA) Guidelines
May 2017
2
Contents Key definitions and acronyms ............................................................................................................. 3
Objectives of Guidelines ......................................................................................................................... 4
Strengthening Urban Resilience and Engagement(SURE) programme .............................................. 4
Urban assessment ................................................................................................................................... 4
Rationale for the design of the tools .................................................................................................. 4
Conceptualising ‘Urban disaster resilience’ ........................................................................................ 5
Why focus on networks? .................................................................................................................... 7
Defining ‘community’ in the urban context ........................................................................................ 8
Interlinkages with climate change ...................................................................................................... 9
Livelihoods and economic security ................................................................................................. 9
Linking with Government of Nepal ..................................................................................................... 9
Nepal’s LDRMP and the Urban Assessment.................................................................................... 9
National Strategy for Resilient Urban Community ....................................................................... 10
Urban Assessment Tools ....................................................................................................................... 11
Process of developing and implementing the tools ..................................................................... 11
How to carry out an Urban Assessment ............................................................................................... 12
Participants in the Urban Assessment .............................................................................................. 12
Human resources: ......................................................................................................................... 12
Methodology of identifying vulnerable groups ................................................................................ 13
Information the Urban Assessment will generate ............................................................................ 15
Urban Assessment Process ............................................................................................................... 15
Step 1: secondary data review & sharing ..................................................................................... 15
Step 2: data collection .................................................................................................................. 15
Step 3: analysis and reporting ....................................................................................................... 15
Step 4: planning for resilience ...................................................................................................... 16
When to conduct an Urban Assessment? ......................................................................................... 18
Effort involved in carrying out UA ..................................................................................................... 18
Annex 1 – Global Review of Urban VCA tools ................................................................................... 20
Annex 2 - Analysis of original LDRMP VCA and SURE UA .................................................................. 23
Annex 3 – SURE Urban Assessment Tools......................................................................................... 25
3
Key definitions and acronyms
Citizens - refers to the entirety of the population that resides within the municipal boundaries and is
not related to the official status of an individual that reside in the municipal boundaries (as some do
not have official Nepali citizenship).
BRC
CBDRM
CBOs
CDMC
CFUGs
DC
DDC
DDRC
DDRT
DFID
DM
DRR
DRM
DUDBC
EPS
EQ
FGDs
IFRC
J/YRC
LDMC
LDRMP
MoFALD
MoHA
MoUD
NGO
NPR
NRA
NRCS
NS
NSRUC
PRA
PwDs
SURE
UA
VDC
WCF
9MCs
British Red Cross
Community Based Disaster Risk Management
Community Based Organisations
Community Disaster Management Committee
Community Forestry User Groups
District Chapter
District Development Committee
District Disaster Response Committee
District Disaster Response Team
Department for International Development
Disaster Management
Disaster Risk Reduction
Disaster Risk Management
Department for Urban Development and Building Construction
Earthquake Preparedness for Safer Communities in the Kathmandu valley
Earthquake
Focus Group Discussions
International Federation of Red Cross and Red Crescent Societies
Junior/Youth Red Cross
Local Disaster Management Committee
Local Disaster Risk Management Planning
Ministry of Federal Affairs and Local Development
Ministry of Home Affairs
Ministry of Urban Development
Non-Governmental Organisation
Nepalese Rupee
National Reconstruction Authority
Nepal Red Cross Society
National Society
National Strategy for Resilient Urban Communities
Participatory Rapid Appraisal
Person with Disabilities
Strengthening Urban Resilience and Engagement programme
Urban Assessment
Village Development Committee
Ward Citizen Forum
Nine Minimum Characteristics of a Disaster Resilient Community

4
Objectives of Guidelines
The purpose of these guidelines is to document the process and rationale the development and
implementation of the Urban Assessment (UA); providing guidance on how to carry out urban
disaster risk reduction / resilience assessments.
Strengthening Urban Resilience and Engagement(SURE) programme
The SURE programme will work in seven municipalities across three of Nepal’s major urban centres
over a 5 year period (2016-2021). The programme is designed to improve the urban disaster
resilience of municipal governments, the Nepal Red Cross Society (NRCS) and citizens, including
specific vulnerable groups, across the seven targeted municipalities1. SURE will use multi-hazard and
informal network approaches to better understand and build the overall disaster resilience of
municipalities.
Urban assessment One of the pivotal outputs of the SURE programme’s recently completed inception phase was the
Urban Assessment (UA). The assessment of 3,293 participants was conducted in the eight originally
targeted municipalities, to understand the capacity, vulnerabilities and context of each area and
citizens within them.
Rationale for the design of the tools
Based on learning from the EPS programme2, ISET and American Red Cross’ neighbourhood focused
urban tools and the limited number of other urban CBDRM programmes3 that have taken place in
Nepal, we know that rural-based spatially-driven vulnerability and capacity assessment (VCA) tools
are difficult to use in large urban centres. These were originally designed to capture the
vulnerabilities and capacities of villages or ‘communities’ that are easily geographically defined,
largely homogenous and with members who work and reside in a single settlement. VCAs are usually
conducted in a ‘town hall’ meeting style, with participants attending from each household for 3-5
days of continuous activities.
The complexities of urban living make this a much less viable approach. Time constraints, citizens
residing in different areas from where they work, heterogeneous make-up of neighbourhoods, social
isolation, and large contingents of migration are just some reasons why use of the rural-based VCA
tools has not wielded a depth of understanding of disaster vulnerability and capacity issues. Lessons
learnt from the EPS programme also highlighted the challenges in engaging meaningfully with
marginalised and hard-to-reach groups.
The breadth of information per municipality has been relatively easier to access with large amounts
of secondary information already existing in many of the urban areas SURE is targeting. One of the
challenges was how gain an in-depth understanding of citizens and vulnerable groups vulnerabilities
1 Note at the time of the urban assessment (December 2016 – February 2017) the SURE programme was working in 8
municipalities. Since then the Government of Nepal has restructured municipalities and 2 of the municipalities targeted
Bajraharahi and Karyabinayak have largely been consumed by Godavari municipality, which the SURE programme will now
focus on.
2 The EPS is NRCS / BRC Earthquake Safety Programme that ran from 2012-2014 in the Kathmandu Valley 3 See annex 1 for a detailed review of global urban tools.

5
and level of capacity. In order to collect this depth of information a different methodology was
necessary.
Conceptualising ‘Urban disaster resilience’
SURE, in developing the UA referred to the following key urban and resilience frameworks:
ARUP’s City Resilience Framework4 articulates 12 indicators that play critical roles when a city is in
crisis or faces chronic problems and are outlines in figure 1 below. ARUP defines city resilience as
‘the capacity of cities to function, so that the people living and working in cities – particularly the
poor and vulnerable – survive and thrive no matter what stresses or shocks they encounter’5.
Figure 1: ARUP’s 12 indicators of city resilience framework
ALNAP’s recent working paper ‘Stepping back: understanding cities and their systems’ articulates 8
characteristics that humanitarian organisations need to consider when working in urban contexts
(outlines in figure 2). Like ARUP, they also take a systems approach to working in urban contexts.
4 Rockefeller Foundation (2014) ‘City Resilience Framework’
5 Rockefeller Foundation (2014) ‘City Resilience Framework’ , p.3.

6
Figure 2: ALNAP’s 8 characteristics for humanitarians to consider in urban contexts6
DFID’s Resilience Framework (2011); the framework argues that the ability to deal with a disaster
‘...is based on the levels of exposure, the levels of sensitivity and adaptive capacities’7. As such
citizens with high levels of economic insecurity, women, those with limited mobility and/or a
marginalised social status can be considered to have exacerbated sensitivity to any shocks. Nepal’s
Economic survey 2015/2016 estimates that the impact of the 2015 earthquake will increase the
number of poor people between 2.5% to 3.5% nationally, highlighting the sensitivity of citizens who
are economically insecure and unable to weather shocks and stresses8.
IFRC’s Characteristics of a safe and resilient community9 identifies the following elements of a safe
and resilient community: knowledge, healthy, organised, connected, has infrastructure and services,
has economic opportunities and can manage its natural assets. These characteristics have been used
to triangulate resilience components that need to be considered when focusing on building resilient
communities.
Flagship 4’s 9 Minimum Characteristics of a Disaster Resilient Community in Nepal (9MCs): Final
Review10
was published in December 2016 and highlights that the characteristics should be applied
in a flexible manner, adapted to the context in which they are applied. It also recommends that
6 Campbell, L. (2016) Stepping back: understanding cites and their systems. ALNAP Working Paper. London: ALNAP/ODI
7 DFID (2011) ‘Defining Disaster Resilience: A DFID Approach Paper’ (p8)
8 Ministry of Urban Development (2016) ‘Inclusive Cities: Resilient Communities - Nepal National Report’
9 IFRC (2011) ‘Characteristics of a Safe and Resilient Community: Community-Based Disaster Risk Reduction Study’
10 Nepal Risk Reduction Consortium (2016) ‘Flagship 4 Handbook: Nepal’s 9 Minimum Characteristics of a Disaster Resilient
Community’
7
programmes need to understand how people organise themselves and work with established
groups, noting the raised expectations that citizens have of urban governments as they provide
assistance during and post disasters.
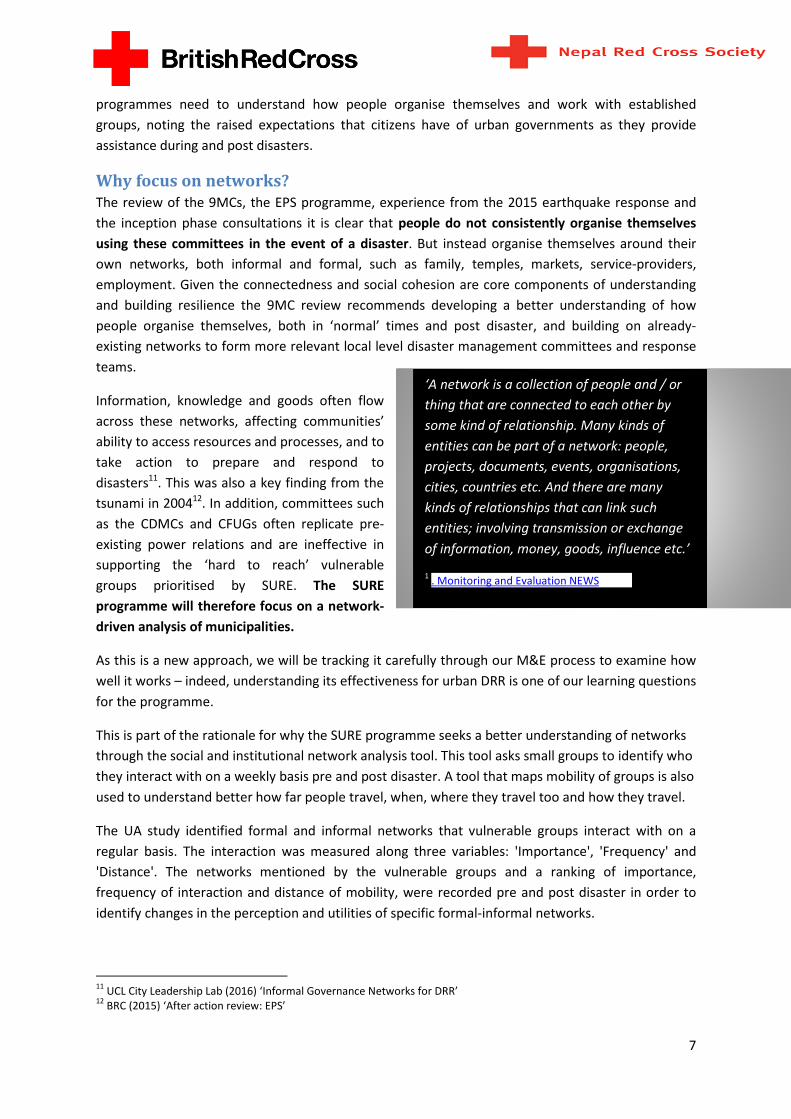
Why focus on networks?
The review of the 9MCs, the EPS programme, experience from the 2015 earthquake response and
the inception phase consultations it is clear that people do not consistently organise themselves
using these committees in the event of a disaster. But instead organise themselves around their
own networks, both informal and formal, such as family, temples, markets, service-providers,
employment. Given the connectedness and social cohesion are core components of understanding
and building resilience the 9MC review recommends developing a better understanding of how
people organise themselves, both in ‘normal’ times and post disaster, and building on already-
existing networks to form more relevant local level disaster management committees and response
teams.
Information, knowledge and goods often flow
across these networks, affecting communities’
ability to access resources and processes, and to
take action to prepare and respond to
disasters11
. This was also a key finding from the
tsunami in 200412
. In addition, committees such
as the CDMCs and CFUGs often replicate pre-
existing power relations and are ineffective in
supporting the ‘hard to reach’ vulnerable
groups prioritised by SURE. The SURE
programme will therefore focus on a network-
driven analysis of municipalities.
As this is a new approach, we will be tracking it carefully through our M&E process to examine how
well it works – indeed, understanding its effectiveness for urban DRR is one of our learning questions
for the programme.
This is part of the rationale for why the SURE programme seeks a better understanding of networks
through the social and institutional network analysis tool. This tool asks small groups to identify who
they interact with on a weekly basis pre and post disaster. A tool that maps mobility of groups is also
used to understand better how far people travel, when, where they travel too and how they travel.
The UA study identified formal and informal networks that vulnerable groups interact with on a
regular basis. The interaction was measured along three variables: 'Importance', 'Frequency' and
'Distance'. The networks mentioned by the vulnerable groups and a ranking of importance,
frequency of interaction and distance of mobility, were recorded pre and post disaster in order to
identify changes in the perception and utilities of specific formal-informal networks.
11
UCL City Leadership Lab (2016) ‘Informal Governance Networks for DRR’ 12
BRC (2015) ‘After action review: EPS’
‘A network is a collection of people and / or
thing that are connected to each other by
some kind of relationship. Many kinds of
entities can be part of a network: people,
projects, documents, events, organisations,
cities, countries etc. And there are many
kinds of relationships that can link such
entities; involving transmission or exchange
of information, money, goods, influence etc.’
1 . Monitoring and Evaluation NEWS, 2017.

8
Common networks were identified by groups across municipalities and included the informal
(relatives, family, temple) and formal networks (schools and workplaces, bank/cooperatives,
municipal office/ ward office). Most of the groups across all municipalities identified family,
schools and workplace, as the most important networks both pre and post disaster. They have
high frequency of interaction with these networks, and they typically reside within the district.
Perceived level of importance of bank/ cooperatives and government offices, among groups across
all districts scaled up post disaster, indicating that these networks played an important role post
disaster. With exception of the elderly (who rated this highly), most of the groups identified temples
as a least important network, even though it resided within the ward area.
Defining ‘community’ in the urban context
In delivering a programme focusing on “communities” it is important to be clear on what is meant by
that term. The concept of community is used loosely and inconsistently in the sector as a whole,
creating complications in implementation and limitations in impact which are often tolerated as
‘inevitable’13
. Moreover, Nepal’s traditional defining features of community (more applicable to rural
settings) rarely transfer to its urban contexts.
Learning from EPS and rural CBDRM interventions both in Nepal and regionally highlights that the
geographical classification of communities is deeply problematic14
. In an urban context this only
becomes more complicated due to increased heterogeneity of areas, lack of social cohesion and
difficulties in engaging with “community” members.
The 9MC review which was published during the inception phase observes that geographical
boundaries are arbitrary, and encourages organisations and government to understand more about
how citizens organise themselves in practice and how they communicate vertically and horizontally
across formal and informal networks.
In their study in eastern Nepal, Jones, Aryal & Collins (2013) note that using a geographical definition
of community often leads to ‘…insufficient attention paid to the asymmetries of power and
heterogeneity of interests in internally differentiated groups’15
. In targeting “hard to reach” citizens
and citizens in general in urban areas, the SURE programme will use the six types of urban
community defined by Hamdi (2004) and Kupp (2016) – figure 3. These definitions will guide the
SURE urban citizen engagement framework and the broader urban engagement and accountability
strategy.
Although this approach brings its own set of complications and logistical challenges, it is essential to
move away from the status quo if the programme is to achieve its aims. There are two main benefits
to trialling this approach:
• It tests a new model of working in urban communities and within the realities of how people
network with one another, which does not rely on artificial geographic groupings;
13
Cannon T. (2015). ‘The fallacy of community: how realistic is grassroots work? Discords of gender, class, caste,
ethnicity’. 14
BRCS (2015) ‘EPS After Action Review’ 15
Jones et al., 2013, ‘Local-level governance of risk and resilience in Nepal’ (p. 446)

9
• While geographical communities risk excluding our priority hard to reach and “hidden”
community members and where traditional power dynamics strongly influence results, the
programme will instead target groups based on the networks which they themselves identify
with.
Figure 3 – six types of urban community16
Interlinkages with climate change
The Red Cross / Red Crescent climate smart DRR indicators have been applied to the Urban
Assessment and highlight issues such as weather related hazards and the perception from the
community of whether these will increase in severity over the coming 10 years. The minimum
standards will also be applied through the awareness raising and risk reduction and mitigation
activities with citizens, vulnerable groups and municipal government.
Weather and climate change related hazards make up 50% of the hazards that SURE will target:
drought, cold wave, fire, flood, epidemic, landslide and pollution.
Livelihoods and economic security
In line with the initial parameters of the SURE proposal the economic security/livelihoods and
conflict analysis tools were not included in the UA, but a question about livelihoods was included in
the semi-structured interview as this emerged as an area warranting more focus than originally
planned. Due to the urgency in undertaking the UA, it was agreed that the political economic
analysis should happen at a later date.
Linking with Government of Nepal
Nepal’s LDRMP and the Urban Assessment
The Local Disaster Risk Management Plan (LDRMP) guidelines were endorsed in 2011, providing
guidance to local level government structures how to assess and plan for disaster risk management
at the local level, including an agreed VCA process. The LDRMP is currently under revision, with the
16
Hamdi, 2004, ‘Small Change: About the Art of Practice and the limits of Planning in Cities’ (published by Earthscan) and
Kupp, 2016, cited in ALNAP, 2016, ‘Stepping back: understand cities and their systems’ (Campbell)
Communities of place: common spatial
connection
Communities of interest: formed around a common
issue/concern
Communities of resistance: shared experience of crisis/displacement
Communities of culture: shared language, beliefs,
values
Communities of practice: common livelihoods
Virtual/digitised communities: connected
through new media

10
intention to include climate change adaptation components. It is important that this forum also
considers the experience of working in urban setting including this urban focused assessment.
To ensure that the urban assessment doesn’t replicate existing processes, such as the LDRMP, a
comparison of the spatially-driven LDMRP VCA against the network-focused SURE UA tools
illustrates the same basic levels of information collected by both tools. However it is the
methodology of collecting this information (and therefore their reach into the citizens and
vulnerable groups are prioritised) that is different and makes the UA suitable to the urban context.
See annex 2 for a detailed analysis of the respective tools.
National Strategy for Resilient Urban Community
In November of 2016 the National Strategy for Resilient Urban Community (NSRUC) was launched,
which focuses on disaster resilience in urban areas, and building resilience at the municipal level. A
total of 108 indicators were developed and tested, designed to assess a municipality’s level of
resilience. NRCS will use these as a part of their baseline assessment for municipal governments it
works with.
In light of this work, the UA was designed to contribute to the work suggested municipal
governments carry out in the draft NSRUC including:
• Multi-hazard risk analysis
• Contribution of GIS-based multi-hazard information
• Identification of vulnerable communities, groups and households in urban areas
• Building knowledge of citizens and vulnerable groups about the multi-hazards in their
municipalities.
In addition, the UA guidelines was developed with reference to the following documents:
• IFRC Minimum Standard for Climate Smart Disaster Risk Reduction
• Natural Calamity (Relief) Act 2039 (1982)
• Local Self-Governance Act 2055 (1999)
• National Strategy for Disaster Risk Management (NSDRM) 2009
• 2005 Hyogo Framework for Action
• 2015 Sendai Framework
• Sustainable Development Goals
• Local Adaptation Plans of Action (LAPA)
• National Strategy for Resilient Urban Community (NSRUC) 2016
• Flagship 4’s Final Review of the 9 minimum characteristics of a disaster resilient community
in Nepal
• School Development Plan (MoE)
• Nepal National Report – Inclusive Cities: Resilient Communities (MoUD)
• ARUP City Resilience frameworks
• ALNAP 13 urban characteristics
• IFRC characteristics of a resilient community
• NRCS / BRC EPS lessons learnt
• NRCS / BRCS EPS After Action Review

11
Urban Assessment Tools Below is the list of tools that were developed, piloted, revised and implemented in 8 municipalities
in Nepal. A detailed explanation of each tool is available in annex 3. Tool 1: Secondary Data
Collection
• Tool 1: Secondary data collection
• Tool 2: Historical Hazard Profile
• Tool 3: Hazard Risk Matrix
• Tool 4:Semi-Structured Interviews
• Tool 5: Social and Institutional Network Analysis
• Tool 6: 24 Hour Clock ( Mobility Mapping)
• Tool 7: Basic Hazard Mapping
• Tool 8: Planning for Urban Resilience
Piloting of UA
Once provisionally designed, the tools were further reviewed in line with the LDRMP guidelines and
against the past experience of the NRCS in VCAs, as well as the experience of two District Chapters
responsible for piloting the UA tools in Karyinbainyak and Dhanghadi municipalities. The pilot
provided an opportunity to involve multiple levels of NRCS from senior governance members to
filed-based volunteers, as well as municipal government partners, to actively engage, contribute to,
the tools and methodologies being employed by the programme. As a result, the tools were updated
with stakeholder insights that helped ensure they were as fit for purpose as possible before being
rolled out in the other 6 remaining municipalities.
Process of developing and implementing the tools
The UA process occurred over a 6 week period, with the exception of the UA training to the NRCS
other non-SURE programme management staff. A summary of the tool and the process is
highlighted in figure 4.

12
Figure 4: Process of creating urban assessment
How to carry out an Urban Assessment
Participants in the Urban Assessment
The UA involved a range of stakeholders belonging to different social sectors and institutions. The
UA participants included;
• 10-16 vulnerable groups per municipality (described in detail below);
• municipality and government officials;
• security forces,
• political parties and
• media
Human resources:
The UA was carried out jointly by the municipality and the local Nepal Red Cross District Chapter.
Alongside the municipality and Red Cross facilitators, linkages with the ward citizen forums or
L/CDMCs, where they exist, can be useful facilitators and strengthen existing links and provide a
helpful introduction and perspective on the urban area being assessed. Volunteers will be key for
performing focus groups, holding interviews and mapping the urban areas and require a 1.5-2 day
training on new methodology and tools.
Disaggregated data (gender and age)
The UA disaggregates data by both men and women. The UA had considerable participation of both
men and women. In most of the analyses including network analysis and mobility mapping, there
was higher female participation in comparison to men. In Kathmandu and Pokhara, people belonging
Review of international and national VCA and
urban context documents
UA design
NRCS trained on UA
Pilot in 2 municpalities
(included observers from all districts)
De-brief workshop (81
recommendations recorded)
UA tools updated with
recommendations
NRCS re-trained on tools (unchanged tools re-taught by
NRCS staff)
UA carried out in remaining 6
municipalities
UA results shared with all municipal
governments
UA tools and guidelines produced
UA approach and summary of results shared with other NRCS and external DM programmes and government
UA training to NRCS PM and other DM
organisations by NRCS SURE staff (including
training package).
Feeding UA approach and learning into
LDRMP revision and IFRC global revision
of VCA tools

13
to third gender (LGBTI community) were also included in the course of the study, identified as
vulnerable groups.
Methodology of identifying vulnerable groups
One of the most challenging aspects of the UA was identifying and ‘reaching’ vulnerable groups. The
following outlines the process in which SURE identified 10-16 vulnerable groups per municipality to
include in the UA.
Selection of vulnerable groups
Recommendations from the review of EPS and DFID DRM programmes in Nepal highlight the need
for more explicit social inclusion strategies in future urban CBDRM programming. Building on the
SURE proposal and inception phase, the programme has developed its urban citizen engagement
framework in an attempt to reach and better engage ‘hard to reach’ groups in the urban area. This
approach separates citizens into two categories: general urban citizens and, within this, specific
vulnerable groups who will be the focus of SURE. Working with specific vulnerable groups, schools
and general citizens (using the 6 types of ‘communities’) the programme seeks to achieve depth by
reaching the most vulnerable and breadth by supporting citizens to raise their voices to the local
and municipal government levels.
An initial list of groups vulnerable to the impact of disasters was collated for each municipality
through contacting the following organisations:
o Social Welfare Council
o District Coordination Committee
o District Administration Office
o PwD National Association
o Association of small shop keepers
o Single women’s association
o National Landless Association
o Other NGO in the Municipality
o Municipality office
o NRCS guidelines for vulnerable groups ( in CBDRR guidance)
o Dalit and Janajati National Association
Verification of lists of vulnerable groups
Once the initial list was compiled of groups vulnerable to disasters, they were verified with the
following organisations, who added any groups that were felt missing:
- Municipal government
- NRCS District Chapter
- stakeholder identified in the secondary data review and
- NGOs working in the area that were registered with the social welfare council.
Vulnerable groups that participated in the Urban Assessment
In the UA process 10-16 vulnerable groups were identified in each municipality through consultation,
and each was assessed as part of the UA. Although the total types of vulnerable groups that took
part in the urban assessment was 21 (see figure 6 for overview). Groups common to all

14
municipalities included Dalit; school children; single female headed households; labour workers;
landless people; Persons with Disability (PwDs); and, Janajati.
Figure 5: Number of people from vulnerable groups that participated in the Urban Assessment
Vulnerable groups specific to each municipality were also included in the assessment such as
renters, street children, tourists and Internally Displaced Persons (IDPs) in Kathmandu.
Engaging with identified vulnerable groups
Once lists were collected, two sampling methodologies were used to engage with these citizens:
1. Meeting with ward representatives for each of the vulnerable groups in one meeting, eg. all
the ward representatives for Dalits met and carried out focal group discussions (FGDs) and
other tools.
o To verify that these representative voices aligned with the citizens they were
actually representing, random confirmation FGDs were undertaken as a second step
with citizens.
2. In addition, ‘snowball’ sampling17
was used to access vulnerable people and avoid the same
representatives attending multiple meetings for various groups.
Through the urban assessment these 10-16 different vulnerable groups to disasters were assessed in
each municipality. NRCS district chapters were then asked to rank and select four of these groups to
work with as part of the SURE programme, against the following criteria:
o their level of vulnerability to disasters
o the groups’ willingness and interest to build their disaster resilience
o the NRCS’ skills and experience in working with the groups.
17
Snowball sampling is where research participants recruit other participants for a test or study. It is used where potential
participants are hard to find. It’s called snowball sampling because (in theory) once you have the ball rolling, it picks up
more “snow” along the way and becomes larger and larger. Snowball sampling consists of two steps:
1. Identify potential subjects in the population. Often, only one or two subjects can be found initially.
2. Ask those subjects to recruit other people (and then ask those people to recruit. Participants should be made aware
that they do not have to provide any other names.
242265
246 256282
249219 222
132113
66 5231 36
85
3715 22
4115 11 15 15

15
Information the Urban Assessment will generate
• A better understanding of the municipal hazard and vulnerability profile, by consolidating
secondary information. This will continue to evolve with Open Street Mapping and as additional
assessments are added.
• An understanding of urban citizens and vulnerable groups perceived ranking of hazards, level of
vulnerability and capacity of resilience, along with their formal and informal networks, and a
profile of their movement in the urban area assessed.
• The ability to determine actions which municipal government and citizens can change, influence,
or where acceptance (mitigation) is necessary. This information feeds into planning processes
and also advocacy strategies.
• A greater picture of the functionality of governance mechanisms and political economy of
disaster risk management in the municipality.
Urban Assessment Process
The UA process, outlined clearly in figure 6 and below involves the following 4 steps of data
collection, analysis and validation.
Step 1: secondary data review & sharing
To achieve breadth in the assessment findings tool1: secondary data collection and tool 2: historical
disaster profile is used. Information is collected and is verified through ward citizen forums, local
government officials, or L/CDMCs where they exist.
It’s important to not only collect previously assessments specific to disaster management, but the
municipality as a whole (including climate change, infrastructure development, economic viability
etc.). This forms part of the political economy analysis or context of the municipality.
Step 2: data collection
Target groups for example municipal officials undertake tool 3: hazard risk matrix and tool 4: semi
structured interview together, as one group. The group is then split into 3 and each of these groups
undertakes one of the following tools: tool 5: social and institution network analysis, tool 6: 24 hour
clock or tool 7: basic hazard mapping. Where possible, groups should be disaggregated by gender,
age and any other commonality (eg. livelihood).
All information needs to be captured in the data collection spread sheet (see annex 4). Semi
structured interview summaries can be entered into the spread sheet for each question and it is
recommended a scanned copy of the original notes be kept on file for records.
Step 3: analysis and reporting
Data collection spread sheets are analysed using SPSS software (due to the volume of the data
collected), with both reports and presentations produced for further sharing and validation with
target groups who information was collected from.
Strong information management and oversight is necessary as a significant amount of information is
collected through the process.

16
Step 4: planning for resilience
An analysis of the Urban Assessment shared. Tool 8 is used to determine areas of action in targeted
meetings along with the following additional objectives:
• Municipal representatives: NSRUC indicators completed
• NGOs: partnership mapping
• Political parties and
• Citizens from the selected vulnerable groups.
Figure 6: Urban assessment process
Data review:
Tool 1 - Secondary Data Collection
Tool 2 - Historical Disaster Profile
Data verification:
Tool 1 - Secondary Data Collection
Tool 2 - Historical Disaster Profile
An analysis of the Urban Assessment shared. Tool 8 is used to determine areas of action in targeted meetings along with
the following additional objectives:
- Municipal representatives: NSRUC indicators completed
- NGOs: partnership mapping
- Political parties and
- Citizens from the selected vulnerable groups.
STEP 1:
Secondary
data review
& sharing
STEP 2:
Data
Collection
STEP 4:
Planning
for
Resilience
All information is collected in the Assessment Data Collection spread sheet. SPSS analysis of data is necessary due to the
volume of information collected. Report and presentation produced for validation workshop with target groups.
STEP 3:
Analysis &
reporting
Target Group: Municipal
& District officials
Target Groups: Municipal
officials, NGOs, security
forces, political parties &
vulnerable groups
Target Groups:
sub groups from hazard
risk matrix and semi
structured interview
group
The UA information is shared with citizens and municipal governments. The SURE programme commits to continuing to
build on information collected through open street mapping, NSRUC indicators etc. and to feeding into municipal and local
government planning processes.
On-going
programming
The group now splits into 3,
with each group completing
1 of the below tools
Data collection:
Tool 3: Hazard Risk Matrix +
Tool 4: Semi- Structured Interview
Tool 5: Social &
Institutional
Network Analysis
Tool 6:
24 Hour Clock
Tool 7: Basic
Hazard mapping Disaggregate by
gender, age &
commonality
Tool 8: Planning for Urban
Resilience determines areas for
action and advocacy (change/
Influence / accept)

18
Tips for organising Urban Assessment
The below diagram outlines how the NRCS team organised the Urban assessment in each
municipality.
Effort involved in carrying out UA
• The UA took an average of 6.5 days per municipality, which covered training volunteers,
collecting and entering data (note data was analysed separately by a consultant
(approximately 18 days needed for data analysis and narrative).
• A total of 3,293 people participated in the UA across the 8 municipalities (an average of 409
per municipality)
• 199 focus groups discussions (FGDs) and key informant interviews were conducted
• 159 government participants were involved
Organizing field staff for Urban Assesment
Training for Program Staffs
• 15 Vulnerable Group
• 3 cluster *15 group
• 45 group Involved
• Logistic Preparation
• Field visit for time and
venue of VG
Mo
nit
ori
ng
Te
am
Program Staffs
• Municipality / Gov Officer cluster member
• Political Leader • Security Forces
• NGO / INGOs
Training for Volunteers
UA Tools & Methodology
Field Volunteer
• Logistic Preparation
• Confirmation of participant
from different stakeholder
Assessment with Assessment with
Da
ta C
om
pila
tion
/
Re
po
rting
Tea
m
Validation & Planning Meeting
19
Although the total population of these 8 municipalities is 1,822,730, SURE’s urban citizen
engagement framework of targeting specific networks and not ward boundaries has resulted in a
detailed snapshot of 10-16 target groups in each municipality and a breadth of information across
the area.
When to conduct an Urban Assessment?
The UA process is designed to be iterative, and can be repeated every 1-2 years depending on the
needs of the municipal government. At a minimum a review of new secondary data should occur
annually to keep pace with the rapidly evolving context of the urban environment. In recognition of
the multiple DRR actors in various municipalities and the on-going revision of the LDRMP guidelines,
the information generated by the UA is designed to be inputted into the LDRMP.
A report of the UA for each municipality has been shared with the municipal government inn both
hard and soft copy.

Annex 1 – Global Review of Urban VCA tools
No Tools Type of tool Description
American
Red Cross
Vietnam
Bangladesh
Red
Crescent
Urban V2R
Nepal Red
Cross EPS
Municipal
L-SAT/
Toolkit Use
Information collection tools
1 Transect walk PRA (participatory
rapid appraisal)
To gain clear understanding of the slum
and its physical structure, land use,
problems, prospects etc
X
25%
2 Focus Group
Discussions data collection method
To gain information about the locality,
people, their livelihoods, local risk
environment (hazards) and
local/traditional preparedness and coping
strategy.
X X X X
100%
3 Seasonal Calendar PRA
To gain knowledge about slum based
livelihood options and its seasonality
dimensions.
X X
50%
4 Citizen profile secondary data Demographic profiling including religion,
sex, age, ethnicity, income groups) X
5 Mapping (risks
and resources) PRA/ spatial analysis
To identify and analyse common hazards
and resources in the locality and their
magnitude, likelihood and the resource
availability
X X X X
100%
Information analysis tools
6
Institutional and
social networks
analysis
social network analysis
To understand the perceptions that slum
dwellers have the roles to play and
significance of various organizations
within the slum
X X X
75%
7 24-hour clock PRA (gender/ mobility
safety)
To analyse slum dwellers’ mobility/
tasks at different places during day and
night time (gender and connectedness/
movement analysis when done by gender
X
25%

21
No Tools Type of tool Description
American
Red Cross
Vietnam
Bangladesh
Red
Crescent
Urban V2R
Nepal Red
Cross EPS
Municipal
L-SAT/
Toolkit Use
8
Household
economic analysis
(mini)
economic systems/
Livelihoods
To identify the major livelihoods in the
locality and their importance in the
context of existing hazards.
X X
50%
9 Review of
secondary data Data collection
Information from existing reports and
data on natural hazards and disasters
that have happened previously in the
ward and any other relevant information.
X X X X
100%
10 Historical Timeline PRA
Information from the local community
about previous natural hazards and
disasters in the last 5-10 years including
their damaging effects, frequency, and
local experiences in DRM.
X X X
75%
11
Strengths,
Weaknesses,
Opportunities and
Threats (SWOT)
Analysis
Synthesis
Information from the local community on
the existing personal, household,
community and institutions’ strengths,
weaknesses, opportunities and threats in
preparing for, responding to and
recovering from natural hazards and
possible disasters.
X X
50%
12 Synthesis Synthesis
Combine all information collected into
one table to identify clearly past and
potential natural hazards, disaster risks,
capacities, vulnerabilities and changes in
frequency of natural hazards over time.
X X
50%
13 Ranking Synthesis
Identify the priorities of the local
community from the information
collected.
X
25%
22
No Tools Type of tool Description
American
Red Cross
Vietnam
Bangladesh
Red
Crescent
Urban V2R
Nepal Red
Cross EPS
Municipal
L-SAT/
Toolkit Use
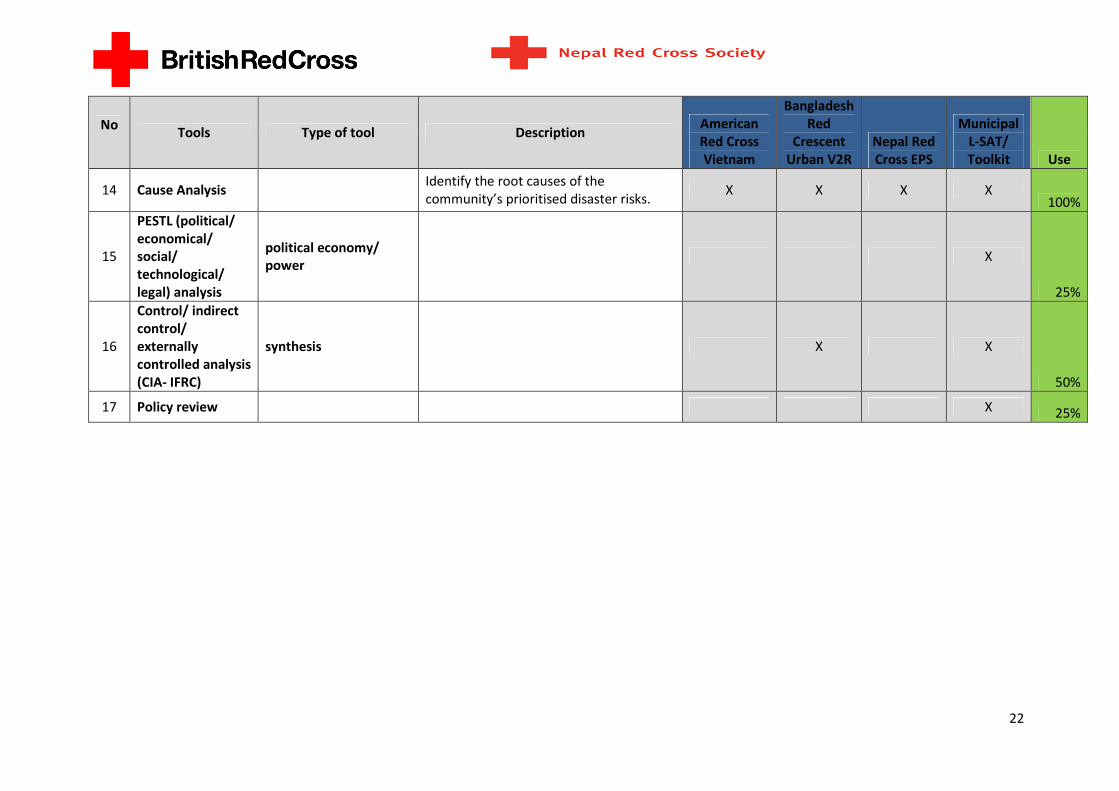
14 Cause Analysis Identify the root causes of the
community’s prioritised disaster risks. X X X X
100%
15
PESTL (political/
economical/
social/
technological/
legal) analysis
political economy/
power X
25%
16
Control/ indirect
control/
externally
controlled analysis
(CIA- IFRC)
synthesis X X
50%
17 Policy review X 25%

23
Annex 2 - Analysis of original LDRMP VCA and SURE UA
LDRMP VCA Urban Assessment
(SURE program)
Any difference? Analysis Source
1. Hazard mapping and
ranking
Tool 3: Hazard risk matrix Similar tool Both tools rank hazards. SURE tool is simplified using
colours and frequency and severity to make it more
appropriate for community use
IFRC tool, and
basic DM analysis
tool
2. Hazard calendar Not used Not suitable for
urban context
Not used as urban hazards have less seasonality,
although time of year can be noted in semi-
structured interviews
N/A
3. Historical timeline Tool 2: historical timeline Similar tool Collects the same data, SURE tools use secondary
information from multiple sources including
desinvestar. Municipalities update for missing period
(2013-2016)
Adapted IFRC tool
for urban context
from urban VCA
update
4. Hazard analysis Tool 8: Validation and
planning tool
The same Similar level of analysis and validation workshop
held with municipality.
Taken from
LDRMP
5. Community wellbeing
ranking
Not used Not used Information is collected via the extensive secondary
data available in most municipal areas. A separate
tool is not necessary.
N/A
6. Problem tree analysis Tool 8: Validation and
planning tool
Similar Similar - both look at cause of hazard, SURE tool also
looks at how to address through change=action,
influence=advocacy, accept=not changeable possible
mitigation
IFRC tool used in
VCA, similar to
LDRMP tool 6
7. Transect walk Tool 7: Mapping Similar Due to the size of the municipality, this is not
possible. As a first step the participants interviewed
IFRC DRAFT
digitalizing the

24
LDRMP VCA Urban Assessment
(SURE program)
Any difference? Analysis Source
identified hazard risk areas on printed maps. In the
first year of the SURE programme these will be
verified and added to using open street mapping.
VCA tool, adapted
to align with
LDRMP
8. Stakeholder analysis Tool 5: institutional and
network analysis
Similar Both tools look at important institutions. SURE tool
specifically targets networks in order to include both
formal and informal networks. Informal networks
are recognized as left out in most assessment but
are essential in disasters. SURE tool also looks at
how networks change after disaster.
IFRC VCA+ gender
analysis tools,
slightly adapted to
align with LDRMP
9. Mobility Map Tool 6: 24 hour clock Similar LDRMP looks at reasons why citizens contact
organisations, SURE tool looks at overall movements
and contacts during the day. This helps with to set
times for community engagement activities, as well
as shows informal networks, modes of
transportation and level of connectivity of areas
outside their neighbourhood. Also shows how much
time people spend at home vs. in the community
PRA tool used by
IFRC gender
training, used in
VCA tool kit in
BDRCS, and ZRC.
Adapted for Nepal
10. Target group
discussion
Tool 4: semi-structure
interviews
Similar Similar: both cover discussions with vulnerable
groups. SURE semi-structured interviews are more
in-depth discussions from municipal government to
vulnerable groups.
IFRC VCA tool.
Adapted for Nepal
11. Direct observation Tool 7: Mapping Not included in UA Due to the extensive geographical ground that
would need to be covered this will form a 1st
year
IFRC DRAFT
digitalizing the
VCA tool

25
LDRMP VCA Urban Assessment
(SURE program)
Any difference? Analysis Source
activity in Open Street Mapping (including urban
areas)
12. Documentation of
local skills, knowledge
and technology
Tool 4: semi-structured
interviews
Similar LDRMP looks at the preparedness measures and
coping mechanisms. These questions are asked in
the Tool 3 semi structured interviews
IFRC VCA tool
Identification and planning
Matrix
Tool 8: Validation and
planning tool
Similar SURE tool combines data from the cause (LDRMP
problem tree) and planning matrix to easily look at
areas of activities, advocacy or possible mitigation
IFRC VCA tool
N/A- not done likely
because areas covered are
smaller and less reports
exists covering small area
Tool 1:Secondary data
review
New Not part of LDRMP, in urban areas significant data
exists and should be reviewed in order to not
duplicate, and best align with policies other and
other stakeholders
IFRC VCA tool
adapted
Annex 3 – SURE Urban Assessment Tools