suprasternal notch echocardiography -...
TRANSCRIPT
Suprasternal Notch EchocardiographyAssessment of Its Clinical Utility
in Pediatric Cardiology
HUGH D. ALLEN, M.D., STANLEY J. GOLDBERG, M.D., DAVID J. SAHN, M.D.,
THERON W. OVITT, M.D., AND BARRY B. GOLDBERG, M.D.
SUMMARY Edcocardiographic suprasternal relats of thetransverse aortic arch (TAA), right piumonary artery (RPA) and leftatrium (Y' LAD) were validated and angi p e dmeasirement correlations were made for each stncture. Normal vaues
were detennined with respect to body surface area. In normals, reardes
of age or body size, mean dimsional TAA/RPA ratio was 1.2:1 and Y'LAD equaled the anterior-posterior, or Z axis, left atrial dimei (ZLAD). TAA/RPA ratio was inrased in aortic stenosis tetralogy ofFallot and was decreased in ventricular septal defect, atrial septa] defect
ECHOCARDIOGRAPHY HAS BECOME IMPOR-TANT in the initial diagnosis and serial follow-up ofpatients with congenital heart disease.5q To date, most echo-cardiographic examinations have been performed with a
transducer positioned on the anterior chest wall. Althoughsome angulation of the transducer can be accomplished,standard echo examination is mainly confined to theanterior-posterior, or Z axis. Ultrasonic examination fromthe suprasternal notch after the method of Goldberg5provides the capability of imaging the transverse aortic arch,right pulmonary artery and left atrium in a superior-inferioraxis. This approach is not unique to echocardiography forRadner "-I previously described passing a long needle in-feriorly via the suprasternal notch to measure pressures inthese vessels and in the left atrium. The purpose of the pres-
ent study in infants and children was 1) to validate theechocardiographic location of the transverse aortic arch,right pulmonary artery and left atrium imaged echocardio-graphically from the suprasternal notch; 2) to establishcriteria for measurement and normal values; and 3) toevaluate deviations from normal in patients with variousforms of congenital heart disease or chest deformities.
Methods
Echocardiographic Technique
Z-Axis Echocardiography
Single plane echocardiography was performed in theanterior-posterior (Z) axis according to previously describedtechniques 14, 11 with a Smith Kline Ekoline 20A Echocar-diograph and a Honeywell 1856 ultraviolet recorder. Asimultaneous limb lead electrocardiogram was recorded fortiming purposes. Most echocardiographic examinationswere performed with a 1/4 inch nonfocused 5 MHz trans-ducer coupled to the chest wall (usually at the left third or
fourth parasternal intercostal space) with an airless contact
and pulmonary stenosis. Ratio did not correlate with lesion severity as
assessed by cardiac catheterization except in pul_monry stenosis. Discre-pant Y' LAD values (usually increased Y' LAD and deceased Z LAD)occurred in children with various fonrs of heart disease. Some had seral
compression but others had normal chests. Children with pectus ex-
cavatum showed similar compression.
These findings underscore the need for ncorporain of aexamination into the standard ec rdiographic exainon ofcildren.
gel. Some older children were studied with a 3.5 MHz or a
2.25 MHz nonfocused transducer. A 7.5 MHz transducerwas used in some premature infants. In all instances thetransducer was held as perpendicular to the chest wall as
possible when imaging the heart. Quantitative measure-
ments were made according to the criteria of Epstein et al.1
Suprasternal Echocardiography
Normal Study. Suprasternal notch echocardiograms were
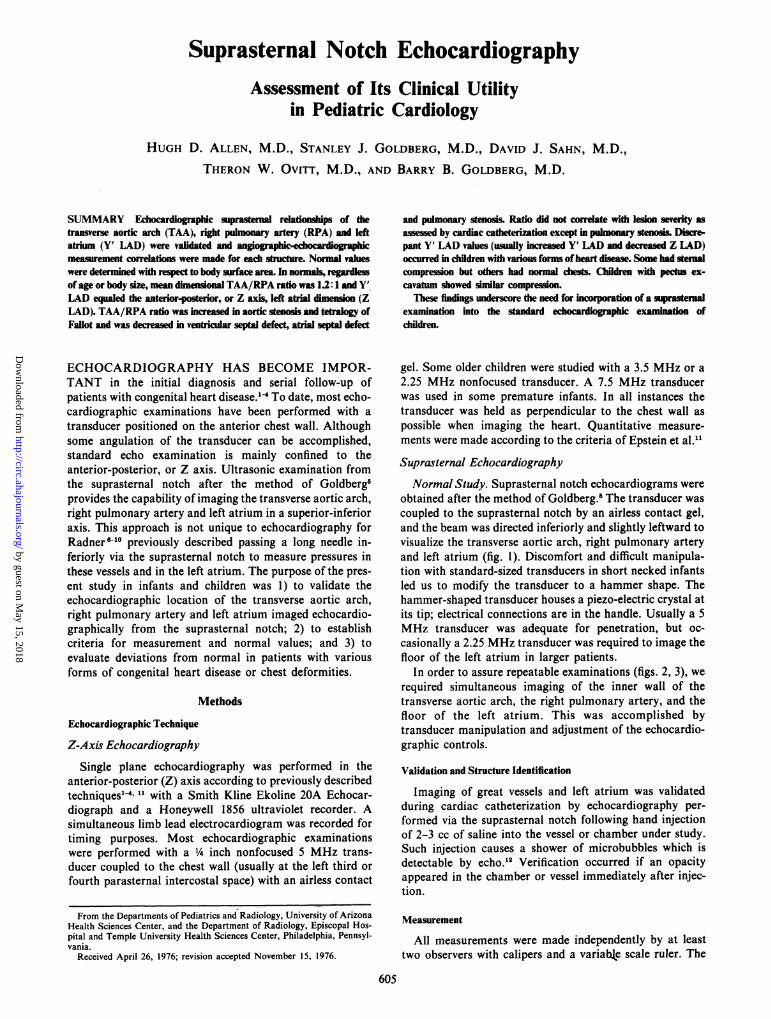
obtained after the method of Goldberg.5 The transducer wascoupled to the suprasternal notch by an airless contact gel,and the beam was directed inferiorly and slightly leftward tovisualize the transverse aortic arch, right pulmonary arteryand left atrium (fig. 1). Discomfort and difficult manipula-tion with standard-sized transducers in short necked infantsled us to modify the transducer to a hammer shape. Thehammer-shaped transducer houses a piezo-electric crystal atits tip; electrical connections are in the handle. Usually a 5MHz transducer was adequate for penetration, but oc-
casionally a 2.25 MHz transducer was required to image thefloor of the left atrium in larger patients.
In order to assure repeatable examinations (figs. 2, 3), werequired simultaneous imaging of the inner wall of thetransverse aortic arch, the right pulmonary artery, and thefloor of the left atrium. This was accomplished bytransducer manipulation and adjustment of the echocardio-graphic controls.
Validation and Structure Identification
Imaging of great vessels and left atrium was validatedduring cardiac catheterization by echocardiography per-formed via the suprasternal notch following hand injectionof 2-3 cc of saline into the vessel or chamber under study.Such injection causes a shower of microbubbles which isdetectable by echo.'2 Verification occurred if an opacityappeared in the chamber or vessel immediately after injec-tion.
Measurement
All measurements were made independently by at leasttwo observers with calipers and a variabe scale ruler. The
605
From the Departments of Pediatrics and Radiology, University of ArizonaHealth Sciences Center, and the Department of Radiology, Episcopal Hos-pital and Temple University Health Sciences Center, Philadelphia, Pennsyl-vania.
Received April 26, 1976; revision accepted November 15, 1976.
by guest on May 15, 2018
http://circ.ahajournals.org/D
ownloaded from
VOL 55, No 4, APRIL 1977
transverse aortic arch, right pulmonary artery and leftF ;E 20 Aatrium were measured from inner wall to inner wall at max-
imal chamber or vessel excursion. Echocardiographic Z axisaortic dimension was measured from outer anterior aorticwall to outer posterior aortic wall in the plane of the aorticvalve leaflets at the onset of the electrocardiographic QRScomplex.1' Comparative Z axis left atrial dimension wasmiieasured at its widest dimension in the plane of the aorticleaflets from the outer posterior aortic wall to the inner4;g;-xS;0g oX^tat,000i;00-| posterior left atrial wall."
Angiographic Comparisons
Angiographic measurements were made by a cardiacradiologist who had no knowledge of echocardiographicvalues and who used the same measurement and plane con-straints as for the echo measurements. Echocardiographicand angiographic suprasternal transverse aortic arch, rightpulmonary artery, suprasternal left atrial dimension and Z
FIGURE 1. The anatomic relationships of the transverse aortic axis aortic arch and left atrial dimension measurementsarch (Ao), right pulmonary artery (RPA) and left atrium (LA) areshown in the anterior-posterior and lateral planes. The hammer-shaped transducer is coupled to the suprasternal notch with an air-less contact gell. Usually, discomfort is minimal.
,,_~~~ ~ *
'I,~~~~~~~~~~~~~~~~~~~~~~~~MSPAvlcV Ax
f . . t. AO ............... --- . ._........
_:B_0;SM/W@ '0 ,''@0iT.,.'a
A IA LA ;f SE- IW FA ; ; 04f7 okLA
p~~~~~~t
V-
E-s
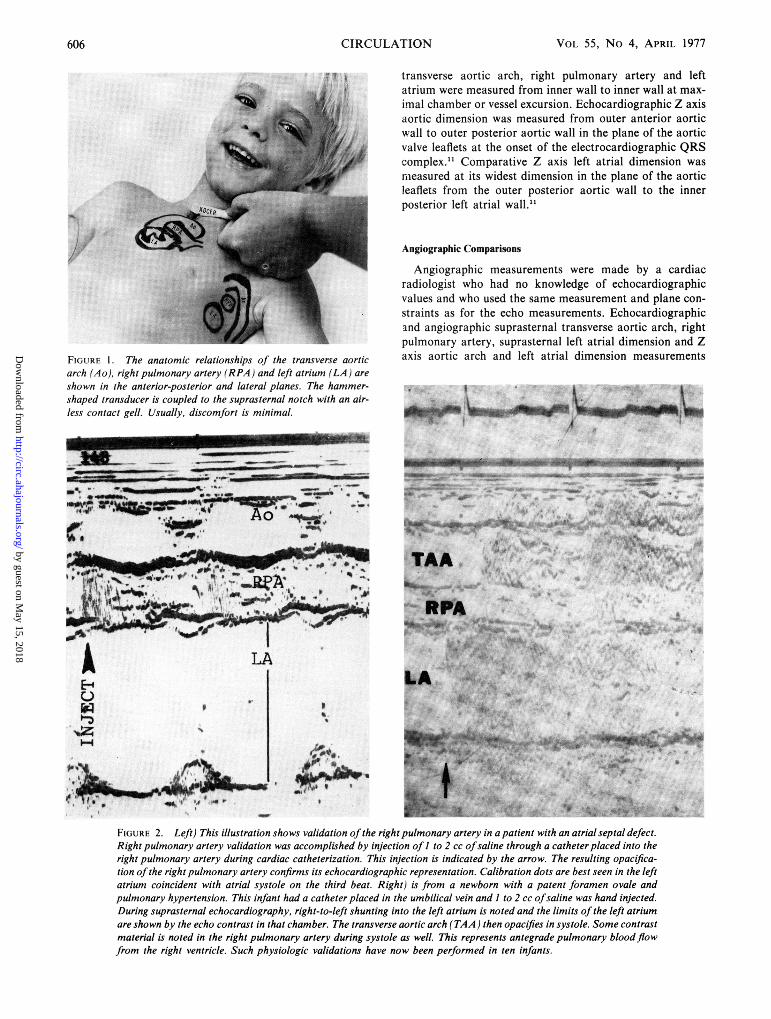
FIGURE 2. Left) This illustration shows validation of the right pulmonary artery in a patient with an atrial septal defect.Right pulmonary artery validation was accomplished by injection of I to 2 cc ofsaline through a catheter placed into theright pulmonary artery during cardiac catheterization. This injection is indicated by the arrow. The resulting opacifica-tion of the right pulmonary artery confirms its echocardiographic representation. Calibration dots are best seen in the leftatrium coincident with atrial systole on the third beat. Right) is from a newborn with a patent foramen ovale andpulmonary hypertension. This infant had a catheter placed in the umbilical vein and I to 2 cc ofsaline was hand injected.During suprasternal echocardiography, right-to-left shunting into the left atrium is noted and the limits of the left atriumare shown by the echo contrast in that chamber. The transverse aortic arch (TAA ) then opacifies in systole. Some contrastmaterial is noted in the right pulmonary artery during systole as well. This represents antegrade pulmonary blood flowfrom the right ventricle. Such physiologic validations have now been performed in ten infants.
CIRCULATION606
by guest on May 15, 2018
http://circ.ahajournals.org/D
ownloaded from
SUPRASTERNAL ECHOCARDIOGRAPHY/Allen et al.
were compared. Angiographic comparisons were madebetween the suprasternal (Y') left atrial dimension and thetrue Y (superior-inferior) left atrial dimension. During rou-tine cardiac catheterization, clinically indicated angiogramswere performed by injecting Renografin 76 into the vessel orchamber under study via an appropriately placed catheter.Biplane cineangiograms were recorded at 120 frames/sec on35 mm film. Catheter diameter served as calibration forangiographic chamber or vessel measurement. A maximumof three weeks elapsed between recordings of these two typesof examination, and most were performed within 24 hours ofone another. Angiographic definition of the superior borderof the left atrium was established as that area of the leftatrium in contact with the right pulmonary artery. The in-ferior limit of the left atrial suprasternal axis was defined asthe area just anterior to the mitral anulus in line with thesuprasternal notch, transverse aorta and right pulmonaryartery. Thus, the angiographic and echocardiographic
Z R
L E F T A T R I U M
"~~~~~~!
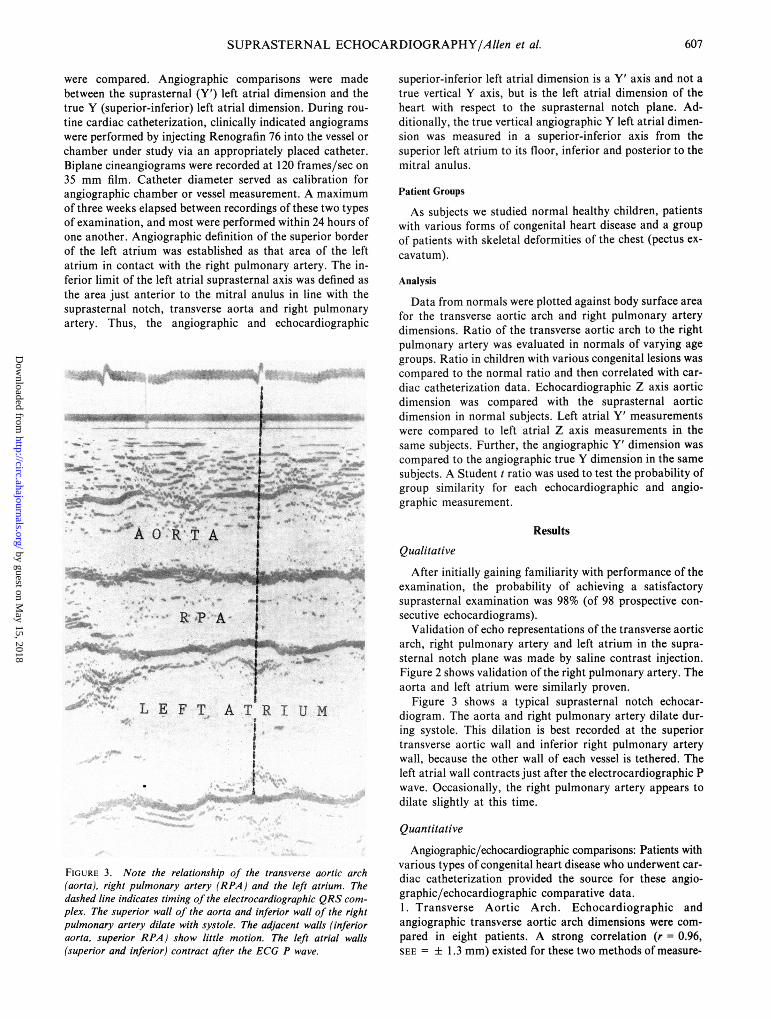
FIGURE 3. Note the relationship of the transverse aortic arch(aorta), right pulmonary artery (RPA) and the left atrium. Thedashed line indicates timing of the electrocardiographic QRS com-
plex. The superior wall of the aorta and inferior wall of the rightpulmonary artery dilate with systole. The adjacent walls (inferioraorta, superior RPA) show little motion. The left atrial walls(superior and inferior) contract after the ECG P wave.
superior-inferior left atrial dimension is a Y' axis and not atrue vertical Y axis, but is the left atrial dimension of theheart with respect to the suprasternal notch plane. Ad-ditionally, the true vertical angiographic Y left atrial dimen-sion was measured in a superior-inferior axis from thesuperior left atrium to its floor, inferior and posterior to themitral anulus.
Patient Groups
As subjects we studied normal healthy children, patientswith various forms of congenital heart disease and a groupof patients with skeletal deformities of the chest (pectus ex-cavatum).
Analysis
Data from normals were plotted against body surface areafor the transverse aortic arch and right pulmonary arterydimensions. Ratio of the transverse aortic arch to the rightpulmonary artery was evaluated in normals of varying agegroups. Ratio in children with various congenital lesions wascompared to the normal ratio and then correlated with car-diac catheterization data. Echocardiographic Z axis aorticdimension was compared with the suprasternal aorticdimension in normal subjects. Left atrial Y' measurementswere compared to left atrial Z axis measurements in thesame subjects. Further, the angiographic Y' dimension wascompared to the angiographic true Y dimension in the samesubjects. A Student t ratio was used to test the probability ofgroup similarity for each echocardiographic and angio-graphic measurement.
Results
Qualitative
After initially gaining familiarity with performance of theexamination, the probability of achieving a satisfactorysuprasternal examination was 98% (of 98 prospective con-secutive echocardiograms).
Validation of echo representations of the transverse aorticarch, right pulmonary artery and left atrium in the supra-sternal notch plane was made by saline contrast injection.Figure 2 shows validation of the right pulmonary artery. Theaorta and left atrium were similarly proven.
Figure 3 shows a typical suprasternal notch echocar-diogram. The aorta and right pulmonary artery dilate dur-ing systole. This dilation is best recorded at the superiortransverse aortic wall and inferior right pulmonary arterywall, because the other wall of each vessel is tethered. Theleft atrial wall contracts just after the electrocardiographic Pwave. Occasionally, the right pulmonary artery appears todilate slightly at this time.
Quantitative
Angiographic/echocardiographic comparisons: Patients withvarious types of congenital heart disease who underwent car-diac catheterization provided the source for these angio-graphic/echocardiographic comparative data.1. Transverse Aortic Arch. Echocardiographic andangiographic transverse aortic arch dimensions were com-pared in eight patients. A strong correlation (r - 0.96,SEE = + 1.3 mm) existed for these two methods of measure-
607
by guest on May 15, 2018
http://circ.ahajournals.org/D
ownloaded from

VOL 55, No 4, APRIL 1977
TABLE 1. Left Atrial Dimension ComparisonsZ LAD Z LAD Y'LAD Y'LAD Y LAD
Patient Lesion (mm) (angio) (mm) (echo) (mm) (echo) (mm) (angio) (mm) (angio)
1 VSD 20 18 14 15 232 VSD 26 28 28 21 313 VSD 14 12 11 11 174 ASD 20 17 18 17 385 ASD 20 23 23 23 306 ASD 16 15 17 17 267 ASD 20 20 20 18 358 AV Canal 16 18 16 13 259 AV Canal 20 19 17 14 26
10 AI,Ml 29 30 24 26 4311 PS 30 30 22 18 3512 PDA 13 12 10 9 1713 T of F 21 24 22 22 30
Abbreviations: VSD = ventricular septal defect; ASD = atrial septal defect; AV Canal = complete endocardial cushion defect;AI = aortic insufficiency; MI = mitral insufficiency; PS = pulmonary valvar stenosis; PDA = patent ductus arteriosus; T of F =tetralogy of Fallot; Z LAD = anterior-posterior left atrial dimension; Y' LAD = suprasternal axis left atrial dimension; Y LAD =vertical axis left atrial dimension; echo = echocardiographic; angio = angiographic.
ment. The resulting regression equation is TAAangio = 1.2(TAAecho) - 4.69.2. Right Pulmonary Artery. Eight patients had echocardio-graphic/angiographic comparisons and the correlation wasr = 0.95 (± 0.81 mm SEE). The regression equation for thisrelationship was RPAangio = 0.61 (RPAecho) + 4.39.3. Angiographic Y' - Left Atrial Dimension vsAngiographic Y Left Atrial Dimension (table 1). This com-parison was made in 13 patients and correlation wasr = 0.77 (SEE ± 4.5). The regression equation for the linewas Y'angio = .5 (Yangio) +3.4. Y' - Left Atrial Dimension (table 1). Suprasternalechocardiographic Y' left atrial dimension correlated wellwith the similarly measured angiographic dimension in 13subjects (r = 0.89, SEE = ± 2.2 mm). The regression equa-tion for this relationship is Y'angio = .72 (Y'echo) +5.5. Z - Left Atrial Dimension (table 1). Anterior-posterior(Z axis) left atrial angiographic and Z axis echocar-diographic measurements were compared in 13 subjects.Correlation was 0.95 (SEE ± 1.5 mm). The regression equa-tion for these measurements was Zangio = .85 (Zecho)+ 2.34.
Normal Subjects
Transverse aortic arch - right pulmonary artery. Maximalinner dimensions of the transverse aortic arch and right pul-monary artery were measured in 29 normal premature andfull term newborns ranging in weight from 1630-4470 grams(age 12 hours to 9 days) and in 71 older children (age 4months to 19 years, mean 10.1 years) ranging in body sur-face area from 0.3 to 2.0 M2.The dimensional data for transverse aortic arch and right
pulmonary artery correlated strongly with body surface area(r = 0.9 and r = 0.87, respectively). These normal curvesappear in figures 5 and 7.
Ratio of transverse aortic arch and right pulmonarydimensions (TAA/RPA) was evaluated. Since ratio forprematures and newborns was not significantly differentfrom that of older children, ratio data were combined. MeanTAA/RPA ratio in 100 normal subjects was 1.24 + .02.
Aortic root - transverse aortic arch comparison. TheTAA was 85% the size of the aortic root with a 90% proba-bility of not deviating from this value by more than .25 cm.
Left Atrium
Y'axis andZ axis comparison. Anterior-posterior (Z axis)left atrial dimension was compared with suprasternal leftatrial (Y' axis) dimensions in 58 normal subjects ranging inage from the newborn period through 18 years. Figure 4shows that these dimensions were usually equal in normals(r = 0.99, SEE ± 1.1 mm).
Children with Congenital Malformations
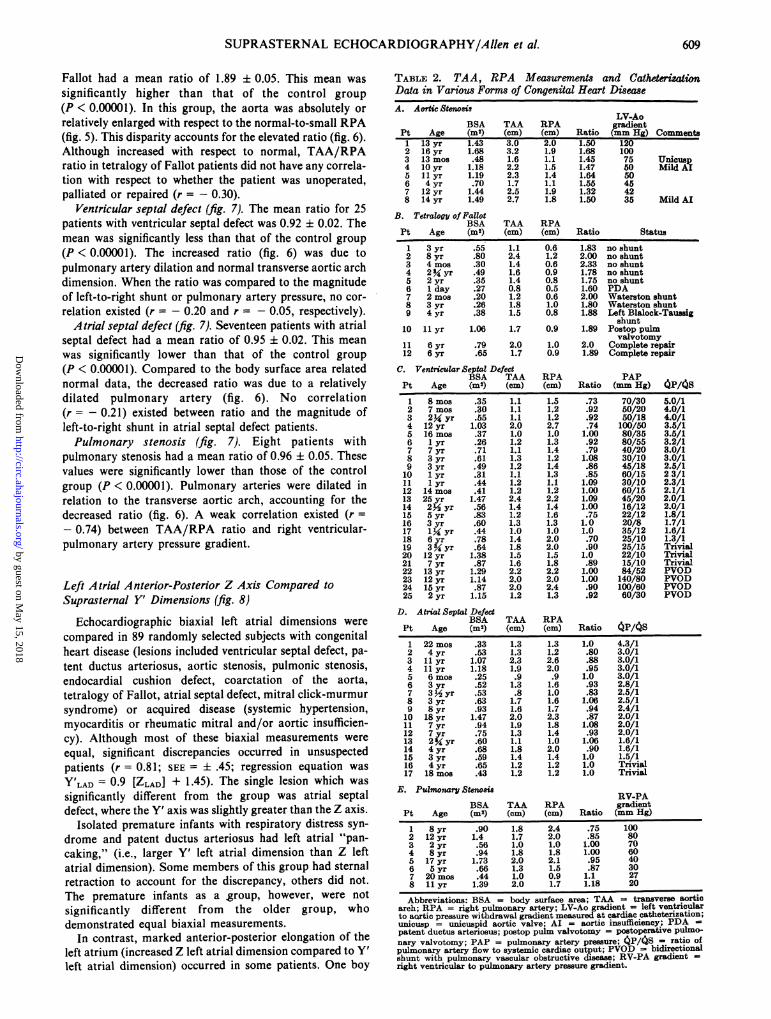
A sampling of children with representative lesions wasevaluated to assess the usefulness of the suprasternalechocardiogram in congenital heart disease. Table 2 showsthe combined data for this population, grouped by lesions.
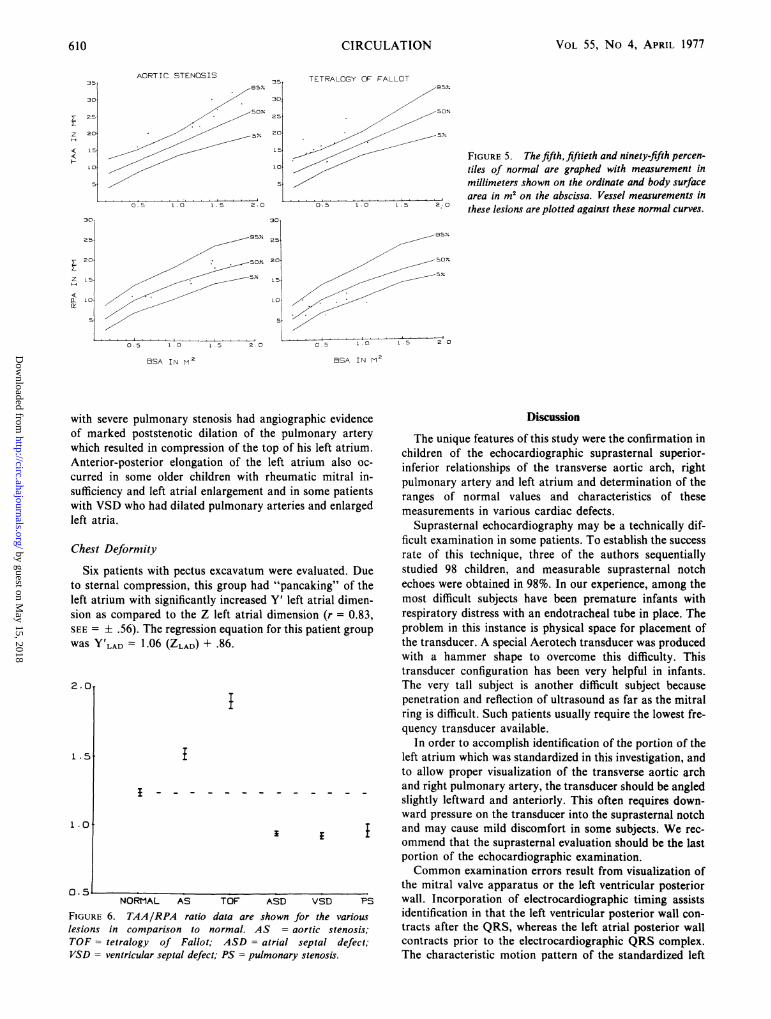
Aortic stenosis. Eight patients with aortic stenosis had amean TAA/RPA ratio of 1.51 ± .04. The mean wassignificantly higher than that of the control group(P < 0.00001). The reason for this ratio difference is shownin figure 5. Although many of the values for each vessel arewithin normal limits, the ratio is altered because the TAAwas dilated with respect to the RPA (fig. 6). No correlation(r = 0.30) existed between the left ventricular - aorticpressure gradient and the ratio for these patients.
Tetralogy of Fallot. Twelve patients with tetralogy of
30 X20
24-
12
ir rs+~1=.99B < < ~~~~~~SEX'I.iL
0 L12 18 24. 30 36Z LAD I N MM
FIGURE 4. This figure compares echocardiographic suprasternalY' (ordinate) and anterior-posterior Z left atrial dimension (LAD)(abscissa) in 58 normal children. Correlation coefficient and stan-dard error of the estimate are noted. Measurements are inmillimeters.
608 CIRCULATION
by guest on May 15, 2018
http://circ.ahajournals.org/D
ownloaded from
SUPRASTERNAL ECHOCARDIOGRAPHY/Allen et al.
Fallot had a mean ratio of 1.89 ± 0.05. This mean was
significantly higher than that of the control group
(P < 0.00001). In this group, the aorta was absolutely or
relatively enlarged with respect to the normal-to-small RPA(fig. 5). This disparity accounts for the elevated ratio (fig. 6).Although increased with respect to normal, TAA/RPAratio in tetralogy of Fallot patients did not have any correla-tion with respect to whether the patient was unoperated,palliated or repaired (r = - 0.30).
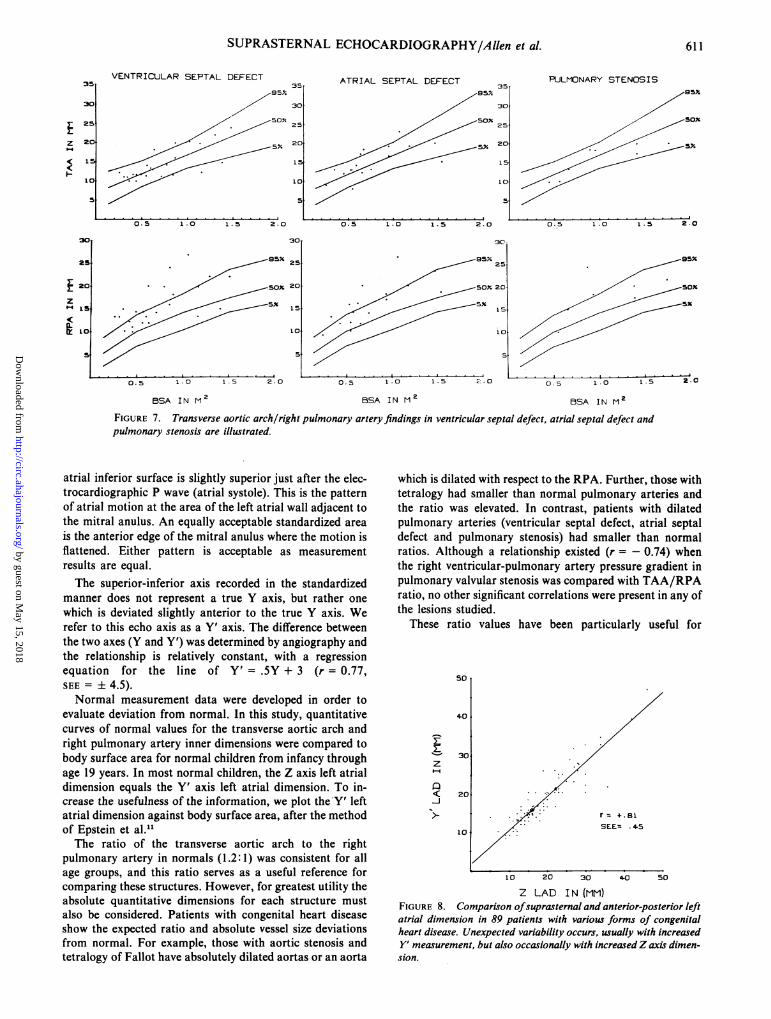
Ventricular septal defect (fig. 7). The mean ratio for 25patients with ventricular septal defect was 0.92 ± 0.02. Themean was significantly less than that of the control group
(P < 0.00001). The increased ratio (fig. 6) was due topulmonary artery dilation and normal transverse aortic archdimension. When the ratio was compared to the magnitudeof left-to-right shunt or pulmonary artery pressure, no cor-
relation existed (r = - 0.20 and r = - 0.05, respectively).A trial septal defect (fig. 7). Seventeen patients with atrial
septal defect had a mean ratio of 0.95 ± 0.02. This mean
was significantly lower than that of the control group
(P < 0.00001). Compared to the body surface area relatednormal data, the decreased ratio was due to a relativelydilated pulmonary artery (fig. 6). No correlation(r = - 0.21) existed between ratio and the magnitude ofleft-to-right shunt in atrial septal defect patients.Pulmonary stenosis (fig. 7). Eight patients with
pulmonary stenosis had a mean ratio of 0.96 ± 0.05. Thesevalues were significantly lower than those of the controlgroup (P < 0.00001). Pulmonary arteries were dilated inrelation to the transverse aortic arch, accounting for thedecreased ratio (fig. 6). A weak correlation existed (r =- 0.74) between TAA/RPA ratio and right ventricular-pulmonary artery pressure gradient.
Left A trial Anterior-Posterior Z Axis Compared toSuprasternal Y' Dimensions (fig. 8)
Echocardiographic biaxial left atrial dimensions were
compared in 89 randomly selected subjects with congenitalheart disease (lesions included ventricular septal defect, pa-tent ductus arteriosus, aortic stenosis, pulmonic stenosis,endocardial cushion defect, coarctation of the aorta,tetralogy of Fallot, atrial septal defect, mitral click-murmursyndrome) or acquired disease (systemic hypertension,myocarditis or rheumatic mitral and/or aortic insufficien-cy). Although most of these biaxial measurements were
equal, significant discrepancies occurred in unsuspectedpatients (r = 0.81; SEE = ± .45; regression equation was
Y'LAD = 0.9 [ZLAD] + 1.45). The single lesion which was
significantly different from the group was atrial septaldefect, where the Y' axis was slightly greater than the Z axis.
Isolated premature infants with respiratory distress syn-drome and patent ductus arteriosus had left atrial "pan-caking," (i.e., larger Y' left atrial dimension than Z left
atrial dimension). Some members of this group had sternal
retraction to account for the discrepancy, others did not.
The premature infants as a group, however, were not
significantly different from the older group, who
demonstrated equal biaxial measurements.In contrast, marked anterior-posterior elongation of the
left atrium (increased Z left atrial dimension compared to Y'
left atrial dimension) occurred in some patients. One boy
TABLE 2. TAA, RPA Measurements and CatheterizationData in Various Forms of Congenital Heart DiseaseA. Aortic Steno8is
LV-AoBSA TAA RPA gradient
Pt Age (M2) (cm) (cm) Ratio (mm Hg) Comments1 13 yr 1.43 3.0 2.0 1.50 1202 16 yr 1.68 3.2 1.9 1.68 1003 13 mos .48 1.6 1.1 1.45 75 UInicup4 10 yr 1.18 2.2 1.5 1.47 50 Mild Al5 11 yr 1.19 2.3 1.4 1.64 506 4 yr .70 1.7 1.1 1.55 457 12 yr 1.44 2.5 1.9 1.32 428 14 yr 1.49 2.7 1.8 1.50 35 Mild Al
B. Tetralogy of FallotBSA TAA RPA
Pt Age (mi) (cm) (cm) Ratio Status1 3 yr .55 1.1 0.6 1.83 no shunt2 8 yr .80 2.4 1.2 2.00 no shunt3 4 mos .30 1.4 0.6 2.33 no shunt4 2% yr .49 1.6 0.9 1.78 no shunt5 2 yr .35 1.4 0.8 1.75 no shunt6 1 day .27 0.8 0.5 1.60 PDA7 2 mos .20 1.2 0.6 2.00 Waterston shunt8 3 yr .26 1.8 1.0 1.80 Waterston shunt9 4 yr .38 1.5 0.8 1.88 Left Blalock-Tausig
shunt10 11 yr 1.06 1.7 0.9 1.89 Postop pulm
valvotomy11 6 yr .79 2.0 1.0 2.0 Complete repair12 6 yr .65 1.7 0.9 1.89 Complete repair
C. Ventricular Septal DefectBSA TAA RPA PAP
Pt Age (in) (cm) (cm) Ratio (mm Hg) OAP/S81 8 moe .35 1.1 1.5 .73 70/30 5.0/12 7 mos .30 1.1 1.2 .92 50/20 4.0/13 2X yr .55 1.1 1.2 .92 50/18 4.0/14 12 yr 1.03 2.0 2.7 .74 100/50 3.5/15 16 mos .37 1.0 1.0 1.00 80/35 3.5/16 1 yr .26 1.2 1.3 .92 80/55 3.2/17 7 yr .71 1.1 1.4 .79 40/20 3.0/18 3 yr .61 1.3 1.2 1.08 30/10 3.0/19 3 yr .49 1.2 1.4 .86 45/18 2.5/110 1 yr .31 1.1 1.3 .85 60/15 2 3/111 1 yr .44 1.2 1.1 1.09 30/10 2.3/112 14 moe .41 1.2 1.2 1.00 60/15 2.1/113 25 yr 1.47 2.4 2.2 1.09 45/20 2.0/114 2M yr .56 1.4 1.4 1.00 16/12 2.0/115 5 yr .83 1.2 1.6 .75 22/12 1.8/116 3 yr .60 1.3 1.3 1.0 20/8 1.7/117 ljj yr .44 1.0 1.0 1.0 35/12 1.6/118 6 yr .78 1.4 2.0 .70 25/10 1.3/119 3 ' yr .64 1.8 2.0 .90 25/15 Trivial20 12 yr 1.38 1.5 1.5 1.0 22/10 Trivial21 7 yr .87 1.6 1.8 .89 15/10 Trivial22 13 yr 1.29 2.2 2.2 1.00 84/52 PVOD23 12 yr 1.14 2.0 2.0 1.00 140/80 PVOD24 15 yr .87 2.0 2.4 .90 100/60 PVOD25 2 yr 1.15 1.2 1.3 .92 60/30 PVOD
D. Atrial Septal DefectBSA TAA RPA
Pt Age (M2) (cm) (cm) Ratio t!P/AS1
2
3
4
56
7
8
9
10
11
12
13
14
15
16
17
22 mos .334 yr .53
11 yr 1.0711 yr 1.186 mos .253 yr .523X yr .533 yr .638 yr .9318 yr 1.477 yr .947 yr .752Myr .604 yr .683 yr .594 yr .6518 mos .43
1.31.32.31.9.9
1.3.8
1.71.62.01.91.31.11.81.41.21.2
1.3 1.0 4.3/11.2 .80 3.0/12.6 .88 3.0/12.0 .95 3.0/1.9 1.0 3.0/1
1.6 .93 2.8/11.0 .83 2.5/11.6 1.06 2.5/11.7 .94 2.4/12.3 .87 2.0/11.8 1.08 2.0/11.4 .93 2.0/11.0 1.06 1.6/12.0 .90 1.6/11.4 1.0 1.5/11.2 1.0 Trivial1.2 1.0 Trivial
E. Pulmonary StenosisRV-PABSA TAA RPA gradient
Pt Age (M2) (cm) (cm) Ratio (mm Hg)1 8 yr .90 1.8 2.4 .75 1002 12 yr 1.4 1.7 2.0 .85 803 2 yr .56 1.0 1.0 1.00 704 8 yr .94 1.8 1.8 1.00 605 17 yr 1.73 2.0 2.1 .95 406 5 yr .66 1.3 1.5 .87 307 20 mos .44 1.0 0.9 1.1 278 11 yr 1.39 2.0 1.7 1.18 20
Abbreviations: BSA = body surface area; TAA = transverse aorticarch; RPA = right pulmonary artery; LV-Ao gradient = left ventricularto aurtic pressure withdrawal gradient measured at cardiac catheterization;unicusp = unicuspid aortic valve; AI = aortic insufficiency; PDA -
patent ductus arteriosus; postop pulm valvotomy = postoperative pulmo-nary valvotoiy; PAP = pulmonary artery pressure; oP/(S = ratio ofpulmonary artery flow to systemic cardiac output; PVOD - bidirectionalshunt with pulmonary vascular obstructive disease; RV-PA gradient eright ventricular to pulmonary artery pressure gradient.
609
by guest on May 15, 2018
http://circ.ahajournals.org/D
ownloaded from
VOL 55, No 4, APRIL 1977
AORTIC STENOSIS3S~
,95%.
30,
_5%. 20.
1 s
-
0.5 1.0 1.5 2.0
30
/~~~~ ~~~.5D X. 2C
5*y. 20/~~~~~~~~~~~~~/ L~~~~~~~~~~~~E0.5 1.0 1.S 2.0
BSA IN M Z
TETRALOGY OF FALLOT
,50N.
-52.
FIGURE 5. The fifth,fiftieth and ninety-fifth percen-tiles of normal are graphed with measurement inmillimeters shown on the ordinate and body surface
.1 .2. area in m2 on the abscissa. Vessel measurements inthese lesions are plotted against these normal curves.
0 5 1 0 1.5 2 0
BSA IN M2
with severe pulmonary stenosis had anof marked poststenotic dilation of th4which resulted in compression of the toAnterior-posterior elongation of the 1curred in some older children with r]sufficiency and left atrial enlargement a
with VSD who had dilated pulmonary aleft atria.
Chest Deformity
Six patients with pectus excavatum N
to sternal compression, this group hadleft atrium with significantly increasedsion as compared to the Z left atrial cSEE = ± .56). The regression equation fiwas Y'LAD = 1.06 (ZLAD) + .86.
2. OT
1.5s
I
1 .0
lgiographic evidencev- %aillr ^ nv u,n - +sr atrx
Discussione pUIIImUIIry r eIry The unique features of this study were the confirmation in)p of his left atrium, children of the echocardiographic suprasternal superior-left atrium also oc- inferior relationships of the transverse aortic arch, rightheumatic mitral in- pulmonary artery and left atrium and determination of thend in some patients ranges of normal values and characteristics of theseLrteries and enlarged measurements in various cardiac defects.
Suprasternal echocardiography may be a technically dif-ficult examination in some patients. To establish the successrate of this technique, three of the authors sequentially
were evaluated. Due studied 98 children, and measurable suprasternal notch"pancaking" of the echoes were obtained in 98%. In our experience, among theY' left atrial dimen- most difficult subjects have been premature infants withlimension (r = 0.83, respiratory distress with an endotracheal tube in place. Theor this patient group problem in this instance is physical space for placement of
the transducer. A special Aerotech transducer was producedwith a hammer shape to overcome this difficulty. Thistransducer configuration has been very helpful in infants.The very tall subject is another difficult subject becausepenetration and reflection of ultrasound as far as the mitralring is difficult. Such patients usually require the lowest fre-quency transducer available.
In order to accomplish identification of the portion of theleft atrium which was standardized in this investigation, andto allow proper visualization of the transverse aortic archand right pulmonary artery, the transducer should be angledslightly leftward and anteriorly. This often requires down-ward pressure on the transducer into the suprasternal notch
3i i I and may cause mild discomfort in some subjects. We rec-ommend that the suprasternal evaluation should be the lastportion of the echocardiographic examination.Common examination errors result from visualization of
the mitral valve apparatus or the left ventricular posteriorkSD VSD PS wall. Incorporation of electrocardiographic timing assistsown for the various identification in that the left ventricular posterior wall con-= aortic stenosis; tracts after the QRS, whereas the left atrial posterior wall
trial septal defect; contracts prior to the electrocardiographic QRS complex.tonary stenosis. The characteristic motion pattern of the standardized left
35
30
25
20
1 5
I 0I
z
6:
30j
i 20
Z i5
pL L04:
NORMAL AS TOF A
FIGURE 6. TAA/RPA ratio data are sholesions in comparison to normal. ASTOF = tetralogy of Fallot; ASD = atVSD = ventricular septal defect; PS = pulm
U * Je b
610 CIRCULATION
-95%.
by guest on May 15, 2018
http://circ.ahajournals.org/D
ownloaded from
SUPRASTERNAL ECHOCARDIOGRAPHY/Alen et al.
VENTRICULAR SEPTAL DEFECT
30
25
20
10
1C
5
0.5 1.0 1.5 2.0
30
2595
20 o.5x
15 _ 5x
5
.- -o.5 1. 15 2.0
BSA IN M2
301
25
2c
15
LC
ATRIAL SEPTAL DEFECT35
30
25
20
10
5-
0.5 1.0 1.5 2.0
25
,20
15
PUJLMONARY STENOSIS
0.5 1.0 1.5 2.0
/ 952
502
52
5
.5 .1. , 5....0.5 1.0 1.-5 4:- ° O.S 1.0 L .S 2.0
BSA IN M2 BSA IN M2
FIGURE 7. Transverse aortic arch/right pulmonary arterypulmonary stenosis are illustrated.
atrial inferior surface is slightly superior just after the elec-trocardiographic P wave (atrial systole). This is the patternof atrial motion at the area of the left atrial wall adjacent tothe mitral anulus. An equally acceptable standardized area
is the anterior edge of the mitral anulus where the motion isflattened. Either pattern is acceptable as measurementresults are equal.The superior-inferior axis recorded in the standardized
manner does not represent a true Y axis, but rather one
which is deviated slightly anterior to the true Y axis. Werefer to this echo axis as a Y' axis. The difference betweenthe two axes (Y and Y') was determined by angiography andthe relationship is relatively constant, with a regressionequation for the line of Y' = .5Y + 3 (r = 0.77,SEE = ± 4.5).
Normal measurement data were developed in order toevaluate deviation from normal. In this study, quantitativecurves of normal values for the transverse aortic arch andright pulmonary artery inner dimensions were compared tobody surface area for normal children from infancy throughage 19 years. In most normal children, the Z axis left atrialdimension equals the Y' axis left atrial dimension. To in-crease the usefulness of the information, we plot the-Y' leftatrial dimension against body surface area, after the methodof Epstein et al.11The ratio of the transverse aortic arch to the right
pulmonary artery in normals (1.2:1) was consistent for allage groups, and this ratio serves as a useful reference forcomparing these structures. However, for greatest utility theabsolute quantitative dimensions for each structure mustalso be considered. Patients with congenital heart diseaseshow the expected ratio and absolute vessel size deviationsfrom normal. For example, those with aortic stenosis andtetralogy of Fallot have absolutely dilated aortas or an aorta
,findings in ventricular septal defect, atrial septal defect and
which is dilated with respect to the RPA. Further, those withtetralogy had smaller than normal pulmonary arteries andthe ratio was elevated. In contrast, patients with dilatedpulmonary arteries (ventricular septal defect, atrial septaldefect and pulmonary stenosis) had smaller than normalratios. Although a relationship existed (r = - 0.74) whenthe right ventricular-pulmonary artery pressure gradient inpulmonary valvular stenosis was compared with TAA/RPAratio, no other significant correlations were present in any ofthe lesions studied.
These ratio values have been particularly useful for
50
4.0
~30z
< 20 > . .. >z'. .. ~r= 4.81SEE= 45
10 20 30 4-0 50
Z LAD IN (MM)FIGURE 8. Comparison ofsuprasternal and anterior-posterior leftatrial dimension in 89 patients with various forms of congenitalheart disease. Unexpected variability occurs, usually with increasedY' measurement, but also occasionally with increasedZ axis dimen-sion.
3!
3(
2!
24
1
5
10
S
.0
5
611
z
4(
z
35T
by guest on May 15, 2018
http://circ.ahajournals.org/D
ownloaded from
612
i.% P
z~~~~~~~~~~~~~~~~~~~~~~*I
I
#AV* 2
CIRCULATION VOL 55, No 4, APRIL 1977
S *-
X LAS
ILA
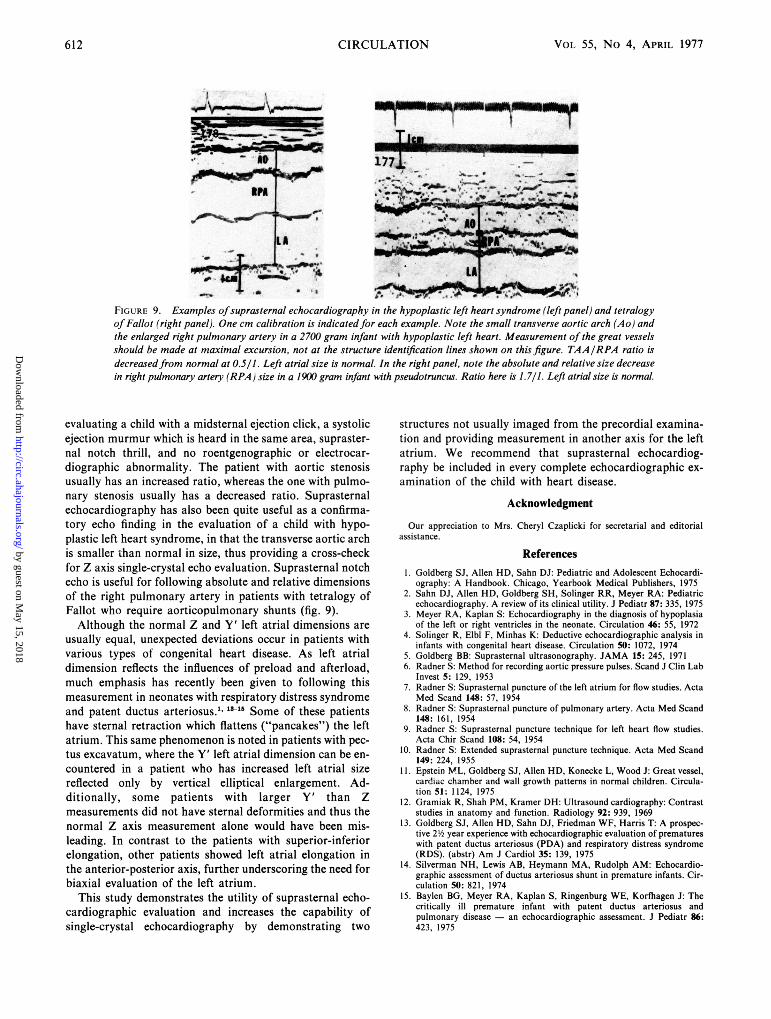
FIGURE 9. Examples ofsuprasternal echocardiography in the hypoplastic left heart syndrome (left panel) and tetralogyof Fallot (right panel). One cm calibration is indicatedfor each example. Note the small transverse aortic arch (A o) andthe enlarged right pulmonary artery in a 2700 gram infant with hypoplastic left heart. Measurement of the great vesselsshould be made at maximal excursion, not at the structure identification lines shown on this figure. TAA/RPA ralio isdecreasedfrom normal at 0.5/1. Left atrial size is normal. In the right panel, note the absolute and relative size decreasein right pulmonary artery (RPA) size in a 1900 gram infant with pseudotruncus. Ratio here is 1. 7/1. Left atrial size is normal.
evaluating a child with a midsternal ejection click, a systolicejection murmur which is heard in the same area, supraster-nal notch thrill, and no roentgenographic or electrocar-diographic abnormality. The patient with aortic stenosisusually has an increased ratio, whereas the one with pulmo-nary stenosis usually has a decreased ratio. Suprasternalechocardiography has also been quite useful as a confirma-tory echo finding in the evaluation of a child with hypo-plastic left heart syndrome, in that the transverse aortic archis smaller than normal in size, thus providing a cross-checkfor Z axis single-crystal echo evaluation. Suprasternal notchecho is useful for following absolute and relative dimensionsof the right pulmonary artery in patients with tetralogy ofFallot who require aorticopulmonary shunts (fig. 9).Although the normal Z and Y' left atrial dimensions are
usually equal, unexpected deviations occur in patients withvarious types of congenital heart disease. As left atrialdimension reflects the influences of preload and afterload,much emphasis has recently been given to following thismeasurement in neonates with respiratory distress syndromeand patent ductus arteriosus."13 15 Some of these patientshave sternal retraction which flattens ("pancakes") the leftatrium. This same phenomenon is noted in patients with pec-tus excavatum, where the Y' left atrial dimension can be en-countered in a patient who has increased left atrial sizereflected only by vertical elliptical enlargement. Ad-ditionally, some patients with larger Y' than Zmeasurements did not have sternal deformities and thus thenormal Z axis measurement alone would have been mis-leading. In contrast to the patients with superior-inferiorelongation, other patients showed left atrial elongation inthe anterior-posterior axis, further underscoring the need forbiaxial evaluation of the left atrium.
This study demonstrates the utility of suprasternal echo-cardiographic evaluation and increases the capability ofsingle-crystal echocardiography by demonstrating two
structures not usually imaged from the precordial examina-tion and providing measurement in another axis for the leftatrium. We recommend that suprasternal echocardiog-raphy be included in every complete echocardiographic ex-amination of the child with heart disease.
Acknowledgment
Our appreciation to Mrs. Cheryl Czaplicki for secretarial and editorialassistance.
Referencesl. Goldberg SJ, Allen HD, Sahn DJ: Pediatric and Adolescent Echocardi-
ography: A Handbook. Chicago, Yearbook Medical Publishers, 19752. Sahn DJ, Allen HD, Goldberg SH, Solinger RR, Meyer RA: Pediatric
echocardiography. A review of its clinical utility. J Pediatr 87: 335, 19753. Meyer RA, Kaplan S: Echocardiography in the diagnosis of hypoplasia
of the left or right ventricles in the neonate. Circulation 46: 55, 19724. Solinger R, Elbl F, Minhas K: Deductive echocardiographic analysis in
infants with congenital heart disease. Circulation 50: 1072, 19745. Goldberg BB: Suprasternal ultrasonography. JAMA 15: 245, 19716. Radner S: Method for recording aortic pressure pulses. Scand J Clin Lab
Invest 5: 129, 19537. Radner S: Suprasternal puncture of the left atrium for flow studies. Acta
Med Scand 148: 57, 19548. Radner S: Suprasternal puncture of pulmonary artery. Acta Med Scand
148: 161, 19549. Radner S: Suprasternal puncture technique for left heart flow studies.
Acta Chir Scand 108: 54, 195410. Radner S: Extended suprasternal puncture technique. Acta Med Scand
149: 224, 195511. Epstein MIL, Goldberg SJ, Allen HD, Konecke L, Wood J: Great vessel,
cardlac chamber and wall growth patterns in normal children. Circula-tion 51: 1124, 1975
12. Gramiak R, Shah PM, Kramer DH: Ultrasound cardiography: Contraststudies in anatomy and function. Radiology 92: 939, 1969
13. Goldberg SJ, Allen HD, Sahn DJ, Friedman WF, Harris T: A prospec-tive 21/2 year experience with echocardiographic evaluation of prematureswith patent ductus arteriosus (PDA) and respiratory distress syndrome(RDS). (abstr) Am J Cardiol 35: 139, 1975
14. Silverman NH, Lewis AB, Heymann MA, Rudolph AM: Echocardio-graphic assessment of ductus arteriosus shunt in premature infants. Cir-culation 50: 821, 1974
15. Baylen BG, Meyer RA, Kaplan S, Ringenburg WE, Korfhagen J: Thecritically ill premature infant with patent ductus arteriosus andpulmonary disease - an echocardiographic assessment. J Pediatr 86:423, 1975
by guest on May 15, 2018
http://circ.ahajournals.org/D
ownloaded from
H D Allen, S J Goldberg, D J Sahn, T W Ovitt and B B Goldbergcardiology.
Suprasternal notch echocardiography. Assessment of its clinical utility in pediatric
Print ISSN: 0009-7322. Online ISSN: 1524-4539 Copyright © 1977 American Heart Association, Inc. All rights reserved.
is published by the American Heart Association, 7272 Greenville Avenue, Dallas, TX 75231Circulation doi: 10.1161/01.CIR.55.4.605
1977;55:605-612Circulation.
http://circ.ahajournals.org/content/55/4/605the World Wide Web at:
The online version of this article, along with updated information and services, is located on
http://circ.ahajournals.org//subscriptions/
is online at: Circulation Information about subscribing to Subscriptions:
http://www.lww.com/reprints Information about reprints can be found online at: Reprints:
document. Permissions and Rights Question and Answer information about this process is available in the
located, click Request Permissions in the middle column of the Web page under Services. FurtherEditorial Office. Once the online version of the published article for which permission is being requested is
can be obtained via RightsLink, a service of the Copyright Clearance Center, not theCirculationpublished in Requests for permissions to reproduce figures, tables, or portions of articles originallyPermissions:
by guest on May 15, 2018
http://circ.ahajournals.org/D
ownloaded from