supramolecular self-assembly of linear ... · supramolecular self-assembly of linear...
TRANSCRIPT

1
Supramolecular Self-Assembly of Linear Oligosilsesquioxanes on Mica – AFM Surface Imaging and Hydrophilicity
Studies
Anna Kowalewska*, Maria Nowacka, Adam Tracz, Tomasz Makowski
Centre of Molecular and Macromolecular Studies, Polish Academy of Sciences, Sienkiewicza 112, 90-363 Łódź, Poland
Supporting Information
General Information
Materials: Triethoxyvinylsilane (Aldrich, 97%), hexamethyldisilazane (Fluka Analytical, ≥98%, GC), potassium hydroxide
(Aldrich, ACS reagent, ≥85, pellets), acetic acid (Aldrich, ≥99%, ReagentPlus®), magnesium sulphate (VI) MgSO4 (Chempur,
pure)] DMPA (Acros Organics, 99%), thioglycolic acid (Fisher Scientific, pure p.a.) were used as received. Solvents [ethyl acetate
(Chempur, pure p.a.), hexane (Aldrich, Chromasolv® for HPLC, ≥97%, GC), n-pentane (Chempur, pure p.a), tetrahydrofuran
(THF) (Chempur, pure p.a.), dichloromethane (Chempur, pure p.a.), methanol (Chempur, pure p.a.)], dioxane (Chempur, pure
p.a.), toluene (Chempur, pure p.a.) were purified according to the literature procedures1.
Muscovite mica (V-1 grade) was bought form SPI Supplies / Structure Probe, Inc. and freshly cleaved before use by removing the
top layer with an adhesive tape. Glass slides coated with APTES were purchased from Aldrich (Silane-Prep Slides) and used as
received, glass plates (deckgläser 100) were bought form Thermo Scientific (Menzel Gläser) and cleaned by sonication (in H2O,
MeOH and then in CH2Cl2) followed by blow dry in N2. Polished prime silicon wafers [type n, arsenic doped, orientation (100)]
were obtained from Cemat Silicon S.A, cut into rectangular pieces and cleaned by MeOH clean, followed by deionised water (DI)
rinse, a short immersion (30 s) in concentrated HFaq, and then thoroughly washed with DI and dried in N2 stream.
Analytic methods: Liquid state NMR (1H,
13C and
29Si NMR) spectra for the precursors and condensed soluble materials were
recorded in CDCl3 THF-d8 or CD3OD as a solvent on a Bruker DRX-500 MHz spectrometer, with TMS as the reference. Mass
spectrometric measurements (MALDI-TOF) were performed for LPSQ-Vi using a Voyager-Elite (PerSeptive Biosystems, USA)
time-of-flight instrument equipped with a pulsed N2 laser (337 nm, 4-ns pulse width) and time-delayed extraction ion source. An
accelerating voltage of 20 kV was applied. Mass spectra were recorded in the linear positive ion mode using 1,8-dihydroxy-9-
anthracenone (ditranol, DT) as the matrix and LiCl as the cationization agent. Size exclusion chromatography (SEC) was
performed for LPSQ-Vi using Agilent 1100 series chromatograph composed of degasser, pump, and autosampler. Two PL Gel 5
μm MIXED-C columns (7.8 x 300 mm) were used in a series (temp. 27 °C). RI (OPTILAB T-rex, Wyatt) and MALLS (DAWN
HEOS, II, Wyatt, λ= 682 nm) were used as detectors. Dichloromethane was used as a mobile phase at the flow rate of 0.8
mL/min. Molecular masses were derived from a calibration curve based on polystyrene standards.
Phase transitions of polymers were studied by differential scanning calorimetry (DSC) technique (DuPont 2000 thermal analysis
system). Thermograms were taken for samples (sealed in aluminium pans) quenched rapidly from the melt (room temperature)
and then heated at the rate of 10 °C/min from -100 °C to 100 °C. The sample was kept at 100 °C for 3 min to destroy any thermal
history. Subsequently, it was quenched to -100 °C and heated again at 10 °C/min to 100 °C.
Thermogravimetric measurements were performed using a Hi-Res TGA 2950 Thermogravimetric Analyzer (TA Instruments) in
nitrogen atmosphere (heating rate 10 °C /min, resolution 3, sensitivity 3).
Dynamic Light Scattering measurements were carried at 25oC out using Nano-ZS Malvern Zetasizer. Solutions were placed in
tightly covered quartz cuvettes. NOTE: DLS measurements did not give precise information about the size of objects present in
solutions of LPSQ-COOH (in pure solvents and their mixtures). The records are presented to illustrate the dynamics and the
difference in behavior of LPSQ-COOH in those solutions. The solutions were clear and transparent during the time of analysis and
by no means contained particles that would make the sample turbid.
Synthetic procedures:
Electronic Supplementary Material (ESI) for Soft Matter.This journal is © The Royal Society of Chemistry 2016

2
1. Synthesis of oligo(vinylsilsesquioxanes) (LPSQ-Vi) by in situ-polycondensation of cyclic tetravinylsiloxanetetraol 2.
Solid potassium tetravinyltetracyclosiloxanolate (10.0 g, 15.6 mmol) prepared with 76% yield according to the previously
described procedure3, was slowly added to a cooled (0-5°C) solution of acetic acid (4.6 ml, 63 mmol) in ethyl acetate (420 ml).
Temperature of the reaction mixture was kept below 10°C during addition of cyclosiloxanolate and for another 30 minutes, once
the addition was completed. Potassium acetate was filtered off and the filtrate was left for 30 minutes to warm up to room
temperature. Hexamethyldisilazane (17.0 ml, 81.5 mmol) and MgSO4 (10 g) were then added to the reaction mixture, and it was
refluxed with stirring. The progress of reaction was controlled with MALDI-TOF spectrometry. The reaction was carried out to a
complete condensation of silanol groups. The reaction mixture was then cooled down, MgSO4 was filtered off, the solution was
passed through a short silica plug, and all volatile parts were removed at room temperature under high vacuum. The obtained
product was a viscous, colorless liquid (3.3, Y=67.5%).
1H NMR (CDCl3), δ [ppm]: 0.09 (s. OSiMe3), 5.19 (m. -CH=CH2)
13С NMR (CDCl3), δ [ppm]: 1.6 (OSiMe3), 130.2 (=CH-), 135.9 (=CH2)
29Si NMR (CDCl3); δ [ppm]: –81.3 (H2C=CH-SiO3/2), 10.6 (OSiMe3)
SEC in CH2Cl2 (RI): Mn= 1000, Mw= 1200, PDI=1.2, (MALLS): Mn=2000, Mw=3200, PDI=1.6.
2. Synthesis of oligo[2-(carboxymethylthio)ethylsilsesquioxanes] (LPSQ-COOH) by UV initiated thiol-ene addition of thioglycolic
acid to LPSQ-Vi.
DMPA (0.25 mmol) was added to a solution of thioglycolic acid (17.6 mmol) and LPSQ-Vi (1g, 12.6 mmol Vi groups) in dry
THF (15 ml), placed in a quartz vessel. The mixture was irradiated for 30 min with UV light (350 nm). Volatiles were then
removed under reduced pressure and the residue was dissolved in THF (2 ml) and precipitated into n-pentane (100 ml). The
purification procedure was repeated thrice. The precipitate was dried under high vacuum at room temperature to a constant
weight. A viscous polymer was obtained (1.8 g, Y =83%).
1H NMR (THF-d8), δ [ppm]: 0.17 (s. OSiMe3), 1.08 (m. SiCH2), 2.79 (CH2S), 3.20 (m. SCH2), 8.30 (COOH)
13С NMR (CD3OD), δ [ppm]: -0.5 (OSiMe3), 11.4 (SiCH2), 25.3 (CH2S), 31.6 (SCH2), 170.9 (COOH)
29Si NMR (CD3OD); δ [ppm]: –70.4 (-CH2-SiO3/2), 10.9 (OSiMe3)
Literature:
1 W. L. F. Armarego and Ch. L. L. Chai in “Purification of laboratory chemicals”, 5th edition, Elsevier Science, 2003
2 A. Kowalewska and M. Nowacka, Silicon, 2014, (accepted DOI 10.1007/s12633-014-9209-z
3 O. I. Shchegolikhina, Yu. A. Pozdnyakova, A. A. Chetverikov, A. S. Peregudov, M. I. Buzin and E. V. Matukhina, Russ.
Chem. Bull., Int. Ed., 2007, 56, 83.
Scheme ESI-1. Cyclic dimeric and linear catemeric structures as possible binding arrangements for hydrogen bonding in LPSQ-
COOH.

3
Figure ESI-1. 1H NMR of LPSQ-Vi.
Figure ESI-2. 13
C NMR of LPSQ-Vi.
Figure ESI-3. 29
Si NMR of LPSQ-Vi.

4
Figure ESI-4. MALDI of LPSQ-Vi (matrix: ditranol, Li+)
Figure ESI-5. 1H NMR of LPSQ-COOH.
Figure ESI-6. 13
C NMR of LPSQ-COOH.

5
Figure ESI-7. 29
Si NMR of LPSQ-COOH.
Table ESI-1. Vibrational Mode Assignments of LPSQ-COOH.
Peak (cm-1
) assignment
3500-2700 ν OH
2600-2400 ν(s,as) CH
1707 ν C=O
1421 δ OH in-plane
1409 δ(as) CH3
1286 ν C-O
1254 δ(s) Si(CH3)3
1190 δ Si(CH2)
1116 ν(as) SiOSi
1060 ν(s) SiOSi
937 ν OH out-of-plane
Figure ESI-8. DSC traces of LPSQ-COOH and LPSQ-Vi (10oC/min, second run).

6
Figure ESI-9. TGA of LPSQ-Vi and LPSQ-TG (N2, 10oC/min).
Figure ESI-10. AFM height/phase image of LPSQ-COOH dip coated from 0.045%wt solution in THF (24oC, ti=5 s) onto
muscovite mica (enlarged scan area).
Figure ESI-11. AFM height/phase image of LPSQ-COOH film dip coated on muscovite mica (0.0022%wt in THF, ti=5 s)
(enlarged scan area).

7
Figure ESI-12. AFM topographic height/phase image and the corresponding surface profile of LPSQ-Vi dip coated from
0.051%wt solution in THF (24oC, ti=5 s) onto muscovite mica (v.d.=2.4 nm).
Figure ESI-13. AFM topographic height/phase image and the corresponding surface profile of LPSQ-Vi dip coated from
0.051%wt solution in THF (24oC, ti=30 min) onto muscovite mica.
8
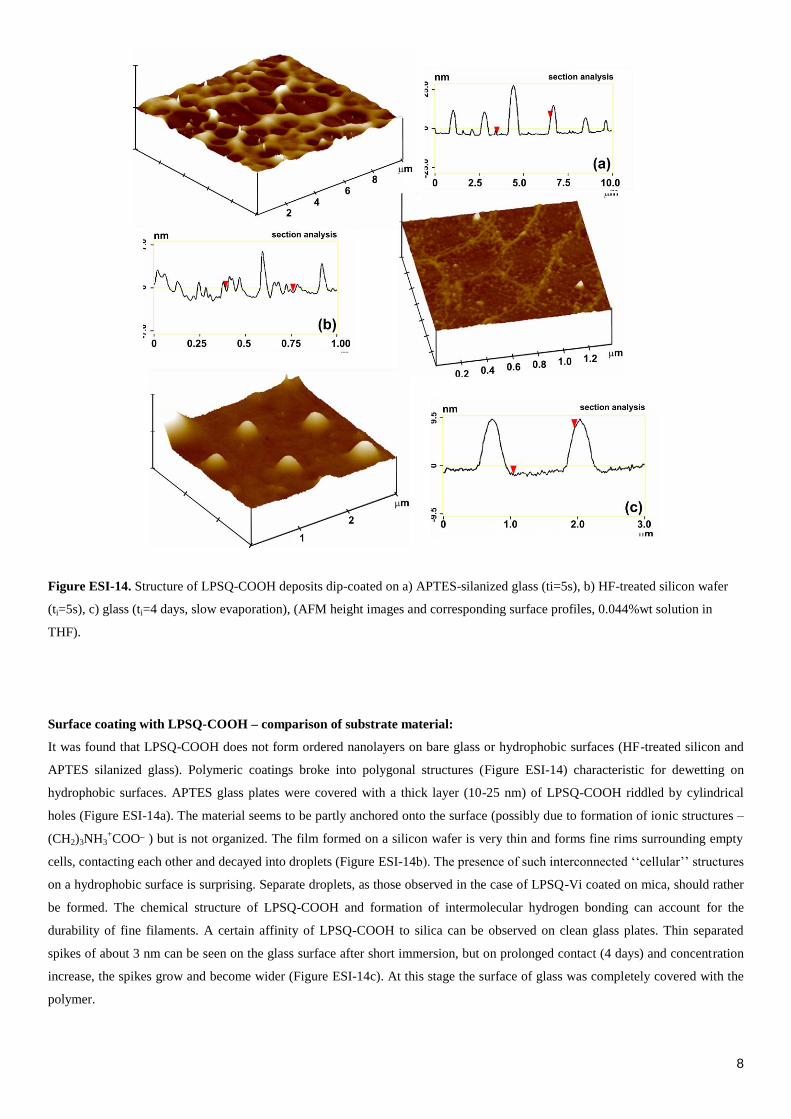
Figure ESI-14. Structure of LPSQ-COOH deposits dip-coated on a) APTES-silanized glass (ti=5s), b) HF-treated silicon wafer
(ti=5s), c) glass (ti=4 days, slow evaporation), (AFM height images and corresponding surface profiles, 0.044%wt solution in
THF).
Surface coating with LPSQ-COOH – comparison of substrate material:
It was found that LPSQ-COOH does not form ordered nanolayers on bare glass or hydrophobic surfaces (HF-treated silicon and
APTES silanized glass). Polymeric coatings broke into polygonal structures (Figure ESI-14) characteristic for dewetting on
hydrophobic surfaces. APTES glass plates were covered with a thick layer (10-25 nm) of LPSQ-COOH riddled by cylindrical
holes (Figure ESI-14a). The material seems to be partly anchored onto the surface (possibly due to formation of ionic structures –
(CH2)3NH3+COO
_ ) but is not organized. The film formed on a silicon wafer is very thin and forms fine rims surrounding empty
cells, contacting each other and decayed into droplets (Figure ESI-14b). The presence of such interconnected ‘‘cellular’’ structures
on a hydrophobic surface is surprising. Separate droplets, as those observed in the case of LPSQ-Vi coated on mica, should rather
be formed. The chemical structure of LPSQ-COOH and formation of intermolecular hydrogen bonding can account for the
durability of fine filaments. A certain affinity of LPSQ-COOH to silica can be observed on clean glass plates. Thin separated
spikes of about 3 nm can be seen on the glass surface after short immersion, but on prolonged contact (4 days) and concentration
increase, the spikes grow and become wider (Figure ESI-14c). At this stage the surface of glass was completely covered with the
polymer.

9
Dynamic light scattering measurements (DLS) studies of LPSQ-COOH behaviour in solutions:
We have studied the size of objects that could possibly be found on agglomeration of LPSQ-COOH in solutions. Figure ESI-15
shows that no defined agglomerates of LPSQ-COOH can be detected in solutions in THF of different concentration. The coloured
profiles correspond to each record taken during a particular measurement. The time span between measurements was 10 minutes.
We have not observed any increasing or decreasing trend in the size of scattering object with time. It means that the dissolved
system is dynamic and no coagulation takes place. Addition of toluene to the solution in THF did not change this trend (Figure ESI 16 A
and B). The situation is different in less polar dioxane. LPSQ-COOH dissolves well in this solvent but DLS studies indicated the presence of
defined objects (Figure ESI-16 F). The population is composed of small (about 10 a.u. in Figure ESI-16) and larger objects (increment of about
10x). Apparently, the polymer tends to form discrete micelles (solution is stable for 30 hours) that finally sediment with time (>48 h). Addition
of toluene to the solution in dioxane did not change the general trend (Figure ESI-16 C, D, E). It can be also observed that addition of smaller
amounts of toluene caused formation of smaller secondary micelles.
Figure ESI-15. DLS records taken for samples of LPSQ-COOH dissolved in THF at a given concentration.
Figure ESI-16. DLS records taken for samples of LPSQ-COOH dissolved (0.06% wt) in A) THF, B) THF/toluene (2:1 v/v), C)
dioxane/toluene (2:1 v/v), D) dioxane/toluene (4:1 v/v), E) dioxane/toluene (9:1 v/v), F) dioxane.

10
Figure ESI-17. XPS Si2p peak deconvolution in native and adsorbed LPSQ-COOH compared to air-cleaved mica.
Figure ESI-18. XPS O1s peak deconvolution in native and adsorbed LPSQ-COOH compared to air-cleaved mica.
11
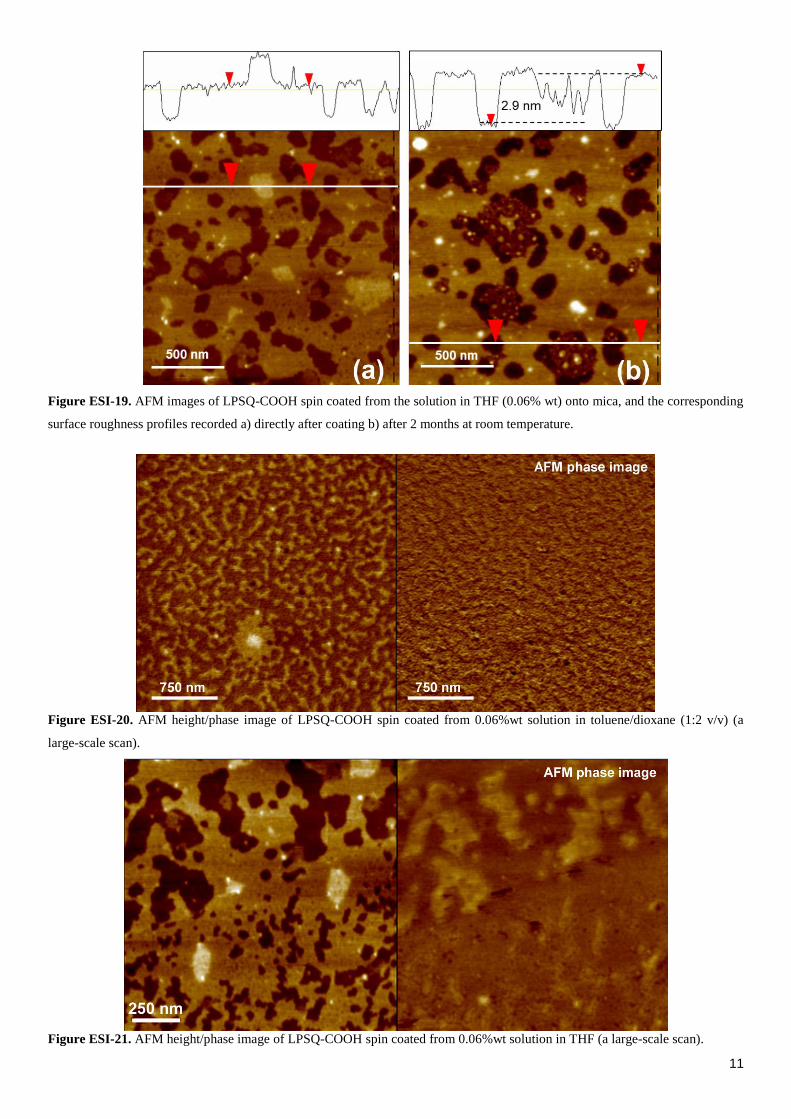
Figure ESI-19. AFM images of LPSQ-COOH spin coated from the solution in THF (0.06% wt) onto mica, and the corresponding
surface roughness profiles recorded a) directly after coating b) after 2 months at room temperature.
Figure ESI-20. AFM height/phase image of LPSQ-COOH spin coated from 0.06%wt solution in toluene/dioxane (1:2 v/v) (a
large-scale scan).
Figure ESI-21. AFM height/phase image of LPSQ-COOH spin coated from 0.06%wt solution in THF (a large-scale scan).

12
Table ESI-2. Contact angles of reference liquid drops on the studied surfaces.
entry
sample
water glycerol
method static advancing receding static advancing receding
- bare mica - 19.2 ± 2.7 15.7 ± 0.9 14.3 ± 2.3 45.7 ± 5.8 36.2 ± 4.1 16.5 ± 3.6
I LPSQ-Vi on mica slit cast 106.3 ± 1.9 105.9 ± 3.4 84.8 ± 4.7 87.5 ± 1.6 89.5 ± 0.8 70.0 ± 1.4
II LPSQ-COOH on mica slit cast 71.7 ± 2.0 75.9 ± 2.0 37.4 ± 4.8 87.1 ± 3.4 83.8 ± 3.0 48.2 ± 3.5
III LPSQ-COOH on mica dip coated 18.2 ± 2.7 13.1 ± 3.8 - 61.7 ± 2.3 61.3 ± 4.1 22.4 ± 2.6
Figure ESI-22. Differences in the shape of droplets (S – stationary, A – advancing, R – receding) of reference liquids [water and
glycerine (Gly)] on surfaces (Table ESI-2) prepared using slit-coater (I and II) and by dip-coating (III).