supracolloidal reaction kinetics of janus...
TRANSCRIPT

particles have substantially more of them. If theselow coordination number corner and/or edge po-sitions are implicated as active sites for tolueneoxidation, then their relatively higher occur-rence in the Au-Pd/C sample could account forthe superior performance displayed by this cat-alyst. Another possible explanation could lie inthe difference in the distribution of Au-Pd par-ticle morphologies found in the two catalystsamples. The Au-Pd/C catalyst predominantlyhas multiply twinned (icosahedral and decahe-dral) particles, which tend to have {111} facetterminations. In comparison, the Au-Pd/TiO2
materials show an increased fraction of cub-octahedral and singly/doubly twinned particles,which exhibit mixed {100}/{111} facet ter-minations. Hence, the increasing proportion of{100}-type facets in the Au-Pd/TiO2 sample cor-relates with a lowering of the catalytic activity,and preparation strategies need to avoid them.
In a final set of experiments, we investigatedthe stability of the catalysts, because it is crucialto confirm that high-activity catalysts can be re-used. With the Au-Pd/TiO2 catalyst, the reactionwas stopped after 7 hours, and the catalyst wasrecovered by decantation. Identical conversionwas obtained on reuse of the Au-Pd/TiO2 catalyst(Table 1, entries 14 and 15). For the Au-Pd/Ccatalyst, the reaction was stopped after 7 hoursand the catalyst was allowed to settle. The liquidphase was then carefully removed by decantation
and fresh toluene was added. No metal was ob-served to have leached into the liquid phaseduring reaction, and the decanted liquid showedno further reaction in the absence of catalyst(fig. S7 and table S16). The reaction was thenallowed to proceed for a further 7 hours, and thewhole process was repeated a further two times.The reaction profile obtained with the decanta-tion experiments was identical to that obtainedwith the fresh catalyst (fig. S8). Detailed STEMcharacterization shows that there is minimalparticle growth or morphology change for theAu-Pd/C catalysts when studied over an ex-tended reaction period (Fig. 1), during whichcatalysts were recovered after 31 and 65 hours ofreaction, followed by two reuse cycles of 7 hours(figs. S9 and S10). Therefore, it is clear that anysintering or structural modification of these highlyactive catalysts is minimal, and we consider themto be stable and reusable.
References and Notes1. R. A. Sheldon, J. K. Kochi, Metal-Catalyzed Oxidations of
Organic Compounds (Academic Press, New York, 1981).2. W. Partenheimer, Catal. Today 23, 69 (1995).3. Y. Ishii, S. Sakaguchi, T. Iwahama, Adv. Synth. Catal.
343, 393 (2001).4. K. Nomiya, K. Hashino, Y. Nemoto, M. Watanabe,
J. Mol. Catal. Chem. 176, 79 (2001).5. T. G. Carrell, S. Cohen, G. C. Dismukes, J. Mol. Catal.
Chem. 187, 3 (2002).6. S. Saravanamurugan, M. Palanichany, V. Murugesan,
Appl. Catal. A Gen. 273, 143 (2004).
7. H. V. Borgaonkar, S. R. Raverkar, S. B. Chandalia,Ind. Eng. Chem. Prod. Res. Dev. 23, 455 (1984).
8. M. L. Kantam et al., Catal. Lett. 81, 223 (2002).9. Snia-Viscosa, Hydrocarbon Proc. 134, 210 (1977).
10. F. Konietzni, U. Kolb, U. Dingerdissen, W. F. Maier,J. Catal. 176, 527 (1998).
11. J. Zhu, A. Robertson, S. C. Tsang, Chem. Commun.(Camb.) 18, 2044 (2002).
12. K. R. Seddon, A. Stark, Green Chem. 4, 119 (2002).13. X. Li et al., Catal. Lett. 110, 149 (2006).14. F. Wang et al., Adv. Synth. Catal. 347, 1987 (2005).15. J. Gao, X. Tong, X. Li, H. Miao, J. Xu, J. Chem. Technol.
Biotechnol. 2002, 620 (2007).16. R. L. Brutchey, I. J. Drake, A. T. Bell, T. Tilley,
Chem. Commun. (Camb.) 2005, 3736 (2005).17. A. P. Singh, T. Selvam, J. Mol. Catal. Chem. 113,
489 (1996).18. See supporting on Science Online for detailed methods.19. J. K. Edwards et al., Science 323, 1037 (2009).20. D. I. Enache et al., Science 311, 362 (2006).21. J. Colby, D. I. Stirling, H. Dalton, Biochem. J. 165,
395 (1977).22. A. Wittstock, V. Zielasek, J. Biener, C. M. Friend,
M. Bäumer, Science 327, 319 (2010).23. N. Dimitratos et al., Phys. Chem. Chem. Phys. 11,
5142 (2009).24. A. Borodziński, M. Bonarowska, Langmuir 13, 5613 (1997).25. We acknowledge the support of the Dow Chemical
Company through the Dow Methane Challenge.
Supporting Online Materialwww.sciencemag.org/cgi/content/full/331/6014/195/DC1Materials and MethodsFigs. S1 to S10Tables S1 to S16References
29 September 2010; accepted 14 December 201010.1126/science.1198458
Supracolloidal Reaction Kinetics ofJanus SpheresQianChen,1 JonathanK.Whitmer,1,2 Shan Jiang,1 Sung Chul Bae,1 Erik Luijten,3,4* SteveGranick1,2,5*
Clusters in the form of aggregates of a small number of elemental units display structural,thermodynamic, and dynamic properties different from those of bulk materials. We studied the kineticpathways of self-assembly of “Janus spheres” with hemispherical hydrophobic attraction and found keydifferences from those characteristic of molecular amphiphiles. Experimental visualization combinedwith theory and molecular dynamics simulation shows that small, kinetically favored isomers fuse,before they equilibrate, into fibrillar triple helices with at most six nearest neighbors per particle. The timescales of colloidal rearrangement combined with the directional interactions resulting from Janus geometrymake this a prototypical system to elucidate, on a mechanistic level and with single-particle kineticresolution, how chemical anisotropy and reaction kinetics coordinate to generate highly ordered structures.
Clusters, an intermediate level of matterbetween building block (atom, molecule,or particle) and bulk phase, are found ubiq-
uitously in nature and technology—for example,in the nucleation of bulk phases (1), nanoparticles(2), andprotein aggregates in biology (3,4).Whereas
structures that result from isotropic interactions be-tween building blocks are well understood (5–8),it is more challenging to understand clusters formedfrom the common case of directional noncovalentinteractions (9–17). On this question, we note thatfor molecular amphiphiles, such as surfactants,phospholipids, and many block copolymers, thesegregation of their polar and nonpolar portionsis a major mechanism steering the spontaneousformation of microstructured mesophases withfascinating and useful structures (9–11). Sim-ilarly, colloidal particles, larger than moleculesbut small enough to sustain Brownian motion,also assemble into clusters owing to directionalnoncovalent interactions (12–17). A largely un-solved problem is the question of commonality
between these fields. Therefore, combining am-phiphilicitywith colloidal rigidity, we study “Janusspheres” that are hydrophobic on one hemi-sphere and negatively charged on the other.An earlier publication from this laboratory de-scribed some structures that these hybrid ma-terials form (18). Here, we address the kinetics ofself-assembly at the single-particle level, showingthat small, kinetically favored isomers join toform highly ordered but nonequilibrium large-scale structures.
A critical design rule is that the range ofinterparticle interactions (hydrophobic attractionand electrostatic repulsion) must be short relativeto particle size and that the interactions must bereversible. Clustering then favors densely packedstructures with at most six nearest neighbors perparticle, in contrast to the more open and lessordered structures formed by particles whose in-teraction range is larger (13). At very low saltconcentrations, particles repel one another electro-statically, whereas at high salt concentrations, vander Waals forces cause the particles to aggregateirreversibly (19). Therefore, we consider interme-diate concentrations of monovalent salt at whichamphiphilic clusters self-assemble (20).
If the hydrophobic patch is too small, as-sembly admits clusters composed of at most fourparticles. However, increase in patch size allowssuch clusters to grow into larger assemblies, withtwo constraints: First, particles must approachclosely enough to experience hydrophobic attrac-
1Department of Materials Science and Engineering, Universityof Illinois, Urbana, IL 61801, USA. 2Department of Physics,University of Illinois, Urbana, IL 61801, USA. 3Department ofMaterials Science and Engineering, Northwestern University,Evanston, IL 60208,USA. 4Department of Engineering Sciencesand Applied Mathematics, Northwestern University, Evanston,IL 60208, USA. 5Department of Chemistry, University of Illinois,Urbana, IL 61801, USA.
*To whom correspondence should be addressed. E-mail:[email protected] (E.L.); [email protected] (S.G.)
www.sciencemag.org SCIENCE VOL 331 14 JANUARY 2011 199
REPORTS
on
Janu
ary
15, 2
011
ww
w.s
cien
cem
ag.o
rgD
ownl
oade
d fr
om

tion; second, the number of nearest neighborsmust not exceed six. For Janus particles whosehydrophobic domains are hemispheres, Fig. 1Adisplays pathways of reversible self-assembly, allof which we observed. They form a complex net-work in which multiple cluster possibilities em-anate from every point and, likewise, routes fromevery point can meet. The hydrophobic patcheslend appreciable orientational freedom to indi-vidual particles within the clusters. This promotesdynamical interconversion between clusters throughthree major mechanisms: step-by-step addition ofindividual particles, fusion of smaller clusters intoa larger one, and isomerization. The clusters in thisregime, with a size range N = 2 to 7 (fig. S1), aresimilar to those formed in depletion-induced assem-bly of homogeneous particles (5), except that forhomogeneous particles the clusters must be keptisolated to avoid further aggregation. Here, clusteraggregation is prevented by electrostatic repul-sion between the charged surface regions, allowingclusters to live in close proximity without fusing.
The ability to control the long-range repulsionmakes it possible to switch on clustering at willby adding salt to Janus spheres in deionizedwater. We found that after the distribution ofcluster sizes equilibrated (fig. S2), their shapescontinued to change. For example, the cappedtrigonal bipyramid (CTBP) shape with clustersizeN = 6 formed first, then gradually isomerizedto themore symmetric octahedral shape (Fig. 1B).These kinetic data are consistent with a reversiblefirst-order reaction with rate constants given inthe figure caption. In this system, the octahedralshape is more stable. Nonetheless, the CTBP iso-mer forms first, because growth proceeds viarotation of a particle in a feeder cluster. Particleslocated at the cluster ends have the largest ro-tational freedom and thus act as the points whereadditional particles join the cluster, causing elon-gated structures to form. In a cluster, particlesconstantly jiggle about their mean positions; thisprocess is analogous to highly excited vibrationalmotion in molecules, where the vibrations oc-casionally cause collective rearrangements. Mo-lecular reaction dynamics occur on picosecond orfaster time scales (21), whereas these colloidaltransformations occur on the time scale of sec-onds and can be visualized one by one withoutensemble averaging. These reaction dynamics areillustrated in movie S1, showing cluster growthfrom smaller clusters, and movies S2 and S3,showing cluster isomerization via different path-ways. Unlike micelles formed from molecules,whose predominant growthmechanism is throughaddition of monomers to preexisting micelles(10), the rigid, spherical shape of these colloidalbuilding blocks allows them to rotate withoutchange of position such that clusters grow at theirends by fusing with other clusters. A second dif-ference is that, unlike molecular micelles whosefluidity encourages shape to equilibrate rapidly,these colloidal clusters possess definite config-urations. For the same number of particles in acluster, there are distinctly different, long-lived shapes.
Fig. 1. Clusters formed from Janus spheres with one hydrophobic hemisphere. (A) Network of reactionpathways, all of which we have observed in experiments at 3.8 mM NaCl. Reaction mechanisms ofmonomer addition, cluster fusion, and isomerization are denoted by black, red, and blue arrows,respectively. Isomers with N = 6 and N = 7 elemental spheres are highlighted in boxes. Movie S1 shows asimple example of cluster growth by the fusion of two clusters. (B) A study of isomerization between twotypes of N = 6 clusters, the capped trigonal bipyramid (CTBP) and the octahedron (OCT). Here and in allother images, the Janus spheres have a diameter of 1 mm. After initiating the cluster process by setting theNaCl concentration at 3.8mM, the partition of Janus spheres between clusters of different size equilibratesafter 20 min (see fig. S2) but isomerization continues. Once the total number of hexamers (black filledcircles) has stabilized, isomerization (fraction of CTBP, blue open circles) is consistent with first-orderreaction kinetics in time t, d[OCT]/dt = k1[CTBP] – k–1[OCT], time constant 34 min, k1/k–1 = 2.2, andk1 = 0.02min−1. Here the calculation is based on the ensemble behavior of many clusters, among whichindividual ones can follow different reaction pathways. Movies S2 and S3 compare different pathways ofisomerization.
Fig. 2. Triple helices formed at higher salt concentration and higher particle concentration. (A) Geo-metrical representation of helix growth by face-sharing tetrahedra. (B) Comparison of a small chiralcluster (3.8 mM NaCl) and a longer helical cluster (5 mM NaCl). For both cases, fluorescence images ofboth right-handed and left-handed structures are shown. (C) Fluorescence image illustrating the stabilityof wormlike structures at high volume fraction. Movie S6 shows the fusion of two chiral chains byBrownian motion.
14 JANUARY 2011 VOL 331 SCIENCE www.sciencemag.org200
REPORTS
on
Janu
ary
15, 2
011
ww
w.s
cien
cem
ag.o
rgD
ownl
oade
d fr
om
A minor increase of the salt concentration to5mM reduced the electrostatic repulsion to permitthe growth of striking helical structures (Fig. 2).Closer inspection showed these to be Boerdijk-Coxeter (BC) helices (22), sometimes called Bernalspirals. The formation and stability of helices perse is a consequence of the directionality of thepairwise interactions, which allows them to per-sist up to the highest particle concentrations (60%after sedimentation), unlike homogeneous par-ticles, which at lower particle concentrations formBC helices that become unstable when the con-centration is higher (6, 7).
All dense packings of spheres on a cylindricalsurface have the same internal energy, becauseeach sphere except those at the ends of the chaininteracts with six nearest neighbors (4). This re-mains true for Janus spheres, provided that eachhydrophobic side faces the corresponding hemi-spheres of all neighbors—a constraint that issatisfied in the very structures that arise from theanisotropic interaction. This is analogous to car-bon nanotubes, whose variety of rolled structuresresult from the same threefold coordinated graphenesheet (23). Thus, the absence of helical structuresother than the BC helix indicates that either en-tropic or kinetic effects matter here.
To clarify the relative stability of a range ofhelical structures (4), we calculated their relativefree energy as a function of Janus balance, takinginto account the rotational entropy of individualJanus particles as well as vibrational modes; a re-lated free-energy landscape is known for spheres
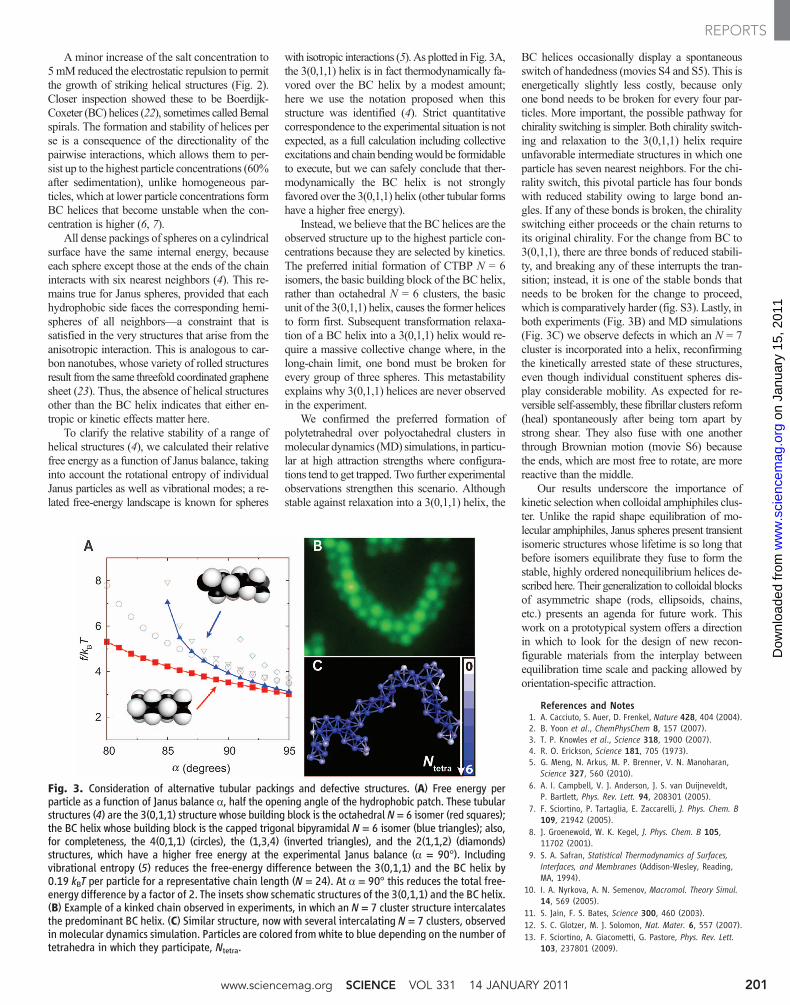
with isotropic interactions (5). As plotted in Fig. 3A,the 3(0,1,1) helix is in fact thermodynamically fa-vored over the BC helix by a modest amount;here we use the notation proposed when thisstructure was identified (4). Strict quantitativecorrespondence to the experimental situation is notexpected, as a full calculation including collectiveexcitations and chain bendingwould be formidableto execute, but we can safely conclude that ther-modynamically the BC helix is not stronglyfavored over the 3(0,1,1) helix (other tubular formshave a higher free energy).
Instead, we believe that the BC helices are theobserved structure up to the highest particle con-centrations because they are selected by kinetics.The preferred initial formation of CTBP N = 6isomers, the basic building block of the BC helix,rather than octahedral N = 6 clusters, the basicunit of the 3(0,1,1) helix, causes the former helicesto form first. Subsequent transformation relaxa-tion of a BC helix into a 3(0,1,1) helix would re-quire a massive collective change where, in thelong-chain limit, one bond must be broken forevery group of three spheres. This metastabilityexplains why 3(0,1,1) helices are never observedin the experiment.
We confirmed the preferred formation ofpolytetrahedral over polyoctahedral clusters inmolecular dynamics (MD) simulations, in particu-lar at high attraction strengths where configura-tions tend to get trapped. Two further experimentalobservations strengthen this scenario. Althoughstable against relaxation into a 3(0,1,1) helix, the
BC helices occasionally display a spontaneousswitch of handedness (movies S4 and S5). This isenergetically slightly less costly, because onlyone bond needs to be broken for every four par-ticles. More important, the possible pathway forchirality switching is simpler. Both chirality switch-ing and relaxation to the 3(0,1,1) helix requireunfavorable intermediate structures in which oneparticle has seven nearest neighbors. For the chi-rality switch, this pivotal particle has four bondswith reduced stability owing to large bond an-gles. If any of these bonds is broken, the chiralityswitching either proceeds or the chain returns toits original chirality. For the change from BC to3(0,1,1), there are three bonds of reduced stabili-ty, and breaking any of these interrupts the tran-sition; instead, it is one of the stable bonds thatneeds to be broken for the change to proceed,which is comparatively harder (fig. S3). Lastly, inboth experiments (Fig. 3B) and MD simulations(Fig. 3C) we observe defects in which an N = 7cluster is incorporated into a helix, reconfirmingthe kinetically arrested state of these structures,even though individual constituent spheres dis-play considerable mobility. As expected for re-versible self-assembly, these fibrillar clusters reform(heal) spontaneously after being torn apart bystrong shear. They also fuse with one anotherthrough Brownian motion (movie S6) becausethe ends, which are most free to rotate, are morereactive than the middle.
Our results underscore the importance ofkinetic selection when colloidal amphiphiles clus-ter. Unlike the rapid shape equilibration of mo-lecular amphiphiles, Janus spheres present transientisomeric structures whose lifetime is so long thatbefore isomers equilibrate they fuse to form thestable, highly ordered nonequilibrium helices de-scribed here. Their generalization to colloidal blocksof asymmetric shape (rods, ellipsoids, chains,etc.) presents an agenda for future work. Thiswork on a prototypical system offers a directionin which to look for the design of new recon-figurable materials from the interplay betweenequilibration time scale and packing allowed byorientation-specific attraction.
References and Notes1. A. Cacciuto, S. Auer, D. Frenkel, Nature 428, 404 (2004).2. B. Yoon et al., ChemPhysChem 8, 157 (2007).3. T. P. Knowles et al., Science 318, 1900 (2007).4. R. O. Erickson, Science 181, 705 (1973).5. G. Meng, N. Arkus, M. P. Brenner, V. N. Manoharan,
Science 327, 560 (2010).6. A. I. Campbell, V. J. Anderson, J. S. van Duijneveldt,
P. Bartlett, Phys. Rev. Lett. 94, 208301 (2005).7. F. Sciortino, P. Tartaglia, E. Zaccarelli, J. Phys. Chem. B
109, 21942 (2005).8. J. Groenewold, W. K. Kegel, J. Phys. Chem. B 105,
11702 (2001).9. S. A. Safran, Statistical Thermodynamics of Surfaces,
Interfaces, and Membranes (Addison-Wesley, Reading,MA, 1994).
10. I. A. Nyrkova, A. N. Semenov, Macromol. Theory Simul.14, 569 (2005).
11. S. Jain, F. S. Bates, Science 300, 460 (2003).12. S. C. Glotzer, M. J. Solomon, Nat. Mater. 6, 557 (2007).13. F. Sciortino, A. Giacometti, G. Pastore, Phys. Rev. Lett.
103, 237801 (2009).
Fig. 3. Consideration of alternative tubular packings and defective structures. (A) Free energy perparticle as a function of Janus balance a, half the opening angle of the hydrophobic patch. These tubularstructures (4) are the 3(0,1,1) structure whose building block is the octahedral N = 6 isomer (red squares);the BC helix whose building block is the capped trigonal bipyramidal N = 6 isomer (blue triangles); also,for completeness, the 4(0,1,1) (circles), the (1,3,4) (inverted triangles), and the 2(1,1,2) (diamonds)structures, which have a higher free energy at the experimental Janus balance (a = 90°). Includingvibrational entropy (5) reduces the free-energy difference between the 3(0,1,1) and the BC helix by0.19 kBT per particle for a representative chain length (N = 24). At a = 90° this reduces the total free-energy difference by a factor of 2. The insets show schematic structures of the 3(0,1,1) and the BC helix.(B) Example of a kinked chain observed in experiments, in which an N = 7 cluster structure intercalatesthe predominant BC helix. (C) Similar structure, now with several intercalating N = 7 clusters, observedin molecular dynamics simulation. Particles are colored from white to blue depending on the number oftetrahedra in which they participate, Ntetra.
www.sciencemag.org SCIENCE VOL 331 14 JANUARY 2011 201
REPORTS
on
Janu
ary
15, 2
011
ww
w.s
cien
cem
ag.o
rgD
ownl
oade
d fr
om
14. W. L. Miller, A. Cacciuto, Phys. Rev. E 80, 021404 (2009).15. S. Whitelam, S. A. F. Bon, J. Chem. Phys. 132, 074901
(2010).16. K. Liu et al., Science 329, 197 (2010).17. Z. Mao, H. Xu, D. Wang, Adv. Funct. Mater. 20, 1053
(2010).18. L. Hong, A. Cacciuto, E. Luijten, S. Granick, Langmuir
24, 621 (2008).19. J. W. Goodwin, Colloids and Interfaces with Surfactants
and Polymers (Wiley, Chichester, UK, ed. 2, 2009),pp. 163−181.
20. See supporting material on Science Online.21. J. Mikosch et al., Science 319, 183 (2008).22. A. H. Boerdijk, Philips Res. Rep. 7, 303
(1952).23. H. Dai, Surf. Sci. 500, 218 (2002).24. We thank J. Yan for discussions. Supported by the
U.S. Department of Energy (S.G., Q.C., S.J.);Division of Materials Science, under award DE-FG02-07ER46471 through the Frederick Seitz MaterialsResearch Laboratory at the University of Illinois atUrbana-Champaign (to S.G.); and by NSF grants CBET-
0853737 (S.C.B.) and DMR-0346914 and DMR-1006430(J.K.W. and E.L., to E.L.).
Supporting Online Materialwww.sciencemag.org/cgi/content/full/331/6014/199/DC1Materials and MethodsFigs. S1 to S3Movies S1 to S6References
7 September 2010; accepted 9 December 201010.1126/science.1197451
The Deglacial Evolution of NorthAtlantic Deep ConvectionDavid J. R. Thornalley,1,2* Stephen Barker,1 Wallace S. Broecker,3 Henry Elderfield,2 I. Nick McCave2
Deepwater formation in the North Atlantic by open-ocean convection is an essential component of theoverturning circulation of the Atlantic Ocean, which helps regulate global climate. We use water-columnradiocarbon reconstructions to examine changes in northeast Atlantic convection since the Last GlacialMaximum. During cold intervals, we infer a reduction in open-ocean convection and an associatedincursion of an extremely radiocarbon (14C)–depleted water mass, interpreted to be Antarctic IntermediateWater. Comparing the timing of deep convection changes in the northeast and northwest Atlantic, wesuggest that, despite a strong control on Greenland temperature by northeast Atlantic convection, reducedopen-ocean convection in both the northwest and northeast Atlantic is necessary to account forcontemporaneous perturbations in atmospheric circulation.
Vertical density gradients within the globalocean limit the exchange of surface anddeep waters. Only in a limited number of
locations, characterized by weak stratification ofthe water column and intense surface buoyancylosses, can surface water be converted into deepwater by open-ocean convection (1). Through its
control on deepwater formation, open-ocean con-vection sets the properties of the deep globalocean and forms an essential component of theglobal overturning circulation (1).
Open-ocean deep convection in the NorthAtlantic occurs in the Labrador and GreenlandSeas (1), transformingwell-ventilated, nutrient-poor
surface waters into North Atlantic Deep Water(NADW), which spreads southward to occupymuch of the deep Atlantic. Paleoceanographicstudies suggest that deep convection in the NorthAtlantic was altered during the last ice age ascompared with today [e.g., (2, 3)]. Glacial con-vection was shallower, forming Glacial NorthAtlantic Intermediate Water (GNAIW), and pos-sibly weaker, leading to poorer ventilation of thedeep Atlantic. Rapid fluctuations between weakand strong modes of deep convection could alsobe linked with abrupt climate changes across theNorth Atlantic region because of the associatedchanges in the poleward flux of warm surfacewaters. Furthermore, mode switches in deep con-vection might be triggered by changes in the in-put of fresh water, with the Younger Dryas (YD)
1School of Earth and Ocean Sciences, Cardiff University, Cardiff,CF10 3YE, UK. 2The Godwin Laboratory for Palaeoclimate Re-search, Department of Earth Sciences, University of Cambridge,Cambridge, CB2 3EQ, UK. 3Lamont-Doherty Earth Observatoryof Columbia University, Palisades, NY 10964–8000, USA.
*To whom correspondence should be addressed. E-mail:[email protected]
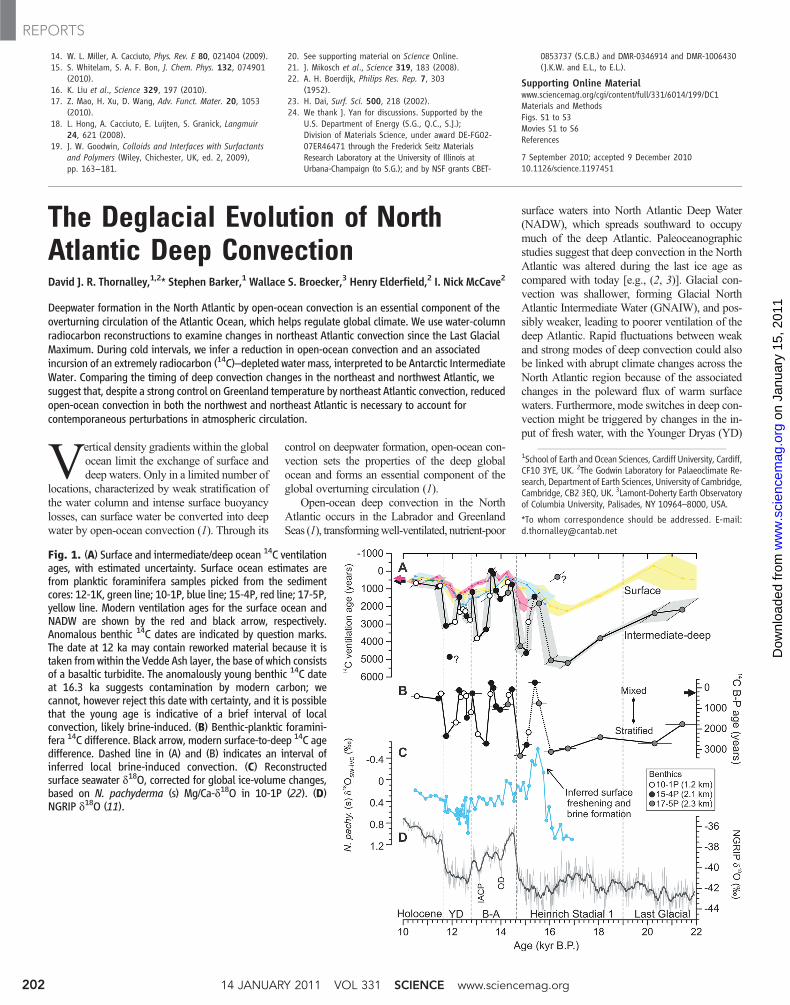
Fig. 1. (A) Surface and intermediate/deep ocean 14C ventilationages, with estimated uncertainty. Surface ocean estimates arefrom planktic foraminifera samples picked from the sedimentcores: 12-1K, green line; 10-1P, blue line; 15-4P, red line; 17-5P,yellow line. Modern ventilation ages for the surface ocean andNADW are shown by the red and black arrow, respectively.Anomalous benthic 14C dates are indicated by question marks.The date at 12 ka may contain reworked material because it istaken fromwithin the Vedde Ash layer, the base of which consistsof a basaltic turbidite. The anomalously young benthic 14C dateat 16.3 ka suggests contamination by modern carbon; wecannot, however reject this date with certainty, and it is possiblethat the young age is indicative of a brief interval of localconvection, likely brine-induced. (B) Benthic-planktic foramini-fera 14C difference. Black arrow, modern surface-to-deep 14C agedifference. Dashed line in (A) and (B) indicates an interval ofinferred local brine-induced convection. (C) Reconstructedsurface seawater d18O, corrected for global ice-volume changes,based on N. pachyderma (s) Mg/Ca-d18O in 10-1P (22). (D)NGRIP d18O (11).
14 JANUARY 2011 VOL 331 SCIENCE www.sciencemag.org202
REPORTS
on
Janu
ary
15, 2
011
ww
w.s
cien
cem
ag.o
rgD
ownl
oade
d fr
om