suppression of dgat2 expression improves hepatic .... geisler, sanjay bhanat, brett monia, xing-xian...
TRANSCRIPT

Yale UniversityEliScholar – A Digital Platform for Scholarly Publishing at Yale
Yale Medicine Thesis Digital Library School of Medicine
3-30-2007
Suppression of DGAT2 Expression ImprovesHepatic Steatosis and Prevents Fat Induced InsulinResistanceAmeya Kulkarni
Follow this and additional works at: http://elischolar.library.yale.edu/ymtdl
This Open Access Thesis is brought to you for free and open access by the School of Medicine at EliScholar – A Digital Platform for ScholarlyPublishing at Yale. It has been accepted for inclusion in Yale Medicine Thesis Digital Library by an authorized administrator of EliScholar – A DigitalPlatform for Scholarly Publishing at Yale. For more information, please contact [email protected].
Recommended CitationKulkarni, Ameya, "Suppression of DGAT2 Expression Improves Hepatic Steatosis and Prevents Fat Induced Insulin Resistance"(2007). Yale Medicine Thesis Digital Library. 259.http://elischolar.library.yale.edu/ymtdl/259

Permission to photocopy or microfilm processing
of this thesis for the purpose of individual
scholarly consultation or reference is hereby
granted by the author. This permission is not to
be inte rpreted as affecting publication of this work
or otherwise placing it in the public domain, and
the author reserves aU ri ghts of ow nership
guaran teed under common law protection of
unpublished manuscri
re of Author
5 I 0(,
Date

SUPPRESSION OF DGAT2 EXPRESSION IMPROVES HEPATIC STEATOSIS
AND PREVENTS FAT INDUCED INSULIN RESISTANCE
A Thesis Submitted to the Yale University School of Medicine in Partial Fulfi llment of
the Requirements for the Degree of Doctor of Medicine
By
Ameya Ravindrakumar Kulkami
2006

YALE MEDICAL UBRARY
AUG 12 2006 rf/j 1- YIJ...
72.. '11

ABSTRACT
SUPPRESSION OF DGATI EXPRESSION IMPROVES HEPATIC STEATOSIS AND PREVENTS FAT INDUCED
INSULIN RESISTANCE.
Ameya Kulkarni, Cheal S. Choi" David Savage, Katsutaro Morino, Varman T. Samuel, Sheene Kim, Amy Wang, John
G. Geis ler, Sanjay Bhanat, Brett Monia, Xing-Xian Yu, Susanne Neschen, Anthony 1. Romaneli, Gerald I. Shulman.
Department of lntemol Medicine, Yale University School of Medicine, New Haven, cr.
It is well known that metabolites resulting from Ihe accumulation of fat in tissue results in fatty liver, obesity, and
insulin resistance. Because triglyceride synthesis is essential for this process, inhibition of the fi nal step afTO
synthesis has been considered as a new therapeutic target for hepalosteatosis and insulin resistance. In this srudy, we
investigated the metabolic impact of acyl eoA: diacylglycerol acyltransferase I (DGATI) and 2 (DGATI) supprc:::lsion.
We used antisense oligonucleotides (ASOs) to reduce the expression of these enzymes in liver and fat in Sprague
Dawley rats fed a 27% saffl ower oil high fat diet (HFD) for 4 weeks. Rats were injected with one of the fo llowing:
saline, control ASO, DGATI ASO or DGATI ASO subcutaneously twice a week for 4 weeks. DOAT I and DGATI
ASO treatment reduced DGATI and DOATI mRNA levels in liver by 95% and 57% respectively but only OGATI
ASO lTeatment significarrtly reduced TO content when compared to the saline group. We detennined the effects of
ASQ treatment on insulin nction in vivo during II 135 min hyperinsulinemic(4mU/kglmin)-euglycemic clamp. Glucose
turnover and uptake were assessed using [3)H]glucosc infusion and {I-14C]2-deoxyglucose injection during clamps.
DGA 1'2 ASO treated rats were protected from HFD induced insulin resistance as demonstrated by an 80"10 increase in
glucose infusion rate (24.0±O.9 vs. I 3.4±1. I mg/kg/min, p<O.OO I). This wns accounted for by significant suppression
of hepatic glucose production (82±6 vs. S3±11% p<O.OS) and a 54% increase in insulin-stimulated whole body glucose
uptake (25.3± 1. 1 vs. 16.3±O.7 mglkglmin, p<O.OOI) when compared to the control ASO group. Insulin-stimulated
glucose uptake in skeletal muscle and suppression of plasma free fatty acid levels during the clamp were also
signifi cantly increased in DGAT2 ASO treated rats when compared to controls (200 uptake: 329BI vs. 263±28
nmol/glmin, p=O.03, suppression ofFFA: 64±4 vs. 48±5%, p"'O.OI5). Of note, the DGATI ASO group showed less
weight gain than controls despite the same food consumption over the treatment period . The ratio orweigl1t gain versus
food consumption, efficiency of weight gain, was significantly lower in the DGAT2 group when compared to other
groups, suggesting an increase in energy expenditure in the DGA 1'2 ASO group.
In summary, this study demonstrates that the reduction orDGATI using an ASO prote<:ts against insulin resis tance in
liver and peripheral tissue.

ACKNOWLEDGEMENTS
r am forever indebted to:
Dr. Shulman. for his amazing mentorship and contagious enthusiasm, and most of all, for
giving me the tools to find my passion for science
Dr. Cheal Sao Chai, for his tireless guidance, discipline, and work ethic
Dr. Shee Ne Kim, for her patience and support
Dr. David Savage and Dr. Vatman Samuel, for their intellectual guidance.
Dr. Gary Cline, for his thoughtful and meticulous review of this work
The Lab of Dr. Gerald Shulman
Howard Hughes Medical Institute
The Office of Student Research
My family
TABLE OF CONTENTS
Introduction . . .... . . . ......... ....... . . . . . .. . .... .. .. ....... .. . ....... .. ..... . .... ... .. .. ... .. . .. .. . . . 1
Aims .. . . . .... ... ..... . . , .... . . . .. . . . .. . . . ...... . ...... . ... . .... ........ . ' 0 .••••• • ••• . ••• . .••. •• . . •••••••• 4
Methods ......... . ... ... . . .... .. .. ..... , . .... , ..... ......... . ..... . . ..... .. ..... . ... ... . ,_. , .......... ... 5
Results . . .. .. .............. .. . ........ .... .. ...... .. .. . .. ... . ...... . . . .. . .. .. . .. ... ....... ... ... ........ 14
Discussion . ... ...... .. .... . ... .... ........... ... .................... .... . .. . . . . . . . . ... , .... ... ....... 18
References ................ .... .......... .. ..... .... .. . ... .. .... . .. . .. ... . ... . . . ..... .... ......... ... . 21
Figures ... .... .... ..... ,., .. . . , •• , .... .. . . .. ...... ... . .. .. .. .. ... .. . . .. ... ... .. .... .. .. ............. ...... 25

INTRODUCTION
Type 2 Diabetes Mellitus has rapidly become an epidemic in the United States, with
the number of people afflicted quickly approaching 17 million I , The problem is also
growing worldwide, as it is estimated that 250 million people will be affected by the
year 20205, Though the primary insult in the pathogenesis of type 2 diabetes is sti ll
uncertain, insulin resistance has been implicated as a major contributor to the clinical
manifestations of the disease. Several cross-sectional studies have shown insulin
resistance in virtually all patients with type 2 diabetes. In addition, prospective
studies have demonstrated the presence of insulin resistance up to two decades before
the onset of the disease2,3,4.
The intracellular events leading to insulin resistance are still relatively unknown.
However, the search for the primary defect in this process has been greatly helped by
an understanding of the nonnal insulin signaling cascade in both myocytes and
hepatocytes.
In skeletal muscle cells, insulin signaling begins with insulin binding to its receptor
and inducing autophosporylation. This in tum activates tyrosine phosporylation of
Insulin Receptor Substrate~ 1 (IRS-I), which activates phosphatidylinositol 3~kinase
(pI-3 Kinase). PI-3 Kinase induces an intracellular signaling cascade involving AKT
and other intennediates. The final result of this cascade is the translocation of the
GLUT 4 receptor- the primary transporter of glucose into skeletal muscleS --onto the
cellular membrane. In hepatocytes, IRS-2 phosporylation increases PI-3 kinase and
AKT-2 activity. This in tum is thought to activate Glycogen Synthase Kinase 3

Z
(GSK3), resulting in an increase in glycogen synthesis-the primary insulin-mediated
activity in the livers,zo,
Further study of this cascade has implicated the elevation of intracellular lipids as a
major contributor to the onset of insulin resistance in muscle and liver. A clear
correlation between the accumulation of lipids in the liver and skeletal muscle and the
development of insulin resistance has been repeatedly reported6,7,8,9. Several studies
from Dr. Shulman's group and others have suggested that increasing intracellular
fatty acid metabolites activate a serine/threonine kinase cascade (possibly initiated by
PKC-9 in rodent muscle10) and subsequent activation of other serine kinases such as
IKK-~ 11,1 2 and JNK_11 3 lead to phosporylation of serine sites on IRS-I, interfere with
insulin stimulation ofPI3K and result in insulin resistanceS,14, A similar process has
been suggested in liver, initiated by PKC-£ and mediated by tyrosine phosporylation
ofIRS-Z",
Triglycerides, as the major storage molecules for lipid in cells, are a primary source
of intracellular fatty acid metabolites. Diacylglycerol acyl tr.ansferase (DGAT)
catalyzes the final step in triglyceride synthesis by using diacylglycerol and acyl
coenzyme A (acylCoA) (Figure 1), DGAT exists in two primary isofonns: DGA Tl
and DGA TIIS. Although these isofonns are encoded by two separate gene families ls ,
both enzymes are ubiquitously expressed in tissues that are active in TO synthesis
primarily the liver, adipose tissue, the intestinal epithelium, and epidennis. DGATI
knockout mice have approximately 50% less TG in tissues l6,1 7 and are protected from
obesity and diet induced insulin resistance through a mechanism involving increased
energy expenditure, partially attributable to increased physical activityI6.17. Study of

DGA T2 has been much more difficult, primarily because homozygous knockout of
DGAT2 results in neonatal death due to severe lipopenia and impaired skin barrier
function IS.
3
Comparative study of the two isofonns revealed vastly different enzymes. Genetic
analysis showed little genetic homology between DGATI and 2, suggesting they
came from different gene families l5, Other studies showed that suppression of one
isofonn did not result in a compensatory increase in the atber l1, ls. Combined with the
fact that the highest levels of expression ofDGATl are in small intestine and white
adipose tissue, while DGAT2 is primarily expressed in liver and white adipose
tissue]5, these data strongly suggest that the two enzymes play different roles in TG
metabolism. Moreover, the extreme reduction in TO (approximately 90% in DGAT2
KO carcass) suggests DOA T2 is more important in triglyceride synthesis than
DGATI. However, no study to date has been able to examine the in vivo role of
DGAT2 in triglyceride synthesis or the resulting effects on insulin resistance.
To study the role that DGATI and DGA T2 play in triglyceride synthesis in vivo, we
used antisense oligonucleotides (ASOs) to induce a deficiency in DOATI and
DGAT2 expression in the setting of rats receiving fat enriched diets. Because ASOs
are active in liver and adipose tissue but not in skeletal muscle l9, this study provides a
unique model to study the effect of the isolated reduction of DGAT expression in
liver and adipose tissue. Additionally, it allows an opportunity to study the effect of
phannacologic reduction of triglyceride synthesis on fat induced insulin resistance.

AIMS
1) To characterize the effect of individual suppression ofDGATl and DGAT2 on
hepatic steatosis under high fat feeding conditions.
HYPOTHESIS : Suppression ofDGATl and DGAT2 will reduce hepatic steatosis in
rats fed a high fat diet.
2) To characterize the effect of individual suppression ofDGATl and DGAT2 on
insulin mediated activity in liver and ske1etal muscle under high fat feeding
conditions
HYPOTHESIS: Both DGA T1 and DGAT2 suppression will protect high fat fed rats
from developing hepatic insulin resistance.
4
5
METHODS
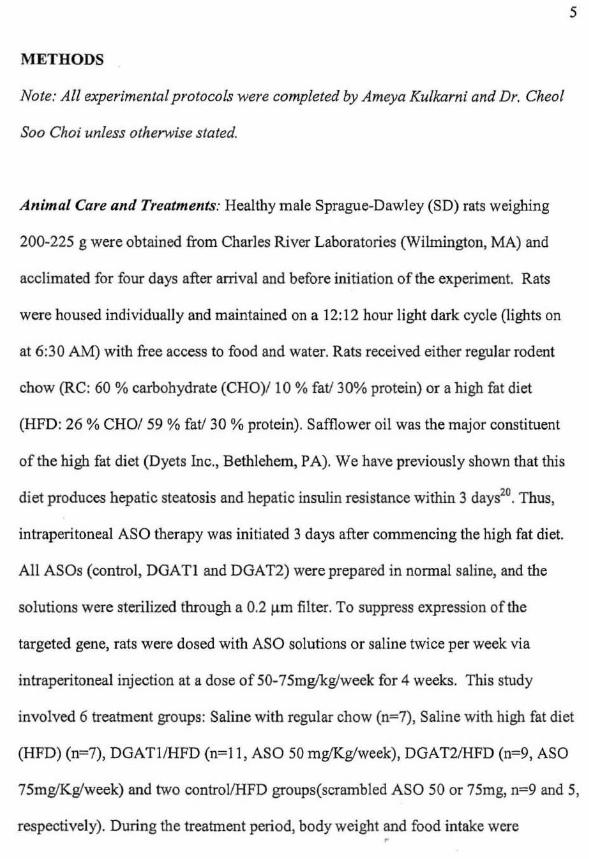
Note: All experimental protocols were completed by Ameya Kulkarni and Dr. Cheol
SOD Choi unless otherwise stated.
Animal Care and Treatments: Healthy male Sprague-Dawley (SD) rats weighing
200-225 g were obtained from Charles River Laboratories (Wilmington, MA) and
acclimated for four days after arrival and before initiation of the experiment. Rats
were housed individually and maintained on a 12: 12 hour light dark cycle (lights on
at 6:30 A1\1) with free access to food and water. Rats received either regular rodent
chow (RC: 60 % carbohydrate (CHO)! l 0 % fatl30% protein) or a high fat diet
(HFD: 26 % CHO/ 59 % fat/3D % protein). Safflower oil was the major constituent
of the high fat diet (Dyets Inc., Bethlehem, PAl. We have previously shown that this
diet produces hepatic steatosis and hepatic insulin resistance within 3 days20, Thus,
intraperitoneal ASO therapy was initiated 3 days after commencing the high fat diet.
All ASO, (control, DGATl and DGAT2) were prepared in norm.1 saline, and the
solutions were sterilized through a 0.2 ~m filter. To suppress expression of the
targeted gene, rats were dosed with ASO solutions or saline twice per week via
intraperitoneal injection at a dose of 50· 75mgikg/week for 4 weeks. This study
involved 6 treatment groups: Saline with regular chow (n=7), Saline with high fat diet
(HFD) (n=7), DGAT1IHFD (n=11, ASO 50 m!¥Kglweek), DGAT2IHFD (n=9, ASO
75mglKglweek) and two controIIHFD groups(scr.mbled ASO 50 or 75mg, n=9 and 5,
respectively). During the treatment period, body weight and food intake were •

6
measured twice weekly. All procedures were approved by The Yale Animal Care and
Use Committee.
Selection of Rat DGAT ASOs: ASOs were selected and produced by Isis
Phannaceuticals in Carlsbad, California. To identify rat DGAT I and 2 A80
inhibitors, rapid throughput screens were perfonned in vitro21, In brief, eighty ASOs
were designed to the rat DGATl and 2 mRNAs sequences and initial screens
identified several potent and specific ASOs, all of which targeted a binding site
within the coding region of the DGATI and 2 mRNAs. After extensive dose-response
characterization of the most potent ASOs from the screen, two lead ASOs, ISIS-
327822 and 1818-369235 for DGA T1 and 2 respectively, were chosen. The control
A80, 1818-141923, containing the sequence: 5'-CCTTCCCTGAAGGTTCCTCC-3',
did not have perfect complementarity to any known gene in public databases. These
ASOs contained a phosphoorthioate backbone, and in addition, the first and last five
bases had a 2'-O-(2-methoxy)-ethyl(2'-MOE) modification. This chimeric design has
been shown to provide both increased nuclease resistance and mRNA affinity, while
maintaining the robust RNase H terminating mechanism utilized by these types of
ASOS22, These benefits result in an attractive in vivo pharmacological. and
toxicological profile for 2' -MOE chimeric ASOs.
Experimental Protocols:
Two separate studies were performed after an overnight fast (food was removed at
5:00 pm on the day before the experiment, and experiments were started at

7
approximately 9:00 am.
Study 1: Hyperinsulinemic-E lIglycemic Clamp
After the four week treatment period described above. hyperinsulinemic eugJycemic
clamp studies were performed to measure peripheral and hepatic insulin sensitivities.
Seven days prior to the clamp studies, Dr. Jianying Dong (rodent surgeon for Dr.
Gerald Shulman) placed indwelling catheters into the right internal jugular vein
extending to the right atrium, and the left carotid artery extending to the aortic arch.
After the seven day waiting period and an overnight fast, [3-'H]-g1ucose (HPLC
purified; Perkin Elmer, Boston, MA USA) was infused at a rate of 0.15 ).lei/min for 2
hours to assess basal glucose turnover. Following the basal period, the
hyperinsulinemic euglycemic clamp was conducted for 135 min with a
primed/continuous infusion of human insulin (40 mU/kg prime, 4 mUlkglmin
infusion) (Novo Nordisk, Princeton, NJ) and a variable infusion of20% dextrose to
maintain euglycemia (-100 mg/dl). [3-' H]-g1ucose was infused at a rate of 0.4
).lCi/min throughout the clamps to estimate insulin-stimulated whole body glucose
fluxes, and 25 uCi of2-deoxy-D-[1-HC)glucose (DOG; Perkin Elmer. Boston, MA
USA) was injected as bolus at the 75\11 minute ofthe clamp to estimate the rate of
insulin-stimulated tissue glucose uptake23. Blood samples for the measurement of
plasma JH andlor 14C activities (60 Ill) w.ere taken at the end of basal period and
every 10 min during the last 45 min of the clamp period. Additional blood samples
(20 - 60f!1) were taken at 0, 70 and 135min for the determination of plasma free fatty
acids and insulin concentrations. At the end of the clamp, rats were anesthetized with
sodium pentobarbital injection (150mglkg) and all tissues were taken within 4 min.
frozen immediately using liquid N2·coo!ed aluminum tongs, and stored at -BO°C for
subsequent analysis.
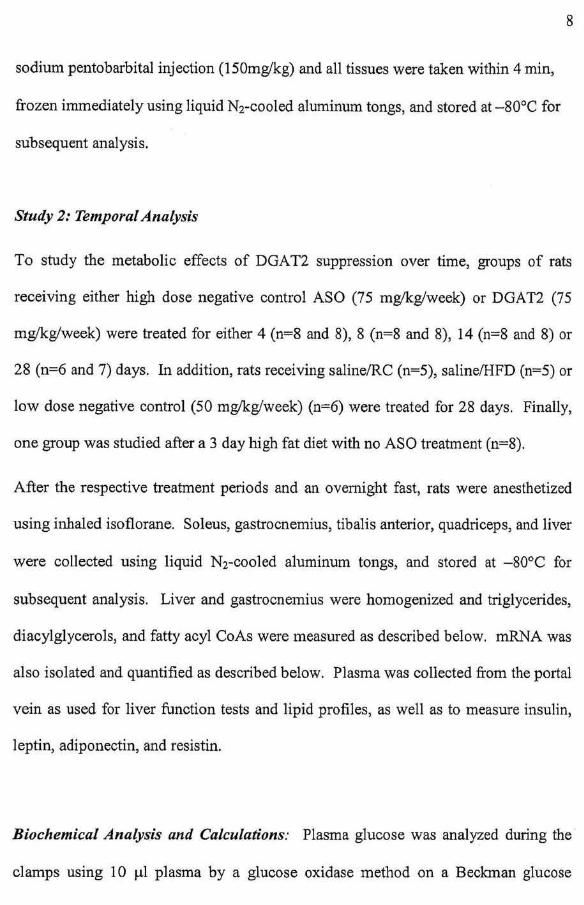
Study 2: Temporal Analysis
8
To study the metabolic effects of DGA T2 suppression over time, groups of rats
receiving either high dose negative control ASO (75 mg'kglweek) or DGAT2 (75
mg'kglweek) were treated for either 4 (n~8 and 8), 8 (n~8 and 8), 14 (n~8 and 8) or
28 (n=6 and 7) days. In addition, rats receiving salinelRC (n=5), salinelHFD (n=5) Dr
low dose negative control (50 mg'kglweek) (n~6) were treated for 28 days. Finally,
one group was studied after a 3 day high fat diet with no ASO treatment (n~8).
After the respective treatment periods and an overnight fast, fats were anesthetized
using inhaled isoflorane. Soleus, gastrocnemius, tibalis anterior, quadriceps, and liver
were collected using liquid Nrcooled aluminum tongs, and stored at -80°C for
subsequent analysis. Liver and gastrocnemius were homogenized and triglycerides,
diacylglycerols, and fatty acyl CoAs were measured as described below. mRNA was
also isolated and quantified as described below. Plasma was collected from the portal
vein as used for liver function tests and lipid profiles, as well as to measure insulin,
leptin, adiponectin, and resistin.
Biochemical Analysis and Calculations: Plasma glucose was analyzed during the
clamps using 10 J..11 plasma by a glucose oxidase method on a Beckman glucose

9
analyzer 11 (Beckman, Fullerton, CA), Plasma insulin was measured by Aida
Groszman at the Yale Radioimmunoassay Core Laboratories usmg
radioimmunoassay kit from Linca Research (St. Charles, MO). Plasma Free Fatty
Acid was detennined using an acyl-eoA oxidase based colorimetric kit (Wako Pure
Chemical Industries, Osaka, Japan). For the detennination of plasma lH-glucose and
J4C_2_DG, plasma was deproteinized with ZnS04 and Ba(OH)2. dried to remove 3H20,
resuspended in water, and counted in scintillation fluid (Ultima Gold, Perkin Elmer,
Boston MA) on a Beckman scintillation counter. Rates of basal and insulin-stimulated
whole-body glucose turnover were detennined as the ratio of the [3.lH]-g]ucose
infusion rate (disintegrations per minute [dpm] per minute) to the specific activity of
plasma glucose (dpms per mg) at the end of basal period and during the final 30 min
of the clamp experiment, respectively. Hepatic glucose output (HOO) was detennined
by subtracting the glucose infusion rate from the total glucose appearance. The
plasma concentration of 3H20 was determined by the difference between 3H counts
without and with drying and whole body glycolysis was calculated from the rate of
increase in plasma 3H20 concentration, detennined by linear regression of the
measurements at 100, 105, 115, 125, and 135 min23. Whole body glycogen plus lipid
synthesis was estimated by subtracting whole body glycolysis from whole body
glucose uptake24• Glucose uptake and glycogen synthesis in individual muscles were
calculated from muscle I·C-2-DG-6-P content and 3H incorporation to muscle
glycogen, as previously described23. For the determination of muscle 14C_2_DG_6_
phosphate (2-DG-6-P) content, muscle samples were homogenized, and the
supernatants were subjected to an ion-exchange column to separate 2-0G-6-P from 2-

9
analyzer II (Beckman, Fullerton, CA). Plasma insulin was measured by Aida
Groszman at the Yale Radioimmunoassay Core Laboratories using
radioimmunoassay kit from Linco Research (St. Charles, MO). Plasma Free Fatty
Acid was detennined using an acyl-eoA oxidase based colorimetric kit (Wako Pure
Chemical Industries, Osaka, Japan). For the detennination of plasma 3H-glucose and
14C_2_DG, plasma was deproteinized with ZnS04 and Ba(OHh, dried to remove 3H20,
resuspended in water, and counted in scinti llation fluid (Ultima Gold, Perkin Elmer,
Boston MA) on a Beckman scintillation counter. Rates of basal and insulin-stimulated
whole-body glucose turnover were determined as the ratio of the [3.3H]-glucose
infusion rate (disintegrations per minute [dpm) per minute) to the specific activity of
plasma glucose (dpms per mg) at the end of basal period and during the final 30 min
of the clamp experiment, respectively. Hepatic glucose output (HOO) was determined
by subtracting the glucose infusion rate from the total glucose appearance. The
plasma concentration of 3H20 was determined by the difference between 3H counts
without and with drying and whole body glycolysis was calculated from the rate of
increase in plasma 3H20 conce~tration, detennined by linear regression of the
measurements at 100, 105, 115, 125, and 135 min23. Whole body glycogen plus lipid
synthesis was estimated by subtracting whole body glycolysis from whole body
glucose uptake24. Glucose uptake and glycogen synthesis in individual muscles were
calculated from muscle 14C~2_DG_6~P content and 3H incorporation to muscle
glycogen, as previously described23. For the determination of muscle 14C~2~DG~6~
phosphate (2-DG-6-P) content, muscle samples were homogenized, and the
supernatants were subjected to an ion-exchange column to separate 2~DG ~6-P from 2-
10
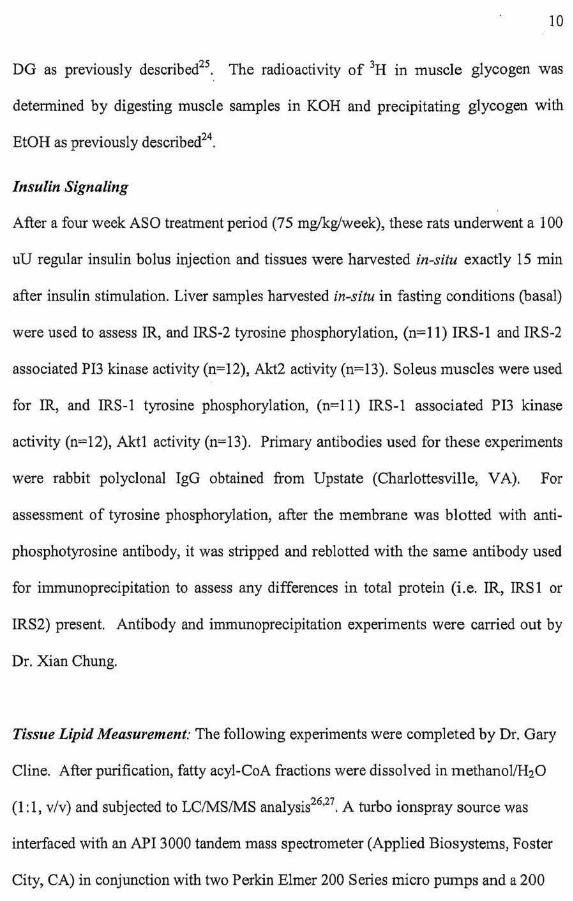
DO as previously described2S, The radioactivity of 3H in muscle glycogen was
determined by digesting muscle samples in KOH and precipitating glycogen with
EtOH as previously described24.
Insulin Signaling
After a four week ASO treatment period (75 mglkglweek») these rats underwent a 1 00
uU regular insulin bolus injection and tissues were harvested in-situ exactly 15 min
after insulin stimulation. Liver samples harvested in-situ in fasting conditions (basal)
were used to assess IR., and IRS·2 tyrosine phosphorylation. (0=11) IRS·} and IRS·2
associated PI3 kinase activity (0=12), Akt2 activity (0=13). Soleus muscles were used
for IR, and IRS-I tyrosine phosphorylation, (n=ll) IRS-I associated P13 kinase
activity (n=12), Aktl activity (0=13). Primary antibodies used for these experiments
were rabbit polyclonal IgO obtained from Upstate (Charlottesville, VA). For
assessment of tyrosine phosphorylation, after the membrane was blotted with anti
phosphotyrosine antibody, it was stripped and reb lotted with the same antibody used
for immunoprecipitation to assess any differences in total protein (i.e. IR. IRS 1 or
IRS2) present. Antibody and immunoprecipitation experiments were carried out by
Dr. Xian Chung.
Tissue Lipid Measurement: The following experiments were completed by Dr. Gary
Cline. After purification, fatty acyl-eoA fractions were dissolved in methanol/H20
(1: I, v/v) and subjected to LCIMSIMS analysis26,21, A turbo ionspray source was
interfaced with an API 3000 tandem mass spectrometer (Applied Biosystems, Foster
City, CA) in conjunction with two Perkin Elmer 200 Series micro pumps and a 200

11
Series autosampler (Perkin Elmer, Norwalk, CT). The transition pairs [M-2H]2-:[M
H-80]- (QI and Q3) were monitored in negative MRM mode for each fattyacyl -CoA
species. Total fatty acyl-eoA content is expressed as the sum of individual species.
An aliquot of the organic phase was retained for measurement of diacylglycerol
content. This was passed over preconditioned columns (Waters Sep-Pak Cartridge
WAT020845. Milford, Massachusetts) to purify the DAG component. Using mass
spectrometry the transition pairs [M+H-18]+: fatty acids from DAG (QI and Q3)
were monitored in + MRM mode for each DAG metabolite. Total DAG content is
expressed as the sum of individual species, Tissue triglyceride was extracted using
the method ofBligb and Dyer26 and measured using a DeL Triglyceride Reagent
(Diagnostic Chemicals Limited, P.E.!. Canada).
Determination of Triglyceride Synthesis and Fatty Acid Oxidation in Transfeeted
Rat Hepatoeytes In Vitro
The following experiments were completed by collaborators at l sis Pharmaceuticals
in Carlsbad California.
Trigylceride synthesis in transfected rat hepatocytes was determined by measuring the
incorporation of radio labeled glycerol into triglycerides l8. After a 24 hour recovery,
transfected cells cultured into 60-tpIll plates were switched to 1 ml of high glucose
DMEM medium containing 10% FBS, 0.5% BSA and 10 uCi of [,H]glycerol with or
without addition of 0.5 mM oleate and cultured overnight. The cells were then
harvested. One fraction of the harvested cell s were used for RNA extraction and gene
expression analysis hexane/isopropanol (3:2 in volume) mixture. The extracted lipids
12
were separated by TLC. The amount of incorporated [3H]g1yceroJ into triglyceride
was detennined by liquid scintillation counting. Fatty acid oxidation in the
transfected hepatocytes were detennined by measuring the oxidation of [14C]oleate
into acid soluble products and C0228
. Briefly, hepatocytes cultured in 25-cm2 flasks
were washed with PBS once and incubated with 2 mllow glucose DMEM plus 0.25%
BSA and 0.25 uCi of [14C]oleic acid (Amersham Biosciences). The flasks were
capped with a rubber stopper and gassed with O,-CO, (95%-5%). After 3 h
incubation, 1 ml of medium was mixed with 100 ul of 1 0% BSA and then with 100 ul
of 60% HCI04. After centrifugation, 1 mI of the supernatant was counted to
determine the levels of soluble 14C-products. Radiolabeled CO2 was trapped in a well
contained 50 ul of 35% NaOH and directly detennined by liquid scintillation counting.
Total RNA Preparation and Real-time Quantitative RT-PCR Analysis
The following experiments were completed by Ameya Kulkarni with significant
assistance from Dr. David Savage and Amy Wang.
Total RNA was extracted from harvested hepatocytes or tissues using total RNA
isolation reagent (#BL-l 0500, Biotecx Laboratories Inc, Houston TX) according to
manufacturer's instructions. Real-time quantitative RT -PCR was perfonned using
custom-made RT-PCR enzymes and reagents kit (Invitrogen Life Technology Inc,
Carlsbad, CAl and ABI Prism 7700 Sequence Detector (PE Applied Biosciences,
Foster City. CA). Primers and probes for analysis of the expression of different genes
were designed using Primer Express Software (PE Applied Biosciences, Foster City,
CAl·
12
were separated by TLC. The amount of incorporated eH]glycero] into triglyceride
was determined by liquid scintillation counting. Fatty acid oxidation in the
transfected hepatocytes were determined by measuring the oxidation of e4C]oieate
into acid soluble products and C02ZS
, Briefly, hepatocytes cultured in 25-cm2 flasks
were washed with PBS once and incubated with 2 ml10w glucose DMEM plus 0.25%
BSA and 0.25 uCi of [14C]oleic acid (Amersham Biosciences). The flasks were
capped with a rubber stopper and gassed with 02-C02 (95%-5%). After 3 h
incubation, 1 ml of medium was mixed with 100 ul of 10% ESA and then with 100 ul
of 60% HCI04 . After centrifugation, 1 ml of the supernatant was counted to
detennine the levels of soluble 14C-products. Radiolabeled CO2 was trapped in a well
contained 50 ul of35% NaOH and directly detennined by liquid scintillation counting.
Total RNA Preparation and Real-time Quantitative RT-PCR Analysis
The following experiments were completed by Ameya Kulkarni with significant
assistance from Dr. David Savage and Amy Wang.
Total RNA was extracted from harvested hepatocytes or tissues using total RNA
isolation reagent (#BL-I 0500, Biotecx Laboratories Inc, Houston TX) according to
manufacturer's instructions. Real-time quantitative RT-PCR was performed using
custom-made RT-PCR enzymes and reagents kit (Invitrogen Life Technology Inc,
Carlsbad, CA) and ASl Prism 7700 Sequence Detector (FE Applied Biosciences,
Foster City, CA). Primers and probes for analysis of the expression of different genes
were designed using Primer Express Software (PE Applied Biosciences, Foster City,
CAl·

For the analysis, 100 ng aftatal RNA was used. Each RNA sample was run in
duplicate and the mean value was used to calculate the gene expression level.
Fat Absorption
For the following experiments, the rats were treated and stool collected by Ameya
Kulkarni. Stool was then sent to Ron landacek for fat absorption analysis.
13
To measure intestinal fat absorption in ASO treated rats, three groups of rats were
treated with either Saline (n~5), negative control ASO (n~5) or DGAT2 (n~5) under
high fat feeding conditions as described above. During the third week of the
treatment period, fat absorption was measured by placing a sucrose polybehenate
marker in a safflower oil diet and measuring the percent discarded in collected stool
samples29.
Histologic Analysis.
Liver and epididymal fat were fixed in 10% buffered fonnalin and embedded in
paraffin wax, Multiple adjacent 4-um sections were cut and amounted on glass slides.
After dehydration, the sections were stained with hematoxylin and eosin. Images of
the histological sections were analyzed by Isis Phannaceuticals.
Statistical Analysis
Data are expressed as means ± S,E.M. The significance of the differences in mean
values among different treabnent groups were evaluated using the one way-ANOV A,

14
followed by ad hoc analysis usmg the (Duncane test). P<O.05 was considered
statistical1y signjficant.

15
RESULTS
Consistency of High and Low Dose Control Groups
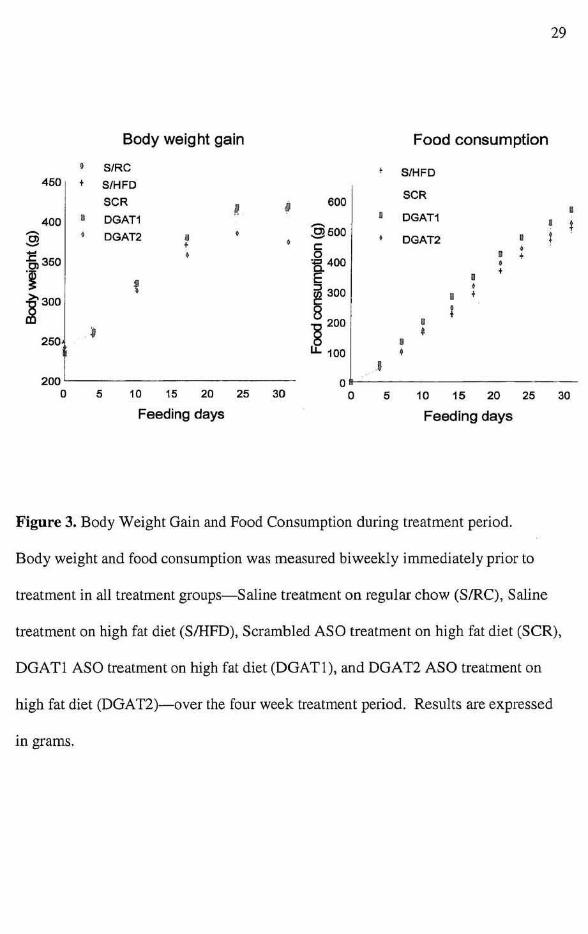
Weight gain and food intake were similar in all groups except the DGAT2 grouP.
which showed a significantly lower weight gain over the treabnent period (Figure 3).
As there was no significant di fference in weight gain, tissue TO content, lipid profile,
hepatic or peripheral insulin sensitivities between the low- and high-dose negative
control groups, the data was combined into one negative control ASO group.
Effect of ASO on DGAT 1 and 2 Expression in Liver, White Adipose Tissue, and
Skeletal Muscle
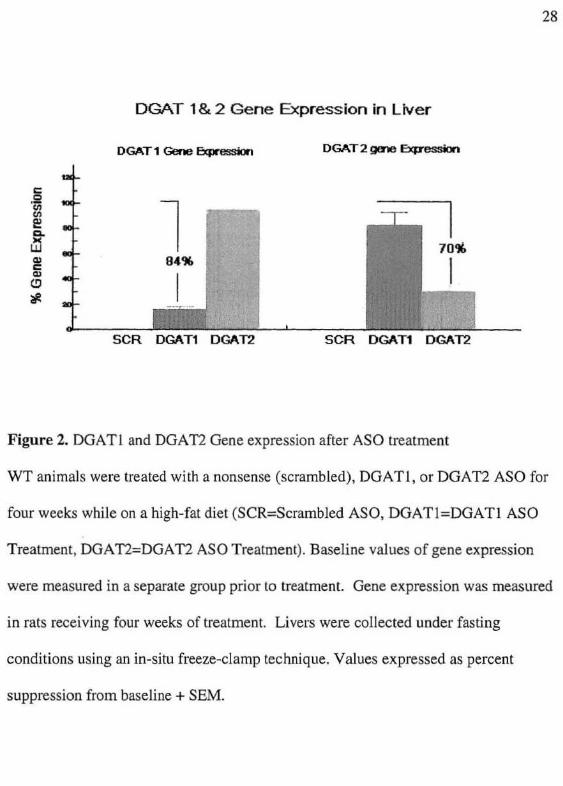
Antisense Oligonucleotide therapy reduced gene expression of DGATI and 2 by 95%
and 57% in liver when compared to scrambled ASO contro ls. Of note, there was no
reduction in gene expression in skeletal muscle. In results consistent with previous
data l7,1 8, DGATl and 2 expression did no t increase to compensate for deficiency of
the other enzyme (Figure 2), There was no evidence of hepatotoxicity, as assessed by
serum-transaminase concentrations and no variations in food intake between the
groups.
Effect of Reduced DGAT 1 and 2 Expression on Food Consumption and Weight
Gain
Although food consumption was consistent across a11 treatment groups (Figure 3),
final weights were significantly lower in the DGAT 2 treated animals (374±7.6 vs.
415±9.4, 412 ±6.0, 404±7.6 and 418±9.1 g for DGA T2 vs Saline/RC, SalineIHFD,

16
ScrambledIHFD and DGATl; p<O.05) (Figure 3) Weight gain efficiency, the ratio of
weight gain to food consumption, was significantly lower in DGA T2
group(0.26±0.02 vs. 0.3I±O.02, 0.30 ±O.OI and 0.33±0.OI for DGAT2 vs
Saline/HFD, ControllHFD and DGATI, p<0.05) strongly suggesting that the reduced
weight gain in the DGA T2 ASO group was metabolic and not secondary to reduced
appetite.
Further evidence for a metabolic cause of reduced weight gain in the DGAT 2
treabnent group was provided by specific study of intestinal fat absorption by SBp29,
This ex.periment revealed no difference in fat absorption between rats treated with the
DGA T2 ASO and controls.
Reduction 0/ DGAT2 Gene Expression Reduced Hepatic Triglyceride Content and
Improved Plasma Lipid Levels.
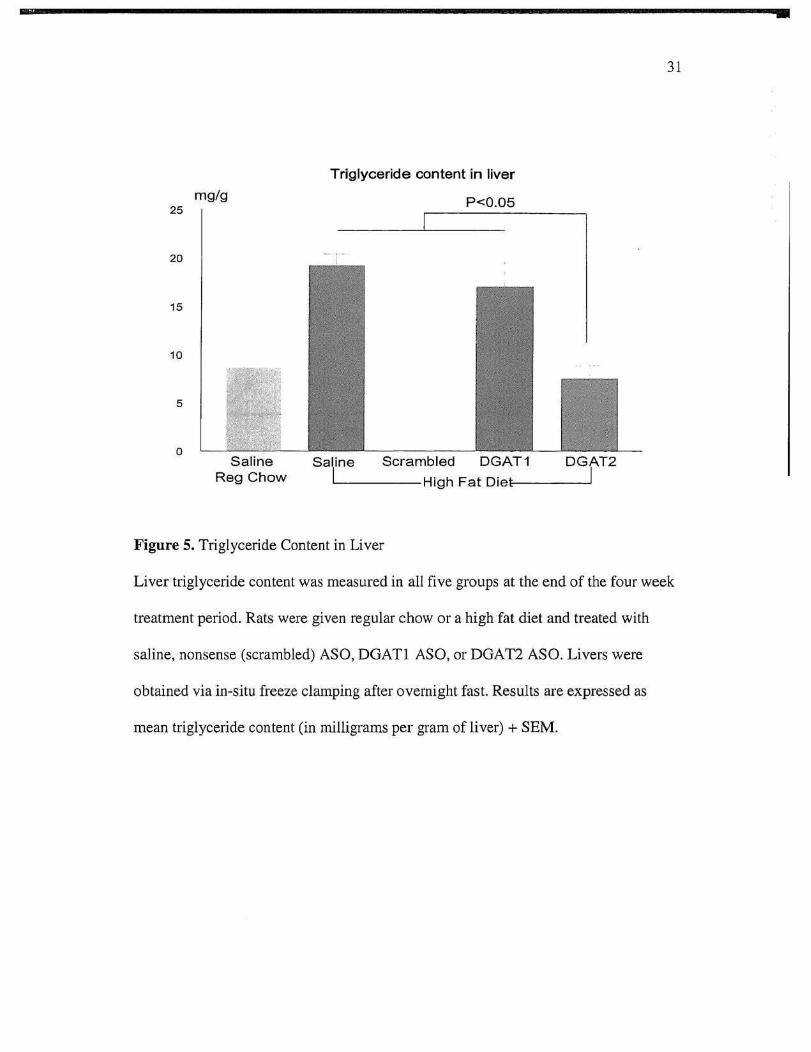
Histologic examination (Figure 4) and analysis of liver triglyceride content (9.2±1.1
vs. 20.1±1.5, 15.9 ±1.4 and 17.0±2.4 mglg wet liver for DGAT2 vs Saline/HFD,
ControllHFD and DGATI; p<O.OS) demonstrated significant improvement in hepatic
steatosis in DGA T2 ASO treated rats when compared to controls (Figure 5): There
was, however, no significant change in muscle triglyceride content. DGAT2
treatment also improved blood lipid levels, with plasma triglyceride levels 25% lower
than scrambled ASO controls (26.2 ± 1.1 vs 35.2±2.4 mgldl in scrambled; p<O.OI).

17
Reduction of DGAT2 Gene Expression Improved Hepatic and Peripheral Insulin
Sensitivities.
The impact of treatment with the DGAT ASO on peripheral and hepatic insulin action
was examined with 135 min hyperinsulinemic euglycemic clamps in male SD rats
following 4 weeks of treatment with antisense oligonucleotides. Overnight fasted
plasma glucose concentrations did not differ among the groups. During the clamp,
the plasma insulin concentration was elevated to approximately 600pM, while the
plasma glucose concentration was clamped at approximately 5.6 roM in all groups.
The glucose infusion rate (GINF) required to maintain eugJycemia achieved steady
state within 90 min and as a result, all insulin sensitivity indices were calculated after
this point. DGAT2 treatment increased whole body insulin response, as reflected by a
significantly higher GINF (24.0±0.9 vs. 16.7±1.2, 11.7 ±1.0, 14.0±0.9 and !3. 1±1.7
mglkg'min far DGA T2 vs SalineIRC, SalineIHFD, CantrollHFD and DGA T1;
p<0.05) (Figure 6A).
To discern the individual contributions of liver and peripheral tissue to increased
insulin response, insulin action on liver and peripheral tissue were measured
separately using radioisotope labeled glucose infused during the clamp. While basal
hepatic glucose production was similar in all groups, insulin stimulated suppression
of hepatic glucose production, a marker of hepatic insulin sensitivity. was
significantly increased in the DGAT2 treatment group when compared to controls
(82.1± 5.5 vs. 48.5± 1.5, 50.4 ±9.5 and 47.5±9.2 % for DGAT2 vs SalinelHFD,
CantrollHFD and DGA T1; p<0.05) (Figure 6B).

18
Moreover, DGA T2 ASO treatment increased insulin stimulated whole body glucose
uptake and glycogen synthesis rates by47% and 71 % when compared to controls
(Figure 6C). This increase in insulin stimulated glucose uptake was predominantly
accounted for by a 35% and 230% increase in insulin stimulated glucose uptake in
skeletal muscle (Figure 6D) and white adipose tissue (Figure 6E), suggesting a
significant improvement in peripheral insulin sensitivity.
The DGAT2 ASO treatment group also demonstrated significantly lower free fatty
acid (FFA) levels during the clamp period as well as a 64% reduction ofFFA under
insulin stimulation (Figure 7), implying an improvement in insulin sensitivity towards
suppression oflipolysis from adipose tissue as well.
Of note, DGATI suppression did not result in any improvement in hepatic or
peripheral insulin sensitivity.
Reduction of DGAT2 Reduced Intracellular Levels of Diacylglycerol
Levels of diacylglycerol and long chain acyl CoA were examined in the hepatocytes
of rats treated with either scrambled or DGA T2 ASOs for four weeks under high fat
feeding conditions. Although there was no significant difference in long chain acyl
eoAs between the two groups(80.2+8.6 vs 82.8+13.3), diacylglycerol levels were
significantly lower in the DGAT2 deficient animals (925 + 102 vs 470 + 84, p=0.006)
(Fignre 8).

19
DISCUSSION
This study demonstrated that liver and adipose tissue specific inhibition of DGA T2
via ASO results in reduced weight gain, less hepatic steatosis and improved hepatic
and peripheral insulin sensitivity in rats fed a high fat diet. Previous studies
examining the effects of DGA T2 deficiency used a whole body knockout model,
which resulted in severe lipopenia, excessively thin skin and early neonatal death
secondary to dehydration IS • Because the ASO in this study specifically targeted liver
and adipose tissue l9, there was no lipopenia in the peripheral tissue or epidermis and
thus no peripheral toxicity occurred from DGA T2 deficiency. In addition, the results
of this study showed no differences in intestinal fat absorption or food consumption
in DGATI deficient animals versus controls, and no hepatotoxicity secondary to
treatment. This strongly supports the idea that the mechanisms behind the
improvements in weight, hepatic fat, and insulin sensitivity are metabolic.
Interestingly, despite the liver and adipose specific effect of the ASO, this study did
demonstrate some improvement in peripheral insulin resistance, specifically in
skeletal muscle. There are several potential explanations for this phenomenon,
including an improvement in the general metabolic state of treated animals or a
previously unknown muscle specific effect of the ASO. Specific examination of the
fatty acid metabolites in muscle is currently being done to determine the causes of
this interesting occurrence.
In another important finding in the current study, liver and adipose specific deficiency
ofDGATl did not result in any improvement in insulin sensitivity or hepatic steatosis.
This is in stark contrast to previous studies involving whole body deficiency of

DGATl , which resulted in a significantly improved insulin sensitivity profile I6.17
.
Other studies have demonstrated increased activity in mice deficient in DGA Tl 30,
likely due to an effect ofDGATI deficiency in the central nervous system. As this
study has shown no protection from insulin resistance in rats with a liver specific
deficiency in DGATl, the improvement in insulin sensitivity demonstrated in
previous studies is probably due to weight loss secondary to increased activity.
20
The important role ofDGAT2 in hepatic triglyceride synthesis and the pathogenesis
of insulin resistance has been explored in this study. It is well known that under high
fat feeding conditions, the triglyceride synthesis pathway is activated, and the enzyme
activities of the metabolic intermediates, including DGAT, are increased. In rats
treated with the DGA T2 ASO, the final step--acylatlon of diacylglycerol to fonn
triacylglycerol-cannot be completed, and thus triglyceride accumulation is
prevented, As several studies have linked the accumulation oftriglycerides in liver
with the pathogenesis of insulin resistance20•31
, it can be suggested that the
improvement in insulin sensitivity demonstrated in this study is likely linked to the
reduction in hepatic triglyceride content also observed.
Complicating this hypothesis, however, is the assumed byproduct of reduced DGAT2
activity-the accumulation of diacylgycerol or another intermediate product of
triglyceride synthesis (Figure 1). Previous studies have linked the accumulation of
these metabolities, especially diacylglycerol, to insulin resistance32, It has been
shown that diacylglycerol activates several PKC isomers, which in tum induces
serine/threonine phosporylation of the insulin receptor. This blocks tyrosi ne kinase
activity on the insulin rec~tor, which induces insulin resistance!o.2o.

21
Interestingly, analysis ofhepatocytes in the rats in the current study revealed no
increased accumulation of diacylglycerol or Acyl eoA species (Figure 8). This data,
while resolving the conflict with previous data, suggests that an alternate metabolic
pathway is activated in these rats to reduce fatty metabolite accumulation. In-vitro
data in Tat hepatocytes treated with the DGA 1'2 ASO suggests a shift in the primary
function of the cell from lipid synthesis to fatty acid oxidation33 (Figure 9). In other
models involving specific deficiency of the mediators of lipid synthesis, similar data
has been found. Knockout of Stearoyl-CoA desaturase, the rate limiting step in
monosaturated fatty acid synthesis, increases fatty acid oxidation, likely through a
pathway involving AMPK inactivation of Acetyl eoA carboxylase and downstream
effects on Malonyl eoA 34. Other models with increased fatty acid oxidation use
different intennediates, including peroxisome proliferators-activated receptor
(PPARa.) and SREBPlc. The specific mediators involved in the DGAT2 deficient
model are as yet undetennined. However, the use of the antisense o ligonucleotide
may provide the tools necessary to identify the key pathways utilized in this process.
In summary, rats with phannacologicaUy induced deficiency in DGAT2 have less
hepatic steatosis and are protected from insulin resistance under high fat feeding
condi tions. In addition, our results suggest that the deficiency in DGA T2 shifts the
primary pathway oflipid in the liver from synthesis to oxidation. Use of the antisense
oligonucleotide in this study has provided the unique opportunity to study the
metabolic role ofDGAT2 in the liver and adipose tissue separate from developmental
effects associated with the whole-body knockout model. Equally important) however,

is the potential for DGA T2 as a potential therapeutic target for reduction of hepatic
steatosis and insulin resistance in type 2 diabetes.
22

23
CITATIONS
1) www.diabetes.orgtinfo/diabetesinfo.jsp
2) LiIlioja S, Mott DM, Howard BY, Bennett PH, Yki-Jarvinen H, Freymond D, Nyornba BL, Zurlo F, Swinbum B. Bogardus C. Impaired glucose tolerance as a disorder ofinsu!in action. Longitudinal and cross-sectional studies in Pima Indians. N Engl J Med.1988 May 12;3 18(19): 1217-25.
3) Lillioja S, Mott DM, Spraul M, Ferraro R, Foley JE, Ravussin E, Knowler we, Bennett PH, Bogardus C. Insulin resistance and insulin secretory dysfunction as precursors of non-insulin-dependent diabetes mellitus. Prospective studies of Pima Indians. N Engl J Med. 1993 Dec 30;329(27): 1988-92.
4) DeFronzo, RA. Pathogenesis of type 2 (non-insulin dependent) diabetes mell itus: a balanced overview. Diabetologia. 1992 Apr;35(4):389-97.
5) Shulman GI. Cellular Mechanisms of Insulin Resistance. J Clin Invest. 2000. 106,171-176.
6) Pan DA, LiIlioja S, Kriketos AD, Milner MR, Baur LA, Bogardus C, Jenkins AB, et al. Skeletal muscle triglyceride levels are inversely related to insulin action. Diabetes 1997; 46: 1768-1774 .
7) Krssak, M. Falk Petersen, K. Dresner, A. DiPietro. L. Vogel. S.M. Rothman. D.L. Roden, M. and Shulman OJ. Intramyocellular Lipid Concentrations are correlated with Insulin Sensitivity in Humans: A lH NMR Spectroscopic Study. Diabetologia. 1999. 42, 113-116.
8) Perseghin G, Scifo P, De Cobelli F, Pagliato E, Battezzati A, Arcelloni C, Vanzulli A, Testolin G, Pozza G, Del Maschio A, Luzi L. Intramyocellular triglyceride content is a detenninant of in vivo insulin resistance in humans: a IHM 13C nuclear magnetic resonance spectroscopy assessment in offspring of type 2 diabetic parents. Diabetes. 1999 Aug;48(8): 1600-6.
9) Kim JK, Michael MD, Previs SF, Peroni OD, MauvaisM larvis F, Neschen S, Kahn BB, Kahn CR, Shulman GJ. Redistribution of substrates to adipose tissue promotes obesity in mice with selective insulin resistance in muscle. 1 Clin Invest. 2000 Jun;1 05(12): 1791 -7.
10) Yu C, Chen Y, Cline CW, Zhang D, Zong H, Wang Y, Bergeron R, Jim JK, CUshman SW, Cooney GJ, Atcheson B, White MF, Kraegan EW, and Shulman Of. Mechanism by which fatty acids inhibit insul in activation of insulin receptor substrate-l (IRSM 1 )-associated phosphatidylinositoi 3Mkinase activity in muscle. J Bioi Chern. 2002. 277; 50230-50236.
11) Itani SI, Ruderman NB, Sclunieder F, Boden G. Lipid-induced insulin resistance in human muscle is associated with changes in diacylglycerol, protein kinase C, and IkappaB-alpha. Diabetes. 2002 Jul;51 (7):2005-1 I.
24
12) Yuan M, Konstantopoulos N, Lee J, Hansen L, Li ZW, Karin M, Shoelson SE. Reversal of obesity- and diet-induced insulin resistance with salicylates or targeted disruption oflkkbeta. Science. 2001 Aug 31 ;293(5535): 1673-7. Erratum in: Science 2002 Jan 11 ;295(5553):277.
13) Hotamisligil OS, Peraldi P, Budavari A, Ellis R, White MF, Spiegelman BM. IRS-I-mediated inhibition of insulin receptor tyrosine kinase activity in TNFalpha- and obesity-induced insulin resistance. Science. 1996 Feb 2 ;271(5249):665-8.
14) Shulman OJ. Unraveling the cellular mechanism of insulin resistance in humans: new insights from magnetic resonance spectroscopy. Physiology (Bethesda). 2004 Aug; 19: I 83-90.
15) Cases S, Smith SJ, Zheng YW, Myers HM, Lear SR, Sande E, Novak S, et. a!. Identification ofa gene encoding an acyl COA:diacylglycerol acyltransferase, a key enzyme in triacylglycerol synthesis. Proc Natl Acd Sci USA 1998; 95:12018-13023.
16) Smith SJ, Cases S, Jensen DR, Chen HC, Sande E, Tow B, Sanan DA, et a!. Obesity resistance and multiple mechanisms of triglyceride synthesis in mice lacking DGAT. Nat Genet 2000;25:87-90.
17) Chen, He, Smith SJ, Ladha Z, Jensen DR, Ferreira LD, Pulawa LK, McGuire JG, et. al. Increased Insulin and Leptin sensitivity in mice lacking acyl CoA:diacylglycerol acyltransferase 1. J Clin Invest 2002; 109:1049-1055.
18) Stone SJ, Myers HM, Watkins SM, Brown BE, Feingold KR, Elias PM, and Farese RV Jr. Lipopenia and skin barrier abnormalities in DGAT2-deficient mice. J BioI Chern. 2004. 279;11767-11776.
19) Dean NM, Butler M, Monia BP, tvianoharan M: Pharmacology of2' -0-(2-methyloxy)ethyl-modified antisense oligonucleotide. In: Crooke ST, ed. Antisense Drug Teclmology: Principles, Strategies and Applications. New York, NY: Dekker 2001; 319-338.
20) Samuel VT, Liu ZX, Qu X, Elder BD, Bilz S, Befroy D, Romanelli AJ, and Shulman 01. Mechanism of hepatic insulin resistance in non-alcoholic fatty liver disease. J Bioi Chern. 2004. 279, 32345-32353.

25
21) Baker BF, Condon TP, Koller E, McKay RA, Siwkowski AM, Vickers TA, Mania BP. Discovery and analysis of antisense oligonucleotide activity in cell culture. Methods. 2001 Feb;23(2):191-8.
22) McKay RA. Miraglia W. Cummins LL. Owens SR. Sasmor H. Dean NM. Characterization of a potent and specific class of antisense oligonucleotide inhibitor of human protein kinase C-alpha expression. lournal of Biological Chemistry. January 1999. 274(3): 1715-22.
23) Youn JH, Buchanan TA, Fasting does not impair insulin-stimulated glucose uptake but alters intracellular glucose metabolism in conscious rats . Diabetes. 1993 May;42(5):757-63.
24) Rossetti L, Giaccari A Relative contribution of glycogen synthesis and glycolysis to insulin-mediated glucose uptake. A dose-response euglycemic clamp study in normal and diabetic rats. J Clin Invest. 1990 Jun;85(6): 1785-92.
25) Oshima K, Shargill NS, Chan TM, and Bray GA. Adrenalectomy reverses insulin resistance in muscle from obese (ob/ob) mice. Am I Physio!. 246, EI93-EI97.
26) Bligh EG, Dyer WI. A rapid method of total lipid extraction and purification. Can J Biochem Physiol. 1959 Aug;37(8):911-7.
27) Neschen S, Moore I, Regittnig W, Yu CL, Wang Y, Pypaert M, Petersen KF, Shulman G1. Contrasting effects of fish oil and safflower oil on hepatic peroxisomal and tissue lipid content. Am J Physiol. Endocrinol Metab. 2002. 282;E395-E401.
28) Yu XX, Drackley IK, Odie J. Rates of mitochondrial and peroxisomal betaoxidation of palmitate change during postnatal development and food deprivation in liver, kidney, and heart of pigs. J Nutr 1997; 127: 181 4-182 J.
29) Iandacek RJ, Heubi IE, and Tso P. A novel, noninvasive method for the measurement of intestinal fat absorption. Gastroenterology. 2004.127;139-144.
30) Smith SJ, Cases S, Jensen DR, Chen HC, Sande E, Tow B, Sanan DA, et a!. Obesity resistance and mUltiple mechanisms of triglyceride synthesis in mice lacking DGAT. Nat Genet 2000;25:87-90.
31) Griffen ME, Marcucci MJ, Cline GW, Bell K, Barucci N, Lee D, Goodyear LJ< Kraegen EW, White MF, and Shulman GI. Free fatty acid-induced insulin resistance is associated with activation of protein kinase C theta and alterations in the insulin signaling cascade. Diabetes. 1999.48; 1270-1274.

26
32) Neschen S, Morino K, Hammond LE, Zhang D, Liu ZX, Romanelli AI, Cline OW, Pongratz RL, Zhang XM, Choi CS, Coleman RA, Shulman 01. Prevention of hepatic steatosis and hepatic insulin resistance in mitochondrial acyl-CoA:glycerol -sn-3-phosphate acyltransferase 1 knockout mice. Cell Metab. 2005 1ul;2(1):55-65.
33) Yu XX, Murray SF, Pandey SK, Booten SL, Bao D, Song XZ, Kelly S, Chen S, McKay R, Monia BP, Bhanot S. Antisense oligonucleotide reduction of DGA T2 expression improves hepatic steatosis and hyperlipidemia in obese mice. Hepatology. 2005 Aug;42(2):362-71.
34) Dobrzyn P, Dobryzn A, Miyazaki M, Cohen P, Asilmaz E, Hardie DO, Friedman JM, and Ntambi 1M. Stearoyl-CoA desaturase 1 deficiency increases fatty acid oxidation by activating AMP-activated protein kinase in liver. PNAS 2004.101 ;6409-6414.
35) Savage DB, Petersen KF, Shulman 01. Mechanisms of insulin resistance in humans and possible links with Inflammation. Hypertension. 2005 May; 45(5):828-33.
27
FIGURES
-~:~ l~~ "'->~".". FFA 1 j ~SOPhOSPh.tid.,e ~-~ I
acyl-CoA - Phosphatidnte
~ I ~iaCYlgIYCe"O I
!flaiy'lnltI!.,
) ""'--------------_/
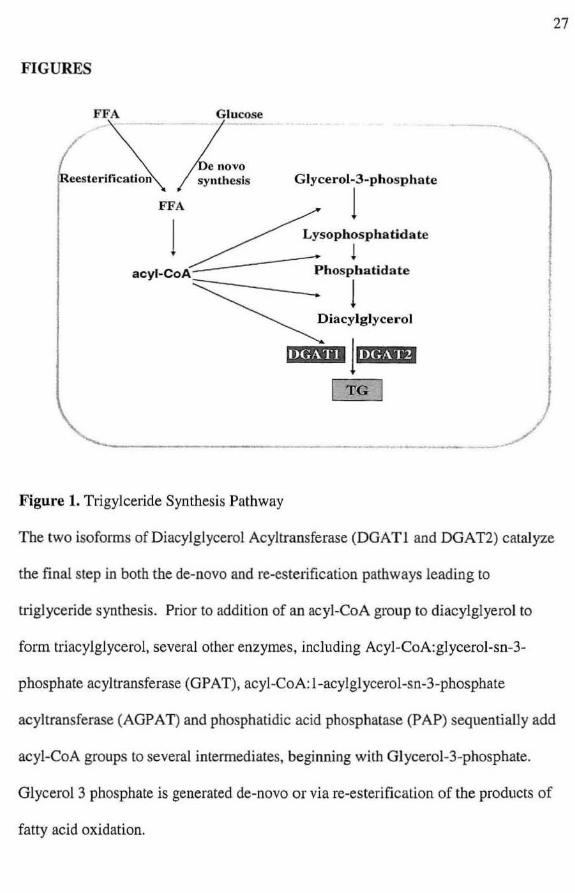
F igure t . TrigyJceride Synthesis Pathway
The two isoforms of DiacyJglycerol Acyltransferase (DGATI and DGAT2) catalyze
the final step in both the de-novo and fe-esterification pathways leading (0
triglyceride synthesis. Prior to addition of an acyl-CoA group to diacylglyerol to
form triacylglycerol, several other enzymes, including Acyl-CoA:gJycerol-sn-3-
phosphate acyl transferase (GPAT), acyl-CoA: l-acylglycerol-sn-3-phosphate
acyltransferase (AGPAT) and phosphatidic acid phosphatase (PAP) sequentially add
acyl-CoA groups to several intermediates, beginning with Glycerol-3-phosphate.
Glycerol 3 phosphate is generated de-novo or via fe-esterificalion of the products of
fatty acid oxidation.
28
DGAT 1 & 2 Gene Expression in Liver
DGAT1 Gene Bcpressiorl OGAT2 gme Exp e:ssior.
~
.~
l ~
1!1 "-..
70 .... w !! 04'11. I .. (!)
~
SCR OGAT1 OGAT2 SCR OGAT1 OGAT2
Figure 2. DGATI and DGAT2 Gene expression after ASO treatment
WT animals were treated with a nonsense (scrambled). DGATl, or DGAT2 ASO for
four weeks while on a high-fat die. (SCR",scrambJed ASO, DGATI =DGA TI ASO
Treatment, DGAT2=DGAT2 ASO Treatment). Baseline values of gene expression
were measured in a separate group prior to treatment. Gene expression was measured
in rats receiving four weeks of treatment. Livers were collected under fasti ng
conditions using an in-situ freeze-clamp technique. Values expressed as percent
suppression from baseline + SEM.
29
Body weig ht gain Food consumption
• SIRe SIHFD 450 • SfHFO
SCR 600 SCR
I • • 400 • DGAT1 DGAT1 • ~
~ DGAT2 • ,9500 • E3 • • ~ DGAT2
• E 350 ~400 • • • C> • .~
I • ~ 300 •
i 300 9 200
• • • I "§ I
250 • LL 100 • , 200 0
0 5 10 15 20 25 30 0 5 10 15 20 25 30
Feeding days Feeding days
Figu re 3. Body Weight Gain and Food Consumption during treatment period.
Body weight and food consumption was measured biweekly immediately prior to
treatment in all treatment groups-Saline treatment on regu lar chow (SIRe), Saline
treatment on high fat diet (SIHFD), Scrambled ASO treatment on high fat diet (SeR),
DGATI ASO treatment on high fat diet (DGATl), and DGA 1'2 ASO treatment on
high fat diet (DGA T2)-over the four week treatment period. Results are expressed
III grams.

• • • • • • • . .
• • • , , • • • . . . - • • . .
• •• • . ' .. • . • •
SalinelRegular Chow
Figure 4. Histologic Analysis of Hepatocytes
• » ~ . , ' . ~ ...... '-. - ..... ~. ~: .• ~ . •• ~ ... : • ,. •• '. .... ..... . .. .... 1/" "-. '.~ ... '. 1. ... ". ,~ •• '.,c, , t· • •. , .... '''-:,!l .. ' ,,-" ....... ; . " . ... .. ..- . ~ . . ~ "". '-;.- -.. : ... ,~~ • . - :L.,..; .. ~ ~ ~ .... ; ..
- . .., # .. ' !AF ___ • • ~ •• ' . :.;. ... . ' ... . ........ ....,.,.. .• JI" .. , .' • : • .: ..... ~ ,. . ;" .. .., t.·· ... ., ' ... ~·~~/ .. ,
• T".'-:: - iro.~ ...... ;. •.. :_~,;. ~ .)I,-'" ~' '' · ·i . .. . . '. ~ • ••.• ~. " "",,. . -• ., e'. '( ",",,- .:'to ~ ~ •• :."' _~ ••.• • ; .~'''-- ' • _'1.~··_!.·'4) ..- ... ~·f 'J · .. · ... ·It
' ;II • . ..: '-.i";.' , oI!. .~ .. _ • '.~ •• i~'~"'t •. ~. "";C--~···~"·lr"'\·t,:,. · .. , . •• -1-,'''' . , .0: ~,.t6 •• • . ' .. -' ,II ... '. ' . .. . ~ oi·':Li ' ·:"4- . .0: . ~.;. • -~ •• ,," ,,:,~ '_ , _~~r·:-~ ~ .. ,. . ... '- ... . .
Saline/High Fat Dret
. .... _ .. v ... . ' .. . ' • :" ,. «_ ... . ;. •.. _ ... . ~ ..... ,.. ' ", .. - .. " ';' ' '':.: .--.. -. .". . ..... , " . ' ,"( ... " y '.;:p. ' ". ~ •• '.'; .. . .. .. · " ',~ . ' '''''l'_';: . ~':. , .~ , ..
'1" , t. ~ ... • :I'.¥ . ', ",' , ....... ," .... , - . .... .. '. . ;- ... ·to · '. ~ ;' '." . , - •• '!: •• : • ~ ~'.~~ .. "" ' ;' ... :4": . ..... .... . '.' , ... " ••• . ... ..l;,"J •• •
.," ~.011' " ..... .,..' . ' • .• . ··~. · ~::··:~Z .. ,·:· . .,., .::":' ~ ' . '.:." : . •• • ;0\". . ,.""' ,-..... .~;,. -. ...... . . " , . : "~S .... . ... " •• , .•.• !o . 'lit:, .; ~ : , .".' ~ "':: -•• ~ •• ' .'.:- =.:::. .~ • • ' _.:-.'
•
DGAT 2 ASOI High Fat Dlat
30
Representative histology of rat hepatocytes after four weeks of either Saline treatment
on regular chow, Saline treatment on a high fat diet, Scrambled ASO treatment on a
high fat diet, or DGA 1'2 ASO treatment on a high fat diet.

25
20
15
10
5
o
mg/g
Saline Reg Chow
Triglyceride content in liver
P<O.05
Scrambled OGAT1 DGAT2
H;gh Fat 0 ;011------'1
Figure 5. Triglyceride Content in Liver
3 1
Liver triglyceride content was measured in all five groups at the end of the four week
treatment period. Rats were given regular chow or a high fat diet and treated with
saline, nonsense (scrambled) ASO, DGATI ASO, or DGAT2 ASO. Livers were
obtained via in-situ freeze clamping after overnight fast. Results are expressed as
mean triglyceride content (in milligrams per gram of liver) + SEM.
• 31
Triglyceride content in liver
mg/g P<O.05 25
20
15
10
5
0 Saline saline Scrambled DGAT1 DGAT2
Reg Chow High Fat Diet I
Figure 5. Triglyceride Content in Liver
Liver triglyceride content was measured in all five groups at the end of the four week
treatment period. Rats were given regu lar chow or a high fat diet and treated with
saline, nonsense (scrambled) ASO, DGATI ASO, or DGATI ASO. Livers were
obtained via in-situ freeze clamping after overnight fast. Results are expressed as
mean triglyceride content (in milligrams per gram of liver) + SEM.

25
'2 20 ·E ~ 15 E ;;:- 1 0 z (!)
5
o
32
6A: Glucose Infusion Rate (GINF) durtng clamp perted
---+--+-
• ••
20
SIRe S/H FD
SCR
DGAT1 DGAT2
T T •
T ~.
• • • • * p<O.05 , . - ..
.-T __ ~. - - -T T T T T T T T T
T . '- T
40 60 80 100 120 140 Time (min)
68: Insulin Mediated Suppression of Hepatic Glucose Production
o
Regular Chow I
% suppression
,---High Fat Diet----,
• P<0.05

•
SA: Glucose Infusion Rate (GINF) during clamp period
--25 .+.
• •
SlRC • • • SIHFD • • SCR • • • • OGAT1 • • • DGAT2 •
·r : r rll T r T -I • • •• ••• ~- ' TT '" • .!It - or - , . . ....-..- ......... --_ .-t. .. + ..... ,f....... ........ 4- .. ~ .. +
:-.... ---' . t ,"
of /
, , /
32
p<o.os
o.'~' -------------------------------------o 20 40 SO 80 100 120 140 Time (min)
68: Insulin Mediated Suppression of Hepatic Glucose Production
Regular Chow ,----High Fat Diet:- - --,
o~.!!!!1 !!L...~~!'@!!~~
• P<0 .05
% suppression

6e; Insulin Mediated Effect on Glucose Uptake, Glycolysis, Glycogen Synthesis
30 p<O.OO 1
25 '2' 'E 20
I 15
'" ~
10
{!l 5
0 Glucose uptake
6D: Glucose uptake: Soleus
p<O.05 mglkg/mln
~ I
" I ; " , ,.I ,.1 10 I , ,-
Saline Salina SeR DGAT1 DGAT2
Reg L ' Chow High Fat Diet ---.J
p<O.04
Glycolysis Glycogen synthesis
6E: Glucose uptake: Adipose
mglkglmln p<O.05 3.0 .
, .• ,., 1.a .
", 0.5 ~
,., I Saline Saline seR DGAT1 DGAT2
Reg L I Chow ~ High Fat Die t
Figure 6. Hyperinsulinemic-Euglycemic Clamp Experiments
Wild-type rats were separated in into five treatment groups: Saline treatment in rats
receiving regular chow (SIRe; 0""7), saline treatment in rats receiving a high fat diet
33
34
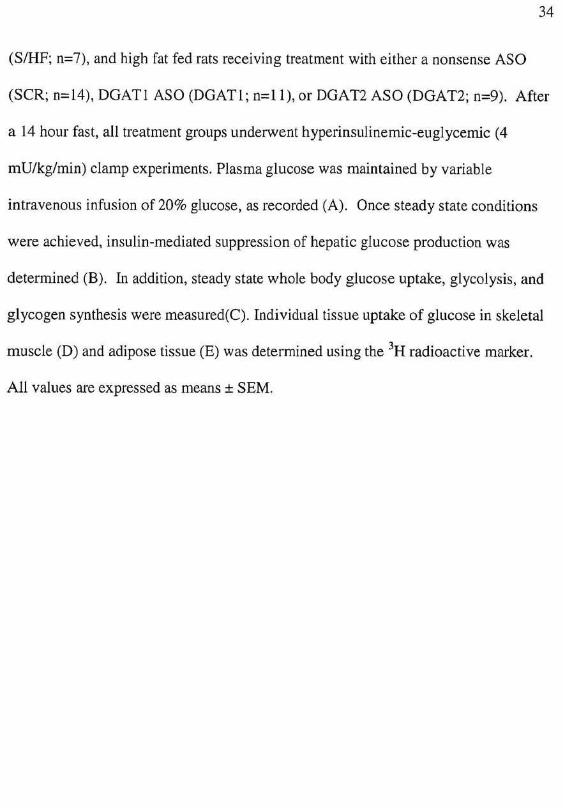
(S/HF; n= 7), and high fat fed rats receiving treatment with either a nonsense ASO
(SCR; n=14), DGATl ASO (DGATl; 0=11), or DGATl ASO (DGAT2; n=9). After
a 14 hour fast. all treatment groups underwent hyperinsulinemic-euglycemic (4
mU/kg/rnin ) clamp experiments. Plasma glucose was maintained by variable
intravenous infusion of 20% gl ucose, as recorded (A). Once steady stale conditions
were achieved, insulin-mediated suppression of hepatic glucose production was
determined (B). to addition, steady state whole body glucose uptake, glycolys is, and
glycogen synthesis were measured(C). [ndividual tissue uptake of glucose in skeletaJ
muscle CD) and adipose tissue eE) was determined using the 3H radioactive marker.
All values are expressed as means ± SEM.

35
Insulin Mediated Suppression of Plasma FFA
R Ch rr--HighFatDiet----.
egular ow
Saline Saline Scrambled OGAT1 DGAT2 o
P < 0.05
-1IXl
Figure 7. Insulin effect on plasma free fatty acid concentration.
In all fi ve experimental groups, after the treatment period and an overnight fast ,
plasma was drawn at baseline (time = 0) and again at 185 minutes after insulin
stimulation (during the hyperinsulinemic-euglycemic clamp) to measure insulin
stimulated suppression of plasma free fatty ac id concentration. Results are expressed
as mean percentage suppression + SEM.

•
36
lipid Metabolities in liver
Long Chain Acyl CoA Dlacylgtycet"ol
120 10
P < 0.05
- ,-
-;
Suambled DGAT2
),' oL-________ ~~~~L_ __ _
ScnJmbled DGAT2
20 2
Figure 8. Meas urement of lipid metaboli tes
After a 14 hour fast, Long chain acyl-CoA (A) and diacylglycerol (B) species were
extracted from the livers of rats from the nonsense and DGA T2 ASO treatment
groups. An API 3000 tandem mass spectrometer interfaced with a turbo ions pray
source in negative electrospray mode measured individual species. Values shown are
means+ SEM.

37
Gene expression TG synthesis Fat oxidation 60 p<O.05
p<O.05 50 - Olaate (!) "
p<O.05 <= I- 160
.12 B 30 .!l ~ .5 e 140 ~ 20 ,,- e_ <= ~ -0. 0 ~ 120 ><'" 80 Q) ~ 10
" <= o. m
,,0 ~e 0 -0 <= 0 ~~ Scrambled DGAT2 ' j;( 100 ,,- :La 0 ",0
~.€ 800 :'§80 N'" p<O.05 1-- 'Og700 m « 40 0
~ 60 ! (!) § "-600 + Oleate C ~~500 1 ~
" 40 5~"OO I >
'" e--300 .!!1 20 0
o , " o 200 1 0:: <= ' Scrambled DGAT2 100 ' O.
a Scrambled DGAT2 Scrambled DGAT2
Figure 9. Effect of DGATI ASO on triglyceride synthesis and fat oxidation in
cultured rat hepatocytes.
Rat hepatocytes were transfected with either a nonsense or DGA 1'2 ASO. Once it
was determined that gene expression was suppressed (A), trigy1ceride synthesis in
transfected rat bepatocytes was determined by measuring the incorporation of
radiolabeled glycerol in to triglycerides with and without oleate (B). a cmcial
compound for de novo synthesis. Fat oxidation was then measured (C). All values in
mean + SEM.

35
Insulin Mediated Suppression of Plasm a FFA
Regular Chow rl - -High Fat Olet----,
Saline Saline Scrambled DOAT1 DGAT2
P < 0. 05
-100
Figure 7. lnsulin effect on plasma free fatty acid concentration.
In all five experimental groups, after the treatment period and an overnight fast,
plasma was drawn at baseline (time = 0) and again at 185 minutes after insulin
stimulation (during the hyperinsulinemic-euglycemic clamp) to measure insulin
stimulated suppression of plasma free fatty acid concentration. Results are expressed
as mean percentage suppression + SEM.

35
Insulin Mediated SUppression of Plasma FFA
R egular Chow rl --High Fat Diet---,
Saline Saline Scrambled DGAT1 DGAT2 0
c
t ..., ~ u c 0 u -40
LE ... '5 ..., c 0
~ -80 ~ P < 0.05 '" 0:
tl -100
Figure 7. lnsulin effect on plasma free fatty acid concenLration.
In all five experimental groups, after the treatment period and an overnight fast,
plasma was drawn at baseline (time = 0) and again at 185 minutes after insulin
stim ulation (during the hyperinsulinemic-euglycemic clamp) to measure insulin
stimulated suppression of plasma free fatty acid concentration. Results are expressed
as mean percentage suppression + SEM.

lipid M etabolities In Liver
Long Chain Acyl CoA
00
60
40
20
o L---::-~~~ Suambted OGAT2
Figure 8. Measurement of lipid metabolites
OiacylgtyceJ"oI
10
P <0.05 •
DGAT2
After a 14 hour fast, Long chain acyl-eoA (A) and diacylglycerol (B) species were
extracted from the livers of rats from the nonsense and DGA 1'2 ASO treatment
groups. An API 3000 tandem mass spectrometer interfaced with a turbo ionspray
36
source in negative electrospray mode measured individual species. Values shown are
means + SEM.

37
Gene expression TG synthesis Fat oxidation 60 p<O.05
p<O.05 50 • Oleate
(!) " p<O.05
" I- 160
0 B 30 " ! 'in -~
.5 :1 e 140 ,,- " 0..15 g 120 )(.::: 80 , I__*_ .. ' " " .., , " 0 ')( 100 , "u Scrambled DGAT2 ., - 0 ",0
~ 80 N~ p<O.05 1- - .. « 40
+ Oleate ~60 (!) Cl ~
" 40 > '" .. 20 Q;
0 0:: Scrambled DGAT2 0 , Scrambled DGAT2
Scrambled DGAT2
Figure 9. Effect of DGA 1'2 ASO on triglyceride synthesis and fat oxidation in
cultured rat hepatocytes.
Rat hepatocytes were transfected with either a nonsense or DGATI ASO. Once it
was determined that gene expression was suppressed (A). trigylceride synthesis in
transfected rat hepatocytes was determined by measuring the incorporation of
radiolabeled glycerol into triglycerides with and without oleate (B). a crucial
compound for de novo synthesis. Fat oxidation was then measured (C). All values in
mean + SEM.

HARVEY CUSHING/JOHN HAY WHITNEY MEDICAL LIBRARY
MANUSCRIPT THESES
Unpublished theses submitted for the Master's and Doctor's degrees and deposited in the Medical Library are to be used only with due regard to the rights of the authors. Bibliographical references may be noted, but passages must not be copied without permission of the authors, and without proper credit being given in subsequent written or published work.
This thesis by has been used by the following person, whose signatures attest their acceptance of the above restrictions.
NAME AND ADDRESS DATE