supporting material, section a inputs for west coast, east ... · web viewnatural gas as a marine...
TRANSCRIPT
Natural Gas as a Marine Fuel: Environmental Tradeoffs and Market Potential
Heather Thomsona,†
James J. Corbett, Ph.D.a
James J. Winebrake, Ph.D.b
Supporting Material, Section A Inputs for West Coast, East Coast, and Norway Cases
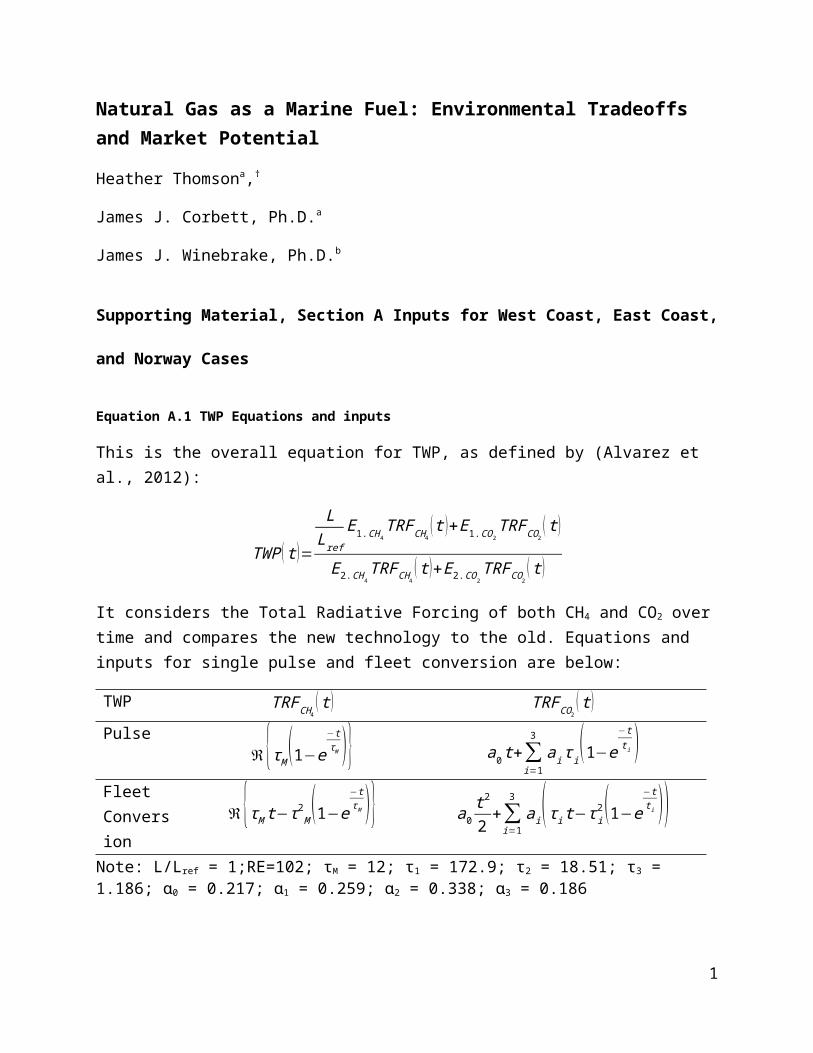
Equation A.1 TWP Equations and inputs
This is the overall equation for TWP, as defined by (Alvarez et al., 2012):
TWP ( t )=
LLref
E1.CH4TRFCH4
(t )+E1.CO2TRFCO2
( t )
E2.CH 4TRFCH4
( t )+E2.CO2TRFCO2
(t )
It considers the Total Radiative Forcing of both CH4 and CO2 over time and compares the new technology to the old. Equations and inputs for single pulse and fleet conversion are below:
TWP TRFCH 4( t ) TRFCO2
(t )
Pulseℜ{τM (1−e
−tτ M )} a0t+∑
i=1
3
ai τ i(1−e−tti )
Fleet Conversion ℜ{τM t−τ2
M(1−e
−tτM )} a0
t2
2+∑i=1
3
ai(τ i t−τ i2(1−e−tti ))
Note: L/Lref = 1;RE=102; τΜ = 12; τ1 = 172.9; τ2 = 18.51; τ3 = 1.186; ɑ0 = 0.217; ɑ1 = 0.259; ɑ2
= 0.338; ɑ3 = 0.186
1

Table A.1a Pathway Variables and Applicability to Ports for LNG – North American Cases
Ext
ract
ion
Met
hod
Liquefaction
Transportation from
Liquefaction Facility
Ports
Path
way
s
Con
vent
iona
l
Shal
e
Non
-Con
tinen
tal
Exi
stin
g Fa
cilit
y
End
of P
ipel
ine
Faci
lity
Tru
ck
Bar
ge
Reg
asifi
catio
n an
d Pi
pelin
e
Stor
age
(LA
) LA
/Lon
g B
each
(NY
) PA
NY
NJ
(J) J
acks
onvi
lle
1 ● ● ● ● ● ●2 ● ● ● ● ● ●3 ● ● ● ● ● ●4 ● ● ● ● ● ●5 ● ● ● ● ●6 ● ● ● ●7 ● ● ●8 ● ● ● ● ●9 ● ● ● ●10 ● ● ● ●11 ● ● ●12 ● ● ● ● ● ●13 ● ● ● ● ●14 ● ● ● ●15 ● ● ●16 ● ● ● ● ●17 ● ● ● ●18 ● ● ● ●19 ● ● ●
2

Table A.1b Pathway Variables and Applicability to Ports for LNG – European Cases
Fuel
Typ
e
Fuel
Sou
rce
Tra
nspo
rtat
ion
to L
ique
fact
ion
Faci
lity
Port
Path
way
s
Con
vent
iona
l
Shal
e
non-
Con
tinen
tal
Con
tinen
tal
Pipe
line
Tan
ker
Stor
age
(N) N
orw
ay
1 ● ● ● ● ●2 ● ● ● ●3 ● ● ● ● ●4 ● ● ● ●5 ● ● ● ● ●6 ● ● ● ●
Table A.2 Los Angeles/Long Beach facilities locations and GREET inputs
Trip Origin Trip Destination ModeDistance (miles)
Qatar (Exporting Nation)Ensenada, Baja California, Mexico (Import Terminal)
Ship 12,500
Elk Hills, CA (NG Field)Boron, CA (Liquefaction Facility)
Pipeline
137
Elk Hills, CA (NG Field)Long Beach, CA (End of Pipeline)
Pipeline
125
Boron, CA (Liquefaction Facility)
LA/LB, CA (Port) Truck 45
Ensenada, Baja California, Mexico (Import Terminal)
LA/LB, CA (Port) Truck 250
Ensenada, Baja California, Mexico (Import Terminal)
LA/LB, CA (Port) Barge 440
Ensenada, Baja California, Mexico (Import Terminal)
Boron CA (Liquefaction Facility)
Pipeline
275
3

Figure A.1 Depiction of various fuel pathways for the PANYNJ end of the East Coast Case showing transportation modes along the pathway network
Table A.3 PANYNJ facilities locations and GREET inputs
Trip Origin Trip Destination ModeDistance (miles)
Norway (Exporting Nation)
Cove Point, MD(Import Terminal)
Ship 4,200
Dimock, PA (NG Field)Bayonne, NJ(Liquefaction Facility)
Pipeline 205
Cove Point, MD(Import Terminal)
PANYNJ (Port) Truck 265
Cove Point, MD(Import Terminal)
PANYNJ (Port) Barge 380
Cove Point, MD(Import Terminal)
Bayonne, NJ(Liquefaction Facility)
Pipeline 310
4
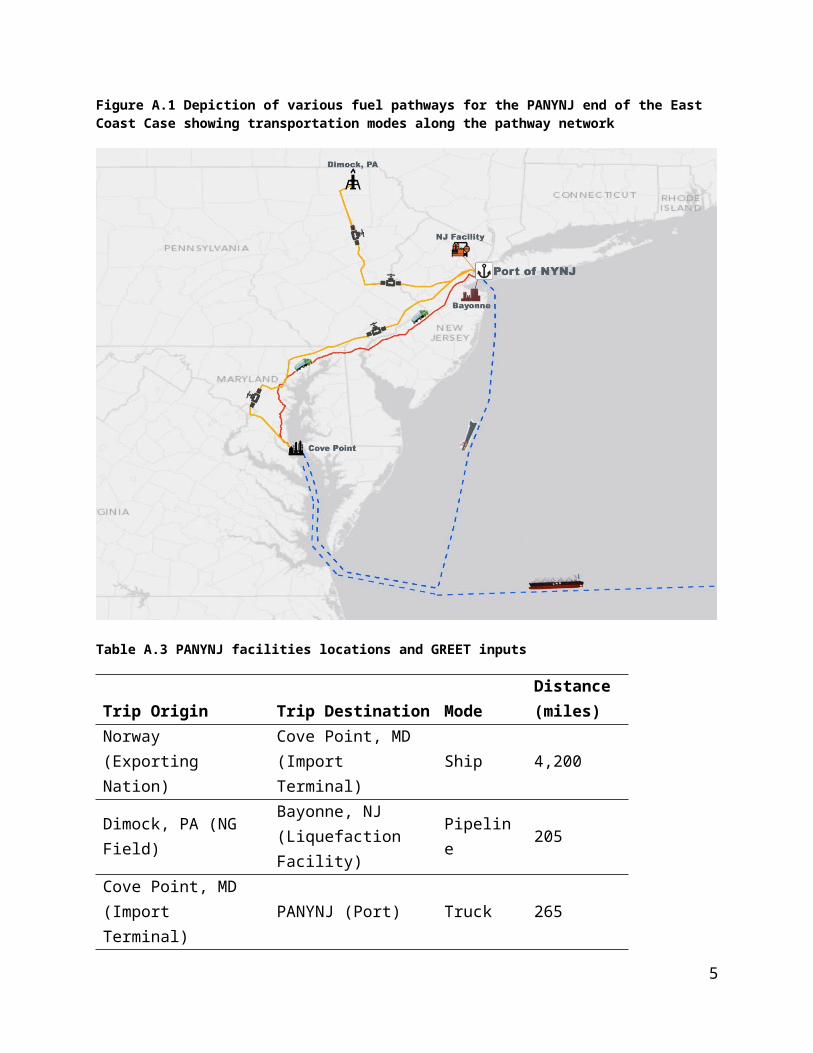
Figure A.2 Depiction of various fuel pathways for the Jacksonville end of the East Coast Case showing transportation modes along the pathway network
5

Table A.4 Jacksonville Facilities Locations and GREET Inputs
Trip Origin Trip Destination ModeDistance (miles)
Norway (Exporting Nation)Elba Island, GA(Import Terminal)
Ship 4,590
Oakwood, VA (NG Field)AGL Resources, Macon, GA (Liquefaction Facility)
Pipeline 565
Oakwood, VA (NG Field) Alma, GA (End of Pipeline) Pipeline 810AGL Resources, Macon, GA (Liquefaction Facility)
Jacksonville, FL (Port) Truck 285
Alma, GA (End of Pipeline) Jacksonville, FL (Port) Truck 120Elba Island, GA(Import Terminal)
Jacksonville, FL (Port) Truck 150
Elba Island, GA(Import Terminal)
Jacksonville, FL (Port) Barge 125
Elba Island, GA(Import Terminal)
AGL Resources, Macon, GA (Liquefaction Facility)
Pipeline 175
Figure A.3 Depiction of various fuel pathways showing transportation modes for Norway Case
6

Table A.5 GREET Inputs for Norway tug
Fuel Origin Fuel Destination ModeDistance (miles)
LNG
Norway (EU NG Field) Kårstø (Liquefaction Facility) Pipeline 250
Russia (non-EU NG Field) Kårstø (Liquefaction Facility) Pipeline 1,600
Libya (non-EU NG Field) Kårstø (Import Terminal) Tanker 3,000
7

Supporting Material, Section B GREET and TEAMS Model Input Values
Table B.1 Selected GREET default values and Norway updates
Leakage Rate Value Units
Conventional 69.847 g/mmBTU throughputShale 120.673 g/mmBTU throughput
NG Liquefaction Efficiency 91 %
Refining EfficiencyU.S Average 90.2 %EU Average
(Han et al., 2015) 91.5 %
Electricity Generation Emissions
SourceAverage U.S. Mix
Average Norway Mix(IEA, 2015)
Residual Oil 0.9% 0.03%Natural Gas 22.7% 1.8%
Coal 46.0% 0.1%Nuclear 20.3% 0.0%
Biomass 0.3% 0.2%Hydroelectric 6.6% 96.7%
Geothermal 0.4% 0.0%Wind 2.4% 1.1%
Solar PV 0.0% 0.0%Others 0.4% 0.2%
Emissions Factor g/mmBTU available at wall outlet NOx 235 4
PM10 59 2 SOx 499 3 CH4 317 9
N2O 3 0 CO2 182897 3165
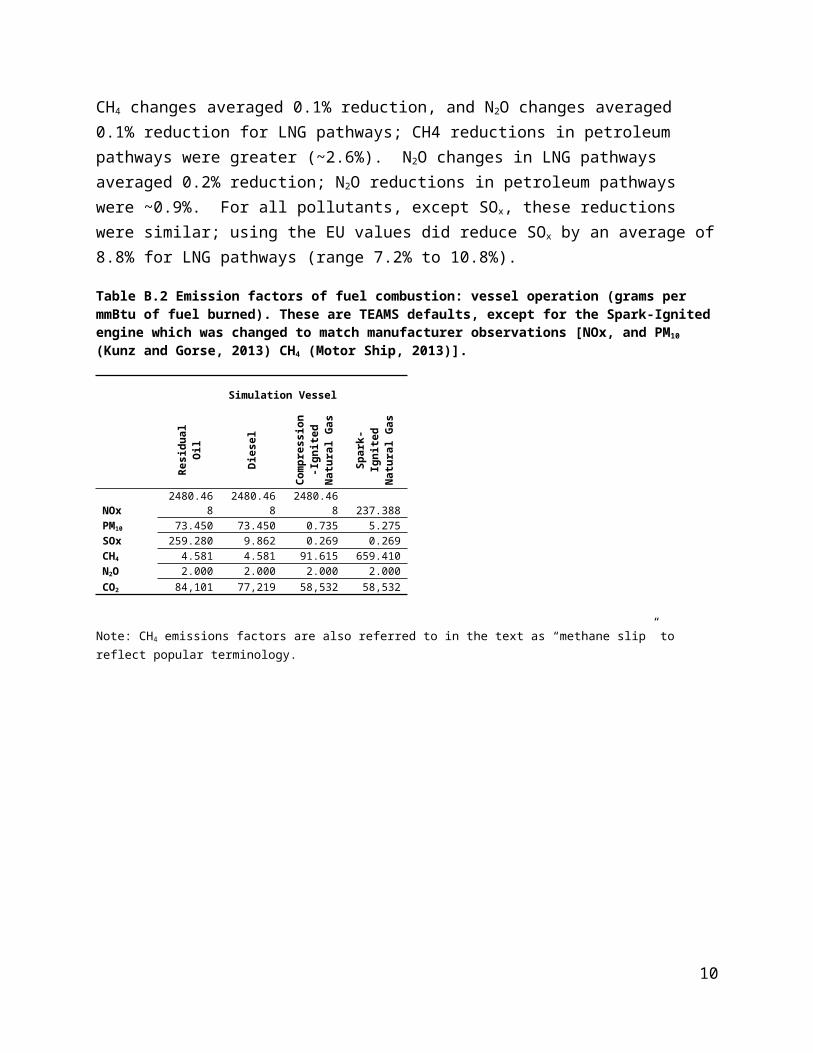
Utilizing the Norway/EU refining efficiencies and electricity mix reduced the CO2 values by ~1.1% in the petroleum pathways, and the LNG pathways reduced by an average 0.6% (range 0.5% to 0.7%). CH4 changes averaged 0.1% reduction, and N2O changes averaged 0.1% reduction for LNG pathways; CH4 reductions in petroleum pathways were greater (~2.6%). N2O changes in LNG pathways averaged 0.2% reduction; N2O reductions in petroleum pathways were ~0.9%. For all pollutants, except SOx, these reductions were similar; using the EU values did reduce SOx by an average of 8.8% for LNG pathways (range 7.2% to 10.8%).
8

Table B.2 Emission factors of fuel combustion: vessel operation (grams per mmBtu of fuel burned). These are TEAMS defaults, except for the Spark-Ignited engine which was changed to match manufacturer observations [NOx, and PM10 (Kunz and Gorse, 2013) CH4 (Motor Ship, 2013)].
Simulation VesselR
esid
ual O
il
Die
sel
Com
pres
sion
-Ig
nite
dN
atur
al G
as
Spar
k-Ig
nite
d N
atur
al G
as
NOx 2480.468 2480.468 2480.468 237.388PM10 73.450 73.450 0.735 5.275SOx 259.280 9.862 0.269 0.269CH4 4.581 4.581 91.615 659.410N2O 2.000 2.000 2.000 2.000CO2 84,101 77,219 58,532 58,532
Note: CH4 emissions factors are also referred to in the text as “methane slip” to reflect popular terminology.
9
Supporting Material, Section C Further Results for Each Case
Figure C.1 Ratio of NOx emissions for each pathway, normalized to low sulfur pathway in each case (NG = Natural Gas, LS = Low Sulfur Diesel, HS = High Sulfur Diesel, CI = Compression-Ignited Engine, SI = Spark Ignited Engine, Main = Main Engines, Auxiliary = Auxiliary Engines)
NOTE: Whiskers represent the range of results around the mathematical average of pathways in each case; they illustrate how various pathways would modify TFCA results for LNG upstream, in terms of overall results.
The term “Main” represents main engines, as opposed to auxiliary. In the East Coast Case, the NOx emissions are not higher than the WC emissions. Each case is normalized to the LS pathway, so in the East Coast the main engines are a slightly larger percentage of the overall case totals than in the West Coast. This is due to a difference in the rated power proportions allocated to main and auxiliary engines between the case vessels.
10

Figure C.2 Ratio of CO2 emissions for each pathway, normalized to low sulfur pathway in each case (NG = Natural Gas, LS = Low Sulfur Diesel, HS = High Sulfur Diesel, Main = Main Engines, Auxiliary = Auxiliary Engines)
NOTE: Whiskers represent the range of results around the mathematical average of pathways in each case; they illustrate how various pathways would modify TFCA results for LNG upstream, in terms of overall results.
High sulfur diesel has higher main engine emissions than low sulfur diesel because it has a different density, energy content, and wt %C than low sulfur fuels. For Norway, while it might appear that auxiliary engines have higher emissions than in the West Coast or East Coast cases, in fact the auxiliary engines contribute more than in the other cases because of the operations mode of the service tug – for example, the service vessel spends more time idling than the long-haul vessels.
11

Figure C.3 Ratio of GHG Emissions for each set of fuel pathways, normalized to the low sulfur pathway in each case (NG = Natural Gas, LS = Low Sulfur Diesel, HS = High Sulfur Diesel, CI = Compression-Ignited Engine, SI = Spark Ignited Engine, Main = Main Engines, Auxiliary = Auxiliary Engines); GWP CH4 = 34
NOTE: Whiskers represent the range of results around the mathematical average of pathways in each case; they illustrate how various pathways would modify TFCA results for LNG upstream, in terms of overall results.
12

Figure C. 4 Methane Emissions from selected West Coast Pathway showing sensitivity of increasing methane leakage rates by a factor of 1.75
13
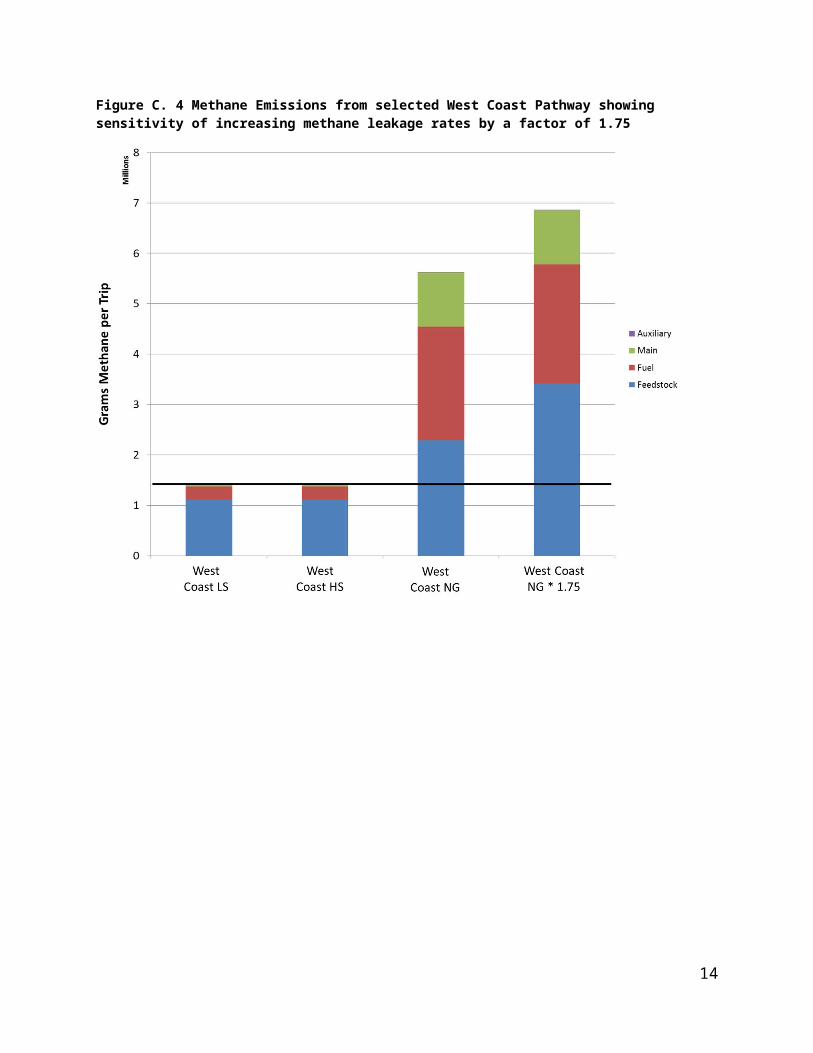
Figure C. 5 GHG Emissions from selected West Coast Pathway showing sensitivity of increasing methane leakage rates by a factor of 1.75
14

Figure C.6 Ratio of CH4 Emissions for each set of fuel pathways, normalized to the low sulfur pathway in each case (NG = Natural Gas, LS = Low Sulfur Diesel, HS = High Sulfur Diesel, CI = Compression-Ignited Engine, SI = Spark Ignited Engine, Main = Main Engines, Auxiliary = Auxiliary Engines)
NOTE: Whiskers represent the range of results around the mathematical average of pathways in each case; they illustrate how various pathways would modify TFCA results for LNG upstream, in terms of overall results.
15

Figure C.7 Ratio of components of GHG Emissions for each set of fuel pathways, normalized to the low sulfur pathway in each case (NG = Natural Gas, LS = Low Sulfur Diesel, HS = High Sulfur Diesel, CI = Compression-Ignited Engine, SI = Spark Ignited Engine); GWP CH4 = 34
NOTE: Whiskers represent the range of results around the mathematical average of pathways in each case; they illustrate how various pathways would modify TFCA results for LNG upstream, in terms of overall results.
16

Table C. 1 Calculations for GWP needed for GHG parity with the LS pathway
West Coast Pathway
GWP_parity
East Coast Pathway
GWP_parity
Norway Pathway
GWP_parity
LA1 75.94 NY1 113.33 N_SI1 16.8LA2 78.40 NY2 112.95 N_SI2 19.2LA3 65.01 NY3 94.07 N_SI3 27.2LA4 83.29 NY6 80.73 N_SI4 31.6LA5 137.19 NY7 130.20 N_SI5 26.6LA10 85.51 NY14 67.79 N_SI6 30.8LA11 141.65 NY15 100.09 SI Average 24.6LA12 69.56 J1 115.57 N_DI1 34.0LA13 104.11 J2 118.01 N_DI2 44.3LA18 71.30 J3 93.23 N_DI3 77.4LA19 107.08 J4 57.28 N_DI4 126.0WC Average 87.43 J5 84.53 N_DI5 73.7
J8 52.56 N_DI6 117.1J9 74.39 DI Average 66.3J12 49.42J13 68.80J16 45.93J17 62.03EC Average 84
17

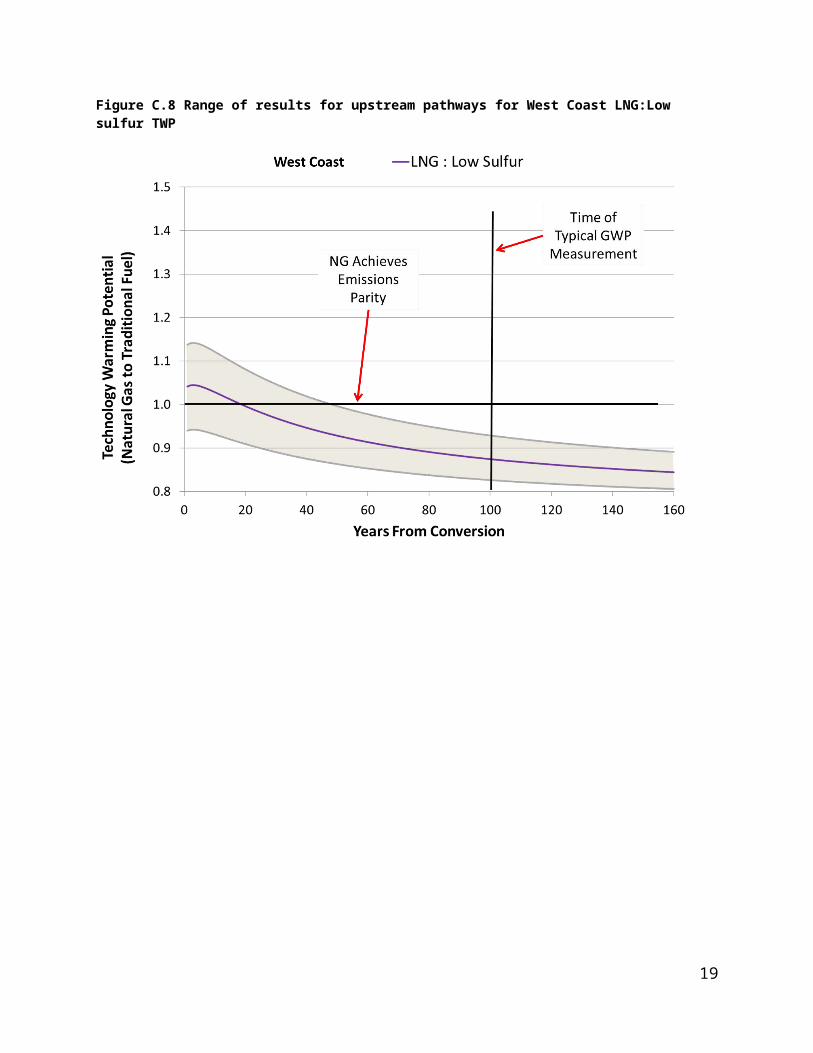
Figure C.8 Range of results for upstream pathways for West Coast LNG:Low sulfur TWP
18
Supporting Material, Section D Economic Data
Figure D.1 (a) Historical Natural Gas Price, IEA; (b) Net of Imports – Exports of Natural Gas
(a)
(b)
19
World Average

Table D.1 Details of NG Drivers
Driver
Region
Environmental Driver Social (Climate) Driver Infrastructure/Technology Driver Economic Price Driver Maritime Demand Driver
Emissions control regulation GHG policy activity Domestic natural gas consumption1 Natural Gas price1 Growth in major port
activity2
OECD America
Strong air emissions regulation, including shipping at federal and state scales.
Favors
Regional GHG mitigation policies, state level. EPA CO2 standards for power plants.
May inhibit
Longest natural gas consumption history. Since 1971, transport sector consumed ~4-5% of in-region natural gas. LNG engine design capacity.
Favors
Long-run prices about half of world average price since 1980, except for 2003-2007.
Favors
TEUs: ~3.3% average CAGR; Tons: ~1.2% average CAGR.
May favor
OECD Europe
Strong air emissions regulation, including shipping at EU and regional scales.
Favors
EU directives on GHG mitigation targets.
Inhibits
Increasing natural gas consumption 1971 to 1995; roughly constant demand since 1995. Less than 1% consumption in transport sector before 2006. LNG engine design leadership.
Favors
Long-run prices ~83-88% of world average to 2003; since 2004, prices similar.
Inhibits
TEUs: ~4.6% average CAGR; Tons: ~1.9% average CAGR.
May favor
Middle East
Limited regulatory action on domestic air emissions.
Inhibits
Very little policy activity to limit GHGs
Favors
Recent increase in domestic consumption; consumption since 2007 is 9-12% of world consumption, increasing from ~1% in 1980. Since 2007, initial transport sector consumption.
May favor
No IEA price statistics; regional demand for natural gas may be too recent.
Inhibits
TEUs: ~12.7% average CAGR;
Tons: no regional Top-100 ports in both 2002, 2012
Favors
China
Emerging air quality policies; voluntary ship emissions efforts, e.g., Hong Kong Fair Winds Charter.3
May favor
Very little policy activity to limit GHGs
Favors
Recent increase in domestic consumption. consumption since 2007 is 3-5% of world consumption, increasing from ~0.8% in 1980. Since 2007, initial transport sector consumption. Leading shipbuilding capacity.
May favor
No IEA price statistics; regional demand for natural gas may be too recent.
Inhibits
TEUs: ~16% average CAGR; Tons: ~10.2% average CAGR.
Favors
Asia excluding China
Some national land-based air emissions regulations; voluntary ship emissions efforts, e.g., Maritime Singapore Green Initiative.4
Inhibits
Limited policy activity to limit GHGs, except by small island states
Favors
Recent increase in domestic consumption. consumption since 2005 is ~5-6% of world consumption; up from ~1% in 1980. Since 2007, initial transport sector consumption. Strong shipbuilding capacity.
May favor
Since 2005, consumption is ~5-6% of world totals; up from ~1% in 1980.
May favor
TEUs: ~6.8% average CAGR across region’s major ports; Tons: ~5.6% average CAGR.
May favor
OECD Asia Oceania
Some national land-based air emissions regulations; voluntary ship emissions efforts, e.g., Maritime Singapore Green Initiative.4
Inhibits
Limited GHG policy activity, e.g., Clean energy act 2011 repealed in 2014.
Favors
Linear increase in domestic consumption since 1971, region is net importer. Limited transport sector consumption since 1980, ~2% since 2009.
Inhibits
Long-run prices greater than world, except in 2008.
Inhibits
TEUs: ~6.8% average CAGR across region’s major ports; Tons: ~2.7% average CAGR.
May favor
1. Consumption numbers and prices based on IEA data2. Regionwide average trade growth measured as CAGR from 2002-2012, based on both TEUs (TEU) and total cargo tonnage (tons)
20

3. Fair Winds Charter (Civic Exchange, 2011); Maritime Singapore Green Initiative (GreenPort, 2014)
21

Notes on Environmental Drivers: Where environmental standards are important, LNG development may be more favored for its lower emissions. In the U.S., strong emissions regulations address shipping at both federal and state levels; similarly, European regulation of shipping at EU and regional scales (e.g., Scandinavian nations) has been in place for years. China’s policies are catalyzed by the industry’s voluntary Fair Winds Charter (Hong Kong Civic Exchange, 2014).
Notes on Social Drivers: If LNG development decreases GHGs, it may be more favored where social policies involving alternative energy require greater certainty in GHG reductions. The potential for upstream pathway investment to minimize CH4 leakage and technology improvement of engine combustion to reduce methane slip may help achieve GHG-parity for LNG compared with marine fuels, and could favor LNG over HS marine residual fuel.
Notes on Infrastructure/Technology Drivers: Where infrastructure is already in place a transition to LNG will be easier, while energy policy may incentivize marine transport LNG where shipbuilding capacity can be matched with infrastructure investment as a catalyst for transition.
Notes on Price Drivers: The LNG pricing and consumption conditions identify advantages for fuel transitions in terms of business economics or public investment decisions. Europe’s history as a net NG importer may be partly motivated by environmental policies to reduce regional fuel-sulfur emissions, initially motivated in the 1980s by aquatic acidification and terrestrial eutrophication, with continued motivation for air quality and human health goals (Andersson et al., 2009; Jonson et al., 2014; UNECE, 1979).
Notes on Maritime Demand Drivers: Regional trends in transport demand can identify where LNG technologies may be introduced into the shipping sector to meet demand growth rather than as a replacement for aging assets; this can present opportunities for energy policy to leverage LNG market share with incentive instruments rather than phase-out policies. IEA data for OECD Americas also shows the transport sector has long been included in NG consumption, indicating that institutional knowledge exists in how to transport fuel and fuel vehicles. Recent studies focused on European applications have shown that natural gas meets both safety and performance criteria in the maritime transportation sector (Banawan et al., 2010; El-Gohary, 2012; Elgohary et al., 2014).
22

References
Andersson, C., Bergström, R., Johansson, C., 2009. Population exposure and mortality due to regional background PM in Europe–Long-term simulations of source region and shipping contributions. Atmospheric Environment, 43:22, 3614-3620.
Banawan, A.A., El Gohary, M.M., Sadek, I.S., 2010. Environmental and economical benefits of changing from marine diesel oil to natural-gas fuel for short-voyage high-power passenger ships. Proceedings of the Institution of Mechanical Engineers, Part M: Journal of Engineering for the Maritime Environment, 224:2, 103-113.
El-Gohary, M.M., 2012. The future of natural gas as a fuel in marine gas turbine for LNG carriers. Proceedings of the Institution of Mechanical Engineers, Part M: Journal of Engineering for the Maritime Environment, 226:4, 371-377.
Elgohary, M.M., Seddiek, I.S., Salem, A.M., 2014. Overview of alternative fuels with emphasis on the potential of liquefied natural gas as future marine fuel. Proceedings of the Institution of Mechanical Engineers, Part M: Journal of Engineering for the Maritime Environment, 1475090214522778, SAGE Publications, Available at: http://pim.sagepub.com.udel.idm.oclc.org/content/early/2014/02/17/1475090214522778.full.pdf+html.
GreenPort, 2014. Singapore Green Initiative. GreenPort, Available at: http://www.greenport.com/news101/asia/singapore-green-initiative. accessed: 11/9/14.
Jonson, J., Jalkanen, J., Johansson, L., Gauss, M., Denier van der Gon, HAC, 2014. Model calculations of the effects of present and future emissions of air pollutants from shipping in the Baltic Sea and the North Sea. Atmospheric Chemistry and Physics Discussions, 14:15, 21943-21974.
UNECE, 1979. Convention on long-range transboundary air pollution. United Nations Economic Comission for Europe, accessed: December 2014.
23