supporting information - pnas · supporting information ... not to the timing of ensuing warming or...
TRANSCRIPT
Supporting InformationStrauss et al. 10.1073/pnas.1511186112
Antarctic Contribution (BASELINE)
Cumulative Carbon Emissions Since 1850 (Gt)1000 1500 2000 2500
Com
mitt
ed S
ea L
evel
Ris
e (m
)
0
1
2
3
4
5
6
7
SLR sensitivity towarming held constantWarming sensitivity toemissions held constant
Antarctic Contribution (TRIGGERED)
Cumulative Carbon Emissions Since 1850 (Gt)1000 1500 2000 2500
Com
mitt
ed S
ea L
evel
Ris
e (m
)0
1
2
3
4
5
6
7
Total (BASELINE)
Cumulative Carbon Emissions Since 1850 (Gt)1000 1500 2000 2500
Com
mitt
ed S
ea L
evel
Ris
e (m
)
0
1
2
3
4
5
6
7
8
9
10Total (TRIGGERED)
Cumulative Carbon Emissions Since 1850 (Gt)1000 1500 2000 2500
Com
mitt
ed S
ea L
evel
Ris
e (m
)
0
1
2
3
4
5
6
7
8
9
10
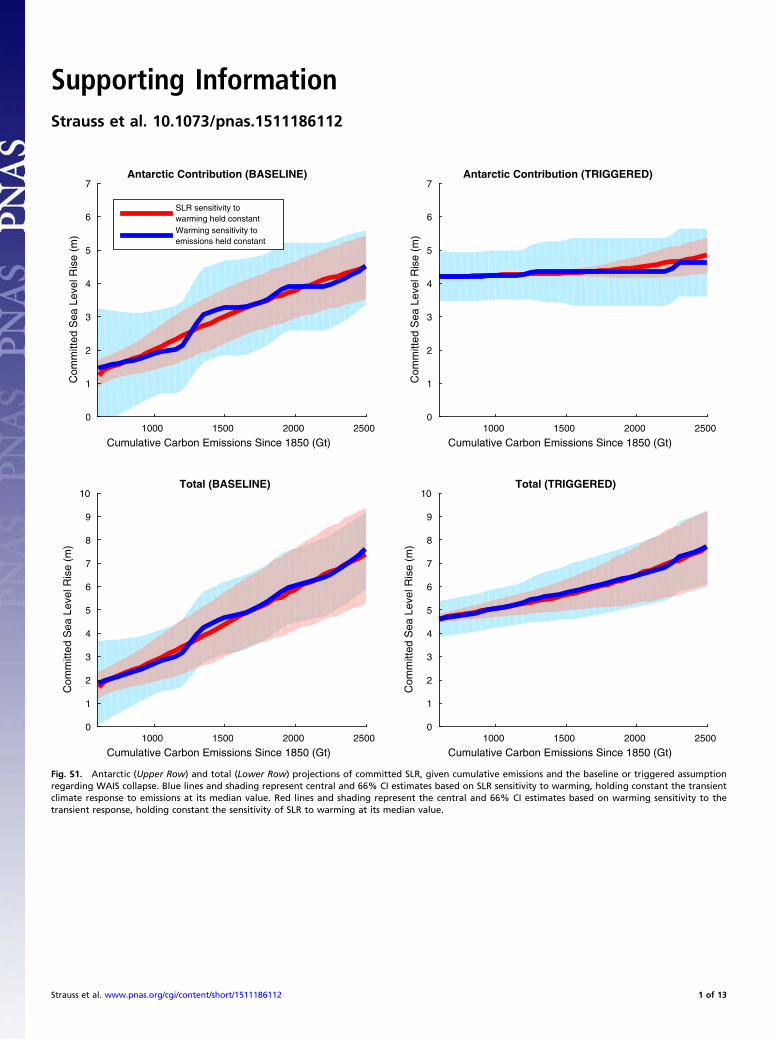
Fig. S1. Antarctic (Upper Row) and total (Lower Row) projections of committed SLR, given cumulative emissions and the baseline or triggered assumptionregarding WAIS collapse. Blue lines and shading represent central and 66% CI estimates based on SLR sensitivity to warming, holding constant the transientclimate response to emissions at its median value. Red lines and shading represent the central and 66% CI estimates based on warming sensitivity to thetransient response, holding constant the sensitivity of SLR to warming at its median value.
Strauss et al. www.pnas.org/cgi/content/short/1511186112 1 of 13

Table
S1.
TotalU
Smunicipalitiesbecominglocked
inso
that
25,5
0,or10
0%oftheir20
10population-w
eightedarea
will
fallbelow
thefuture
committedhightidelin
e,mak
ingno
assu
mptionab
outW
AIS
colla
pse
(baselinecase)
Emissions
enddate
Emissions
scen
ario
Cumulative
emissions,GtC
Committed
warming,°C
(CI)
Committed
SLR,m
(CI)
CommittedUSmunicipalities–baselinecase
forWAIS
With25
%threshold
With50
%threshold
With10
0%threshold
Allmunicipalities
(CI)
>10
0,00
0residen
ts(CI)
Allmunicipalities
(CI)
>10
0,00
0residen
ts(CI)
Allmunicipalities
(CI)
>10
0,00
0residen
ts(CI)
2015
Historical
560
0.8(0.5–1.0)
1.6(0.0–3.7)
675(0–1,26
1)14
(0–25
)41
4(0–94
2)6(0–17
)14
(0–19
9)0(0–2)
2015
+Historical+
EIEI
800
1.0(0.7–1.3)
2.2(0.4–4.0)
846(165
–1,33
5)17
(2–26
)60
4(92–
1,01
1)8(2–19
)38
(8–28
3)0(0–3)
2050
RCP2.6
802
1.1(0.8–1.4)
2.3(0.6–4.1)
889(227
–1,34
7)15
(2–26
)63
6(119
–1,02
8)9(2–19
)50
(8–28
3)0(0–3)
RCP4.5
940
1.3(0.9–1.6)
2.7(0.9–4.4)
989(361
–1,39
6)19
(2–26
)69
9(208
–1,08
2)11
(2–19
)84
(11–
330)
0(0–3)
RCP6.0
913
1.2(0.9–1.6)
2.6(0.8–4.3)
973(341
–1,38
7)18
(2–26
)68
2(190
–1,07
1)11
(2–19
)83
(9–31
5)0(0–3)
RCP8.5
1110
1.5(1.1–1.9)
3.1(1.3–5.0)
1,12
1(528
–1,49
9)22
(7–27
)80
9(335
–1,17
5)16
(2–21
)12
8(11–
384)
0(0–4)
2100
RCP2.6
840
1.1(0.8–1.5)
2.4(0.7–4.2)
919(273
–1,36
2)15
(2–26
)65
5(140
–1,04
3)11
(2–19
)83
(8–28
3)0(0–3)
RCP4.5
1,26
61.7(1.2–2.2)
3.6(1.7–5.6)
1,23
2(713
–1,57
5)24
(15–
28)
911(460
–1,27
2)17
(7–22
)19
9(14–
470)
2(0–5)
RCP6.0
1,67
82.3(1.6–2.9)
5.0(2.7–7.2)
1,49
0(1,057
–1,82
6)27
(21–
42)
1,17
6(756
–1,47
9)21
(15–
24)
386(126
–68
3)4(0–7)
RCP8.5
2,43
03.3(2.3–4.2)
7.1(4.3–9.9)
1,89
4(1,504
–2,17
6)44
(27–
53)
1,54
4(1,185
–1,81
2)25
(21–
35)
741(411
–1,02
1)8(4–13
)Notap
plicab
leFixe
dwarming
Not
applicab
le1.5
2.9(1.6–4.2)
1,04
2(612
–1,36
9)21
(12–
26)
744(372
–1,05
2)15
(4–19
)10
3(14–
284)
0(0–3)
2.0
4.7(3.0–6.3)
1,44
1(1,054
–1,73
6)27
(21–
36)
1,11
9(748
–1,39
2)20
(15–
23)
353(121
–61
0)4(0–6)
3.0
6.4(4.7–8.2)
1,77
0(1,460
–2,02
4)39
(27–
46)
1,41
5(1,127
–1,67
7)23
(20–
30)
653(355
–86
9)6(4–11
)4.0
8.9(6.9–10
.8)
2,10
1(1,841
–2,33
9)49
(42–
54)
1,74
8(1,499
–1,93
8)34
(25–
37)
943(714
–1,13
4)12
(7–14
)
Projectionsassumeze
road
ditional
emissionsafterem
issionsen
ddates
listed,e
xcep
tforthehistorical+
EIEI
scen
ario.E
IEIistheex
pectedfuture
emissionsim
plie
dbyex
istingen
ergyinfrastructure,a
sestimated
inref.23
.Th
eye
arsshownrelate
toem
issionsan
dassociated
commitmen
ts,notto
thetimingofen
suingwarmingorSL
R.CIsareshownspan
ning17
th–83
rdpercentiles,the66
%(“lik
ely”
)range.
Committed
warmingisin
reference
tothepreindustrial
global
mea
ntemperature,a
ndco
mmittedSL
Risin
reference
toglobal
mea
nsealeve
lin19
92.N
ote:therelationship
betwee
nco
mmittedwarmingan
dco
mmittedSL
Risdifferentforfixe
dwarmingvs.allother
scen
arios,becau
seallother
scen
ariosinvo
lvedistributionsofwarmingam
ounts,an
dwarmingtran
slates
nonlin
earlyinto
SLR.
Strauss et al. www.pnas.org/cgi/content/short/1511186112 2 of 13

Table
S2.
TotalU
Smunicipalitiesbecominglocked
inso
that
25,5
0,or10
0%oftheir20
10population-w
eightedarea
will
fallbelow
thefuture
committedhightidelin
e,assu
ming
inev
itab
leco
llapse
oftheW
AIS
under
anyscen
ario
(triggered
case)
Emissions
enddate
Emissions
scen
ario
Cumulative
emissions,GtC
Committed
warming,°C
(CI)
Committed
SLR,m
(CI)
CommittedUSmunicipalities–triggered
case
forWAIS
With25
%threshold
With50
%threshold
With10
0%threshold
All
municipalities
>10
0,00
0residen
tsAll
municipalities
>10
0,00
0residen
tsAll
municipalities
>10
0,00
0residen
ts
2015
Historical
560
0.8(0.5–1.0)
4.6(3.5–5.8)
1,47
5(1,261
–1,69
0)27
(25–
33)
1,15
3(931
–1,34
3)20
(17–
23)
370(199
–55
3)4(2–6)
2015
+Historical+
EIEI
800
1.0(0.7–1.3)
4.8(3.8–5.8)
1,51
6(1,335
–1,69
7)27
(26–
34)
1,20
2(1,011
–1,35
6)22
(19–
23)
426(283
–58
2)4(3–6)
2050
RCP2.6
802
1.1(0.8–1.4)
4.9(3.9–5.8)
1,52
8(1,348
–1,70
4)28
(26–
34)
1,21
0(1,025
–1,35
7)22
(19–
23)
427(283
–58
3)4(3–6)
RCP4.5
940
1.3(0.9–1.6)
5.0(4.0–6.0)
1,54
9(1,365
–1,71
3)28
(26–
34)
1,23
4(1,046
–1,37
2)22
(19–
23)
427(283
–59
0)4(3–6)
RCP6.0
913
1.2(0.9–1.6)
5.0(4.0–6.0)
1,54
6(1,363
–1,71
2)28
(26–
34)
1,22
8(1,046
–1,37
1)22
(19–
23)
427(283
–59
0)4(3–6)
RCP8.5
1,11
01.5(1.1–1.9)
5.2(4.1–6.2)
1,56
9(1,376
–1,74
7)28
(26–
37)
1,25
1(1,056
–1,39
9)22
(19–
23)
445(300
–61
1)5(3–6)
2100
RCP2.6
840
1.1(0.8–1.5)
4.9(4.0–5.9)
1,53
6(1,354
–1,70
7)28
(26–
34)
1,21
6(1,035
–1,36
1)22
(19–
23)
427(283
–58
5)4(3–6)
RCP4.5
1,26
61.7(1.2–2.2)
5.3(4.1–6.6)
1,58
1(1,379
–1,77
4)28
(26–
40)
1,27
1(1,059
–1,43
7)22
(19–
23)
472(302
–65
6)5(3–6)
RCP6.0
1,67
82.3(1.6–2.9)
5.9(4.3–7.5)
1,70
4(1,437
–1,91
5)34
(27–
44)
1,35
8(1,115
–1,56
3)23
(20–
26)
585(353
–77
4)6(4–8)
RCP8.5
2,43
03.3(2.3–4.2)
7.4(5.0–9.9)
1,95
7(1,645
–2,19
5)46
(32–
53)
1,59
6(1,307
–1,82
5)27
(23–
35)
796(504
–10
24)
8(5–13
)Notap
plicab
leFixe
dwarming
Notap
plicab
le1.5
5.2(4.4–6.0)
1,56
0(1,410
–1,71
0)28
(27–
34)
1,24
9(1,097
–1,36
9)22
(20–
23)
443(345
–59
0)5(4–6)
2.0
5.7(4.5–7.0)
1,66
6(1,445
–1,86
4)32
(27–
42)
1,32
7(1,123
–1,51
6)23
(20–
25)
537(353
–73
5)6(4–7)
3.0
6.9(5.3–8.5)
1,83
9(1,575
–2,04
2)42
(28–
48)
1,49
9(1,277
–1,70
0)25
(22–
32)
709(461
–89
4)7(5–11
)4.0
9.4(7.5–11
.3)
2,15
0(1,927
–2,37
4)52
(44–
54)
1,79
8(1,575
–1,97
8)34
(26–
37)
995(794
–1,16
0)12
(8–14
)
EIEI
istheex
pectedfuture
emissionsim
plie
dbyex
istingen
ergyinfrastructure,as
estimated
inref.
23.Th
eye
arsshownrelate
toem
issionsan
dassociated
commitmen
ts,notto
thetimingoftheen
suing
warmingorSL
R.Se
ethelegen
dofTa
ble
S1forfurther
docu
men
tation.
Strauss et al. www.pnas.org/cgi/content/short/1511186112 3 of 13

Table S3. Cities exceeding 100,000 residents where 25% of the 2010 population-weighted area will fall below the future committedhigh tide line, making no assumption about WAIS collapse (baseline case)
City State Total population Population rankCritical cumulativeemissions, GtC Committed SLR, m
Commitment year
RCP 8.5 RCP 6.0 RCP 4.5 RCP 2.6
Beaumont TX 118,286 37 1,840 5.4 2080Boston MA 617,594 3 930 2.8 2045 2055 2050Bridgeport CT 144,229 26 2,070 6.2 2090Brownsville TX 175,023 21 2,260 6.9 2095Cambridge MA 105,162 42 AE 1.5 AE AE AE AECape Coral FL 153,809 24 590 1.9 2020 2020 2020 2020Charleston SC 119,875 36 AE 1.6 AE AE AE AEChesapeake VA 221,576 17 980 2.9 2045 2060 2055Clearwater FL 107,685 38 1,970 6.0 2085Coral Springs FL 121,062 35 900 2.8 2040 2050 2050Corpus Christi TX 305,184 11 1,870 5.6 2085Elizabeth NJ 124,969 33 1,910 5.7 2085Elk Grove CA 152,772 25 1,860 5.5 2080Fort Lauderdale FL 165,521 22 AE 1.2 AE AE AE AEHampton VA 137,373 30 910 2.7 2040 2050 2050Hayward CA 142,760 27 2,140 6.5 2090Hialeah FL 224,634 16 AE 1.5 AE AE AE AEHollywood FL 139,946 28 AE 1.5 AE AE AE AEHonolulu (Urban) HI 337,248 9 1,210 3.9 2055 2075 2090Huntington Beach CA 189,992 19 AE 1.1 AE AE AE AEJacksonville FL 819,050 2 1,720 5.1 2075Jersey City NJ 247,597 13 1,270 3.7 2060 2075Long Beach CA 458,815 5 2,010 6.1 2090Metairie LA 138,481 29 AE 0.1 AE AE AE AEMiami FL 399,457 7 AE 1.7 AE AE AE AEMiami Gardens FL 107,167 40 AE 1.6 AE AE AE AEMiramar FL 107,278 39 AE 1.2 AE AE AE AENew Haven CT 129,779 32 2,400 7.2 2100New Orleans LA 343,467 8 AE 0.2 AE AE AE AENew York NY 8,175,083 1 2,160 6.5 2095Newport News VA 180,659 20 2,070 6.3 2090Norfolk VA 242,751 15 900 2.7 2040 2050 2050Oxnard CA 197,820 18 2,190 6.7 2095Palm Bay FL 103,190 44 2,220 6.8 2095Pembroke Pines FL 123,802 34 AE 1.3 AE AE AE AEPort St. Lucie FL 164,438 23 1,550 4.6 2070 2095Richmond CA 103,668 43 2,410 7.4 2100Sacramento CA 466,486 4 1,100 3.2 2050 2065 2070Savannah GA 136,286 31 1,220 3.5 2060 2075 2090St. Petersburg FL 244,767 14 AE 1.7 AE AE AE AEStockton CA 277,588 12 AE 1.4 AE AE AE AETampa FL 335,654 10 1,380 4.0 2065 2085Virginia Beach VA 436,497 6 950 2.9 2045 2055 2055Wilmington NC 106,476 41 2,120 6.4 2090
The alphabetical list includes the SLR increment required for each city to commit at 25%, together with the corresponding central estimate of criticalcumulative emissions. Committed SLR in turn corresponds to these emissions. AE indicates that historical emissions already have exceeded the critical level.Where applicable, RCP columns indicate future 21st century years (rounded to the nearest multiple of 5) when different RCPs will exceed each city’s criticalemissions level. The years shown relate to emissions and associated commitments, not to the timing of the ensuing warming or SLR. Rows for the 10 largestcities are shaded.
Strauss et al. www.pnas.org/cgi/content/short/1511186112 4 of 13

Table S4. Cities exceeding 100,000 residents where 50 or 100% of the 2010 population-weighted area will fall below the futurecommitted high tide line, making no assumption about WAIS collapse (baseline case)
City StateTotal
populationPopulation
rank
Criticalcumulative
emissions, GtCCommitted
SLR, m
Commitment year
RCP 8.5 RCP 6.0 RCP 4.5 RCP 2.6
Commitment threshold: 50%Beaumont TX 118,286 22 2,210 6.6 2095Cambridge MA 105,162 25 940 2.8 2045 2055 2055Cape Coral FL 153,809 14 820 2.5 2035 2045 2040 2060Charleston SC 119,875 21 790 2.4 2035 2040 2040 2050Chesapeake VA 221,576 10 1,360 4.0 2065 2080Coral Springs FL 121,062 20 1040 3.1 2050 2060 2060Fort Lauderdale FL 165,521 12 AE 1.6 AE AE AE AEHampton VA 137,373 17 1,000 2.9 2045 2060 2060Hialeah FL 224,634 9 AE 1.7 AE AE AE AEHollywood FL 139,946 15 630 2.1 2025 2025 2025 2025Huntington Beach CA 189,992 11 1,160 3.4 2055 2070 2080Jacksonville FL 819,050 1 2,320 7.0 2100Metairie LA 138,481 16 AE 0.3 AE AE AE AEMiami FL 399,457 4 820 2.5 2035 2045 2040 2060Miami Gardens FL 107,167 24 570 1.8 2020 2020 2020 2020Miramar FL 107,278 23 AE 1.6 AE AE AE AENew Orleans LA 343,467 5 AE 0.3 AE AE AE AENorfolk VA 242,751 8 980 2.9 2045 2060 2055Pembroke Pines FL 123,802 19 AE 1.6 AE AE AE AEPort St. Lucie FL 164,438 13 1,880 5.8 2085Sacramento CA 466,486 2 1,700 5.0 2075Savannah GA 136,286 18 1,650 4.9 2075 2100St. Petersburg FL 244,767 7 1,550 4.6 2070 2095Stockton CA 277,588 6 950 2.8 2045 2055 2055Virginia Beach VA 436,497 3 1,320 3.9 2060 2080
Commitment threshold: 100%Cape Coral FL 153,809 3 1,950 6.0 2085Hialeah FL 224,634 2 1,160 3.5 2055 2070 2080Hollywood FL 139,946 4 2,240 7.0 2095Metairie LA 138,481 5 1,210 3.5 2055 2075 2090Miami Gardens FL 107,167 8 1,790 5.5 2080Miramar FL 107,278 7 2,420 7.5 2100New Orleans LA 343,467 1 1,540 4.5 2070 2095Pembroke Pines FL 123,802 6 1,340 4.0 2065 2080
The years shown relate to emissions and associated commitments, not to the timing of ensuing warming or SLR. Rows for the 10 largest cities are shadedunderneath each commitment threshold level. See the legend of Table S3 for further documentation.
Strauss et al. www.pnas.org/cgi/content/short/1511186112 5 of 13

Table S5. Cities exceeding 100,000 residents where 25% of the 2010 population-weighted area will fall below the future committedhigh tide line, assuming inevitable collapse of the WAIS under any emissions scenario (triggered case)
City StateTotal
populationPopulation
rank
Criticalcumulative
emissions, GtCCommitted
SLR, m
Commitment year
RCP 8.5 RCP 6.0 RCP 4.5 RCP 2.6
Beaumont TX 118,286 39 1,310 5.4 2060 2080Boston MA 617,594 3 AE 2.8 AE AE AE AEBridgeport CT 144,229 28 1,770 6.2 2080Brownsville TX 175,023 22 2,050 6.9 2090Cambridge MA 105,162 44 AE 1.5 AE AE AE AECape Coral FL 153,809 25 AE 1.9 AE AE AE AECharleston SC 119,875 38 AE 1.6 AE AE AE AEChesapeake VA 221,576 17 AE 2.9 AE AE AE AEClearwater FL 107,685 40 1,600 6.0 2075 2095Coral Springs FL 121,062 37 AE 2.8 AE AE AE AECorpus Christi TX 305,184 11 1,420 5.6 2065 2085Elizabeth NJ 124,969 35 1,520 5.7 2070 2090Elk Grove CA 152,772 26 1,380 5.5 2065 2085Fort Lauderdale FL 165,521 23 AE 1.2 AE AE AE AEHampton VA 137,373 32 AE 2.7 AE AE AE AEHayward CA 142,760 29 1,860 6.5 2080Hialeah FL 224,634 16 AE 1.5 AE AE AE AEHollywood FL 139,946 30 AE 1.5 AE AE AE AEHonolulu (urban) HI 337,248 9 AE 3.9 AE AE AE AEHuntington Beach CA 189,992 20 AE 1.1 AE AE AE AEJacksonville FL 819,050 2 770 5.1 2035 2040 2040 2045Jersey City NJ 247,597 13 AE 3.7 AE AE AE AELong Beach CA 458,815 5 1,660 6.1 2075 2100Metairie LA 138,481 31 AE 0.1 AE AE AE AEMiami FL 399,457 7 AE 1.7 AE AE AE AEMiami Gardens FL 107,167 42 AE 1.6 AE AE AE AEMiramar FL 107,278 41 AE 1.2 AE AE AE AEMobile AL 195,111 19 2,400 7.6 2100New Haven CT 129,779 34 2,210 7.2 2095New Orleans LA 343,467 8 AE 0.2 AE AE AE AENew York NY 8,175,083 1 1,890 6.5 2085Newport News VA 180,659 21 1,770 6.3 2080Norfolk VA 242,751 15 AE 2.7 AE AE AE AEOxnard CA 197,820 18 1,950 6.7 2085Palm Bay FL 103,190 46 1,990 6.8 2085Pasadena TX 149,043 27 2,420 7.7 2100Pembroke Pines FL 123,802 36 AE 1.3 AE AE AE AEPort St. Lucie FL 164,438 24 AE 4.6 AE AE AE AERichmond CA 103,668 45 2,220 7.4 2095Sacramento CA 466,486 4 AE 3.2 AE AE AE AESavannah GA 136,286 33 AE 3.5 AE AE AE AESt. Petersburg FL 244,767 14 AE 1.7 AE AE AE AEStockton CA 277,588 12 AE 1.4 AE AE AE AETampa FL 335,654 10 AE 4.0 AE AE AE AEVirginia Beach VA 436,497 6 AE 2.9 AE AE AE AEWilmington NC 106,476 43 1,830 6.4 2080
The years shown relate to emissions and associated commitments, not to the timing of ensuing warming or SLR. See the legend of Table S3 for furtherdocumentation.
Strauss et al. www.pnas.org/cgi/content/short/1511186112 6 of 13

Table S6. Cities exceeding 100,000 residents where 50 or 100% of the 2010 population-weighted area will fall below the futurecommitted high tide line, assuming inevitable collapse of the WAIS under any emissions scenario (triggered case)
City StateTotal
populationPopulation
rank
Criticalcumulative
emissions, GtCCommitted
SLR, m
Commitmentyear
RCP 8.5 RCP 6.0 RCP 4.5 RCP 2.6
Commitment threshold: 50%Beaumont TX 118,286 23 1,990 6.6 2085Cambridge MA 105,162 26 AE 2.8 AE AE AE AECape Coral FL 153,809 14 AE 2.5 AE AE AE AECharleston SC 119,875 22 AE 2.4 AE AE AE AEChesapeake VA 221,576 10 AE 4.0 AE AE AE AECoral Springs FL 121,062 21 AE 3.1 AE AE AE AEElk Grove CA 152,772 15 2,410 7.6 2100Fort Lauderdale FL 165,521 12 AE 1.6 AE AE AE AEHampton VA 137,373 18 AE 2.9 AE AE AE AEHialeah FL 224,634 9 AE 1.7 AE AE AE AEHollywood FL 139,946 16 AE 2.1 AE AE AE AEHuntington Beach CA 189,992 11 AE 3.4 AE AE AE AEJacksonville FL 819,050 1 2,130 7.0 2090Metairie LA 138,481 17 AE 0.3 AE AE AE AEMiami FL 399,457 4 AE 2.5 AE AE AE AEMiami Gardens FL 107,167 25 AE 1.8 AE AE AE AEMiramar FL 107,278 24 AE 1.6 AE AE AE AENew Orleans LA 343,467 5 AE 0.3 AE AE AE AENorfolk VA 242,751 8 AE 2.9 AE AE AE AEPalm Bay FL 103,190 27 2,270 7.5 2095Pembroke Pines FL 123,802 20 AE 1.6 AE AE AE AEPort St. Lucie FL 164,438 13 1,410 5.8 2065 2085Sacramento CA 466,486 2 730 5.0 2030 2035 2035 2035Savannah GA 136,286 19 590 4.9 2020 2020 2020 2020St. Petersburg FL 244,767 7 AE 4.6 AE AE AE AEStockton CA 277,588 6 AE 2.8 AE AE AE AEVirginia Beach VA 436,497 3 AE 3.9 AE AE AE AE
Commitment threshold: 100%Cape Coral FL 153,809 3 1,570 6.0 2070 2095Hialeah FL 224,634 2 AE 3.5 AE AE AE AEHollywood FL 139,946 4 2,020 7.0 2090Metairie LA 138,481 5 AE 3.5 AE AE AE AEMiami Gardens FL 107,167 8 1,030 5.5 2050 2060 2060Miramar FL 107,278 7 2,230 7.5 2095New Orleans LA 343,467 1 AE 4.5 AE AE AE AEPembroke Pines FL 123,802 6 AE 4.0 AE AE AE AE
The years shown relate to emissions and associated commitments, not to the timing of ensuing warming or SLR. Rows for the 10 largest cities are shadedunderneath each commitment threshold level. See the legend of Table S3 for further documentation.
Strauss et al. www.pnas.org/cgi/content/short/1511186112 7 of 13

Table
S7.
Coastalstate
andUStotal2
010censu
spopulationsliv
ingonlandfallingbelow
future
committedhightidelin
esunder
differentem
issionsscen
ariosthrough20
50,m
aking
noassu
mptionsab
outtheinev
itab
ility
ofW
AIS
colla
pse
(baselinecase)
State
Population(inthousandsofpersons)
livingbelow
committedsealeve
lsbyscen
ario:med
ian(w
hite)
and17
th–83
rdpercentile
estimates
(shad
ed)
Historicalem
issions
Historical+
EIEE
RCP2.6through20
50RCP4.5through20
50RCP6.0through20
50RCP8.5through20
50
Alaska
290–
4033
1–44
3322
–45
3525
–48
3524
–48
3727
–52
Alabam
a12
0–42
200–
5121
1–52
274–
5726
3–56
358–
63California
587
0–1,37
783
60–
1,60
887
624
2–1,64
41,01
332
1–1,76
598
130
3–1,73
61,20
844
6–1,94
3Connecticu
t47
0–12
572
0–15
176
0–15
689
16–17
186
14–16
710
830
–19
2DistrictofColumbia
10–
83
0–12
30–
125
1–14
41–
147
1–17
Delaw
are
230–
5834
0–71
361–
7342
8–81
417–
7950
16–91
Florida
2,46
50–
6,55
64,26
80–
7,36
04,53
522
0–7,49
25,17
749
7–7,96
55,02
943
3–7,85
45,97
81,29
6–8,59
4Geo
rgia
650–
216
107
0 –26
611
410
–27
413
822
–30
013
220
–29
417
740
–33
2Haw
aii
100
0–21
915
34–
243
159
6–24
618
017
–26
017
612
–25
720
465
–27
8Lo
uisiana
1,09
80–
1,50
71,24
20–
1,62
81,26
474
1–1,64
71,33
184
9–1,70
91,31
682
5–1,69
61,42
298
5–1,79
0Massach
usetts
223
0–49
633
00–
558
344
3–56
838
967
–60
037
960
–59
344
613
6–64
5Marylan
d67
0–18
210
30–
219
109
4–22
513
024
–24
412
521
–24
015
743
–27
2Maine
70–
2211
0–27
120–
2815
2–31
142–
3018
4–35
Mississippi
140–
6523
0–84
252–
8734
5–98
324–
9550
9–11
7NorthCarolin
a12
60–
284
180
0–32
518
928
–33
121
652
–35
321
047
–34
825
390
–38
5New
Ham
pshire
60–
128
0–14
80–
149
2–15
92–
1511
4–17
New
Jersey
338
0–74
248
20–
846
504
8–86
357
310
8–91
855
892
–90
566
222
3–99
7New
York
411
0–1,32
071
00–
1,61
675
82–
1,66
290
982
–1,81
587
668
–1,78
21,11
622
1–2,01
9Oregon
130–
2918
0–35
195–
3622
7–38
216–
3826
10–42
Pennsylvan
ia10
0–54
170–
7819
0–83
273–
9725
3–93
406–
116
RhodeIsland
100–
3417
0–42
180–
4422
3–48
213–
4728
6–54
South
Carolin
a13
40–
363
205
0–43
121
618
–44
225
745
–47
924
740
–47
131
388
–53
0Te
xas
155
0–41
923
60–
512
250
35–52
929
660
–58
628
555
–57
236
010
5–67
5Virginia
168
0–84
733
30–
1,02
136
620
–1,04
249
446
–1,10
946
441
–1,09
568
596
–1,19
3W
ashington
740–
130
920–
146
9532
–14
910
548
–15
710
346
–15
511
862
–16
7UStotal
6,18
10–
15,148
9,53
34–
17,388
10,052
1,40
0–17
,743
11,535
2,31
4–18
,959
11,194
2,13
2–18
,678
13,508
4,01
7–20
,617
Projectionsassumeze
road
ditional
emissionsafterem
issionsen
ddates
listed,e
xcep
tforthehistorical+
EIEI
scen
ario.E
IEIistheex
pectedfuture
emissionsim
plie
dbyex
istingen
ergyinfrastructure,a
sestimated
inref.23
.Theye
arsshownrelate
toem
issionsan
dassociated
commitmen
ts,n
otto
thetimingofen
suingwarmingorSL
R.L
evelsofco
mmittedwarmingan
dSLRassociated
withea
chscen
ario
areshownin
Table
S1.UStotalsincludeonly
thelistedstates
andtheDistrictofColumbia.
Strauss et al. www.pnas.org/cgi/content/short/1511186112 8 of 13

Table S8. Coastal state and US total 2010 census populations living on land falling below future committed high tide lines underdifferent emissions scenarios through 2100, making no assumptions about the inevitability of WAIS collapse (baseline case)
State
Population (in thousands of persons) living below committed sea levels by scenario: median (white) and 17th–83rdpercentile estimates (shaded)
RCP 2.6 through 2100 RCP 4.5 through 2100 RCP 6.0 through 2100 RCP 8.5 through 2100
Alaska 34 23–46 40 30–54 50 36–61 63 51–74Alabama 23 2–53 42 12–70 60 32–89 93 64–141California 911 263–1,675 1,384 596–2,106 1,871 1,128–2,610 2,750 2,009–3,482Connecticut 80 10–160 125 47–211 178 96–264 265 180–350District of Columbia 4 1–13 8 1–20 15 5–24 24 16–33Delaware 38 5–75 58 23–102 85 45–137 140 87–208Florida 4,704 294–7,611 6,595 2,590–9,082 8,346 5,665–10,097 10,308 8,729–11,342Georgia 120 16–281 216 65–355 316 155–395 400 332–430Hawaii 165 8–250 223 110–292 276 201–328 343 294–388Louisiana 1,283 773–1,664 1,507 1,100–1,860 1,752 1,379–2,047 2,085 1,801–2,294Massachusetts 357 44–576 495 219–683 614 408–792 793 616–974Maryland 115 15–230 181 66–299 255 140–381 386 261–487Maine 13 2–28 21 7–39 32 16–52 52 31–75Mississippi 27 3–90 65 14–133 108 42–185 196 119–250North Carolina 196 35–337 285 127–415 368 234–517 535 381–692New Hampshire 9 1–15 12 6–18 16 10–23 23 16–30New Jersey 524 56–877 739 334–1,068 946 605–1,259 1,270 958–1,582New York 801 38–1,703 1,312 404–2,203 1,886 981–2,720 2,744 1,912–3,599Oregon 20 6–36 30 13–45 40 24–54 56 43–77Pennsylvania 21 2–86 54 10–133 103 31–196 201 106–321Rhode Island 19 2–45 34 10–60 50 24–78 78 51–108South Carolina 227 28–452 363 134–576 503 284–686 701 526–823Texas 262 43–543 420 156–770 633 331–1,067 1,147 699–1,754Virginia 395 29–1,061 849 169–1,258 1,148 577–1,386 1,394 1,176–1,512Washington 98 41–151 130 74–176 162 112–204 210 168–268
US total 10,443 1,739–18,060 15,189 6,316–22,031 19,813 12,560–25,650 26,255 20,625–31,295
Projections assume zero additional emissions after emissions end dates listed. The years shown relate to emissions and associated commitments, not to thetiming of ensuing warming or SLR. Levels of committed warming and SLR associated with each scenario are shown in Table S1. US totals include only the listedstates and the District of Columbia.
Strauss et al. www.pnas.org/cgi/content/short/1511186112 9 of 13

Table S9. Coastal state and US total 2010 census populations living on land falling below future committed high tide lines underdifferent fixed long-term warming scenarios, making no assumptions about the inevitability of WAIS collapse (baseline case)
State
Population (in thousands of persons) living below committed sea levels by scenario: median (white) and 17th–83rd percentileestimates (shaded)
1.5 °C warming 2 °C warming 3 °C warming 4 °C warming
Alaska 36 26–50 48 35–60 58 46–70 72 60–82Alabama 31 5–60 57 27–85 82 53–120 130 87–174California 1,097 372–1,842 1,775 1,025–2,512 2,441 1,706–3,179 3,360 2,626–4,043Connecticut 97 20–179 169 88–255 236 149–321 323 238–401Dist. of Columbia 5 1–15 14 4–23 22 12–29 30 23–38Delaware 45 11–85 80 42–130 118 71–183 188 122–257Florida 5,540 761–8,250 8,010 5,244–9,926 9,755 7,679–10,996 11,168 10,019–11,827Georgia 153 28–314 300 138–391 383 277–420 424 391–441Hawaii 191 37–268 265 187–321 320 264–366 384 339–420Louisiana 1,370 909–1,744 1,710 1,332–2,015 1,979 1,665–2,212 2,253 2,032–2,433Massachusetts 412 84–618 596 384–774 732 550–912 912 732–1,091Maryland 141 30–256 242 128–368 343 219–451 457 351–560Maine 16 3–32 30 14–50 44 26–67 67 44–90Mississippi 40 6–106 99 34–175 165 90–234 243 180–263North Carolina 232 66–366 353 216–496 469 331–640 658 488–782New Hampshire 10 3–16 15 9–22 20 14–28 28 20–35New Jersey 609 147–950 912 566–1,229 1,164 842–1,466 1,480 1,177–1,798New York 991 116–1,897 1,799 893–2,635 2,453 1,599–3,290 3,321 2,483–4,131Oregon 24 8–40 38 22–52 51 36–70 74 53–88Pennsylvania 32 4–104 95 25–184 161 77–280 285 165–390Rhode Island 24 4–51 48 22–75 68 41–97 98 68–129South Carolina 280 59–500 478 256–670 644 445–777 794 667–892Texas 323 76–623 588 298–1,009 959 549–1,501 1,637 1,057–2,190Virginia 571 61–1,145 1,108 491–1,373 1,342 1,035–1,463 1,473 1,359–1,620Washington 111 54–161 157 105–198 192 150–243 254 200–312
US total 12,383 2,893–19,673 18,984 11,584–25,030 24,202 17,929–29,414 30,114 24,982–34,487
Pure warming scenarios assume long-term fixed warming levels, and make no predictions about the timing of ensuing SLR. Levels of committed SLRassociated with each scenario are shown in Table S1. US totals include only the listed states and the District of Columbia.
Strauss et al. www.pnas.org/cgi/content/short/1511186112 10 of 13

Table
S10.
Coastalstatean
dUStotal20
10censu
spopulationsliv
ingonlandfallingbelow
future
committedhightidelin
esunder
differentem
issionsscen
ariosthrough20
50,
assu
mingtheinev
itab
leco
llapse
oftheW
AIS
under
anyscen
ario
(triggered
case)
State
Population(inthousands)
livingbelow
committedsealeve
lsbyscen
ario:med
ian(w
hite)
and17
th–83
rdpercentile
estimates
(shad
ed)
Historicalem
issions
Historical+
EIEE
RCP2.6through20
50RCP4.5through20
50RCP6.0through20
50RCP8.5through20
50
Alaska
5037
–61
5238
–62
5238
–62
5239
–63
5239
–63
5339
–64
Alabam
a59
32–87
6236
–90
6336
–90
6438
–92
6437
–91
6640
–94
California
1,83
51,12
6–2,53
91,92
21,22
1–2,62
71,93
61,23
7–2,64
11,97
51,28
1–2,68
21,96
71,27
2–2,67
32,02
51,33
6–2,73
2Connecticu
t18
210
2–26
319
111
1–27
219
311
2–27
419
711
6–27
819
611
5–27
720
312
1–28
4Dist.ofColumbia
156–
2417
7–25
177–
2518
7–25
187–
2518
8–25
Delaw
are
8648
–13
691
52–14
292
52–14
494
54–14
794
54–14
697
56–15
1Florida
8,29
75,75
1–10
,003
8,57
26,10
5–10
,160
8,61
76,16
2–10
,185
8,74
86,31
3–10
,262
8,71
96,28
3–10
,245
8,90
36,48
2–10
,358
Geo
rgia
314
159–
393
329
180 –
397
331
184–
398
337
194–
400
336
191–
399
344
206–
402
Haw
aii
272
201–
323
280
211–
329
281
212–
330
285
217–
332
284
216–
332
289
222–
336
Louisiana
1,74
01,38
3–2,02
51,77
91,42
7–2,05
61,78
51,43
4–2,06
11,80
21,45
5–2,07
51,79
81,45
0–2,07
21,82
41,48
1–2,09
1Massach
usetts
625
433–
793
644
457–
812
648
461–
815
657
472–
824
655
470–
822
668
486–
836
Marylan
d25
714
8–37
726
916
0–39
027
216
2–39
227
816
8–39
727
616
6–39
628
617
5–40
4Maine
3317
–53
3519
–55
3519
–56
3620
–57
3620
–57
3721
–58
Mississippi
106
43–17
911
451
–18
811
652
–18
912
056
–19
411
955
–19
312
561
–19
9NorthCarolin
a36
824
2–50
838
325
9–52
938
626
1–53
239
326
9–54
239
126
7–54
040
227
8–55
4New
Ham
pshire
1610
–23
1711
–24
1711
–24
1711
–24
1711
–24
1812
–25
New
Jersey
956
634–
1,25
599
367
4–1,28
699
968
0–1,29
21,01
669
9–1,30
71,01
269
5–1,30
41,03
672
2–1,32
5New
York
1,91
71,05
1–2,71
12,01
01,14
8–2,80
02,02
51,16
4–2,81
52,06
91,21
1–2,85
82,05
91,20
1–2,84
92,12
21,26
7–2,91
1Oregon
4024
–53
4226
–55
4227
–55
4327
–56
4327
–55
4429
–57
Pennsylvan
ia10
535
–19
411
441
–20
711
542
–20
912
046
–21
611
945
–21
412
550
–22
4RhodeIsland
5227
–78
5429
–81
5530
–81
5631
–83
5631
–83
5833
–85
South
Carolin
a50
129
2–67
852
531
8–69
452
932
3–69
654
033
5–70
453
833
2–70
255
435
0–71
2Te
xas
618
332–
1,02
766
136
3–1,08
066
936
8–1,08
969
238
2–1,11
568
737
9–1,10
972
140
0–1,14
9Virginia
1,15
463
0–1,38
21,19
071
8–1,39
51,19
673
2–1,39
71,21
177
4–1,40
31,20
876
5–1,40
21,23
182
2–1,41
0W
ashington
161
113–
200
166
119–
206
167
120–
206
169
123–
209
168
123–
208
172
127–
212
UStotal
19,758
12,876
–25
,363
20,512
13,779
–25
,961
20,634
13,927
–26
,058
20,989
14,339
–26
,344
20,912
14,252
–26
,281
21,420
14,822
–26
,696
Projectionsassumeze
road
ditional
emissionsafterem
issionsen
ddates
listed,e
xcep
tforthehistorical+
EIEI
scen
ario.E
IEIistheex
pectedfuture
emissionsim
plie
dbyex
istingen
ergyinfrastructure,a
sestimated
inref.23
.Theye
arsshownrelate
toem
issionsan
dassociated
commitmen
ts,n
otthetimingofen
suingwarmingorSL
R.L
evelsofco
mmittedwarmingan
dSLRassociated
withea
chscen
ario
areshownin
Table
S2.
UStotalsincludeonly
thelistedstates
andtheDistrictofColumbia.
Strauss et al. www.pnas.org/cgi/content/short/1511186112 11 of 13

Table S11. Coastal state and US total 2010 census populations living on land falling below future committed high tide lines underdifferent emissions scenarios through 2100, assuming the inevitable collapse of the WAIS under any scenario (triggered case)
State
Population (in thousands of persons) living below committed sea levels by scenario: median (white) and 17th–83rdpercentile estimates (shaded)
RCP 2.6 through 2100 RCP 4.5 through 2100 RCP 6.0 through 2100 RCP 8.5 through 2100
Alaska 52 38–62 54 40–64 57 44–67 65 55–76Alabama 63 37–91 68 41–96 76 49–108 100 71–149California 1,947 1,249–2,652 2,070 1,382–2,776 2,282 1,595–2,990 2,904 2,197–3,602Connecticut 194 113–275 208 125–289 228 145–309 284 203–363District of Columbia 17 7–25 19 8–26 21 11–28 26 19–34Delaware 92 53–145 100 59–155 112 68–171 154 99–220Florida 8,654 6,209–10,206 9,014 6,633–10,443 9,502 7,336–10,777 10,595 9,253–11,458Georgia 333 186–398 350 216–403 372 258–412 406 358–432Hawaii 282 214–330 292 227–339 309 250–353 353 308–395Louisiana 1,790 1,440–2,065 1,843 1,504–2,104 1,925 1,612–2,164 2,131 1,880–2,325Massachusetts 650 464–818 677 497–846 717 543–887 832 664–1,004Maryland 273 164–393 293 181–410 325 210–434 409 292–505Maine 35 19–56 38 22–60 43 25–65 57 36–79Mississippi 117 53–191 129 65–203 150 82–221 211 138–254North Carolina 388 263–535 410 286–565 446 319–610 574 416–714New Hampshire 17 11–24 18 12–25 20 13–27 24 17–32New Jersey 1,003 685–1,296 1,054 741–1,342 1,130 822–1,416 1,332 1,044–1,635New York 2,037 1,178–2,827 2,169 1,318–2,957 2,366 1,547–3,159 2,922 2,134–3,738Oregon 42 27–55 45 30–58 48 34–65 61 46–80Pennsylvania 117 43–211 129 53–231 150 71–261 227 127–339Rhode Island 55 30–82 59 34–86 66 40–93 85 58–113South Carolina 532 326–698 566 363–719 617 421–752 728 580–841Texas 675 372–1,096 747 418–1,182 873 500–1,345 1,262 811–1,856Virginia 1,200 744–1,399 1,248 858–1,416 1,316 1,001–1,444 1,418 1,254–1,538Washington 167 121–207 174 130–215 185 144–230 220 178–278
US total 20,734 14,048–26,138 21,775 15,242–27,010 23,338 17,142–28,387 27,379 22,240–32,061
Projections assume zero additional emissions after emissions end dates listed. The years shown relate to emissions and associated commitments, not to thetiming of ensuing warming or SLR. Levels of committed warming and SLR associated with each scenario are shown in Table S1. US totals include only the listedstates and the District of Columbia.
Strauss et al. www.pnas.org/cgi/content/short/1511186112 12 of 13

Table S12. Coastal state and US total 2010 census populations living on land falling below future committed high tide lines underdifferent fixed long-term warming scenarios, assuming the inevitable collapse of the WAIS under any scenario (triggered case)
State
Population (in thousands of persons) living below committed sea levels by scenario: median (white) and 17th–83rdpercentile estimates (shaded)
1.5 °C warming 2 °C warming 3 °C warming 4 °C warming
Alaska 53 40–64 56 43–67 61 50–72 74 63–84Alabama 67 40–94 75 48–105 89 62–132 143 96–179California 2,035 1,346–2,741 2,235 1,552–2,943 2,639 1,933–3,339 3,546 2,848–4,134Connecticut 204 122–285 225 142–306 258 177–339 344 264–416District of Columbia 19 8–26 21 11–27 24 15–32 33 24–39Delaware 98 57–152 110 67–168 134 85–199 206 141–271Florida 8,924 6,512–10,375 9,422 7,193–10,714 10,119 8,513–11,191 11,380 10,449–11,921Georgia 345 208–402 368 250–410 395 322–426 430 402–444Hawaii 290 223–336 305 244–350 334 286–376 396 353–426Louisiana 1,828 1,485–2,094 1,909 1,591–2,152 2,050 1,772–2,257 2,304 2,106–2,461Massachusetts 669 488–837 712 537–882 779 610–951 959 787–1,128Maryland 287 176–405 320 205–431 375 254–472 483 387–583Maine 37 21–59 42 25–64 50 31–72 73 51–96Mississippi 126 62–199 146 78–218 186 112–244 252 203–265North Carolina 403 279–556 439 313–602 514 372–671 693 544–805New Hampshire 18 12–25 20 13–27 22 16–29 30 23–37New Jersey 1,039 725–1,328 1,119 810–1,404 1,243 943–1,537 1,564 1,268–1,863New York 2,130 1,276–2,918 2,338 1,514–3,130 2,671 1,876–3,481 3,550 2,735–4,285Oregon 44 29–57 48 33–63 54 41–74 78 58–90Pennsylvania 125 50–225 147 69–256 190 102–305 315 200–408Rhode Island 58 33–85 65 39–92 76 50–104 106 77–135South Carolina 556 353–713 608 410–746 684 511–803 825 709–908Texas 726 404–1,156 847 482–1,309 1,078 659–1,640 1,795 1,208–2,231Virginia 1,234 828–1,411 1,305 984–1,439 1,382 1,155–1,490 1,509 1,398–1,645Washington 172 127–213 183 141–227 204 164–257 270 214–322
US total 21,487 14,903–26,756 23,064 16,796–28,132 25,611 20,112–30,496 31,358 26,608–35,175
Pure warming scenarios assume long-term fixed warming levels, and make no predictions about the timing of ensuing SLR. Levels of committed SLRassociated with each scenario are shown in Table S1. US totals include only the listed states and the District of Columbia.
Strauss et al. www.pnas.org/cgi/content/short/1511186112 13 of 13