supporting information si materials and methods cell ... · pdf filesupporting information si...
TRANSCRIPT

1
Supporting Information
SI Materials and Methods
Cell culture and materials. RAW 264.7, SH-SY5Y, HSF (human skin fibroblasts), HEK293,
BV2, MCF-7 and HeLa cells were grown in Dulbecco’s modified Eagle’s medium (DMEM)
containing 10% fetal bovine serum and 50 g/ml streptomycin and penicillin. For the
cultivation of A549, H322, H460, HCT116, and Jurkat cells, we used RPM1640 medium with
the same supplements as above. Rabbit polyclonal antibodies raised against the full-length
human GRS, KRS, YRS, p-PP2APP2A and N-terminal human CDH6 (Abcam,
Cambridge, UK) were used for Western blot analysis. Polyclonal anti-ERK, p-ERK, p38, p-
p38, JNK and p-JNK antibodies were purchased from Cell Signaling (Danvers, MA).
Monoclonal anti-tubulin, GAPDH and LDH antibodies were purchased from Sigma (St.
Louis, MO). Si-RNAs of 5 -́UUUCAUAGAACUCAGCAAAUUCUGG-3 ́ and 5 -́
UAAUAAUGAAGAGAUCUCCUGCUCC-3 ́ targeting CDH6 were obtained from
Invitrogen (Carlsbad, CA). Stealth universal RNAi (Invitrogen) was used as a negative
control.
Preparation of recombinant human GRS. Human GRS cDNA encoding 685 amino acids
was subcloned into pET-28a (Novagen, Madison, WI) at sites for EcoRI and XhoI restriction
enzymes, and overexpressed in E. coli Rosetta (Novagen) by IPTG induction. His-tagged
GRS was then purified using nickel affinity chromatography (Invitrogen) following the
manufacturer’s instruction. To remove lipopolysaccharide (LPS), the protein solution was
dialyzed in 10 mM pyrogen-free potassium phosphate buffer (pH 6.0) containing 100 mM
NaCl. After dialysis, the GRS-containing solution was loaded to polymyxin resin (Bio-Rad)
pre-equilibrated with the same buffer, incubated for 2 h, and then eluted. To further remove

2
residual LPS, the solution was dialyzed again in PBS containing 20% glycerol, and filtered
through Acrodisc unit with the Mustang E membrane (Pall Gelman Laboratory, Ann Arbor,
USA)
GRS secretion assay. RAW 264.7 cells were cultivated to 70% confluency. The cells were
then washed twice and further cultivated in serum-free or glucose-deprived DMEM medium.
In addition, we added adriamycin (1 g/ml, Calbiochem, San Diego, CA), TNF- (1 ng/ml,
BD Pharmingen, San Diego, CA) with cycloheximide (1 g/ml, Sigma, St. Louis, MO), Fas-
ligand (10 ng/ml, Millipore, Billerica, MA) or Anti-Fas antibody (5 g/ml, clone CH11,
Millipore) to the serum-free medium. The culture media was collected at the indicated times,
and centrifuged at 500g for 10 min and 20,000g for another 15 min to remove contaminants.
Proteins were preciptitated from the supernatants with 10% TCA for 12 h at 4°C and then
centrifuged at 18,000g for 15 min. The pellets were harvested, resuspended with 100 mM
HEPES buffer (pH 8.0), separated by 10% SDS/PAGE and the proteins were transferred to
PVDF membrane for immunoblotting with polyclonal anti-GRS antibody. Some of the
supernatants were pre-cleared with an anti-IgG antibody, and incubated with anti-GRS
antibody for 2 h at 4°C. Protein A agarose (Invitrogen) was then added and the mixture was
incubated for 4 h at 4°C. The protein A agarose beads were next precipitated and washed 3
times with 50 mM Tris-HCl buffer (pH 7.5) containing 150 mM NaCl, 1% Triton X-100, 10
mM NaF, 1 mM sodium orthovanadate, 10% glycerol and protease inhibitors (Calbiochem)
and the bound proteins were eluted using the sample buffer.
Cell necrosis assay and assessment of plasma membrane integrity. RAW 264.7 cells were
seeding onto a 6-well dish and incubated for 12 h. Cells were then washed twice and further
incubated with indicated conditioned medium. To measure the LDH content of the culture

3
media, the conditioned medium were collected and then centrifuged at 2,000g for 15 min.
The supernatant was harvested and the LDH enzyme activity was measured using a LDH-
cytotoxicity assay kit (BioVision, Mountain view, CA), following the manufacturer’s
instructions. By expressing the released LDH as a percentage of the total cellular LDH, cell
viability could be calculated. To monitoring the membrane integrity by immunofluorescence
staining, cells were seeded on 22x22 mm cover glasses and incubated for 24 h. The culture
dishes were washed twice by PBS and incubated with the indicated conditioned medium. The
cells were fixed for 10 min in 4% paraformaldehyde, and rinsed twice with cold PBS. The
cover glasses were incubated with 3% CAS in PBS for 30 min and then incubated with a 50
g/ml propidium iodide, 5 M Yo-Pro-1 (Invitrogen) solution in PBS for 1 h. Nuclei were
stained using 4’,6-diamidino-2-phenylindole dihydrochloride (DAPI). The cells were
mounted and observed via fluorescence microscopy (Nikon C-1 confocal microscope).
Cell binding assay. Cells were seeded onto 6-well dishes and incubated for 12 h.
Biotinylated GRS was then added to the culture medium and further incubated for the
indicated times. The cells were washed 4 times with cold PBS and then lysed in 50 mM Tris-
HCl (pH 7.4) lysis buffer containing 150 mM NaCl, 2 mM EDTA, 1% Triton X-100, 1%
sodium deoxycholate, 10 mM NaF, 1 mM sodium orthovanadate, 10% glycerol and protease
inhibitors, and the mixture was centrifuged at 18,000g for 15 min. The extracted proteins (30
g) were resolved by SDS/PAGE, and detected by streptavidin-coupled Horseradish
peroxidase (HRP) (Pierce, Rockford, IL). For biotinylation, recombinant GRS (1.5 mg) was
incubated with 0.25 mg sulfo-NHS-SS-biotin (Pierce) in PBS for 2.5 h at 4°C. To monitor
cell binding of GRS by immunofluorescence staining, cells were seeded on 22x22 mm cover
glasses and incubated for 12 h. The culture dishes were then incubated with biotinylated GRS
and biotinylated BSA for 1 h. The cells were fixed for 10 min in 4% paraformaldehyde, and

4
rinsed 2 times with cold PBS. The cover glasses were incubated with 3% CAS in PBS for 30
min and the bound biotin-labeled GRS was then captured with Alexa488-conjugated
streptavidin (Invitrogen). The cells were mounted and observed via confocal
immunofluorescence microscope. To monitoring cell binding of GRS by flow cytometry,
cells were transfected with specific si-RNA and incubated for 48 h. Cells, which were treated
as described above, were washed 3 times with PBS, and stained with Alexa488-conjugated
streptavidin (Invitrogen) in FACS buffer (PBS containing 2% BSA) for 1 h. After then, cells
were washed 3 times with PBS. Cells were analyzed by flow cytometry using CellQuest
software (BD Biosciences, Mountain view, CA).
Apoptosis assay. The tested cells were treated with different concentrations of recombinant
GRS at the indicated times and harvested. After washing with PBS, the cells were fixed in 70%
ethanol for 1 h and stained with 50 g/ml propidium iodide solution in PBS. Twenty thousand
cells per sample were read by fluorescence-activated cell sorting (FACS) using CellQuest
software (BD Biosciences). For MTT assay, 20 l of MTT solution (5 mg/ml) was added to
150 l culture medium. After 4 h incubation, 200 l DMSO was added. The absorbance at
570 nm was measured with a microplate reader (TECAN, Mannedorf, Swiss). The generation
of active-caspase 3 from pro-caspase 3 was determined by immunoblotting using their
respective antibodies (Cell Signaling).
Soluble receptor binding assay. Human cDNAs that encode extracellular region of
cadherins were subcloned into pYK602, which were constructed to facilitate Fc-fusion
protein purification in mammalian cell, at site for sfi I restriction enzymes. These clones were
transfected into 293E cells, and after 24hr, transfected 293E cells were incubated with serum
free DMEM for 3 days. Cultured media were harvested and incubated with protein A agarose

5
bead. Bead-bound Fc-fusion proteins were eluted and dialyzed. To identifying the receptor of
GRS, a Maxisorp plate (Nunc, Rochester, NY) was used for ELISA detection. The plate were
coated with purified his-tagged GRS (1 g/ml) or BSA (1 g/ml) in phosphate buffer saline
and then blocked (PBS, 4% non-fat milk). Fc-fusion cadherin family proteins (1 g/ml) were
added to the plate and after washing with PBST (0.05% Tween20), the plates were incubated
with anti-human IgG1 Fc-HRP (Thermo, Waltham, MA). The plates were then washed, added
with TMB (3,3’5,5’-tetramethly-benzidine) solution and read at 450 nm using a microplate
reader (TECAN, Mannedorf, Swiss). For confirming the interaction, purified Fc-CDH2, 6, 18
(1 g/ml) were incubated with His-GRS (1 g/ml) for 2 h. The reactions were subjected to
immuno-precipitation of the Fc-fused cadherins with protein A/G agarose, and analyzed by
immunoblotting with anti-GRS to detect the complexes.
Surface plasmon resonance analysis. Binding of GRS to the cadherin-Fc fusion proteins
was determined by the SPR technique using a ProteOn XPR36 Protein Interaction Array
System (BioRad). CDH6, 18 and IgG (negative control) were immobilized on a GLC gold
chip via the amine coupling method according to the manufacturer’s instructions (~1000 RU
each). Various concentrations of purified GRS were applied to the flow cell in phosphate-
based saline containing 0.005% Tween 20 at 100 L/min for 60 sec and then dissociated for
600 sec. The binding was determined by the change in resonance units (RU), where one
resonance unit is defined as 1 pg/mm2. The Sensogram was processed by subtracting the
binding response recorded from the control surface. The equilibrium dissociation constants
were calculated using Proteon ManagerTM
software (ver 2.1). The data was evaluated using a
Langmuir 1:1 binding model.
Xenograft mice model. Animal experiments complied with the University Animal Care and

6
Use Committee guidelines at Seoul National University. The tumorigenicity of HCT116 was
tested by subcutaneous injection of 3 x 10⁷
cells in BALB/c nude female mice using a 20-
gauge needle and allowed to grow. Tumor growth in animals was checked every 2 days, and
if tumor formation was observed, tumors were measured using a caliper. (Tumor volume was
calculated as length x width2 x 0.52.) For the regression model, tumor cells were grown for 9
days, and His-tagged human GRS protein was then injected by intra-tumor injection. For the
growth model, tumor cells were injected with or without His-GRS protein. After sacrifices,
tumor weights were measured and embedded in optimal cutting temperature (OCT)
compound for immunofluorescence staining. The frozen sections (10 m) were attached to
the slides, treated with PBS and fixed with 4% paraformaldehyde, blocked with PBS
containing 2% CAS, and stained with Yo-Pro-1 (Invitrogen) at 37° C for 2 h. We washed the
slides with PBS containing 0.1% Tween 20 (Sigma) and the nuclei were stained with DAPI
(Invitrogen) at 37°C for 20 min. The sections were mounted and observed via confocal
immunofluorescence microscope (Nikon C-1 confocal microscope).
Cytochrome C release assay. Translocation of cytochrome C was examined using western
blot analysis. HeLa cells were incubated with 150 nM GRS for indicated times and the
harvested cells were resuspended in 20 mM of HEPES (pH 7.5) hypotonic buffer containing
10 mM potassium chloride, 1.5 mM MgCl2, 0.5 mM EDTA, 1 mM DTT and protease
inhibitors (Calbiochem) for 5 min on ice, and then homogenized 6 times. The samples were
centrifuged at 10,000g for 10 min. The proteins in the supernatants were subjected to SDS-
PAGE and were then probed with polyclonal antibodies against cytochrome C and tubulin.
7
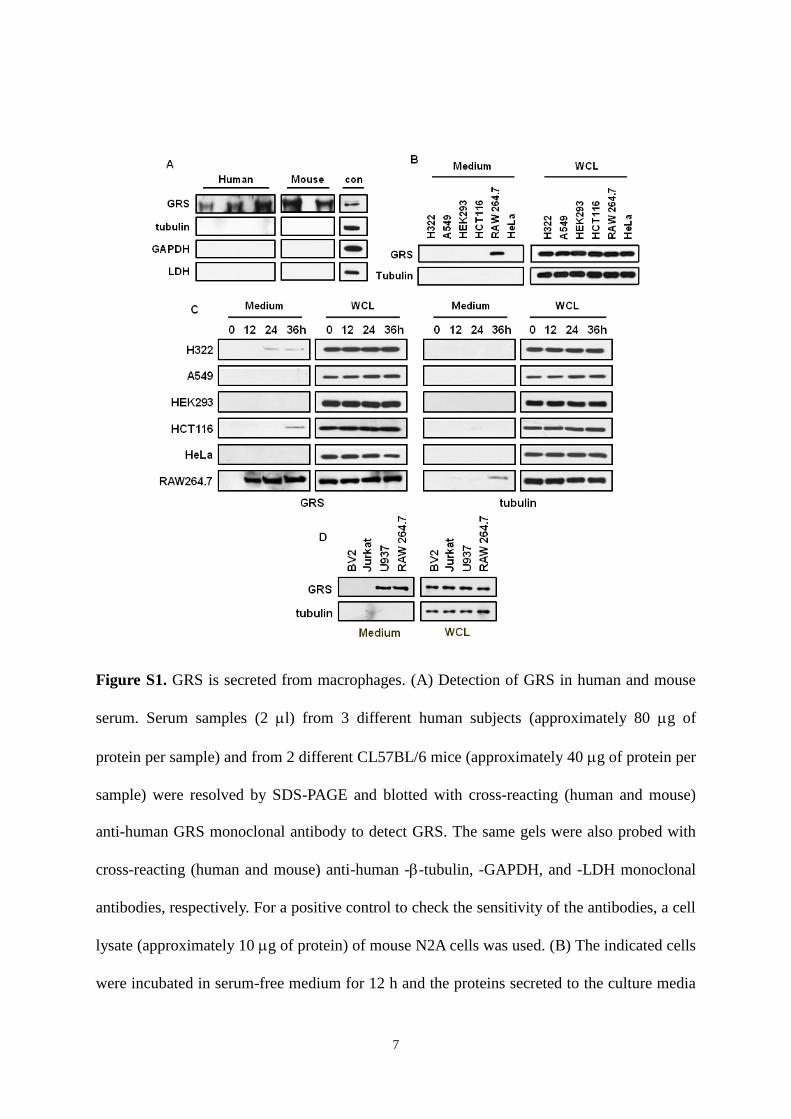
Figure S1. GRS is secreted from macrophages. (A) Detection of GRS in human and mouse
serum. Serum samples (2 l) from 3 different human subjects (approximately 80 g of
protein per sample) and from 2 different CL57BL/6 mice (approximately 40 g of protein per
sample) were resolved by SDS-PAGE and blotted with cross-reacting (human and mouse)
anti-human GRS monoclonal antibody to detect GRS. The same gels were also probed with
cross-reacting (human and mouse) anti-human --tubulin, -GAPDH, and -LDH monoclonal
antibodies, respectively. For a positive control to check the sensitivity of the antibodies, a cell
lysate (approximately 10 g of protein) of mouse N2A cells was used. (B) The indicated cells
were incubated in serum-free medium for 12 h and the proteins secreted to the culture media

8
were precipitated with TCA and subjected to immunoblotting with anti-GRS antibody (left).
The possibility of cell necrosis was monitored by immunoblotting for tubulin. Expression
levels of GRS were determined by immunoblotting of GRS in whole cell lysates (WCL)
(right). (C) The time course of GRS secretion from different cell types in serum-free medium
was monitored at the indicated times. (D) The secretion of GRS from microglia (BV2), T
lymphocyte (Jurkat), and macrophage-like monocyte cells (U937) was determined in serum-
free medium for 12 h as described above. Molecular weight of examined proteins (kDa):
GAPDH (37) and LDH (35).

9
Figure S2. Conditions for GRS secretion. (A) RAW 264.7 cells were treated with estrogen
(50 nM), EGF (100 ng/ml), TNF- (20 ng/ml) and adriamycin (Adr, 1 g/ml) and the
secretion of GRS was determined at the indicated times. (B) RAW 264.7, HCT116 and HeLa
cells were treated with adriamycin (1 g/ml) or TNF- (1 ng/ml) with cycloheximide (CHX,
1 g/ml), or incubated in glucose-deprived medium (-Glu) for the indicated times, and the
secretion of GRS from the indicated cells was determined. (C) U937 cells were also tested for
GRS secretion resulting from the indicated stimuli. (D) RAW 264.7 cells were treated with
adriamycin (Adr) and the secretion of three different ARSs (GRS, KRS and YRS) was
determined.

10
Figure S3. Secretion of GRS does not result from cell lysis. RAW 264.7 cells were subjected
to adriamycin (Adr), glucose deprivation (-Glu) and Fas ligand (Fas) treatment for 4 h. As a
positive control, the cells were irradiated by UV (200 J/m2) for 18 h. Cell death and viability
were determined by sub-G1 cell population using FACS analysis (A), and MTT assay (B),
respectively. (C) Extracellular LDH enzyme activity was determined with a LDH cytotoxicity
kit (BioVision, Mountain view, CA) under the same conditions. (D) The plasma membrane
integrity was determined by immunofluorescence staining. Macrophages were fixed with 4%
paraformaldehyde, treated with Yo-pro (green) and propidium iodide (red), and analyzed by
immunofluorescence microscopy. Nuclei were stained with DAPI (blue). Error bars give the
mean standard deviation from the average of 3 experiments.
Figure S4. Identification of the targets cells by cell binding and effects of GRS on different
mediator of apoptosis. (A) HeLa and HCT116 cells were treated with biotinylated GRS (30
nM) at the indicated time and the cell binding of GRS was determined by immunoblotting. (B)

11
To see whether the binding of biotinylated GRS is specifically competed by unlabelled GRS,
HeLa cells were pre-treated with His-GRS (150 nM) or untreated for 15 min and then
biotinylated GRS (30 nM) was added and incubated for 30 min. Cell binding of biotinylated
GRS was monitored by immunoblotting. (C) HCT116 cells were incubated with the different
concentrations of biotinylated GRS or BSA for 1 h. To see whether the binding of
biotinylated GRS (30 nM) is specifically competed by unlabelled GRS, the cells were also
pre-incubated with unlabelled GRS (150 nM). The binding of biotinylated GRS to HCT116
cells was monitored by immune-fluorescence staining with Alexa488-conjugated streptavidin.
(D) The effect of GRS on cytochrome C release from mitochondria was determined.
Molecular weight of examined protein (kDa): cytochrome C (15).
Figure S5. Determination of GRS binding to CDH6. To calculate the dissociation constant
(KD), Fc-fusion cadherin (CDH18) (A) or Fc protein (IgG) (B) were immobilized to a gold
chip and GRS (31.25 nM~1000 nM) was flowed on the surface. Binding between cadherin
and GRS was determined by SPR as described in Methods. (C) HCT116 cells were

12
transfected with non-specific siRNA (si-con) or siRNA targeting CDH6 (si-CDH6 #1 and #2)
for FACS analysis, treated with GRS (100 nM), and the protein level of CDH6 was
determined by immunoblotting.
Figure S6. Correlation between CDH6 and phosphorylation of ERK. (A) HCT116 cells were
treated with GRS (150 nM) for the indicated times and the effect on the phosphorylation of
ERK, p38 MAPK and JNK was determined by immunoblotting. (B) The effect of GRS on the
death of Ras-transfected HEK293 cells was also determined at sub-G1 using flow cytometry.
13
(C) Comparison of cellular levels of CDH6 and EKR phosphorylation in different cancer cell
lines by immunoblotting. Tubulin is a loading control. (D) HEK293 cells were transfected
with each of Flag-tagged K-, N- and H-RAS (oncogenic mutants) and their effect on CDH6
levels was determined by western blotting. HCT116 cells were treated with GRS and its
effect on the phosphorylation of MEK1 (E) and PP2AF)was determined by
immunoblotting. The bands of p-PP2A and total PP2A were quantified and the ratios of p-
PP2A to total PP2A are shown below the panel. Error bars give the mean standard
deviation from the average of 3 experiments. Molecular weight of examined proteins (kDa):
p-PP2A (35) and PP2A.

14
Figure S7. Determination of in vivo anti-tumor effects and toxicity of GRS. (A) The body
weight of the control and GRS-treated groups (HCT116 cell xenograft mice) at the indicated
doses were measured. (B) HCT116 cells were injected into the BALB/c nude mice with 20
g GRS or PBS (n=5 animal/group), and grown for 15 days. The tumor volumes were
measured. (C) Photographs of the two representative HCT116 xenograft tumor mice from the
control (right) and treated (left, 20 g GRS) arms 15 days after injection. (D) Tumor weights

15
of the control and treated mice were determined 15 days after injection. (E) The body weight
of the control and GRS-treated (simultaneous injection of GRS and cells) groups were
measured (n=5). (F) The OCT compound-embedded tissues (a section of 10 m) were used
for immunofluorescence staining. The body weights of SN12 (G) and RENCA cell (H)
xenograft mice were measured (n =5). Error bars represent standard deviation.
Figure S8. Sequence and surface comparison between the members of cadherin family
(A) Sequence relationship of classic cadherin members in humans. Extracellular sequences of
17 cadherins were aligned and analyzed by ClustalW (1). Phylogenetic tree was calculated

16
using ClustalW phylogeny tool by neighbor joining method. Cadherins that were tested for
interaction with human GRS are underlined. (B) Surface conservation of CDH6 and 18
compared to other members in the classic cadherin family. CDH6- and 18-specific sequences
are color-coded, spread over the extracellular region, and are slight more concentrated on the
CR4 and CR5 domains.
SI reference
1. Li K-B (2003) ClustalW-MPI:ClustalW analysis using distributed and parallel computing.
Bioinformatics 19:1585-1586.