supporting information - royal society of chemistry · 2017-03-20 · supporting information ......
TRANSCRIPT
S1
SUPPORTING INFORMATION
Polymers from sugars and CO2: ring-opening polymerisation and copolymerisation of cyclic carbonates derived from 2-deoxy-ᴅ-ribose
Georgina L. Gregory, Gabriele Kociok-Köhn and Antoine Buchard*
Department of Chemistry, Centre for Sustainable Chemical Technologies,
University of Bath, Claverton Down, Bath BA2 7AY, UK
Email: [email protected]
Table of Contents
1. NMR Spectra ....................................................................................................... 2
2. Conversion versus Time for homopolymerisation of 1α ...................... 12
3. Mn and Ð versus conversion ......................................................................... 12
4. Reactivity Ratios .............................................................................................. 13
5. 1β and TMC copolymerisation kinetics ..................................................... 14
6. SEC Traces ........................................................................................................ 15
7. MALDI-ToF Mass Spectrometry ................................................................... 17
8. TGA-MS .............................................................................................................. 19
9. Selected DSC Traces ...................................................................................... 19
10. Powder Diffraction ........................................................................................... 21
11. DFT Calculations.............................................................................................. 21
11.1 Initiation Step in the ROP of 1α, 1β and TMC .................................... 21
11.2 Monomer Ring Strain ............................................................................. 25
11.2.1 Thermodynamics of ring-opening with MeOH/iPrOH ................. 25
11.2.2 Isodesmic reaction with dimethylcarbonate ................................ 26
12. Single Crystal X-Ray Structures .................................................................. 28
13. References ......................................................................................................... 30
Electronic Supplementary Material (ESI) for Polymer Chemistry.This journal is © The Royal Society of Chemistry 2017

S2
1. NMR Spectra
Fig. S1 1H NMR spectrum (400 MHz, CDCl3) of 1α.
Fig. S2 13C{1H} NMR spectrum (101 MHz, CDCl3) of 1α.

S3
Fig. S3 DEPT135 of 1α in CDCl3.
Fig. S4 COSY of 1α in CDCl3.

S4
Fig. S5 HSQC of 1α in CDCl3.
Fig. S6 1H NMR spectrum (400 MHz, CDCl3) of 1β.

S5
Fig. S7 13C{1H} NMR spectrum (101 MHz, CDCl3) of 1β.
Fig. S8 DEPT135 of 1β in CDCl3.

S6
Fig. S9 COSY of 1β in CDCl3.
Fig. S10 HSQC of 1β in CDCl3.

S7
Fig. S11 Complete 13C{1H} NMR spectrum (400 MHz, HFIP-d2) of poly(1α). Small additional resonances are assigned to unreacted monomer and benzoic acid used to quench the polymerisation.
Fig. S12 1H NMR spectrum (400 MHz, CDCl3) of poly(TMC-co-47mol%-1α): Mn, NMR = 7320 g
mol-1 (linear polymer: 25 1α and 28 TMC repeat units), Mn,SEC = 6380 g mol-1 (Ð 1.19), Mn,calc=
6870 g mol-1 (Table 1, Entry 2).

S8
Fig. S13 COSY spectrum (400 MHz, CDCl3) of poly(TMC-co-47mol%-1α).
Fig. S14 HSQC of poly(TMC-co-47mol%-1α).

S9
Fig. S15 13C{1H} NMR spectrum (101 MHz, CDCl3) of poly(TMC-co-47mol%-1α).
Fig. S16 DEPT135 of poly(TMC-co-47mol%-1α).

S10
Fig. S17 DOSY Spectra (CDCl3) of poly(TMC-co-47mol%-1α).
CHCl3
polymer
grease
S11
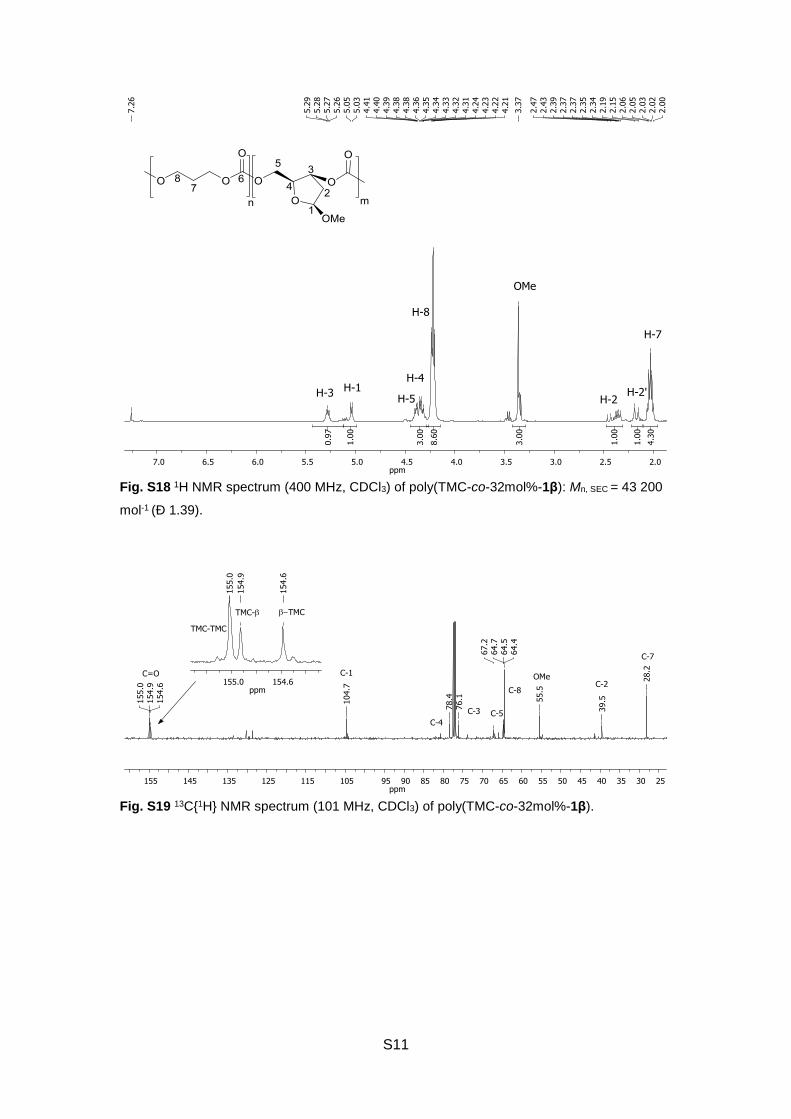
Fig. S18 1H NMR spectrum (400 MHz, CDCl3) of poly(TMC-co-32mol%-1β): Mn, SEC = 43 200
mol-1 (Ð 1.39).
Fig. S19 13C{1H} NMR spectrum (101 MHz, CDCl3) of poly(TMC-co-32mol%-1β).

S12
2. Conversion versus Time for homopolymerisation of 1α
Fig. S20 Conversion of 1α as a function of time for a homopolymerisation carried out at rt, [M]0
= 5 mol L-1 in CH2Cl2 and [M]0: [TBD]0: [BnOH]0= 1000:1:1. Conversions were determined by
1H NMR spectroscopy (CDCl3) from aliquots quenched with benzoic acid.
3. Mn and Ð versus conversion
Fig. S21 Linear increase in Mn with monomer conversion whilst maintaining a relatively narrow
dispersity (Ð < 1.2) for a copolymerisation with 1α: TMC feed ratio of 50:50, 1000:1:20
[M]0:[TBD]0:[BnOH]0, [Mt]0 = 5 mol L-1 in CH2Cl2 at rt. Monomer conversion was determined by
integration of the 1H NMR spectra of aliquots taken at specific times and quenched with benzoic

S13
acid. For these aliquots, Mn and Ð were estimated by SEC (RI detector) with CHCl3 eluent
versus polystyrene standards.
4. Reactivity Ratios
Polymerisations were carried out at rt with [Mt]0: [TBD]0: [BnOH]0 ratio of
1000:1:1 and [Mt]0 = 5 mol L-1 in CH2Cl2 for different feed ratios of 1α and TMC
(fα and fTMC). Polymerisations were quenched below 15% monomer conversion
(<10 minutes) and the copolymer compositions of 1α and TMC (Fα and FTMC)
determined by 1H NMR spectroscopy.
G=HrTMC -rα
G = 𝑓TMC(2𝐹TMC – 1)
(1−𝑓TMC)𝐹TMC) H =
𝑓TMC2 (1−𝐹TMC)
(1−𝑓TMC)2𝐹TMC
Fig. S22 Calculation of reactivity ratios: rα and rTMC using the Finemann-Ross method.
S14
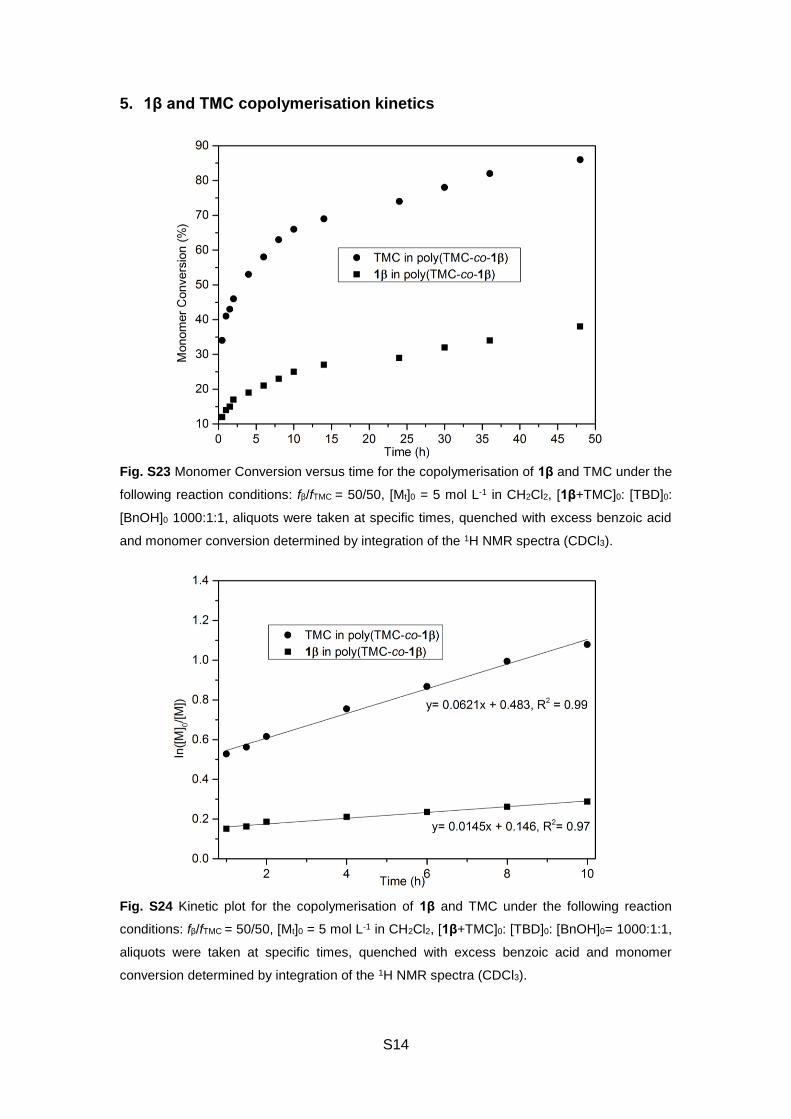
5. 1β and TMC copolymerisation kinetics
Fig. S23 Monomer Conversion versus time for the copolymerisation of 1β and TMC under the
following reaction conditions: fβ/fTMC = 50/50, [Mt]0 = 5 mol L-1 in CH2Cl2, [1β+TMC]0: [TBD]0:
[BnOH]0 1000:1:1, aliquots were taken at specific times, quenched with excess benzoic acid
and monomer conversion determined by integration of the 1H NMR spectra (CDCl3).
Fig. S24 Kinetic plot for the copolymerisation of 1β and TMC under the following reaction
conditions: fβ/fTMC = 50/50, [Mt]0 = 5 mol L-1 in CH2Cl2, [1β+TMC]0: [TBD]0: [BnOH]0= 1000:1:1,
aliquots were taken at specific times, quenched with excess benzoic acid and monomer
conversion determined by integration of the 1H NMR spectra (CDCl3).

S15
6. SEC Traces
Fig. S25 SEC trace (RI detector versus PS standards, CHCl3 eluent) of poly(TMC-co-66mol%-1α) from Table 1, Entry 1.
Fig. S26 SEC trace (RI detector versus PS standards, CHCl3 eluent) of poly(TMC-co-54mol%-1α) from Table 1, Entry 4.

S16
Fig. S27 SEC trace (RI detector versus PMMA standards, HFIP eluent) of poly(1α) from Table 2, Entry 1. Peak 1 corresponds to an Mn of 25 600 g mol-1 (Ð 1.41) and peak 2 to Mn 1810 g
mol-1 (Ð 1.10).
Fig S28 SEC trace (RI detector versus PS standards, CHCl3 eluent) of poly(TMC-co-32mol%-1β).

S17
7. MALDI-ToF Mass Spectrometry
Fig. S29 MALDI-ToF MS of poly(1α) showing cyclic polymeric series [Pc+ H]+ (e.g. DP = 26
gives m/z 4528.91) and linear polymer series with benzyl alcohol end-group, [PL+ Na]+ (e.g. DP
= 24 gives m/z 4310.73).The less intense red series may be assigned to the sodium adduct of
the linear polymer with the loss of 1 CO2.

S18
Fig. S30 MALDI-ToF MS of poly(TMC-co-47mol%-1α) (Table 1, Entry 2), with benzyl alcohol
and -OH end groups, flying as the sodium adduct.
TMC 1α m/z
15 13 3925.98
14 14 3998.07
15 14 4100.13

S19
8. TGA-MS
Fig. S31 TGA-MS of poly(TMC-co-66mol%-1α). Plotted versus furnace temperature, the
sample mass (mg) and m/z 44 ion current (A) are both normalised to [0,1] to aid plotting on the
same graph.
9. Selected DSC Traces
Fig. S32 First heating (-40 - 200 °C, 10 K min-1) and cooling curve (200 - -40°C, 10 K min-1)
for poly(TMC-co-53mol%-α) (Table 3, Entry 5).
29.55°C(I)
25.36°C
38.64°C
34.26°C(I)
37.79°C
27.18°C
138.36°C
142.05°C0.7856J/g
155.98°C
152.61°C1.195J/g
-0.2
0.0
0.2
0.4
0.6
0.8
1.0
He
at
Flo
w (
W/g
)
-50 0 50 100 150 200
Temperature (°C)
Sample: GG756_alpha_TMC_50_50Size: 3.0000 mgMethod: George
DSCFile: D:...\GG756_alpha_TMC_50_50.001Operator: LJKCRun Date: 21-Dec-2016 15:04Instrument: DSC Q20 V24.10 Build 122
Exo Up Universal V4.5A TA Instruments

S20
Fig. S33 First heating (-40 - 200 °C, 10 K min-1) and cooling curve (200 - -40°C, 10 K min-1) for poly(TMC-co-14mol%-α) (Table 3, Entry 9).
Fig. S34 First heating (-40 - 200 °C, 10 K min-1) and cooling curve (200 - -40°C, 10 K min-1) for poly(1α) (Table 3, Entry 1).
-10.49°C(I)
-13.06°C
-4.37°C
-5.30°C(I)
-2.13°C
-11.99°C
-0.4
-0.2
0.0
0.2
0.4
0.6
0.8
Heat F
low
(W
/g)
-50 0 50 100 150 200
Temperature (°C)
Sample: GG766_alpha_TMC_20_80Size: 5.7000 mgMethod: George
DSCFile: D:...\GG766_alpha_TMC_20_80.001Operator: LJKCRun Date: 21-Dec-2016 14:06Instrument: DSC Q20 V24.10 Build 122
Exo Up Universal V4.5A TA Instruments
58.17°C(I)
62.83°C
49.86°C
55.75°C(I)
54.85°C
57.70°C
152.60°C
150.81°C0.6841J/g
137.27°C
139.44°C0.3013J/g
-0.4
-0.2
0.0
0.2
0.4
0.6
0.8
He
at
Flo
w (
W/g
)
-50 0 50 100 150 200
Temperature (°C)
Sample: GG761_alpha_TMC_90_10Size: 4.9000 mgMethod: George
DSCFile: D:...\GG761_alpha_TMC_90_10.001Operator: LJKCRun Date: 21-Dec-2016 16:54Instrument: DSC Q20 V24.10 Build 122
Exo Up Universal V4.5A TA Instruments

S21
10. Powder Diffraction
Fig. S35 Powder diffraction of selected copolymer, poly(TMC-co-66mol%-1α) showing
amorphous nature.
11. DFT Calculations Geometries were fully optimised without any symmetry or geometry constraints,
using the rωB97XD LC hybrid functional developed by Chai and Head-Gordon,
which includes an empirical dispersion correction and has been shown to
effectively reproduce thermodynamic and kinetic experimental data.1-3 To
confirm its nature, the vibrational data was used to relax the geometry of each
located transition state (one imaginary frequency) toward reactants and
products. No IRC calculations were performed to further confirm the identity.
Only the most stable conformational isomers are reported for all intermediates.
11.1 Initiation Step in the ROP of 1α, 1β and TMC
For modelling of the ROP initiation step, a mixture of basis sets was selected;
a higher basis set was used for key atoms (the carbonate, guanidine and
alcohol moieties of 1/TMC, TBD and BnOH) to account for potential anions and
non-bonding (hydrogen bonding) interactions and a lower basis set for all other
atoms to reduce the computational time. For steric reasons and after an initial
Gibbs free energy screening, only attack of the benzyl alcohol at the face
opposite to the β -OMe substituent was considered.
2-theta (deg)
Inte
nsity (
cp
s)
10 20 30 40 50 60
0
200
400
600
800
[1], d
=4.2
35(9
), 2
-the
ta=2
0.9
6(5
), H
=528(
30), R
el.H
=100.
00%

S22
Full coordinates for all the stationary points, together with computed Gibbs free
energy and vibrational frequency data, are available via the corresponding
Gaussian 09 output files, stored in the digital repository: DOI:
10.6084/m9.figshare.4644574.
Scheme S1 Typical scheme for the initiation step in the ROP of cyclic carbonates with TBD
catalyst and BnOH initiator.
S23
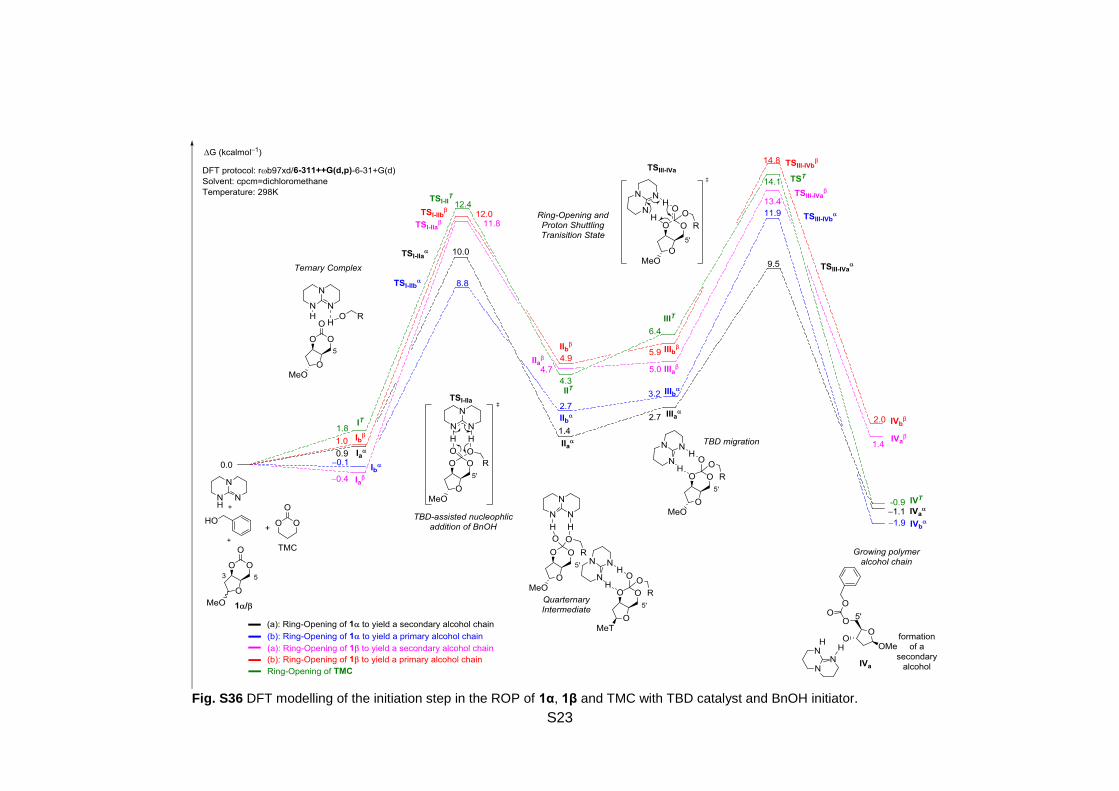
Fig. S36 DFT modelling of the initiation step in the ROP of 1α, 1β and TMC with TBD catalyst and BnOH initiator.

S24
Table S1 Computed Gibbs Free Energies at the rωB97XD/6-311+g(d,p)/6-
31+g(d)/cpcm=dichloromethane/298K level of theory for the ring-opening of 1α, 1β and TMC
by benzyl alcohol with TBD.
Structure G (Hartree) ΔG (kcal mol–1)
1α -648.498978 -
1β -648.502445 TMC -381.569395 TBD ‒438.513199 - BnOH -346.523501 - 1α + 1β+ TMC+ TBD+ BnOH -2463.607518 0 (reference)
Attack of 1α yielding a secondary alcohol chain
Iaα (+TMC+ 1β) -2463.606158 0.9 TSI-IIa
α (+ TMC+ 1β) -2463.591526 10.0 IIaα (+ TMC+ 1β) -2463.605260 1.4 IIIaα (+T MC+ 1β) -2463.603273 2.7 TSIII-IVa
α (+ TMC+ 1β) -2463.592375 9.5 IVa
α(+ TMC+ 1β) -2463.609247 -1.1
Attack of 1α primary alcohol chain
Ibα -2463.607652 -0.1 TSI-IIb
α -2463.593471 8.8 IIbα -2463.603172 2.7 IIIbα -2463.602453 3.2 TSIII-IVb
α -2463.588595 11.9 IVb
α -2463.610514 -1.9
Attack of 1β yielding a secondary alcohol chain
Iaβ (+ TMC + 1α) -2463.608178 -0.4 TSI-IIa
β (+ TMC + 1α) -2463.588695 11.8
IIaβ (+ TMC + 1α) -2463.600032 4.7
IIIaβ (+ TMC + 1α) -2463.599580 5.0 TSIII-IVa
β (+ TMC + 1α) -2463.586121 13.4 IVa
β (+ TMC + 1α) -2463.605322 1.4
Attack of 1β yielding a primary alcohol chain
Ibβ (+ TMC + 1α) -2463.605912 1.0
TSI-IIbβ
(+ TMC + 1α) -2463.588325 12.0
IIbβ (+ TMC + 1α) -2463.599639 4.9
IIIbβ (+ TMC + 1α) -2463.598167 5.9
TSIII-IVbβ (+ TMC + 1α) -2463.583984 14.8
IVaβ (+ TMC + 1α) -2463.604258 2.0
Attack of symmetrical TMC
IT (+ 1α+ 1β) -2463.604716 1.8 TSI-II
T (+ 1α+ 1β) -2463.587781 12.4 IIT (+ 1α+ 1β) -2463.600632 4.3 IIIT (+ 1α+ 1β) -2463.597317 6.4 TSIII-IV
T (+ 1α+ 1β) -2463.584977 14.1 IVT (+ 1α+ 1β) -2463.608944 -0.9

S25
11.2 Monomer Ring Strain 11.2.1 Thermodynamics of ring-opening with MeOH/iPrOH
Scheme S2 Ring-Opening Thermodynamics (ΔΔG) of 1α, 1β and TMC with MeOH and iPrOH
at the rωB97XD/6-311+g(2d,p)/cpcm=dichloromethane/298K level of theory.
Full coordinates for all the stationary points, together with computed Gibbs free
energy and vibrational frequency data, are available via the corresponding
Gaussian 09 output files, stored in the digital repository: DOI:
10.6084/m9.figshare.4644586.

S26
Table S2 Computed Free Gibbs Energies at the rωB97XD/6-
311+g(2d,p)/cpcm=dichloromethane/298K level of theory.
11.2.2 Isodesmic reaction with dimethylcarbonate
Scheme S3 Consideration of the ring strain of 1α, 1β and TMC by calculation of the enthalpy
of isodesmic ring-opening with dimethylcarbonate (ΔΔHring strain).
Structure
G (Hartree)
ΔΔG (kcal mol–1)
Starting Materials
Methanol –115.702205 - iPrOH -194.286844 -
1α -648.746770 -
1β -648.747521 -
TMC -381.648642
1α Products MeOH +1α -764.448975 0.0 (reference) Ring-opening to 1° alcohol -764.443008 3.7 Ring-opening to 2° alcohol -764.444442 2.8 iPrOH +1α -843.033614 0.0 (reference)
Ring-opening to 1° alcohol -843.026393 4.5
Ring-opening to 2° alcohol -843.028605 3.1
1β Products MeOH +1β -764.449726 0.0 (reference) Ring-opening to 1° alcohol -764.434326 9.7 Ring-opening to 2° alcohol -764.441263 5.3 iPrOH + 1β -843.034365 0.0 (reference) Ring-opening to 1° alcohol -843.020818 8.5 Ring-opening to 2° alcohol -843.024458 6.2
TMC Products
MeOH +TMC -497.350847 0.0 (reference) Symmetrical ring-opening -497.347387 2.2 iPrOH + TMC -575.935486 0.0 (reference) Symmetrical ring-opening -575.929747 3.6

S27
Full coordinates for all the stationary points, together with computed Gibbs free
energy and vibrational frequency data, are available via the corresponding
Gaussian 09 output files, stored in the digital repository: DOI:
10.6084/m9.figshare.4644577.
Table S3 Computed Gibbs Free Energies at the rωB97XD/6-
311++g(2d,p)/cpcm=dichloromethane/298K level of theory for the isodesmic ring-opening with
dimethyl carbonate (DMC) of 1α, 1β and TMC.
Structure H (Hartree) ΔΔH (kcal mol–1)
Dimethyl carbonate (DMC) -343.512814 -
1α -648.698158 -
1β -648.700746 - TMC -381.611588
DMC + 1α -992.210972 0.0 (reference)
1α oligocarbonate -992.221438 -6.6
DMC +1β -992.213560 0.0 (reference)
1β oligocarbonate -992.220930 -4.6
DMC +TMC -725.124402 0.0 (reference)
TMC oligocarbonate -725.134702 -6.5

S28
12. Single Crystal X-Ray Structures 1α
Empirical formula C7 H10 O5
Formula weight 174.15
Temperature 150(2) K
Wavelength 1.54184 Å
Crystal system Orthorhombic
Space group P212121
Unit cell dimensions a = 5.85770(10) Å α= 90°.
b = 11.00620(10) Å β= 90°.
c = 11.88280(10) Å γ = 90°.
Volume 766.096(16) Å3
Z 4
Density (calculated) 1.510 Mg/m3
Absorption coefficient 1.126 mm-1
F(000) 368
Crystal size 0.250 x 0.180 x 0.100 mm3
Theta range for data collection 5.479 to 72.513°.
Index ranges -7≤h≤4, -13≤k≤13, -14≤l≤14
Reflections collected 8745
Independent reflections 1517 [R(int) = 0.0229]
Completeness to theta = 67.684° 100.0 %
Absorption correction Semi-empirical from equivalents
Max. and min. transmission 1.00000 and 0.68919
Refinement method Full-matrix least-squares on F2
Data / restraints / parameters 1517 / 0 / 110
Goodness-of-fit on F2 1.108
Final R indices [I>2sigma(I)] R1 = 0.0238, wR2 = 0.0590
R indices (all data) R1 = 0.0239, wR2 = 0.0590
Absolute structure parameter -0.04(6)
Extinction coefficient n/a
Largest diff. peak and hole 0.128 and -0.173 e.Å-3

S29
1β
Empirical formula C7 H10 O5
Formula weight 174.15
Temperature 150(2) K
Wavelength 1.54184 Å
Crystal system Orthorhombic
Space group P212121
Unit cell dimensions a = 7.56590(10) Å α= 90°.
b = 9.9805(2) Å β= 90°.
c = 10.2418(2) Å γ = 90°.
Volume 773.37(2) Å3
Z 4
Density (calculated) 1.496 Mg/m3
Absorption coefficient 1.115 mm-1
F(000) 368
Crystal size 0.250 x 0.200 x 0.150 mm3
Theta range for data collection 6.192 to 72.264°.
Index ranges -9≤h≤8, -11≤k≤12, -12≤l≤12
Reflections collected 4290
Independent reflections 1497 [R(int) = 0.0225]
Completeness to theta = 67.684° 99.8 %
Absorption correction Semi-empirical from equivalents
Max. and min. transmission 1.00000 and 0.69375
Refinement method Full-matrix least-squares on F2
Data / restraints / parameters 1497 / 0 / 111
Goodness-of-fit on F2 1.061
Final R indices [I>2sigma(I)] R1 = 0.0241, wR2 = 0.0616
R indices (all data) R1 = 0.0244, wR2 = 0.0621
Absolute structure parameter -0.09(7)
Extinction coefficient 0.027(2)
Largest diff. peak and hole 0.163 and -0.150 e.Å-3

S30
13. References 1. A. Buchard, F. Jutz, M. R. Kember, A. J. P. White, H. S. Rzepa and C. K.
Williams, Macromolecules, 2012, 45, 6781-6795. 2. J.-D. Chai and M. Head-Gordon, Phys. Chem. Chem. Phys. , 2008, 10, 6615-
6620. 3. J.-D. Chai and M. Head-Gordon, J. Chem. Phys., 2008, 128, 084106.