supporting information: renewable isoprene by … supporting...page 1 / 49 abdelrahman, et al....
TRANSCRIPT
Page 1 / 49 Abdelrahman, et al.
Supporting Information:
Renewable Isoprene by Sequential Hydrogenation of Itaconic Acid and
Dehydra-Decyclization of 3-Methyl-Tetrahydrofuran 1,†
Omar A. Abdelrahman, 1,2, †
Dae Sung Park, 1Katherine P. Vinter,
1,2Charles S. Spanjers,
1Limin Ren,
3Hong Je Cho,
1,2Kechun Zhang,
3Wei Fan,
1Michael Tsapatsis,
1,2,*Paul J. Dauenhauer
1. University of Minnesota, Department of Chemical Engineering and Materials Science, 421 Washington Ave. SE, Minneapolis,
MN, 55455 U.S.A.
2. Center for Sustainable Polymers, a National Science Foundation Center for Chemical Innovation. 209 Smith Hall, 207 Pleasant
Street SE, Minneapolis, MN, 55455 U.S.A.
3. University of Massachusetts Amherst, Department of Chemical Engineering, 686 North Pleasant Street, Amherst, MA 01003
U.S.A.
*Corresponding Author: [email protected] †Authors Contributed Equally.
TABLE OF CONTENTS
1.0 Materials…………………………………………………………….............................. 2
2.0 Catalyst Synthesis……………………………………………………………………… 3
3.0 Catalyst Characterization…………………………………………................................ 6
4.0 Reaction Methods: Flow Reactor……………………………………………………... 7
5.0 Reaction Methods: Microcatalytic reactor…………………………………………… 10
6.0 Reaction Methods: Itaconic Acid Hydrogenation…………………………………….. 11
7.0 Reaction Methods: MBDO dehydration to 3-MTHF……………................................. 11
8.0 Thermodynamic Calculations………………………………......................................... 12
9.0 Catalytic Experimental Results: Itaconic Acid Hydrogenation….................................. 14
10.0 Catalytic Experimental Results: 3-MTHF dehydra-decyclization…………………… 21
11.0 Catalytic Experimental Results: Isopropanol dehydration…………………………… 36
12.0 Product Identification: Mass spectrum fragmentation patterns………......................... 37
13.0 Experimental three-dimensional selectivity map……………..………......................... 43
14.0 Time-on-stream study of P-SPP catalyst……………………………………………… 48
Page 2 / 49 Abdelrahman, et al.
1.0 Materials
1.1 Reagents and standard chemicals:
Itaconic acid (>99 %) and 2-methyl-1,4-butanediol (MBDO, >97 %) used for reactants in
aqueous-phase reaction were obtained from Sigma-Aldrich. 3-methyltetrahydrofuran (3-
MTHF,>95 %, TCI America) was used in gas-phase dehydra-decylization (Microcatalytic and
flow reactor) to make isoprene. Standards including isoprene (>99 %), 2-methyltetrahydrofuran
(>99 %), 3-methyl-3-buten-1-ol (>97 %), 2-methyl-3-buten-1-ol (>98 %) and α-methyl-ɤ-
butyrolactone (>98 %) were purchased from Sigma-Aldrich.
1.2 Catalysts
A variety of commercial catalysts were utilized in the vapor phase conversion of 3-
MTHF including ZSM-5 zeolite (Zeolyst CBV28014, Si/Al ratio = 140), H-Y zeolite (Zeolyst
CBV760, Si/Al = 30), tricalcium phosphate (TCP, Sigma Aldrich), silica alumina (SiO2·Al2O3,
Sigma Aldrich), niobium oxide (Nb2O5, Sigma Aldrich). For the aqueous production of 3-MTHF
from IA, 10 wt% Pd/C (Sigma Aldrich), 5wt% Ru/C (Sigma Aldrich), 5 wt% Pd/SiO2 (Strem
Chemicals), 5 wt% Ru/Al2O3 (Sigma Aldrich) and Amberlyst-15 (Sigma Aldrich) were
employed. In addition to commercially available catalysts, Sn-BEA, Pd-Re/C and various
phosphorous containing zeolites were prepared in house. Details of the preparation methods are
provided in subsequent sections.

Page 3 / 49 Abdelrahman, et al.
2.0 Catalyst Synthesis
2.1 Pd-Re/C
The carbon supported Pd-Re catalysts were prepared using incipient-wetness
impregnation, where an incipient volume of 2 ml/g of catalyst was employed. Briefly, an
aqueous solution of ammonium perrhenate (NH4ReO4, Sigma Aldrich) was used to impregnate a
commercial Pd/C catalyst. Once impregnated, the catalysts were dried at 100 °C for 12 hr and
reduced at 400 °C in 10 % H2/Ar for 3 hr.
2.2 P-BEA
P-BEA was synthesized according to the literature [31]. Commercial zeolite Al-BEA (Zeolyst
CP814E, Si/Al = 12.5) was dealuminated by treatment with 70 wt % nitric acid (HNO3, Fisher
Scientific). Typically, 0.5 g of the Al-BEA was mixed with 25 mL of 70 wt % HNO3 in a Teflon-
lined stainless steel autoclave. The autoclave was then put into an oven at 80 °C for 24 h under a
static condition. The dealuminated zeolite BEA (DeAl-BEA) was washed extensively with
deionized water and dried overnight at 100 °C. In order to prepare P-BEA with Si/P = 27
(confirmed by ICP analysis), wet impregnation was performed by stirring 0.4 g of DeAl-BEA
and 18.2 µL of 85 wt% phosphoric acid (H3PO4, Sigma-Aldrich) in 3.33 mL of deionized water.
The impregnated sample was dried at 90 °C overnight, followed by calcination in a tube furnace
with dry air at 600 °C for 25 min
Page 4 / 49 Abdelrahman, et al.
2.3 P-Al-BEA
P-Al-BEA was prepared by impregnation of H3PO4 on zeolite Al-BEA (Zeolyst,
CP814E, Si/Al = 12.5), according to the same procedure described in the preparation of P-BEA,
without the dealumination step.
2.4 P-SPP
P-SPP with Si/P = 27 (confirmed by ICP analysis) was synthesized according to the
literature [31]. Typically, tetra(n-butyl) phosphonium hydroxide (TBPOH, 40 wt %, Sigma-
Aldrich) as a structure-directing agent (SDA) was added dropwise into tetraethylorthosilicate
(TEOS, 98%, Sigma-Aldrich) under stirring. Deionized water was then added to this mixture,
and stirred for 24 h. The mixture became a clear sol with a composition of 1 SiO2 : 0.3 TBPOH :
10 H2O : 4 EtOH. The sol was sealed in a Teflon lined stainless steel autoclave and heated for 3
days in an oven at 115 °C. After crystallization, the solid product was extensively washed with
deionized water by centrifugation and decanting of the supernatant. This process was repeated
until the pH of the final supernatant was lower than 9. Subsequently, the collected sample was
dried at 90 °C overnight and calcined in a tube furnace at 550 °C for 12 h under dry air.
2.5 P-MFI
First, pure silica zeolite Si-MFI with a composition of 1 SiO2 : 0.26 TPAOH : 15 H2O : 4
EtOH was synthesized by mixing structure directing agent tetrapropylammonium hydroxide
solution (TPAOH, 40 wt%, SACHEM), water and tetraethylorthosilicate (TEOS, 98%, Sigma-
Aldrich). The mixed gel was sealed in a Teflon lined stainless steel autoclave and heated for 3
days in an oven at 180 °C. The solid products were centrifuged, washed with distilled water
Page 5 / 49 Abdelrahman, et al.
(until pH<8) and then dried at 70 °C overnight and calcined at 550 °C for 6 h in air under static
conditions. In order to prepare P-MFI with similar P content as P-BEA, the same wet
impregnation procedure was performed for P-MFI as in preparation of P-BEA. First, 0.4 g of Si-
MFI, 18.2 µL of 85wt % phosphoric acid (H3PO4, Sigma-Aldrich) and 3.33 mL of deionized
water were mixed. Then, the impregnated sample was dried at 90 °C overnight, followed by
calcination in a tube furnace with dry air at 600 °C for 25 min.
2.6 Si-SPP
Si-SPP without P was synthesized by modifying P-SPP synthesis method. First, P-SPP
was synthesized according to the above procedures. Then, the calcined P-SPP solid products
were dispersed in water in a centrifuge tube. After the centrifuge tube was heated in a 70 °C oven
for 1 h, the solid products were separated by centrifugation. The dispersion and centrifugation
procedures were repeated until the suspension pH is around 7. Then, the solid products were
dried at 70 °C oven overnight and calcined at 500 °C for 4 h in air under static conditions. For a
better removal of P, the calcined products were dispersed in water and washed by centrifugation
for another 3 times. The final Si-SPP solid products were dried at 70 °C oven overnight and
calcined at 500 °C for 4 h in air under static conditions.
2.7 Pelletization procedure
In order to maintain a relatively uniform particle distribution and avoid excessive
pressure drops, catalyst powders utilized in the microcatalytic and packed bed reactors were
pelletized to achieve a particle diameter of 500-1000 µm. Briefly, 100-200 mg of catalyst powder
were placed into a 13 mm pellet press (Pike technologies) and pressed to 2 tons of pressure,
holding for 10-15 mins. The catalyst pellet was then extracted and broken up into smaller

Page 6 / 49 Abdelrahman, et al.
particles, which were then passed through a set of sieves from which the 500-1000 µm sieve cut
was collected and used for catalytic testing throughout the study.
3.0 Catalyst Characterization
Textural information of the various catalysts employed in this study was characterized
through Ar physisorption in an Autosorb iQ2 porosimetry instrument (Quantachrom). Prior to
analysis, catalysts were outgassed at 573 K for 6 hours and subsequently cooled down to room
temperature under vacuum. BET specific surface area measurements were used to represent the
total surface area of the catalyst materials; total pore volume was determined using a single point
measurement at P/P0 = 0.97. Brønsted acid site concentration (H+) was determined by
isopropylamine temperature programmed desorption (IPA-TPD). Catalyst samples were
dehydrated at 400 °C under a stream of He for one hour then allowed to cool down to 120 °C
where the catalyst was contacted with IPA for 15 minutes. The catalyst was then held under a
stream of He for one hour to remove any physisorbed IPA, after which the temperature was
ramped at a rate of 10°C/min to 700 °C. IPA-TPD was not conducted for the phosphorous
containing materials, since earlier studies with P-containing materials did not result in any
detectable acidity[30]
.
Table S1. Catalyst Characteristics.
Catalyst Surface Area (m2 g
-1) Pore Volume (cm
3 g
-1) Si:Al
a H
+ (µmol g
-1)
ZSM-5 400 0.19 140 90
H-Y 720 0.36 30 350
SiAl 276 0.68 13 377
Sn-BEA 637 0.33 - -b
Nb2O5 8 0.07 - 30
a- Provided by the manufacturer
b- Cannot be determined by existing methods

Page 7 / 49 Abdelrahman, et al.
Table S2. Phosphorous-containing Catalyst Characteristics.
Catalyst Surface Area (m2 g
-1) Pore Volume (cm
3 g
-1) Si:P
a
P-SPP 598 1.11 27
P-BEA 499 0.80 27.1
P-MFI 602 0.99 27
P-Al-BEA 552 0.84 27
Si-SPP 612 0.89 -
a- Determined by ICP-MS
3.1 ICP-MS
Elemental analysis was performed on inductively coupled plasma optical emission
spectroscopy (ICP-OES, iCap 6500 Dual view, Thermo Scientific) in Analytical Geochemistry
Lab, Department of Earth Sciences in University of Minnesota.
4.0 Reaction Methods: Flow reactor
The steady state measurements of the dehydra-decyclization of 3-MTHF to isoprene over
supported acid catalysts was performed in a downflow packed bed reactor. Liquid 3-MTHF was
fed into a vaporization section through a 1/16” PEEK capillary line (0.01” ID), where a syringe
pump (KDS-100, KD Scientific) equipped with a gas tight syringe (Hamilton Company)
controlled the liquid flow rate (50 µl/hr). The vaporization section consisted of an insulated
aluminum tube wrapped with a heating tape, inside where the liquid feed was vaporized and
swept with a helium carrier gas regulated by a mass flow controller (Brooks, 5850S). Helium
flow rates were adjusted according to desired reaction conditions anywhere between 30-100
sccm. The vaporized stream of 3-MTHF in helium was then passed through a switching section,
consisting of a heated 6-port valve (Vici Valco, DL6UWE), from which the stream could be sent
either directly to the analysis section or through the reactor first. The carbon balance across the
packed catalyst bed was calculated as per Eq. (S1)

Page 8 / 49 Abdelrahman, et al.
������������%� = ����������������������
���������������������∗ 100 (S1)
Analysis of the vapor stream as it by-passed the reactor and sent directly to the analysis section,
allowed the verification of the molar flow rate carbon in to the reactor. A direct measure of the
molar flowrate of carbon was possible given the quantitative carbon detector employed in the
analysis.
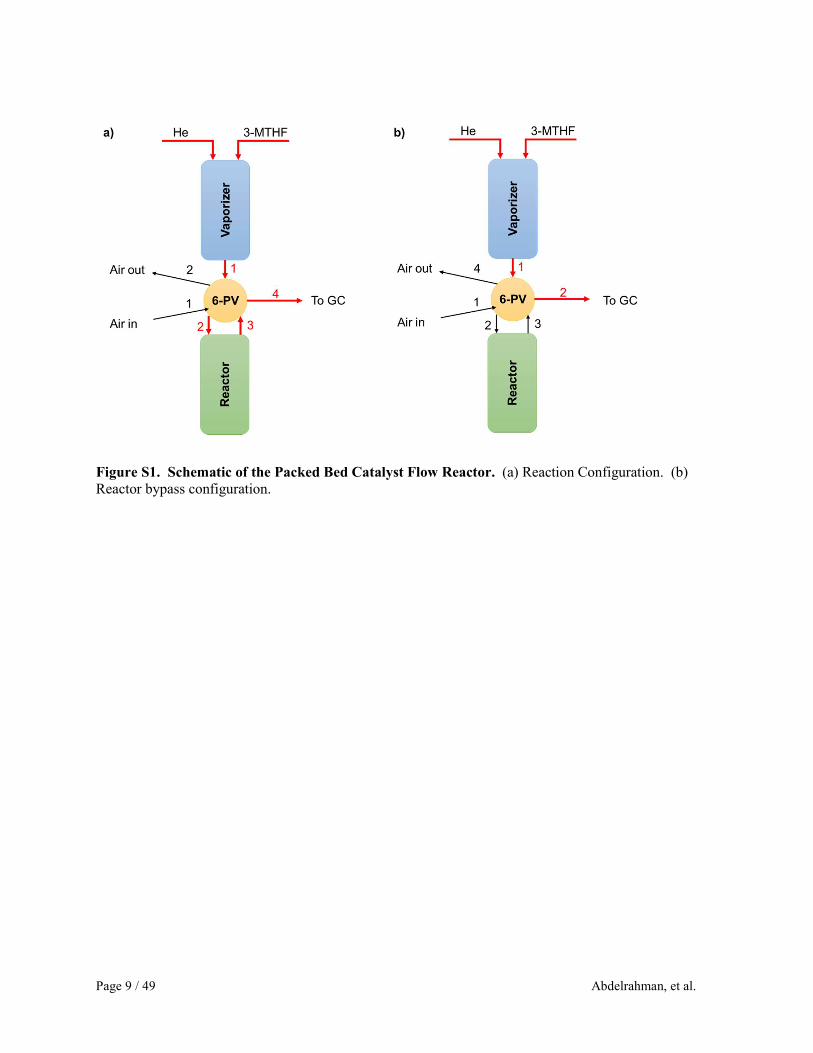
Details of the possible flow patterns are illustrated in Figure S1. The reactor consisted of a ½”
316 SS tube packed with quartz chips and catalyst operated in a down flow mode at 1.1 bar,
where the mass of catalyst loaded varied between 50 – 150 mg. The pressure drop across the
catalyst bed was maintained below 5% of the total pressure, achieved by maintaining the catalyst
particle diameter between 500-1000 µm. The catalyst bed was placed between two plugs of inert
quartz wool, above which the void volume was reduced using inert quartz packing in the range
of 850-4750 µm (Sigma Aldrich). Temperature measurements were made using a 1/16” type-K
thermocouple (Omega) placed directly below the catalyst bed, while a second thermocouple was
placed in the furnace used to control the temperature using a PID temperature controller
(OMEGA,CN-7800). Prior to introducing any reactant, the catalyst bed was heated at 3 K min-1
to 673 K and held for 1 hour under a 50 sccm stream of air. The catalyst bed was then cooled
down to the desired reaction temperature and flushed with a stream of He prior to introducing the
vapor phase reactant stream. Analysis of the vapor phase products was performed using an
online gas sampling gas chromatograph (Agilent, 7890A) equipped with a quantitative carbon
detector (QCD, POLYARC) in conjunction with a flame ionization detector (FID). Separation of
the various products and reactant in the GC were performed using an HP-PLOT Q column
(Agilent, 19091P-QO4).
Page 9 / 49 Abdelrahman, et al.
Figure S1. Schematic of the Packed Bed Catalyst Flow Reactor. (a) Reaction Configuration. (b)
Reactor bypass configuration.
Page 10 / 49 Abdelrahman, et al.
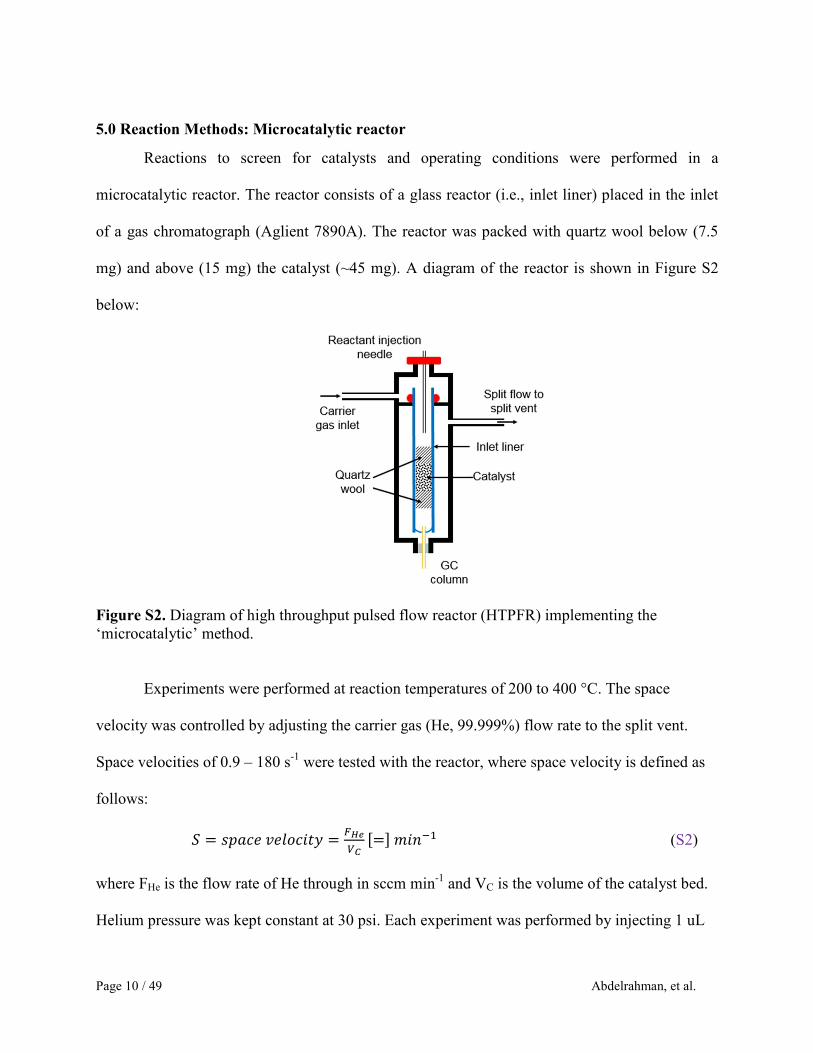
5.0 Reaction Methods: Microcatalytic reactor
Reactions to screen for catalysts and operating conditions were performed in a
microcatalytic reactor. The reactor consists of a glass reactor (i.e., inlet liner) placed in the inlet
of a gas chromatograph (Aglient 7890A). The reactor was packed with quartz wool below (7.5
mg) and above (15 mg) the catalyst (~45 mg). A diagram of the reactor is shown in Figure S2
below:
Figure S2. Diagram of high throughput pulsed flow reactor (HTPFR) implementing the
‘microcatalytic’ method.
Experiments were performed at reaction temperatures of 200 to 400 °C. The space
velocity was controlled by adjusting the carrier gas (He, 99.999%) flow rate to the split vent.
Space velocities of 0.9 – 180 s-1
were tested with the reactor, where space velocity is defined as
follows:
! = "#��$��%&' =()*
+,-=./%�01 (S2)
where FHe is the flow rate of He through in sccm min-1
and VC is the volume of the catalyst bed.
Helium pressure was kept constant at 30 psi. Each experiment was performed by injecting 1 uL

Page 11 / 49 Abdelrahman, et al.
of pure 3-MTHF into the reactor followed by immediate separation and quantification of the
products. Reaction products were separated using a chromatographic column (Agilent, HP-Plot
Q, 30 m, 0.32 mm ID, 20 µm film thickness; temperature program: 40 ºC for 2 min, 10 ºC/min to
270 ºC, hold 10 min) followed by quantification using a quantitative carbon detector
(Polyarc/FID).
6.0 Reaction Methods: Itaconic Acid hydrogenation
Sequential hydrogenation and dehydration of itaconic acid (IA) for the production of 3-
MTHF was performed in a 100 mL high pressure Parr Reactor (model 4598HPHT, Parr
Instrument Co.). Typically, 1.5 g (11.5 mL) of IA was added to 28.5 mL of water, and 0.05 – 0.3
g of catalyst was introduced to the mixture. The reactor was purged with N2 twice to remove any
residual air in the reactor. The reactor was then pressurized to 500 – 1500 psig with H2 (at room
temperature) and heated to reaction temperature (100 – 220 °C) under vigorous stirring (1,000
rpm). Products were identified via GC-MS (Agilent 7890A connected with Triple-Axis MS
detector, Agilent 5975C) and quantified using a liquid sampling GC (Agilent 7890A) equipped
with a HP-Plot Q column and a QCD/FID combination.
7.0 Reaction Methods: MBDO dehydration to 3-MTHF
Dehydration of MBDO to 3-MTHF was performed in a 100 mL high pressure Parr
reactor. 1 mL (28.6 mmol) of MBDO was added to 29 mL of water, and 0.2 g of catalyst was
added to the mixture. The reactor was purged with N2 twice and pressurized to 200 psi to keep
reactants in the condensed phase. Reactions were performed at temperatures ranging from 100-
200 oC at a stirring rate of 1000 rpm. Products were identified via GC-MS (Agilent 7890A
connected with a Triple-Axis MS detector, Agilent 5975C) and quantified using a liquid
sampling GC (Agilent 7890A) equipped with a HP-Plot Q column and a QCD/FID combination.

Page 12 / 49 Abdelrahman, et al.
8.0 Thermodynamic Calculations
Aqueous phase thermodynamic calculations were performed with the Gaussian 09 (Rev
C.1) program [32] using the M062X/6-311++G(3df,3pd) level of theory and the SMD model
[33] with water as the solvent for liquid phase calculations and the CBS-QB3 Complete Basis
Set method for calculations in the vapor phase. Vibrational frequencies, rotational temperature,
electronic energy, among other values calculated by Gaussian for each molecule are used to
calculate first, partition functions and finally thermochemical data resulting in Gibbs Free
energies. Each calculation considered contributions from translational, rotational, electric, and
vibrational energies to determine the overall partition function. All molecules are assumed to be
non-interacting, ideal gases. Theory and guidelines of this process can be found in the cited
resource by Ochterski [34]. The CBS-QB3 method was chosen due to its agreement (+ 1
kcal/mole), in most cases, to reported experimental data from NIST. The exception was found
with the reactions forming formaldehyde and propene. In this case, data reported by NIST was
included instead.
The Gibbs free energies of reaction were calculated by the following equation:
∆3 =∑ 5�3�6��7���8 −∑ 5:3:��������8 (S3)
in which Gi, Gj correspond to Gibbs free energies calculated using Gaussian data and νi, νj
represent stoichiometric values for the given compounds in the chemical reaction of interest.
Another ability inherent in these calculations was to be able to examine sensitivity of ∆G
to varying experimental temperatures and pressures. However, trends of ∆G with respect to

Page 13 / 49 Abdelrahman, et al.
pressure have been largely omitted from this work. This has been justified due to the negligible
change in ∆G in the ranges of pressures feasible to the reaction. Instead, focus has been directed
at temperature dependence.
Table S3. Calculated Free Energies of the Hydrogenation Products of Itaconic Acid.
Temperature (K) MGBL
(Kcal mol-1
)
MBDO
(Kcal mol-1
)
3-MTHF
(Kcal mol-1
)
Isoprenea
(Kcal mol-1
)
298 -44.7 -44.7 -52.8 -52.0
473 -43.7 -35.1 -48.2 -54.5
673 -41.8 -27.6 -44.3 -55.7 a- Vapor phase free energy relative to that of 3-MTHF

Page 14 / 49 Abdelrahman, et al.
9.0 Catalytic Experimental Results: Itaconic Acid Hydrogenation
Table S4. Summary of the sequential hydrogenation-dehydration of itaconic acid (IA) to 3-
methyltetrahydrofuran (3-MTHF) over Ru-based catalysts.
Catalyst Temperature
(°C)
PHydrogen
(psig)
Conversion (%) Selectivity (%) Carbon
Balance
(%) IA 3-MTHF MBDO MGBL Others1
Ru/C (0.3g) 100 1,500 100 0.5 64.7 28.9 5.9 83.8
Ru/C (0.3g) 120 1,500 100 4.8 24.3 48.1 22.8 92.7
Ru/C (0.1g) 150 500 100 0.1 73.4 13.9 12.6 92.0
Ru/Al2O3 (0.3g) 100 1,500 100 0.5 46.5 44.7 8.3 86.5
Ru/Al2O3 (0.1g) 150 500 100 0.9 29.7 50.9 18.5 77.9
Ru/Al2O3 (0.05g) 200 500 100 0.2 90.3 6.3 3.2 95.8
Ru/C (0.3g) +
SiO2-Al2O3 (0.2g) 100 1,500 100 0.4 65.0 28.8 5.8 79.4
Ru/C (0.3g) +
Amberlyst-15
(0.2g)
100 1,500 100 3.2 60.8 32.0 4.0 93.8
Ru/C (0.1g) +
SiO2-Al2O3 (0.2g) 150 500 100 1.7 47.6 33.2 17.5 81.6
Ru/Al2O3 (0.05g)
+ SiO2-Al2O3
(0.2g)
200 500 100 0.8 56.3 30.1 12.8 84.3
Reaction conditions: 1.5 g (11.5 mmol) of IA in D.I. water (28.5 mL), H2 pressurized at room temperature) 1Others: 2-methyltetrahydrofuran, 2(or 3)-methyl-3-buten-1-ol and some unknown products.

Page 15 / 49 Abdelrahman, et al.
Table S5. Summary of the sequential hydrogenation-dehydration of itaconic acid (IA) to 3-
methyltetrahydrofuran (3-MTHF) over Pd-based catalysts.
Catalysts Temperature
(°C)
PHydrogen
(psig)
Conversion (%)
Selectivity (%) Carbon
Balance
(%)
IA 3-MTHF MBO MBDO MGBL Others1
Pd/C (0.3g) +
Ru/C (0.2g) 120 1,500 100 0.2 0 78.7 16.3 4.8 93.5
Pd/C (0.3g) +
SiO2-Al2O3
(0.2g)
140 1,500 100 1.9 0 0 94.9 3.2 100.3
Pd/C (0.3g) +
SiO2-Al2O3
(0.2g)
160 1,500 100 4.5 0 2.2 83.2 10.0 96.2
Pd/ SiO2 (0.3g)
+ SiO2-Al2O3
(0.2g)
160 1,500 100 1.8 0 2.7 93.4 2.1 103.9
10Pd-10Re/C
(0.2g) 200 1,000 100 79.0 17.3 0.1 0.3 3.3 89.6
10Pd-5Re/C
(0.2g) 200 1,000 100 76.6 20.5 0.2 0.3 2.4 92.9
10Pd-10Re/C
(0.2g) 200 500 100 8.0 0 5.1 83.3 3.6 81.5
10Pd-10Re/C
(0.1g) 180 1,000 100 43.7 4.7 28.9 20.9 1.8 87.8
10Pd-10Re/C
(0.2g) 180 1,000 100 78.5 14.9 2.9 1.5 2.2 93.2
Reaction conditions: 1.5 g (11.5 mmol) of IA in D.I. water (28.5 mL), H2 pressurized at room temperature) 1Others: 2-methyltetrahydrofuran, 2(or 3)-methyl-3-buten-1-ol and some unknown products.

Page 16 / 49 Abdelrahman, et al.
Figure S3. Yield to 3-MTHF from MBDO over various solid acid catalysts in the aqueous phase
at 100-200 oC under 200 psig of N2 after 24 hrs.

Page 17 / 49 Abdelrahman, et al.
Figure S4. Results for the Sn-BEA catalyzed dehydration of MBDO to 3-MTHF. A) yield to 3-
MTHF at 130-200 °C and B) Conversion of MBDO and selectivity to 3-MTHF at 200 °C.
Page 18 / 49 Abdelrahman, et al.
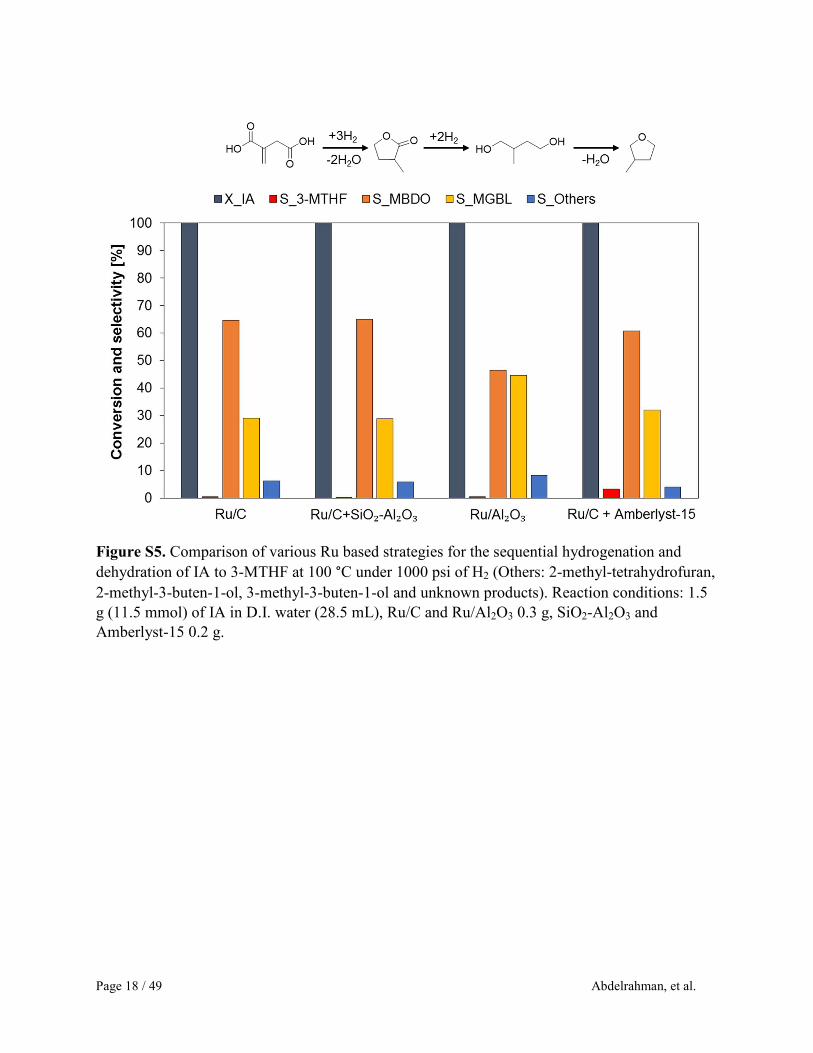
Figure S5. Comparison of various Ru based strategies for the sequential hydrogenation and
dehydration of IA to 3-MTHF at 100 °C under 1000 psi of H2 (Others: 2-methyl-tetrahydrofuran,
2-methyl-3-buten-1-ol, 3-methyl-3-buten-1-ol and unknown products). Reaction conditions: 1.5
g (11.5 mmol) of IA in D.I. water (28.5 mL), Ru/C and Ru/Al2O3 0.3 g, SiO2-Al2O3 and
Amberlyst-15 0.2 g.
Page 19 / 49 Abdelrahman, et al.
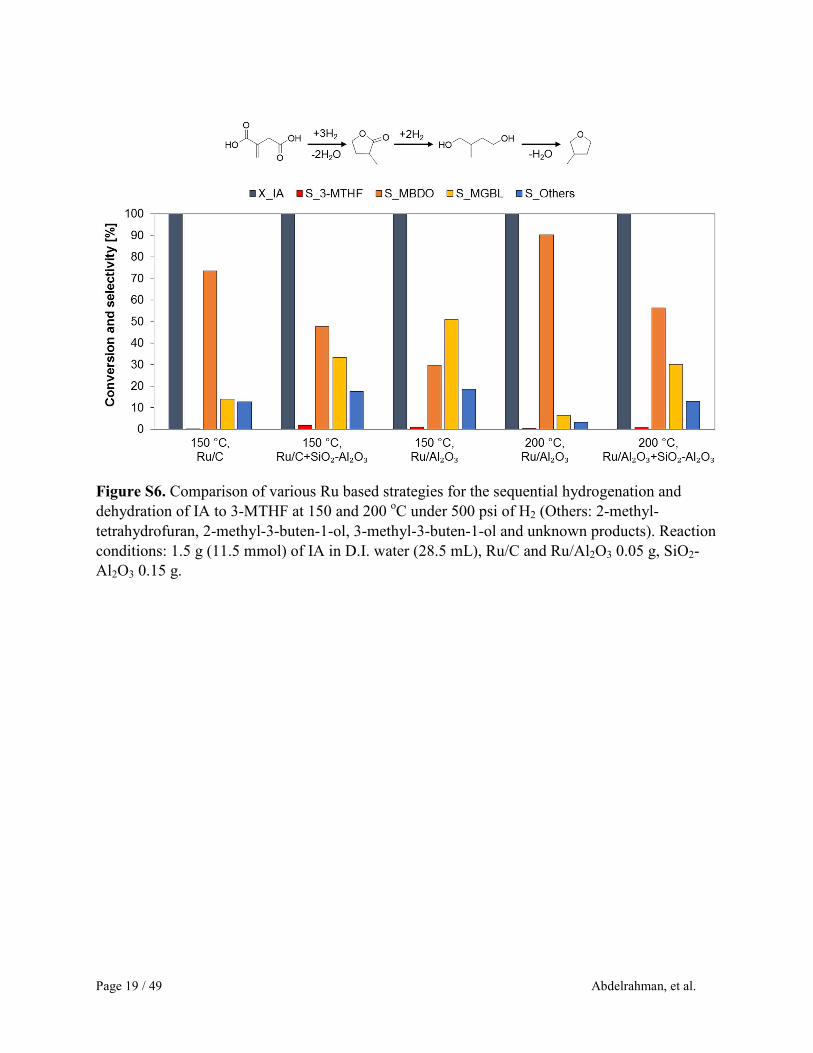
Figure S6. Comparison of various Ru based strategies for the sequential hydrogenation and
dehydration of IA to 3-MTHF at 150 and 200 oC under 500 psi of H2 (Others: 2-methyl-
tetrahydrofuran, 2-methyl-3-buten-1-ol, 3-methyl-3-buten-1-ol and unknown products). Reaction
conditions: 1.5 g (11.5 mmol) of IA in D.I. water (28.5 mL), Ru/C and Ru/Al2O3 0.05 g, SiO2-
Al2O3 0.15 g.
Page 20 / 49 Abdelrahman, et al.
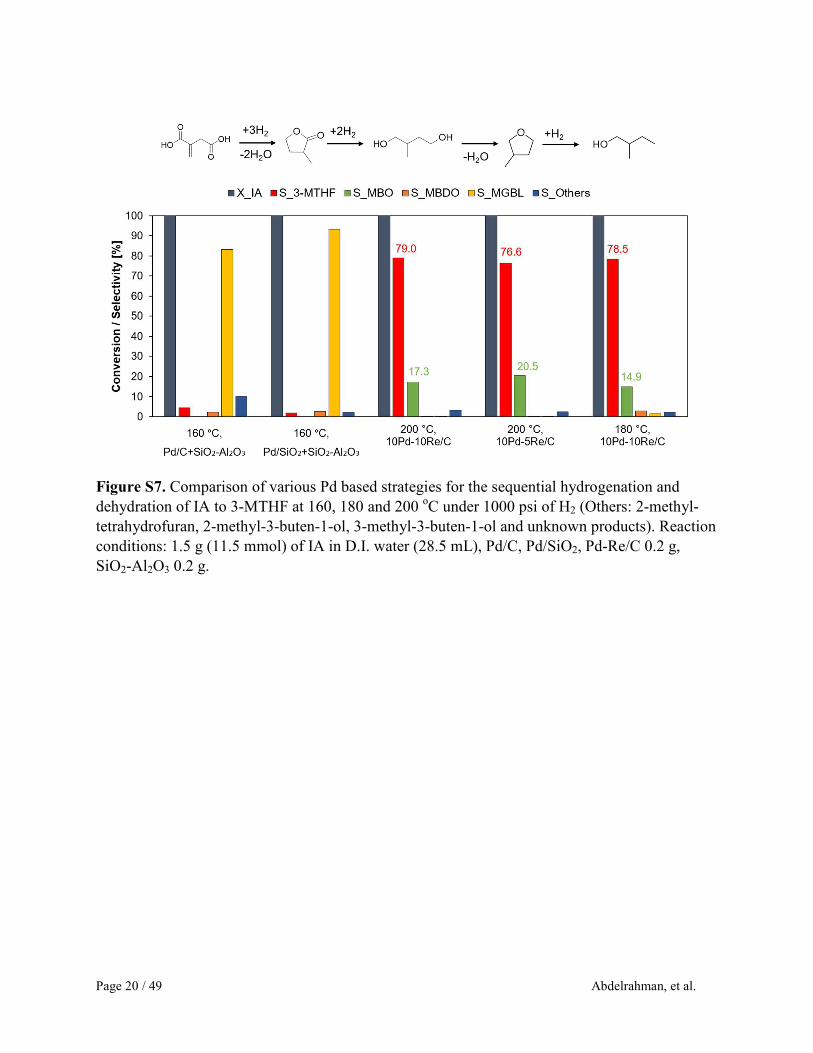
Figure S7. Comparison of various Pd based strategies for the sequential hydrogenation and
dehydration of IA to 3-MTHF at 160, 180 and 200 oC under 1000 psi of H2 (Others: 2-methyl-
tetrahydrofuran, 2-methyl-3-buten-1-ol, 3-methyl-3-buten-1-ol and unknown products). Reaction
conditions: 1.5 g (11.5 mmol) of IA in D.I. water (28.5 mL), Pd/C, Pd/SiO2, Pd-Re/C 0.2 g,
SiO2-Al2O3 0.2 g.

Page 21 / 49 Abdelrahman, et al.
10.0 Catalytic Experimental Results: 3-MTHF dehydra-decylization
Table S6. Microcatalytic summary of 3-MTHF dehydra-decyclization to isoprene over P-SPP
presented in Figure 3.
T(oC) SV (s
-1) Conversion (%) Selectivity (%)
Isoprene C3 C4 1,4 pentadiene 1,3 pentadiene (E,Z)
300 9.67 0.59 55.30 1.50 19.16 4.02 15.50
300 176.72 0.26 24.29 3.87 50.23 2.58 6.64
300 0.88 12.95 67.68 0.66 10.35 1.99 16.52
300 44.84 1.10 39.36 2.78 34.55 4.69 11.74
300 132.76 0.37 31.64 2.62 43.85 3.05 8.91
300 22.86 1.51 48.47 1.63 26.82 3.73 13.47
300 5.28 3.54 57.87 1.22 16.77 3.72 16.37
300 2.64 5.79 60.22 1.00 14.84 3.03 17.39
300 110.78 0.43 31.59 2.60 44.91 3.26 8.54
250 88.80 0.27 24.95 3.39 52.24 2.42 6.29
250 9.67 0.81 45.69 1.83 28.82 3.16 11.28
250 110.78 0.23 21.76 3.08 55.66 2.62 4.81
250 44.84 0.40 30.85 2.70 49.13 2.53 7.04
250 2.64 1.18 51.26 1.79 24.66 3.00 12.45
250 132.76 0.20 19.28 5.44 56.52 2.03 4.92
250 5.28 1.16 51.66 0.91 23.60 2.73 13.51
250 176.72 0.13 18.24 2.91 51.70 3.38 4.55
250 0.88 2.81 64.88 1.12 13.91 1.78 13.04
250 22.86 0.55 32.02 3.73 43.36 3.44 7.23
250 132.76 0.19 19.66 3.43 57.99 2.80 4.86
325 88.80 0.74 42.19 2.98 33.84 3.52 12.01
325 9.67 3.48 56.77 1.87 17.72 3.57 16.80
325 66.82 0.91 44.67 3.27 30.76 3.91 12.63
325 5.28 4.83 60.63 1.12 14.53 3.31 17.99
325 110.78 0.47 38.62 3.73 36.48 3.67 11.62
325 2.64 9.03 63.72 0.77 12.15 2.70 18.45
325 132.76 0.37 36.52 4.05 39.18 3.59 10.27
325 0.88 16.55 69.08 0.75 9.65 1.18 17.21
325 44.84 1.23 44.97 2.83 29.75 4.60 13.57
325 176.72 0.24 33.44 3.26 41.66 3.05 9.45
325 22.86 1.80 53.23 1.86 21.82 3.84 15.53
275 88.80 0.32 30.83 2.64 47.05 2.71 8.86
275 9.67 1.15 52.66 1.35 23.56 3.22 13.97
275 2.64 2.46 60.21 0.86 15.37 2.74 17.25
275 132.76 0.21 24.94 2.70 52.44 3.61 7.52
275 0.88 4.64 66.57 0.57 11.49 2.12 15.82
275 110.78 0.27 26.80 2.98 49.43 3.73 8.38

Page 22 / 49 Abdelrahman, et al.
T(oC) SV (s
-1) Conversion (%) Selectivity (%)
Isoprene C3 C4 1,4 pentadiene 1,3 pentadiene (E,Z)
275 5.28 1.51 53.65 1.21 22.11 3.15 14.62
275 66.82 0.41 31.60 2.69 46.14 3.13 9.48
275 22.86 0.69 42.71 2.34 33.94 3.06 11.80
275 44.84 0.51 36.18 2.60 40.97 3.14 10.69
312.5 88.80 0.50 39.51 2.34 37.08 3.32 11.73
312.5 5.28 3.04 59.03 1.04 15.49 3.18 18.23
312.5 44.84 0.87 44.44 2.56 31.51 3.24 13.08
312.5 0.88 10.35 68.70 0.61 8.83 2.02 17.54
312.5 132.76 0.29 35.07 2.76 41.52 3.12 9.57
312.5 2.64 4.75 63.55 0.67 12.18 2.90 18.62
312.5 9.67 1.97 55.20 1.40 18.63 3.96 17.23
287.5 88.80 0.33 31.93 3.52 45.27 3.11 9.04
287.5 9.67 1.19 52.74 1.45 23.36 3.19 14.40
287.5 132.76 0.20 27.01 2.58 49.07 2.84 8.08
287.5 0.88 5.29 67.92 0.95 10.52 2.36 15.27
287.5 5.28 1.72 53.71 1.90 21.37 3.56 15.25
287.5 66.82 0.45 32.31 5.18 42.96 3.41 9.62
287.5 2.64 2.68 59.70 1.26 15.98 2.89 17.07
287.5 1.76 3.55 59.52 1.32 15.49 3.45 17.24
262.5 88.80 0.25 25.21 3.98 50.12 3.33 8.86
262.5 1.76 2.06 59.55 1.19 15.88 2.72 16.49
262.5 9.67 0.72 39.24 3.13 33.77 3.87 13.54
262.5 44.84 0.39 28.30 5.01 46.92 3.48 9.40
262.5 0.88 2.58 61.84 1.50 14.57 2.72 15.25
262.5 2.64 1.47 51.47 2.05 21.00 3.45 16.03
350 88.80 1.22 42.44 7.09 29.51 3.86 14.66
350 9.67 3.75 54.57 3.71 16.83 3.91 19.66
350 0.88 20.66 62.59 2.23 9.71 4.28 20.66
350 132.76 0.41 39.07 8.14 33.32 3.56 12.77
350 5.28 3.54 58.06 2.65 12.79 4.11 21.25
350 44.84 1.29 45.84 5.91 25.03 4.49 16.96
350 2.64 7.83 60.17 2.37 11.26 3.20 22.04
350 22.86 2.04 49.71 5.16 20.29 4.98 18.37
350 110.78 0.48 40.25 8.04 31.40 3.73 13.79
350 88.80 0.60 36.55 1.02 31.91 2.99 8.12
337.5 88.80 0.51 38.89 6.98 34.62 3.73 12.98
337.5 9.67 3.84 54.59 3.32 17.28 4.30 19.16

Page 23 / 49 Abdelrahman, et al.
T(oC) SV (s
-1) Conversion (%) Selectivity (%)
Isoprene C3 C4 1,4 pentadiene 1,3 pentadiene (E,Z)
337.5 132.76 0.32 34.99 7.84 39.04 3.63 11.01
337.5 2.64 5.94 60.46 1.81 11.98 3.32 21.41
337.5 66.82 0.70 40.92 6.27 32.98 3.85 13.53
337.5 1.76 7.94 61.88 1.77 11.12 2.87 21.43
337.5 44.84 0.97 43.55 6.55 29.24 3.96 14.59
337.5 0.88 13.44 66.94 1.55 8.31 2.09 20.04
337.5 176.72 0.23 32.71 7.43 42.12 3.31 10.09
337.5 7.47 5.74 60.59 1.99 12.27 3.32 20.77
275 88.80 0.50 23.58 7.41 54.27 2.86 7.24
275 1.76 2.24 58.99 2.07 15.99 2.85 18.20
275 9.67 0.79 41.66 5.28 34.38 3.42 11.71
275 7.47 0.91 42.33 5.32 32.71 3.42 12.90
275 0.88 2.89 61.17 3.33 16.30 2.60 14.22
225 88.80 0.27 12.84 7.12 67.48 2.56 2.36
225 9.67 0.29 26.97 5.81 51.14 2.55 6.29
225 132.76 0.10 11.50 8.32 64.07 2.42 2.16
225 0.88 0.68 48.41 4.03 31.35 2.37 9.26
225 176.72 0.07 11.63 6.08 63.17 3.02 1.62
225 1.76 0.79 41.61 4.22 38.78 1.93 9.08
225 22.86 0.23 16.22 9.35 61.03 2.21 3.89
225 2.64 0.49 38.46 6.12 43.56 2.12 3.75
375 88.80 0.88 40.86 7.86 34.03 3.42 10.94
375 9.67 4.44 53.49 4.56 20.69 4.15 15.41
375 132.76 0.50 38.11 9.32 35.75 3.35 9.92
375 0.88 26.61 62.97 2.69 13.10 3.27 17.42
375 44.84 1.51 44.62 6.04 30.52 3.81 12.65
375 5.28 5.75 57.90 3.11 16.66 3.88 16.98
375 176.72 0.36 34.18 12.44 38.10 2.83 8.36
375 2.64 9.07 61.16 2.27 14.15 3.14 18.08
375 66.82 0.92 41.36 8.67 32.38 3.36 11.60
375 1.76 12.28 62.69 2.20 12.78 2.80 18.46
400 88.80 0.95 45.39 6.34 29.52 3.77 12.66
400 9.67 3.64 56.30 2.78 17.96 4.38 17.28
400 132.76 0.64 43.57 7.42 31.34 3.57 11.35
400 0.88 37.80 62.42 2.06 12.36 2.56 19.59
400 176.72 0.57 41.38 7.66 33.94 3.35 10.43
400 5.28 7.50 59.28 2.03 15.05 4.06 18.40
400 22.86 2.93 51.51 4.13 22.29 4.60 15.94

Page 24 / 49 Abdelrahman, et al.
Figure S8. Distribution of produce C5 dienes including isoprene (red, ●), 1,4 Pentadiene (blue,
♦) and 1,3 Pentadiene (Cis and Trans, green, ▲) at conditions presented in Tables S6A-S6C.

Page 25 / 49 Abdelrahman, et al.
Table S7. Summary of the dehydra-decylization of 3-methyltetrahydrofuran (3-MTHF) to
isoprene over Nb2O5 using the microcatalytic method.
Temperature
(°C)
Space velocity
(s-1
)
Conversion
(%)
Selectivity (%)
C31 C4
2 Isoprene Pentadiene
3
200 89 1.4 0.3 9.5 10.0 3.8
200 10 1.2 0.7 15.2 13.1 5.4
200 1 0.4 1.2 24.3 23.5 8.2
250 89 4.0 0.2 19.9 27.6 12.7
250 10 4.3 0.3 21.9 33.7 17.9
250 1 2.1 0.8 27.1 35.9 18.3
300 89 7.3 0.4 19.0 29.1 13.5
300 10 6.2 1.0 27.3 34.7 20.3
300 1 8.8 0.9 30.5 34.9 20.7
350 89 11.3 0.5 10.6 11.1 6.1
350 10 6.3 1.2 29.1 33.7 20.2
350 1 26.3 1.4 35.5 29.5 17.2
400 89 41.1 0.1 2.6 3.2 1.4
400 10 11.3 1.1 21.2 30.8 14.8
400 1 73.9 2.5 40.7 21.6 11.2
1C3: Propenes
2C4: Butenes and Butadienes
3Pentadienes: 1,3-pentadiene and 1,4-pentadiene
Page 26 / 49 Abdelrahman, et al.
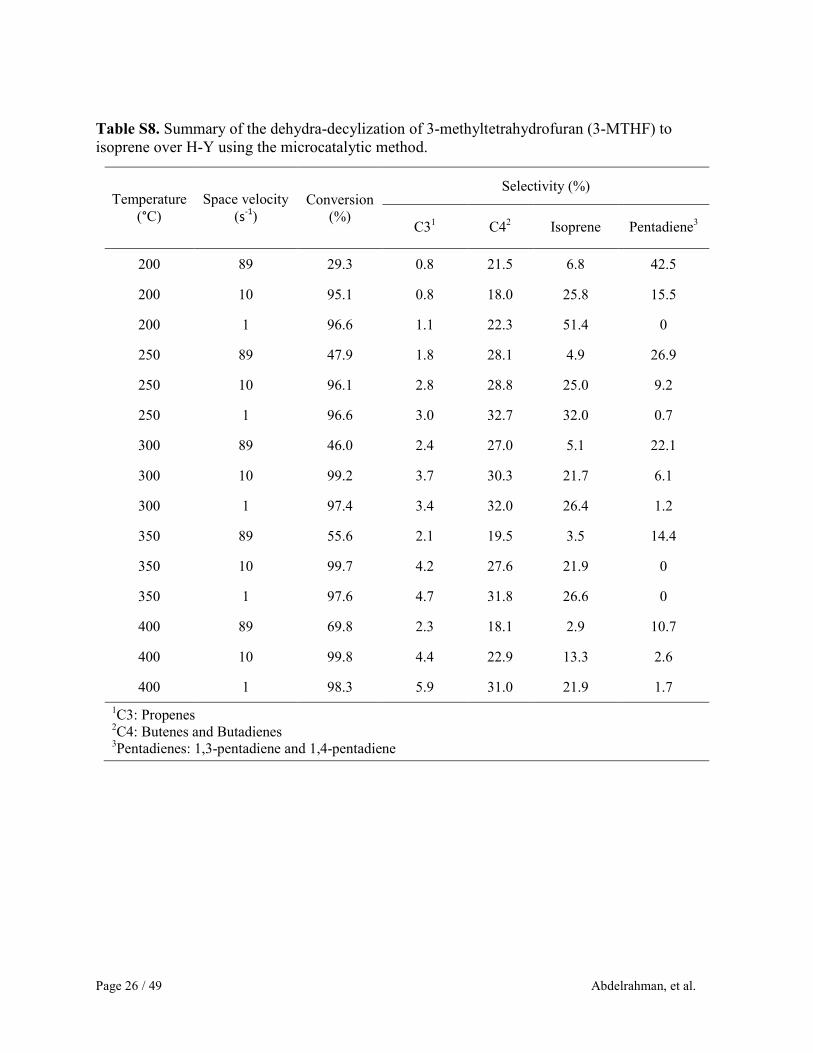
Table S8. Summary of the dehydra-decylization of 3-methyltetrahydrofuran (3-MTHF) to
isoprene over H-Y using the microcatalytic method.
Temperature
(°C)
Space velocity
(s-1
)
Conversion
(%)
Selectivity (%)
C31 C4
2 Isoprene Pentadiene
3
200 89 29.3 0.8 21.5 6.8 42.5
200 10 95.1 0.8 18.0 25.8 15.5
200 1 96.6 1.1 22.3 51.4 0
250 89 47.9 1.8 28.1 4.9 26.9
250 10 96.1 2.8 28.8 25.0 9.2
250 1 96.6 3.0 32.7 32.0 0.7
300 89 46.0 2.4 27.0 5.1 22.1
300 10 99.2 3.7 30.3 21.7 6.1
300 1 97.4 3.4 32.0 26.4 1.2
350 89 55.6 2.1 19.5 3.5 14.4
350 10 99.7 4.2 27.6 21.9 0
350 1 97.6 4.7 31.8 26.6 0
400 89 69.8 2.3 18.1 2.9 10.7
400 10 99.8 4.4 22.9 13.3 2.6
400 1 98.3 5.9 31.0 21.9 1.7
1C3: Propenes
2C4: Butenes and Butadienes
3Pentadienes: 1,3-pentadiene and 1,4-pentadiene
Page 27 / 49 Abdelrahman, et al.
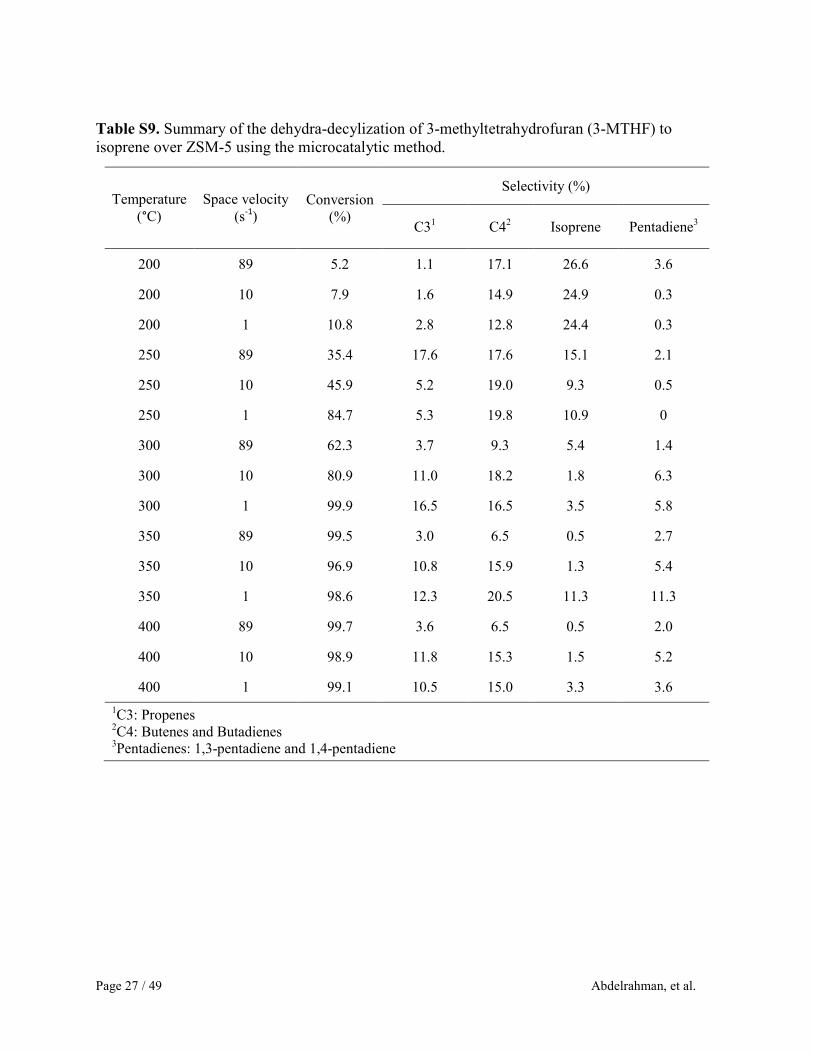
Table S9. Summary of the dehydra-decylization of 3-methyltetrahydrofuran (3-MTHF) to
isoprene over ZSM-5 using the microcatalytic method.
Temperature
(°C)
Space velocity
(s-1
)
Conversion
(%)
Selectivity (%)
C31 C4
2 Isoprene Pentadiene
3
200 89 5.2 1.1 17.1 26.6 3.6
200 10 7.9 1.6 14.9 24.9 0.3
200 1 10.8 2.8 12.8 24.4 0.3
250 89 35.4 17.6 17.6 15.1 2.1
250 10 45.9 5.2 19.0 9.3 0.5
250 1 84.7 5.3 19.8 10.9 0
300 89 62.3 3.7 9.3 5.4 1.4
300 10 80.9 11.0 18.2 1.8 6.3
300 1 99.9 16.5 16.5 3.5 5.8
350 89 99.5 3.0 6.5 0.5 2.7
350 10 96.9 10.8 15.9 1.3 5.4
350 1 98.6 12.3 20.5 11.3 11.3
400 89 99.7 3.6 6.5 0.5 2.0
400 10 98.9 11.8 15.3 1.5 5.2
400 1 99.1 10.5 15.0 3.3 3.6
1C3: Propenes
2C4: Butenes and Butadienes
3Pentadienes: 1,3-pentadiene and 1,4-pentadiene

Page 28 / 49 Abdelrahman, et al.
Table S10. Summary of the dehydra-decylization of 3-methyltetrahydrofuran (3-MTHF) to
isoprene over Sn-BEA using the microcatalytic method.
Temperature
(°C)
Space velocity
(s-1
)
Conversion
(%)
Selectivity (%)
C31 C4
2 Isoprene Pentadiene
3
200 89 1.4 0.4 5.4 3.3 12.0
200 10 0.7 1.5 14.1 15.4 2.7
200 1 1.2 2.1 24.5 21.4 3.2
250 89 2.2 0 6.4 2.7 0.3
250 10 1.2 1.4 23.7 18.3 8.5
250 1 2.1 2.4 20.2 35.0 13.3
300 89 2.9 0.3 9.1 2.2 2.0
300 10 2.0 1.5 26.8 24.2 14.5
300 1 4.9 1.4 21.1 34.3 18.5
350 89 2.7 0.5 10.7 4.0 2.5
350 10 3.5 1.3 24.0 20.8 14.8
350 1 8.8 1.5 26.2 29.2 18.4
400 89 3.1 0.4 8.1 3.0 2.2
400 10 4.2 1.3 27.0 19.5 16.6
400 1 12.8 1.4 33.2 25.2 17.9
1C3: Propenes
2C4: Butenes and Butadienes
3Pentadienes: 1,3-pentadiene and 1,4-pentadiene
Page 29 / 49 Abdelrahman, et al.
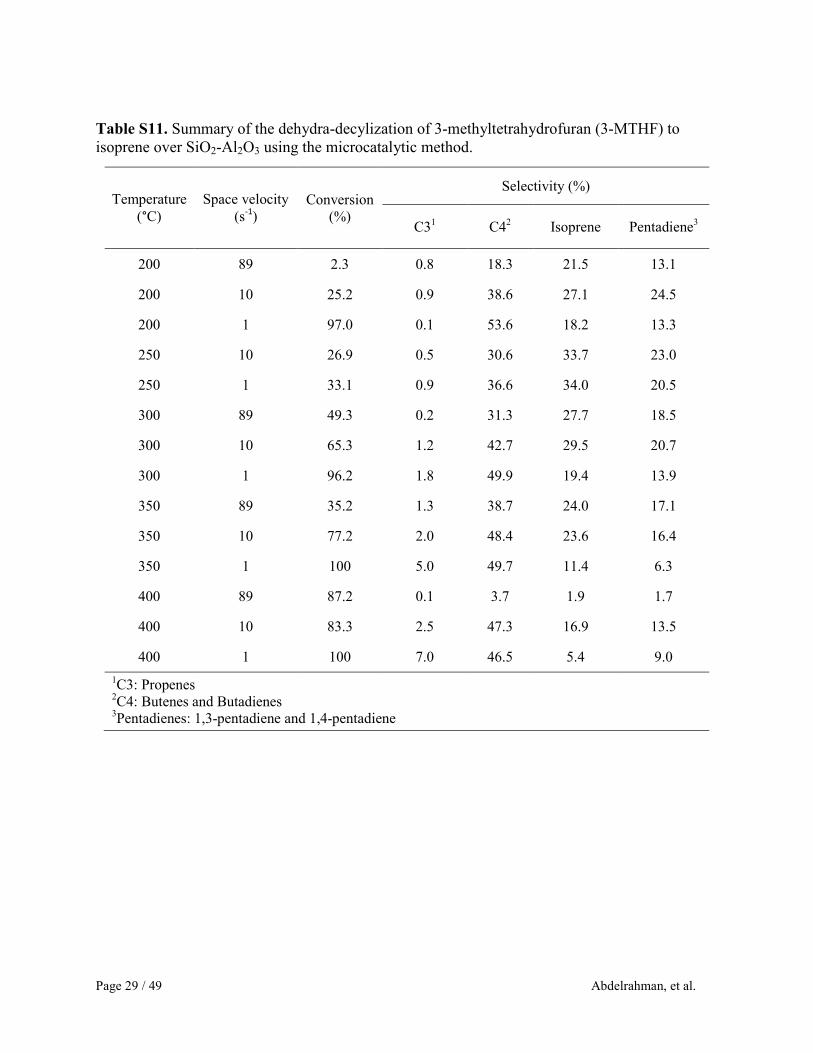
Table S11. Summary of the dehydra-decylization of 3-methyltetrahydrofuran (3-MTHF) to
isoprene over SiO2-Al2O3 using the microcatalytic method.
Temperature
(°C)
Space velocity
(s-1
)
Conversion
(%)
Selectivity (%)
C31 C4
2 Isoprene Pentadiene
3
200 89 2.3 0.8 18.3 21.5 13.1
200 10 25.2 0.9 38.6 27.1 24.5
200 1 97.0 0.1 53.6 18.2 13.3
250 10 26.9 0.5 30.6 33.7 23.0
250 1 33.1 0.9 36.6 34.0 20.5
300 89 49.3 0.2 31.3 27.7 18.5
300 10 65.3 1.2 42.7 29.5 20.7
300 1 96.2 1.8 49.9 19.4 13.9
350 89 35.2 1.3 38.7 24.0 17.1
350 10 77.2 2.0 48.4 23.6 16.4
350 1 100 5.0 49.7 11.4 6.3
400 89 87.2 0.1 3.7 1.9 1.7
400 10 83.3 2.5 47.3 16.9 13.5
400 1 100 7.0 46.5 5.4 9.0
1C3: Propenes
2C4: Butenes and Butadienes
3Pentadienes: 1,3-pentadiene and 1,4-pentadiene

Page 30 / 49 Abdelrahman, et al.
Table S12. Summary of the dehydra-decylization of 3-methyltetrahydrofuran (3-MTHF) to
isoprene over P-SPP using the microcatalytic method.
Temperature
(°C)
Space velocity
(S-1
)
Conversion
(%)
Selectivity (%)
C31 C4
2 Isoprene Pentadiene
3
200 89 0.2 2.4 25.8 40.9 11.4
200 10 0.7 0.7 12.8 66.0 14.7
250 89 9.5 1.3 19.4 55.5 16.1
250 10 2.4 0.6 10.9 67.0 18.8
300 89 1.0 1.1 19.1 56.7 17.9
300 10 5.7 0.6 8.7 68.2 21.1
300 1 26.7 1.3 11.6 66.2 17.2
350 89 1.4 1.0 13.1 61.7 20.5
350 10 11.8 0.6 7.6 67.4 23.2
350 1 40.6 2.7 20.1 54.6 20.8
400 89 2.6 0.8 9.7 64.2 23.2
400 10 19.1 0.6 7.5 65.4 25.0
400 1 63.8 3.3 23.7 48.1 22.4
1C3: Propenes
2C4: Butenes and Butadienes
3Pentadienes: 1,3-pentadiene and 1,4-pentadiene

Page 31 / 49 Abdelrahman, et al.
Table S13. Summary of the dehydra-decylization of 3-methyltetrahydrofuran (3-MTHF) to
isoprene over P-MFI using the microcatalytic method.
Temperature
(°C)
Space velocity
(s-1
)
Conversion
(%)
Selectivity (%)
C31 C4
2 Isoprene Pentadiene
3
200 89 0.2 2.7 75.2 3.5 6.6
200 10 0.4 2.3 67.9 12.3 4.3
200 1 0.7 1.9 55.0 25.0 5.2
250 89 0.9 1.1 76.2 13.5 3.5
250 10 1.3 3.1 64.4 16.8 5.1
250 1 2.8 2.0 45.8 33.1 9.3
300 89 0.9 3.1 67.4 16.4 4.6
300 10 2.2 3.5 50.4 27.5 9.1
300 1 7.0 1.9 30.2 46.1 13.9
350 89 1.0 4.3 55.3 23.1 7.7
350 10 3.7 2.9 37.4 36.9 14.6
350 1 18.3 1.2 18.9 57.5 18.8
400 89 1.3 3.6 42.9 31.0 13.1
400 10 6.4 2.1 28.1 42.7 20.2
400 1 40.2 1.0 15.0 57.7 24.3
1C3: Propenes
2C4: Butenes and Butadienes
3Pentadienes: 1,3-pentadiene and 1,4-pentadiene
Page 32 / 49 Abdelrahman, et al.
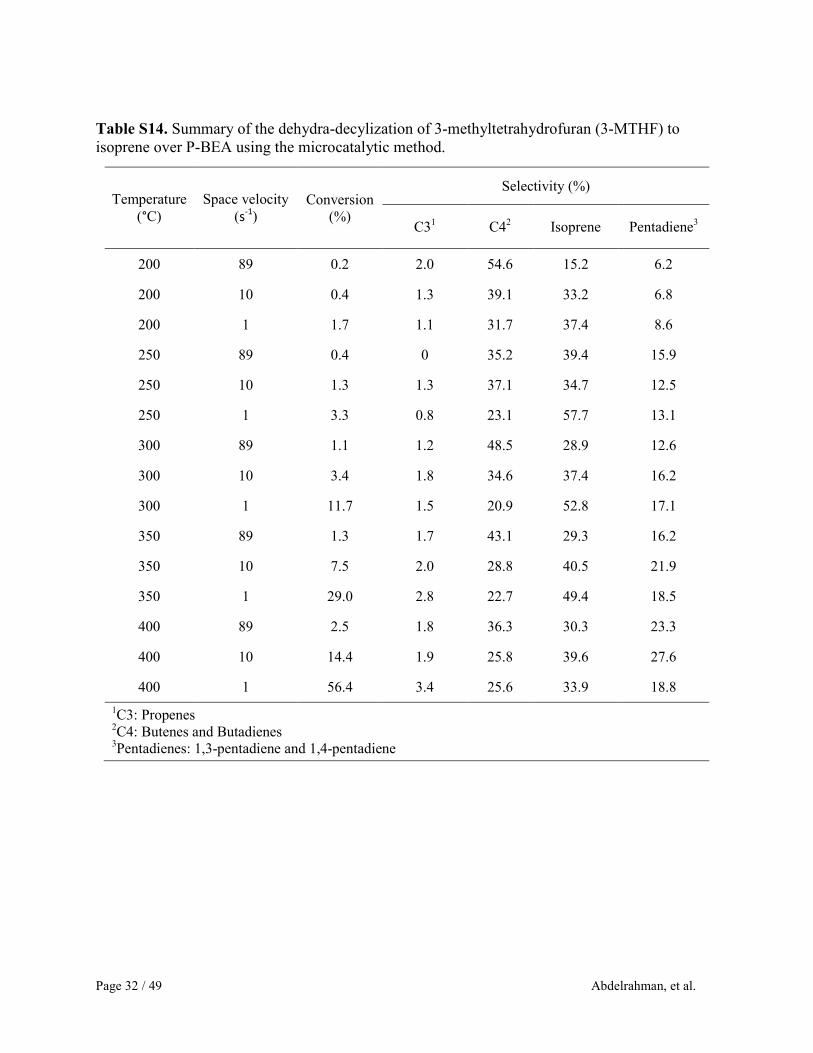
Table S14. Summary of the dehydra-decylization of 3-methyltetrahydrofuran (3-MTHF) to
isoprene over P-BEA using the microcatalytic method.
Temperature
(°C)
Space velocity
(s-1
)
Conversion
(%)
Selectivity (%)
C31 C4
2 Isoprene Pentadiene
3
200 89 0.2 2.0 54.6 15.2 6.2
200 10 0.4 1.3 39.1 33.2 6.8
200 1 1.7 1.1 31.7 37.4 8.6
250 89 0.4 0 35.2 39.4 15.9
250 10 1.3 1.3 37.1 34.7 12.5
250 1 3.3 0.8 23.1 57.7 13.1
300 89 1.1 1.2 48.5 28.9 12.6
300 10 3.4 1.8 34.6 37.4 16.2
300 1 11.7 1.5 20.9 52.8 17.1
350 89 1.3 1.7 43.1 29.3 16.2
350 10 7.5 2.0 28.8 40.5 21.9
350 1 29.0 2.8 22.7 49.4 18.5
400 89 2.5 1.8 36.3 30.3 23.3
400 10 14.4 1.9 25.8 39.6 27.6
400 1 56.4 3.4 25.6 33.9 18.8
1C3: Propenes
2C4: Butenes and Butadienes
3Pentadienes: 1,3-pentadiene and 1,4-pentadiene
Page 33 / 49 Abdelrahman, et al.
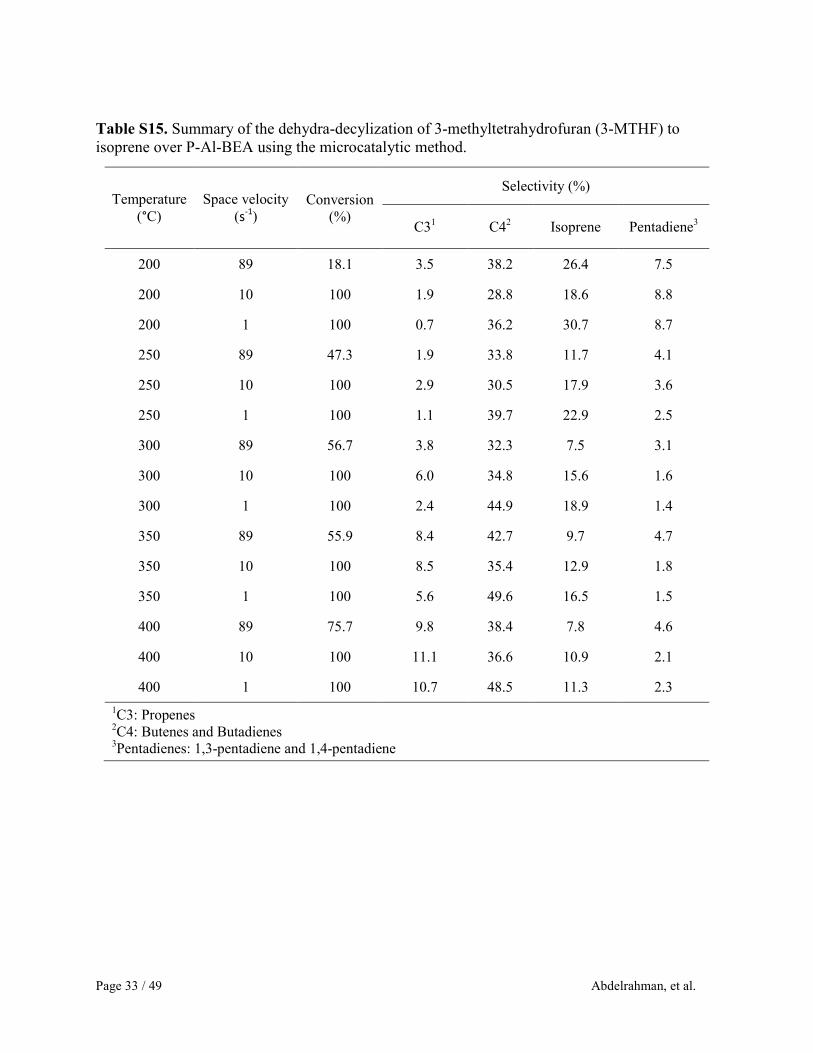
Table S15. Summary of the dehydra-decylization of 3-methyltetrahydrofuran (3-MTHF) to
isoprene over P-Al-BEA using the microcatalytic method.
Temperature
(°C)
Space velocity
(s-1
)
Conversion
(%)
Selectivity (%)
C31 C4
2 Isoprene Pentadiene
3
200 89 18.1 3.5 38.2 26.4 7.5
200 10 100 1.9 28.8 18.6 8.8
200 1 100 0.7 36.2 30.7 8.7
250 89 47.3 1.9 33.8 11.7 4.1
250 10 100 2.9 30.5 17.9 3.6
250 1 100 1.1 39.7 22.9 2.5
300 89 56.7 3.8 32.3 7.5 3.1
300 10 100 6.0 34.8 15.6 1.6
300 1 100 2.4 44.9 18.9 1.4
350 89 55.9 8.4 42.7 9.7 4.7
350 10 100 8.5 35.4 12.9 1.8
350 1 100 5.6 49.6 16.5 1.5
400 89 75.7 9.8 38.4 7.8 4.6
400 10 100 11.1 36.6 10.9 2.1
400 1 100 10.7 48.5 11.3 2.3
1C3: Propenes
2C4: Butenes and Butadienes
3Pentadienes: 1,3-pentadiene and 1,4-pentadiene

Page 34 / 49 Abdelrahman, et al.
Table S16. Summary of the dehydra-decylization of 3-methyltetrahydrofuran (3-MTHF) to
isoprene over tricalcium phosphate using the microcatalytic method.
Temperature
(°C)
Space velocity
(s-1
)
Conversion
(%)
Selectivity (%)
C31 C4
2 Isoprene Pentadiene
3
200 89 0.03 10.7 16.4 26.6 6.8
200 10 0.04 1.2 23.0 21.2 20.0
200 1 0.04 1.6 25.2 18.2 20.7
250 89 0.05 11.1 16.7 18.1 20.2
250 10 0.07 2.4 32.7 16.9 14.8
250 1 0.13 3.0 39.4 11.3 11.6
300 89 0.07 14.2 29.8 19.5 16.1
300 10 0.16 4.7 36.8 13.0 11.8
300 1 0.30 8.0 41.5 10.9 10.2
350 89 0.16 12.5 29.7 16.5 11.4
350 10 0.34 10.3 35.9 11.3 10.5
350 1 0.60 12.3 37.8 10.5 10.3
400 89 0.30 14.9 31.6 12.0 10.6
400 10 0.60 14.1 36.7 9.4 9.2
400 1 1.03 11.6 36.9 7.7 8.2
1C3: Propenes
2C4: Butenes and Butadienes
3Pentadienes: 1,3-pentadiene and 1,4-pentadiene

Page 35 / 49 Abdelrahman, et al.
Table S17. Packed bed reactor summary of 3-MTHF dehydra-decyclization to isoprene over
SiO2.Al2O3.
T (oC)
WHSV
(g 3-MTHF gcat-1
hr-1
)
P3-MTHF
(torr)
Selisoprene
(%)
Selpentadiene
(%)
Conversion
(%)
Carbon Balance
(%)
300 0.70 1.54 35.3 56.6 15.3 104.7
315 0.70 1.54 32.6 54.8 20.7 96.7
330 0.70 1.54 31.3 52.6 29.0 101.3
350 0.70 1.54 28.8 49.0 45.1 100.1
Table S18. Packed bed reactor summary of 3-MTHF dehydra-decyclization to isoprene over P-
SPP.
T (oC)
WHSV
(g 3-MTHF gcat-1
hr-1
)
P3-MTHF
(torr)
Selisoprene
(%)
Selpentadiene
(%)
Conversion
(%)
Carbon Balance
(%)
275 0.36 1.54 55.2 75.6 4.3 93.5
300 0.36 1.54 59.8 80.7 6.4 97.3
315 0.36 1.54 61.3 83.4 8.4 97.2
325 0.36 1.54 62.3 85.0 9.8 107.5
Page 36 / 49 Abdelrahman, et al.
11.0 Catalytic Experimental Results: Isopropanol dehydration
To assess the performance of the packed bed reactor, the dehydration reaction of
isopropanol to propene was examined over the silica alumina catalyst. Typically, alcohol
dehydration reactions exhibit a near zero order dependence in alcohol partial pressure and an
apparent activation barrier of approximately 100 kj mol-1
under kinetic control [35,36]. At 398
K, the reaction order in isopropanol was measured to be 0.18 ± 0.03 with an apparent barrier of
92.3 ± 11.4 kJ mol-1
. Uncertainty in kinetic measurements are reported at a 95% confidence
level.

Page 37 / 49 Abdelrahman, et al.
12.0 Product identification: Mass Spectrum Fragmentation Patterns
Verification of the identity of product chemical compounds was conducted through the
injection of standards and comparison with retention times by gas chromatography. In addition,
the microcatalytic method was coupled with a gas chromatography system with a mass
spectrometer detector. In a manner identical to which the microcatalytic method was
implemented (Section 5.0), a quartz tube packed with catalyst was placed in the liner of a GC
equipped a mass spectrometer detector. Shown in Figures S9-S13 are the mass spectrum
fragmentation patterns of the various products detected in the course of applying the
microcatalytic method to a P-SPP catalyst with 3-MTHF as the injected reactant.

Page 38 / 49 Abdelrahman, et al.
Figure S9. Mass spectrum fragmentation pattern of isoprene A produced over P-SPP from 3-
MTHF using the microcatalytic method at 400 oC B NIST mass spectrum fragmentation pattern
library

Page 39 / 49 Abdelrahman, et al.
Figure S10. Mass spectrum fragmentation pattern of 1,3 Pentadiene A produced over P-SPP
from 3-MTHF using the microcatalytic method at 400 oC B NIST mass spectrum fragmentation
pattern library
Page 40 / 49 Abdelrahman, et al.
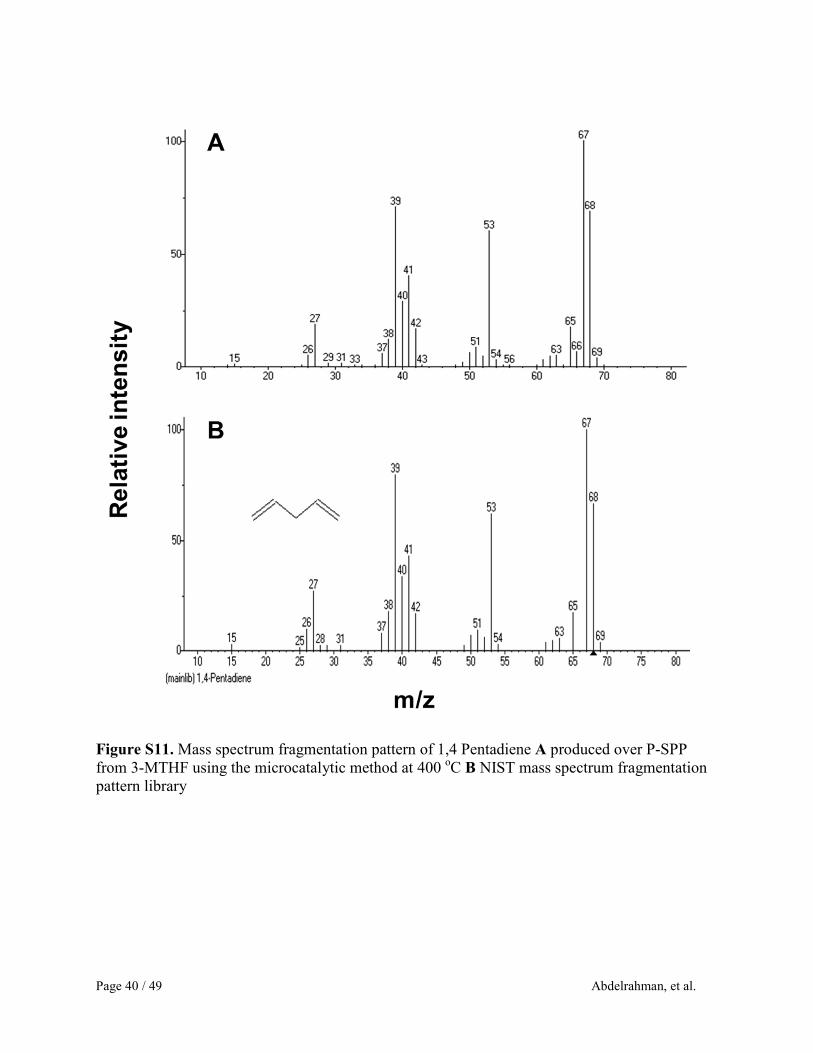
Figure S11. Mass spectrum fragmentation pattern of 1,4 Pentadiene A produced over P-SPP
from 3-MTHF using the microcatalytic method at 400 oC B NIST mass spectrum fragmentation
pattern library
Page 41 / 49 Abdelrahman, et al.
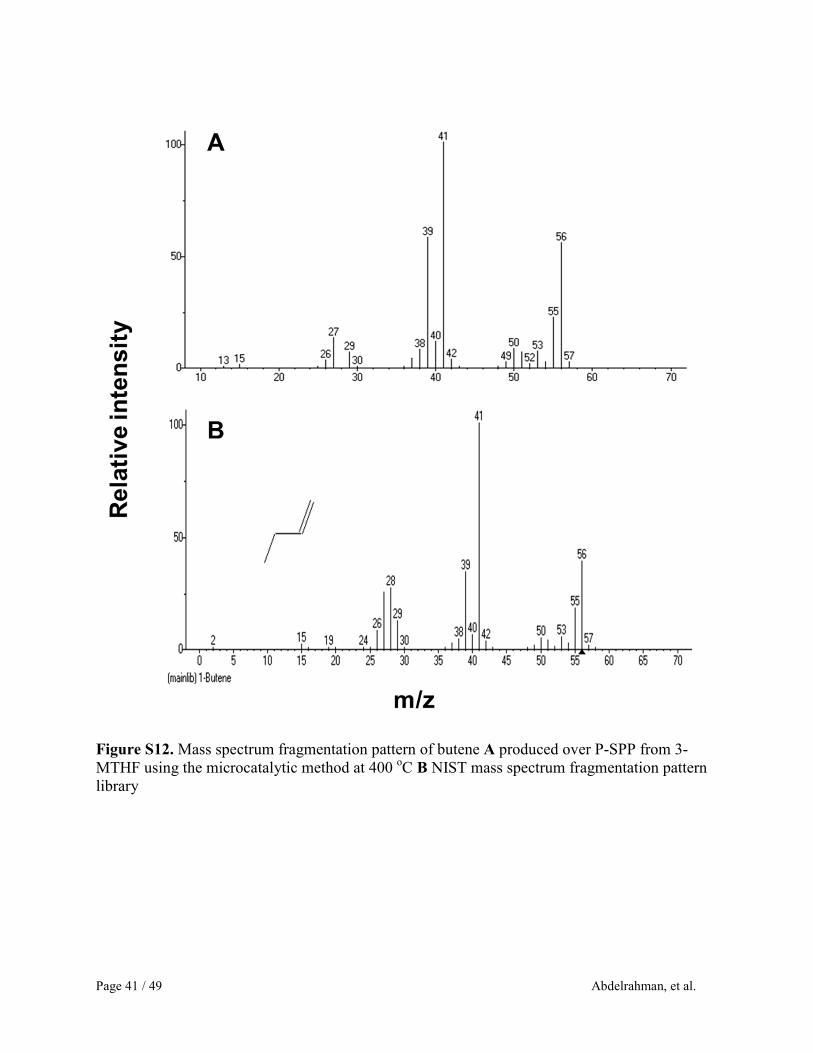
Figure S12. Mass spectrum fragmentation pattern of butene A produced over P-SPP from 3-
MTHF using the microcatalytic method at 400 oC B NIST mass spectrum fragmentation pattern
library

Page 42 / 49 Abdelrahman, et al.
Figure S13. Mass spectrum fragmentation pattern of propene A produced over P-SPP from 3-
MTHF using the microcatalytic method at 400 oC B NIST mass spectrum fragmentation pattern
library

Page 43 / 49 Abdelrahman, et al.
13.0 Experimental three-dimensional selectivity map
An advantage of the microcatalytic method is the ability to rapidly screen multiple
reaction conditions. Given that injections of the reactant (3-MTHF) were performed using a GC
automated liquid sampler, a variety of reaction conditions could be sampled through an
automated process (GC software). Automated GC software permits the organization of inlet
condition sequences (i.e. long lists of temperature and flow conditions / space velocity).
Therefore, in an effort to identify the reaction conditions that optimize the production of the
desired product, isoprene, a grid of 112 reactions conditions was tested. The grid of points
spanned twelve different temperatures ranging from 225 to 400 oC, in addition to fourteen
different space velocities ranging from 0.9 to 180 s-1
.
To avoid systematic errors, the order of experimental trials with varying reaction
temperature and space velocity depicted in Figure 3 was randomized. Also, given the nature of
the reaction chemistry, oxygenated hydrocarbons reacting over solid acid catalysts, deactivation
through coke deposition was present. Not accounting for parasitic phenomena such as
deactivation can unfortunately lead to misleading representations of catalytic data. Therefore, to
avoid the manifestation of artifacts resulting from catalyst deactivation, reference conditions
were routinely utilized to ensure all catalytic data was compared equally. Once the catalyst was
first placed on stream, a reference condition was selected and tested multiple times in a row to
establish a catalytic baseline. Using this catalytic reference point, a bracketing technique was
employed to explore a new condition followed by a return to the reference point. Essentially,
every data point was “bracketed” on either end by the reference condition. This bracketing
technique was continuously applied throughout the process of constructing the reaction
Page 44 / 49 Abdelrahman, et al.
conditions grid, allowing us to ensure that all catalytic data was compared relative to the same
reference point established with a pristine catalyst.
Once collected, the data at all conditions was arranged by temperature and space velocity
with their corresponding selectivity to each of the products. This grid of catalytic information
was then plotted in MATLAB, where a colored contour plot could be created using existing 3D-
plotting tools. Given the discrete nature of the data collected, data interpolation was required to
create a three-dimensional continuous contour plot. Presented in Figure 3 of the text is the
contour plot created through interpolation via polynomial smoothing of the overall data set. The
data was first empirically fit to a 5th
order polynomial in both temperature and space velocity
while minimizing the residual error. Illustrated in Figure S14 is the parity plot between the
polynomial fit (5th
order) and the experimental data for isoprene selectivity where reasonable
agreement is obtained. It is worth noting that no form of extrapolation was applied to the data
set.

Page 45 / 49 Abdelrahman, et al.
Figure S14. Parity plot of the fifth order polynomial fit (Figure 3) of isoprene selectivity versus
experimental data.
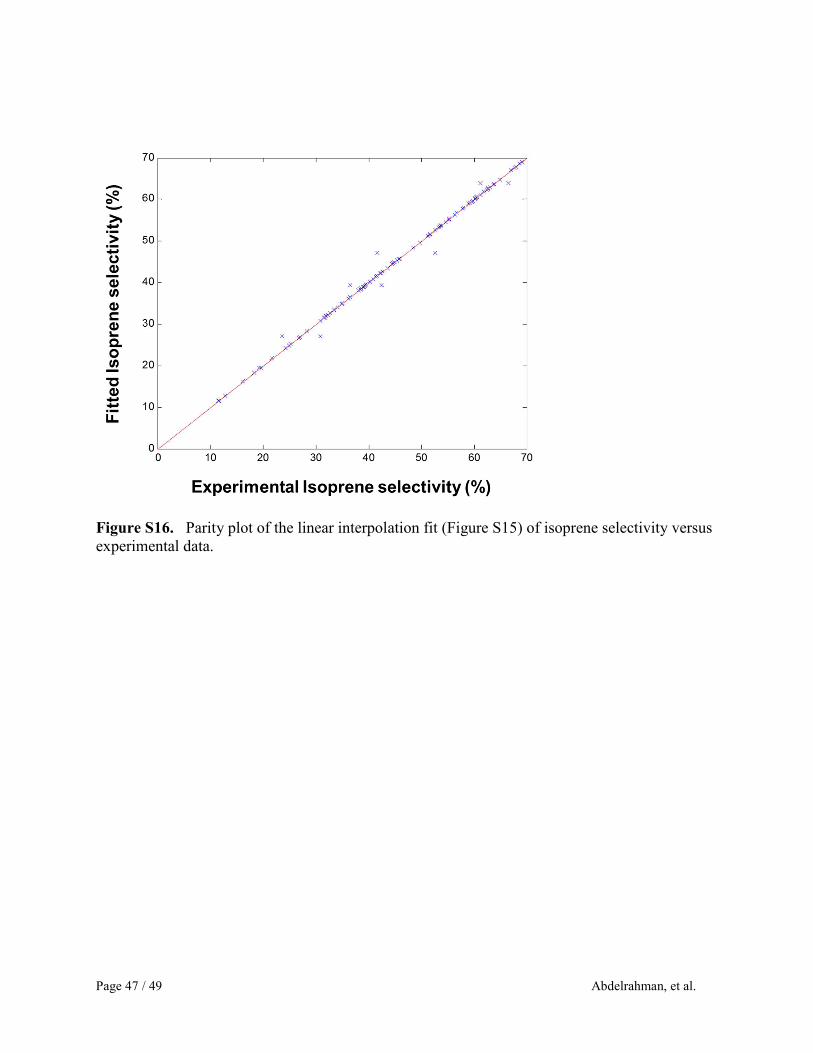
Alternatively, a linear interpolation can be applied as shown in Figure S15, where the
data between two experimental points is calculated to be a linear average; linear interpolation by
this method is a MATLAB built-in function. The trends of selectivity to products appear to be
the same when comparing the resulting plot (Figure S14) to that in Figure 3 of the text; isoprene
formation is favored at low space velocities and an intermediate temperature of ~ 325 oC. The 3D
plot resulting from linear interpolation, however, is more textured, which is likely the result of
experimental variability. The linear interpolation, however, provides a tighter fit of the
experimental data, shown in the parity plot for isoprene selectivity in Figure S16.

Page 46 / 49 Abdelrahman, et al.
Figure S15. Linear Interpolation Depiction of Figure 3. A three-dimensional plot of 112
experimental measurements of selectivity to isoprene (large panel), pentadienes (upper right),
and butane/propene (lower right). The color map is presented using a linear interpolation of the
experimental data.
Page 47 / 49 Abdelrahman, et al.
Figure S16. Parity plot of the linear interpolation fit (Figure S15) of isoprene selectivity versus
experimental data.

Page 48 / 49 Abdelrahman, et al.
14.0 Time-on-Stream (TOS) Study of P-SPP Catalyst.
To evaluate the long-term activity of P-SPP catalyst and selectivity to dienes, we have
also evaluated the stability of the P-SPP catalyst during the course of 3-MTHF dehydra-
decyclization at 325°C and a partial pressure of 5.5 torr. Shown in Figure S17 is the 3-MTHF
conversion profile with time on stream (TOS), where the conversion drops from 43% initially to
16% after approximately 18 hours on stream. Interestingly, the selectivity to dienes appears to
increase initially, where the selectivity to isoprene and dienes (isoprene plus 1,3 pentadiene)
stabilizes at approximately 66 and 86 %, respectively. Throughout the course of evaluating the
catalyst’s stability, the carbon balance was maintained at an average value of 98%.
Figure S17. Time-on-stream study of isoprene production. The vapor-phase conversion (blue, ●) of
3-methyl-tetrahydrofuran was selective to isoprene (orange, ●) and dienes (isoprene + 1,3-pentadiene,
grey, ●). The carbon balance (yellow, ●) of each experiment equals 100% within experimental error.
Catalyst: P-SPP, Temperature: 325 °C, Partial pressure: 5.5 torr.
Page 49 / 49 Abdelrahman, et al.
References
[31] Cho, H. J.; Ren, L.; Vattipailli, V.; Yeh, Y. H.; Gould, N.; Xu, B.; Gorte, R. J.; Lobo, R.;
Dauenhauer, P. J.; Tsapatsis, M.; Fan, W. ChemCatChem 2017, 9, 1-6.
[32] Frisch, M. J.; Trucks, G. W.; Schlegel, H. B.; Scuseria, G. E.; Robb, M. A.; Cheeseman, J.
R.; Scalmani, G.; Barone, V.; Mennucci, B.; Petersson, G. A.; Nakatsuji, H.; Caricato, M.; Li,
X.; Hratchian, H. P.; Izmaylov, A. F.; Bloino, J.; Zheng, G.; Sonnenb, D. J. Gaussian 09 (Rev.
A.2); Gaussian, Inc. Wallingford, CT, 2009.
[33] Marenich, A.V.; Cramer, C.J.; Truhlar, D.G. J. Phys. Chem. B 2009, 113, 6378-6396.
[34] Ochterski, J.W. Gaussian Inc, Pittsburgh, PA 2000, 1-17.
[35] Bedia, J.; Ruiz-Rosas, R.; Rodríguez-Mirasol, J.; Cordero, T. J. Catal. 2010, 271, 33-42
[36] Turek, W.; Haber, J.; Krowiak, A. Appl. Surf. Sci. 2005, 252, 823-827