supporting information lignin extraction from biomass … · supporting information lignin...
TRANSCRIPT
Supporting Information
Lignin extraction from biomass with protic ionic liquids
Ezinne C. Achinivu,a Reagan M. Howard,
a Guoqing Li,
a Hanna Gracz,
b and Wesley A.
Hendersona,*
*To whom correspondence should be addressed. Email: [email protected] aIonic Liquids & Electrolytes for Energy Technologies (ILEET) Laboratory, Department of Chemical & Biomolecular
Engineering, North Carolina State University, Raleigh, NC 27695, United States bBiomolecular Nuclear Magnetic Resonance - Bio-NMR Facility, Department of Molecular and Structural Biochemistry, North
Carolina State University, Raleigh, NC 27695, United States
Table of Contents
Material and Methods 1
PIL Characterization 5
Ionicity and Proton Transfer 8
Solubility of Biomass Components in PILs 10
PIL Recyclability and Characterization of Recoverd Materials 12
PIL Recovery and Lignin Extractability from Biomass 19
Effect of Heating on PILs 22
Effect of Water Content on PILs (NMR Analysis) 26
Electronic Supplementary Material (ESI) for Green ChemistryThis journal is © The Royal Society of Chemistry 2014
1
MATERIALS/METHODS
Materials
Air-dried corn stover (CS), supplied by Novozymes North America, Inc. (Franklinton, NC),
was ground with a Wiley knife mill (model 4, Thomas-Wiley Co., Philadelphia, PA) using a 2
mm screen. The ground CS was subsequently size-partitioned and extracted using benzene/
ethanol (2:1 v/v) according to the standard NREL procedures LAP-0211 and LAP-010,
2
respectively, to produce extractive-free CS (EF-CS). The EF-CS was air-dried for 72 h.
Kraft lignin (i.e., Indulin-AT) (pine lignin, 93% total solids (TS), 6% ash) (Mead West Vaco,
Glen Allen, VA), microcrystalline cellulose powder (particle size 20 mm, Sigma product number
310697) and xylan from beech wood (Sigma product number X4252) were used as-received.
Pyridine, methylimidazole and pyrrolidine, of at least 99% purity, were purchased from Sigma-
Aldrich and used as-received. High-purity glacial acetic acid (HAc), ethanol (EtOH) and aqueous
H2SO4 (72% w/w) were purchased from Fisher Scientific and used as-received. Triple-distilled
water was used for the preparation of all aqueous solutions and for CS washes.
Instrumentation The water content of the PILs was determined using a Mettler Toledo DL39 Karl Fischer
coulometer. Anolyte and catholyte were "coulomat AG" purchased from Hydranal (Sigma
product number 34836). Density and viscosity measurements were performed using an Anton-
Paar SVM 3000 Stabinger viscometer (with an internal density meter). Calibration of the
instrument was performed with Cannon certified viscosity standards. Isopropanol and N2 gas (>
99.99%, H2O concentration 2-5 ppm) were used to clean the instrument before and after the
measurements. The instrument was sealed during use to prevent water contamination. The water
content was checked before and after the measurements using the Karl Fischer coulometer to
ensure that no increase in the water content occurred during the measurements. Density and
viscosity values were recorded from 0 to 50 °C in 5 °C increments.
The conductivity of the PILs was measured with electrochemical impedance spectroscopy
using a Solartron 1287A potentiostat and 1260A impedance analyzer. Spectra were collected
from 106 to 20 Hz with a 10 mV ac perturbation. The hermetically-sealed conductivity cells
consisted of two parallel Pt electrodes. The cell constants were determined using aqueous KCl
standard solutions. Samples were equilibrated in a Binder environmental chamber at
temperatures between 0 and 50 °C in 5 °C increments with at least 45 min allowed for
equilibration after each temperature change before the measurements were taken.
DSC analysis was performed on a TA Instruments Q2000 differential scanning calorimeter.
The instrument was calibrated with cyclohexane (solid–solid phase transition at -87.06 °C, melt
transition at 6.54 °C) and indium (melt transition at 156.60 °C). Typically, sample pans were
slowly cooled (5 °C min-1
) to -150 °C and then heated (5 °C min-1
) to 50 °C. In cases where a
melting peak was observed, it was necessary to hold or cycle the samples extensively at various
temperatures in the instrument prior to the final measurements to confirm complete
crystallization (where possible).
TGA measurements were performed using a TA Instruments Q5000 thermogravimetric
analyzer. The thermal stability of the PILs was analyzed by heating (5 °C min-1
) the PILs in a Pt
pan from ambient temperature to 400 °C. Separate samples of each PIL were also analyzed
isothermally at 90 °C for 24 h. All TGA experiments were performed under a N2 atmosphere (>
99.99% N2, H2O concentration 2-5 ppm).
Electronic Supplementary Material (ESI) for Green ChemistryThis journal is © The Royal Society of Chemistry 2014

2
Combinations of homonuclear 1H- and
13C-NMR analysis were applied to study the structure
of the synthesized PILs. All of the pulsed-field NMR experiments were performed on a Bruker
Avance 500 MHz spectrometer with an Oxford Narrow Bore magnet. The NMR sample tubes
were prepared by transferring samples of approximately 0.6 ml of the PILs into 5 mm NMR
tubes with an external D2O capillary for lock purpose. All spectra were acquired at a temperature
of 21 °C. DSS was used as an internal standard. The NMR probe was tuned to the 13
C frequency,
which is 125.75 MHz in the 500 MHz spectrometer (1H frequency-500.128 MHz). A single
frequency carbon probe was used to run the 1-D 13
C spectra (δH 2.6 for DMSO-d6).
UV/Vis spectra were acquired using a JASCO spectrophotometer (V-550).
Dry biomass samples (EF-CS and the CS treated with the PILs, i.e., PIL-CS) were ground
with a 0.5 mm screen and then randomly picked for XRD measurements. The measurements
were performed using a Rigaku SmartLab X-ray diffractometer with a Cu target-ray tube
(operating at 40 kV and 44 mA) as the source. The diffraction patterns were taken in a 2θ range
between 10° and 40° using 1° increments. The ion chromatograph (IC) (Dionex ICS-5000,
Dionex Corporation, Sunnyvale, CA) was equipped with a pulsed electrochemical detector. The
column used was a CarboPac PA1 (4 x 250 mm) column which was operated at 18 °C with
0.018M KOH as the mobile phase at a flow rate of 0.9 ml min-1
. All of the above measurements
were performed in duplicate to ensure reproducibility.
The morphology of the untreated and treated CS was examined with a scanning electron
microscope (Phenom, FEI). Before imaging, all biomass samples were sputter-coated in a
Quorum Technologies mini sputter coater (Model SC7620) with a Au/Pd target for 120 s at 20
mA. All images were obtained at acceleration voltages of 5 kV and a magnification of 500x.
Photographic images of up to 10x magnification were also taken using a Canon Rebel T3i EOS
600D 18.0 MP Digital SLR Camera.
PIL Synthesis High-purity PILs were synthesized by adding the acid and bases as neat reagents to eliminate
both the need for solvent and the introduction of incidental water. Similar to previous studies,3-4
the PILs were synthesized using a round-bottom flask equipped with two addition funnels—one
for the acid and one for the base. The reagents were slowly added into the flasks and
homogenized with a magnetic stirring bar. The flasks were mounted in an ice/water bath to
prevent heat buildup during the reactions. Stirring was continued for 24 h at room temperature to
obtain a clear liquid. The water content of the PILs was measured and then they were
hermetically-sealed in crimp-top vials to prevent moisture contamination.
Solubility of Lignin, Xylan and Cellulose in Solvents (PILs and Reagents) The solubility of the commercially available lignin, xylan and cellulose (biomass
components) in the PILs was determined by initially adding 1% w/w of the biomass components
to glass vials containing 5 g of the solvents (i.e., PILs and reagents). The vials were hermetically-
sealed to prevent loss of the solvent and stirred for 24 h at 90 °C in an Al heating block. The
solutions were then visually checked to determine whether dissolution had occurred. If a given
solution was transparent with no undissolved solids, the amount of the biomass component was
incrementally adjusted to increase the mass fraction to 2, 5 or 10% w/w and stirred for another
24 h at 90 °C. The addition was continued until the solution appeared to be heterogeneous. To
determine the exact amount dissolved, the mixtures were centrifuged to separate any undissolved
solids. The supernatants were then carefully transferred to other vials and sealed. Needles were
Electronic Supplementary Material (ESI) for Green ChemistryThis journal is © The Royal Society of Chemistry 2014
3
then inserted into the septum tops and the vials were placed in a vacuum oven to remove the
PILs or reagents. The amount of solid (lignin, xylan or cellulose) remaining after solvent
removal, determined gravimetrically, is indicative of the amount of lignin, xylan or cellulose that
went into solution. From this information, the final solubility of each component in the solvent
was calculated. This technique is particularly useful for determining lignin solubility due to the
dark color of lignin solutions, which make visual observations or optical microscopy ineffective.
PIL Distillation/Recovery Tests
To corroborate the recyclability trends observed, mixtures consisting of 5% w/w lignin
dissolved in each PIL were prepared and stirred for at least 30 min at 90 °C to ensure that all of
the lignin dissolved. These mixtures were then connected to the vacuum distillation line to
separate the PILs from the lignin (see below). Yields of the recovered material was determined,
as well as their purity, via NMR analysis.
PIL Heating (Stability) Test
Heating tests were run to determine the effect of extended heating on the PILs. The pure PILs
were hermetically-sealed in crimp-top vials (to prevent loss of the PILs) and stirred for 24 h at 90
°C in an Al heating block. Color changes in the PILs were used to initially assess the effect of
heating on the PILs and possible impurity formation. For the [Pyrr][Ac] PIL, UV/Vis analysis
was employed to relate the rate of discoloration to the rate of impurity (amide) formation at
different times. NMR analysis was also used to track the formation of impurities and to
determine the possible chemical structure of the impurity(ies).
PIL Pretreatment of Corn Stover Dried EF-CS was added to round-bottom flasks containing PILs that had been equilibrated
for 30 min at 90 °C (5% w/w solids loading rate). The mixtures were stirred for 24 h and finally
separated using a vacuum filtration line. The filtrate (Liquor 1) was collected for lignin
recovery/PIL distillation tests (Liquor 2 is the water-wash on the recovered lignin after
distillation of the PIL from Liquor 1). The leftover biomass solid was washed to remove any
remaining PIL/lignin using a two-step wash sequence. This involved an initial rinse with 1 L of
ethanol (Liquor 3) followed by a rinse with at least 2 L of water (Liquor 4) until a clear filtrate
was observed and no ethanol was detected using UV/VIS analysis. The recovered solids were
left to equilibrate overnight in the refrigerator, after which the moisture content was calculated,
NREL Laboratory Analytical Procedure LAP−002,5 to determine the amount of total solids
recovered. The collected materials, referred to as PIL-CS, were separated into two fractions: one
was air-dried, passed through a 0.5 mm screen and stored in a parafilm-sealed vial in a desiccator
for subsequent compositional analysis and XRD measurements, while the other was utilized for
the SEM analysis (see the process flow diagram—Scheme 2—for the definition of the various
fractions).
For time-dependent measurements, 1 ml aliquots of the PIL/CS mixtures were taken and
centrifuged to separate the solids from the liquids. The trend in lignin removal was determined
using UV/Vis analysis on the supernatant collected. The complete visible spectrum (200-800
nm) of each sample was collected to determine the wavelength of the maximum absorbance. The
change in absorbance at this wavelength was used to access the change in lignin content for each
measurement time.
Electronic Supplementary Material (ESI) for Green ChemistryThis journal is © The Royal Society of Chemistry 2014

4
Compositional Analysis EF-CS, PIL-CS, extracted solids and lignin were analyzed for their lignin, carbohydrate and
ash content using NREL Laboratory Analytical Procedure LAP−002.5 Dried samples (TS of at
least 90%) were treated with 72% w/w H2SO4 at 30 °C for 1 h, followed by dilute acid (4% w/w)
at 121 °C for 1 h. The acid-hydrolyzed samples were separated with a filtering crucible after
cooling to near room temperature. The residues were used to measure the acid-insoluble lignin
and ash content. The filtrate was used to determine the acid-soluble lignin using a UV/Vis
spectrophotometer at 320 nm with an extinction coefficient value of 30 L g-1
cm-1
and for
analysis of the monosaccharide concentrations using the IC system described above. The
cellulose and xylan contents were calculated from the glucose (5-carbon) and xylose (4-carbon)
content multiplied by conversion factors of 0.90 and 0.88, respectively, to account for the water
released during the hydrolysis.5
Electronic Supplementary Material (ESI) for Green ChemistryThis journal is © The Royal Society of Chemistry 2014
5
PIL CHARACTERIZATION
As previously noted, PILs are easily synthesized by the transfer of a proton from an acid to a
base. The method to synthesize the pure PILs did not use water or other solvents as a reaction
medium in order to minimize the PIL water contamination and the heating required to remove
the water/solvents after the PIL synthesis. The water content of the PILs did not exceed 0.50%
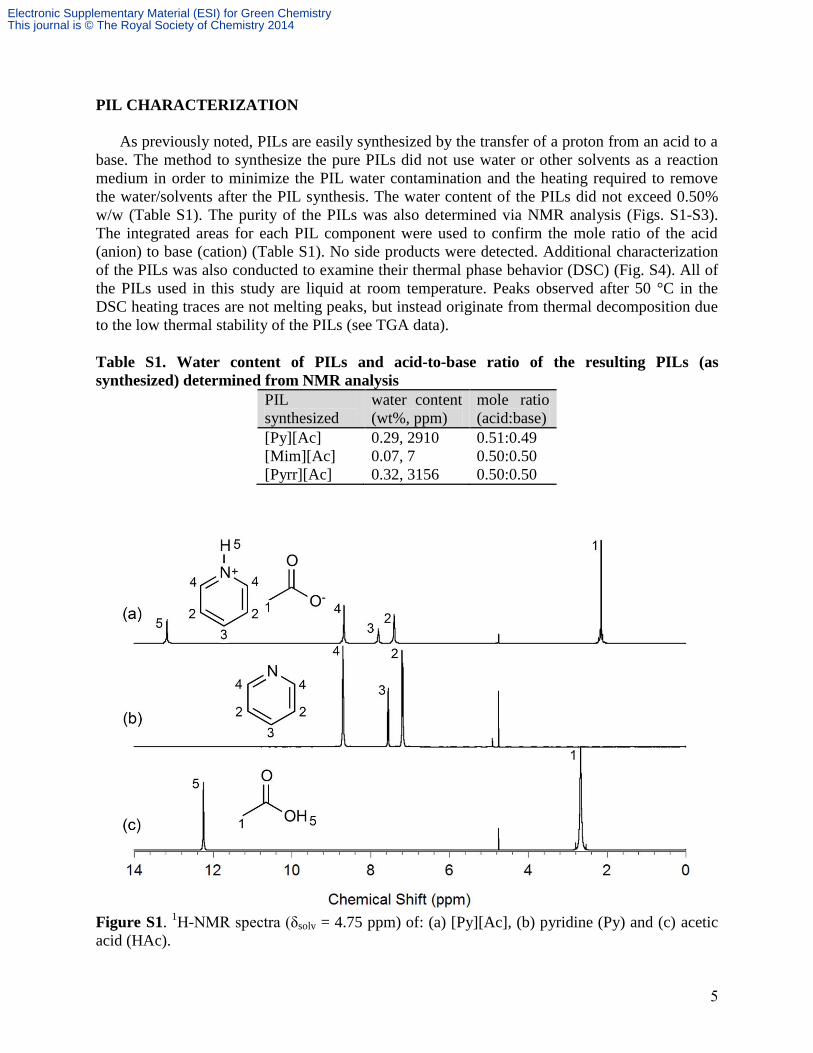
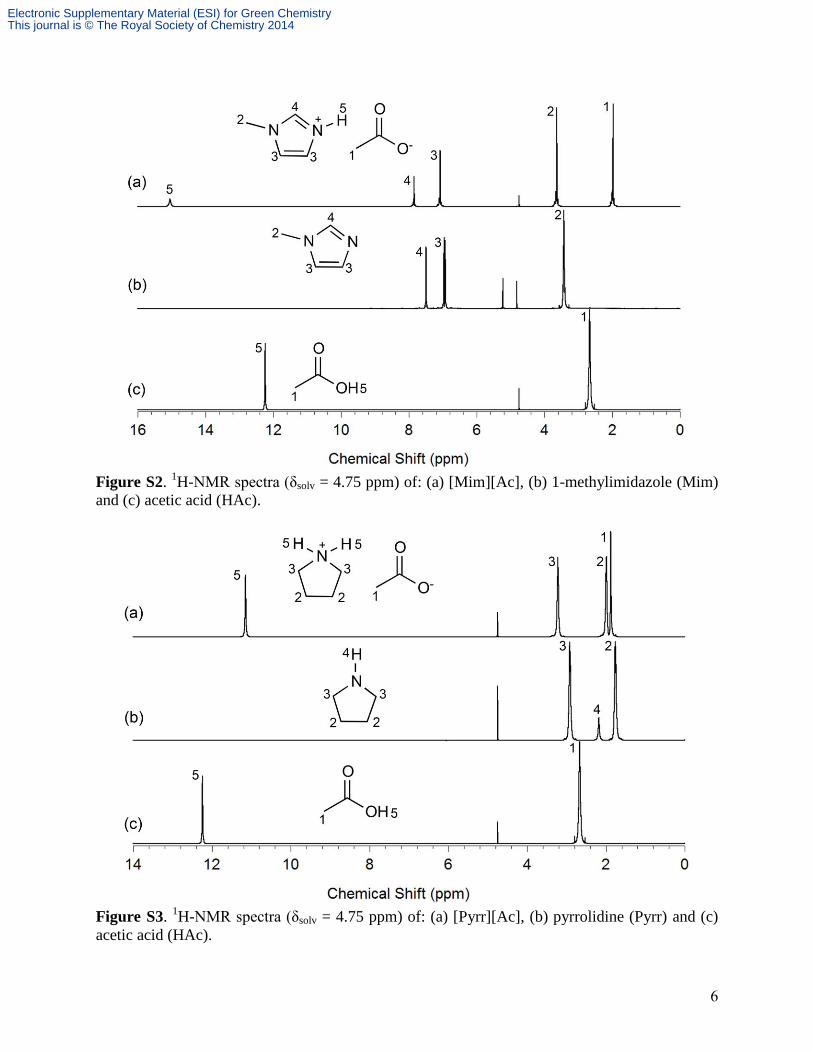
w/w (Table S1). The purity of the PILs was also determined via NMR analysis (Figs. S1-S3).
The integrated areas for each PIL component were used to confirm the mole ratio of the acid
(anion) to base (cation) (Table S1). No side products were detected. Additional characterization
of the PILs was also conducted to examine their thermal phase behavior (DSC) (Fig. S4). All of
the PILs used in this study are liquid at room temperature. Peaks observed after 50 °C in the
DSC heating traces are not melting peaks, but instead originate from thermal decomposition due
to the low thermal stability of the PILs (see TGA data).
Table S1. Water content of PILs and acid-to-base ratio of the resulting PILs (as
synthesized) determined from NMR analysis
PIL
synthesized
water content
(wt%, ppm)
mole ratio
(acid:base)
[Py][Ac] 0.29, 2910 0.51:0.49
[Mim][Ac] 0.07, 7 0.50:0.50
[Pyrr][Ac] 0.32, 3156 0.50:0.50
Figure S1. 1H-NMR spectra (δsolv = 4.75 ppm) of: (a) [Py][Ac], (b) pyridine (Py) and (c) acetic
acid (HAc).
Electronic Supplementary Material (ESI) for Green ChemistryThis journal is © The Royal Society of Chemistry 2014
6
Figure S2. 1H-NMR spectra (δsolv = 4.75 ppm) of: (a) [Mim][Ac], (b) 1-methylimidazole (Mim)
and (c) acetic acid (HAc).
Figure S3. 1H-NMR spectra (δsolv = 4.75 ppm) of: (a) [Pyrr][Ac], (b) pyrrolidine (Pyrr) and (c)
acetic acid (HAc).
Electronic Supplementary Material (ESI) for Green ChemistryThis journal is © The Royal Society of Chemistry 2014

7
Figure S4. DSC heating traces of the PILs used for this study. The large peak for [Py][Ac]
originates from the volatilization of the reagents rather than melting of the salt. The red line
indicates ambient temperature.
Electronic Supplementary Material (ESI) for Green ChemistryThis journal is © The Royal Society of Chemistry 2014
8
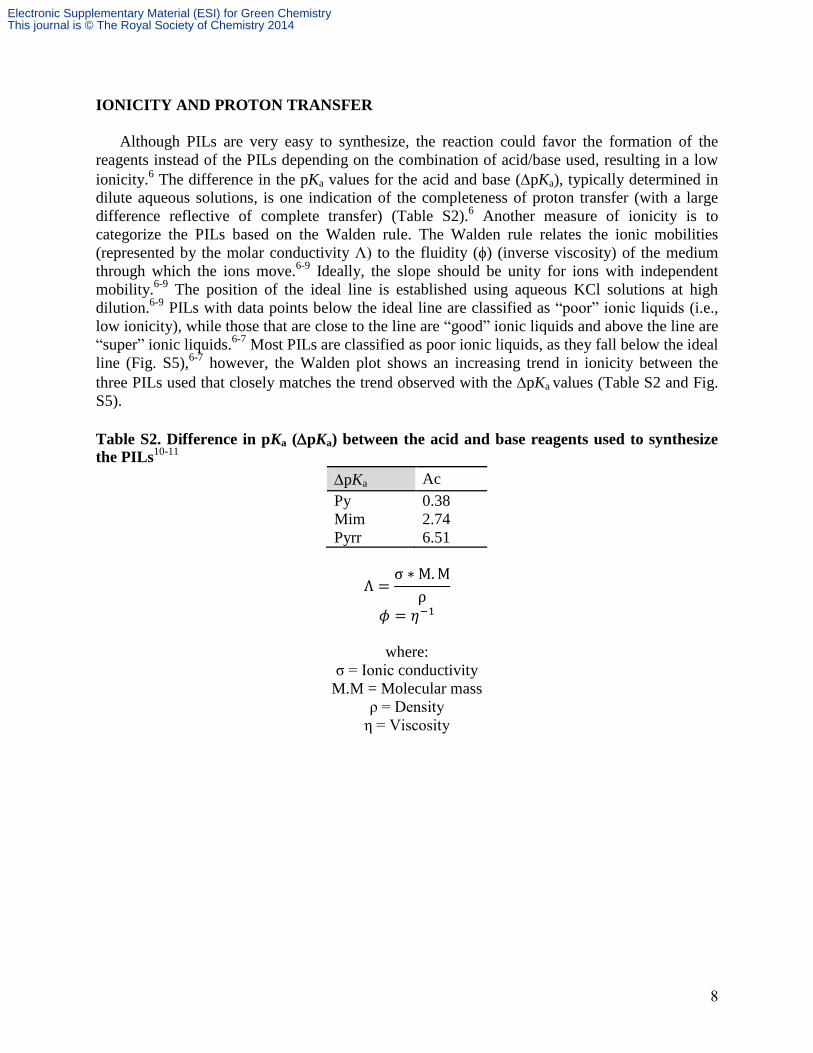
IONICITY AND PROTON TRANSFER
Although PILs are very easy to synthesize, the reaction could favor the formation of the
reagents instead of the PILs depending on the combination of acid/base used, resulting in a low
ionicity.6 The difference in the pKa values for the acid and base (pKa), typically determined in
dilute aqueous solutions, is one indication of the completeness of proton transfer (with a large
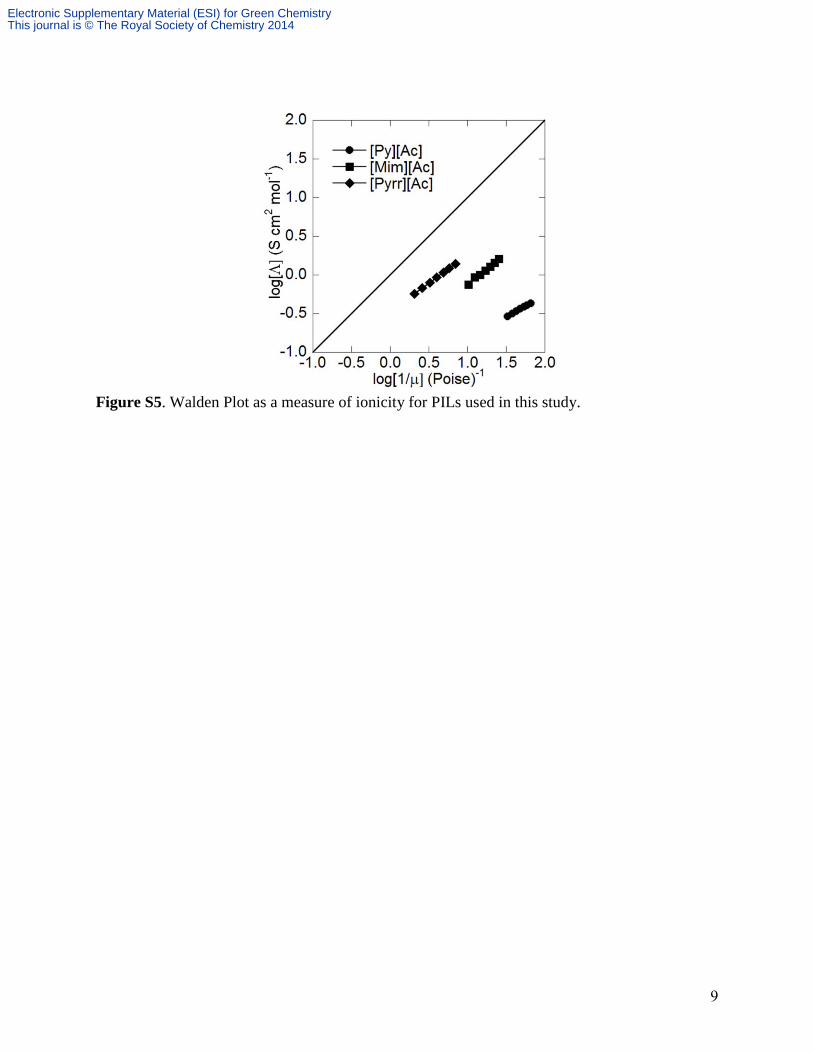
difference reflective of complete transfer) (Table S2).6 Another measure of ionicity is to
categorize the PILs based on the Walden rule. The Walden rule relates the ionic mobilities
(represented by the molar conductivity Λ) to the fluidity (ϕ) (inverse viscosity) of the medium
through which the ions move.6-9
Ideally, the slope should be unity for ions with independent
mobility.6-9
The position of the ideal line is established using aqueous KCl solutions at high
dilution.6-9
PILs with data points below the ideal line are classified as “poor” ionic liquids (i.e.,
low ionicity), while those that are close to the line are “good” ionic liquids and above the line are
“super” ionic liquids.6-7
Most PILs are classified as poor ionic liquids, as they fall below the ideal
line (Fig. S5),6-7
however, the Walden plot shows an increasing trend in ionicity between the
three PILs used that closely matches the trend observed with the pKa values (Table S2 and Fig.
S5).
Table S2. Difference in pKa (pKa) between the acid and base reagents used to synthesize
the PILs10-11
pKa Ac
Py 0.38
Mim 2.74
Pyrr 6.51
where:
σ = Ionic conductivity
M.M = Molecular mass
ρ = Density
η = Viscosity
Electronic Supplementary Material (ESI) for Green ChemistryThis journal is © The Royal Society of Chemistry 2014
9
Figure S5. Walden Plot as a measure of ionicity for PILs used in this study.
Electronic Supplementary Material (ESI) for Green ChemistryThis journal is © The Royal Society of Chemistry 2014

10
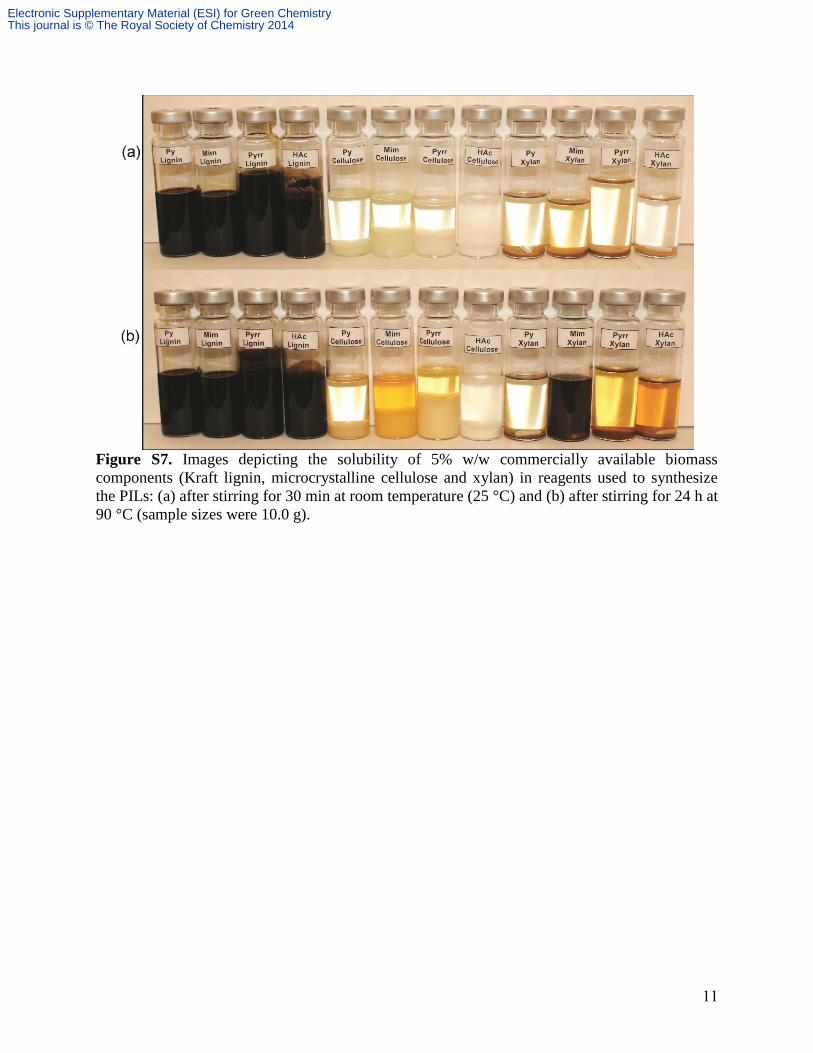
SOLUBILITY OF BIOMASS COMPONENTS IN PILS
Figs. S6 and S7 show the solubility of the commercially available lignin, cellulose and xylan
(biomass components) in the PILs and reagents, respectively, with 5% w/w of the biomass
components added to the glass vials. The vials were hermetically-sealed to prevent loss of the
reagents and stirred for 24 h at 90 °C in an Al heating block. The pictures are helpful for
visualizing the relative solubility of the biomass components and approximating the saturation
concentrations, with the latter determined quantitatively using the method described above.
Figure S6. Images depicting the solubility of 5% w/w commercially available biomass
components (Kraft lignin, microcrystalline cellulose and xylan) in the PILs: (a) after stirring for
30 min at room temperature (25 °C) and (b) after stirring for 24 h at 90 °C (sample sizes were
10.0 g).
Electronic Supplementary Material (ESI) for Green ChemistryThis journal is © The Royal Society of Chemistry 2014
11
Figure S7. Images depicting the solubility of 5% w/w commercially available biomass
components (Kraft lignin, microcrystalline cellulose and xylan) in reagents used to synthesize
the PILs: (a) after stirring for 30 min at room temperature (25 °C) and (b) after stirring for 24 h at
90 °C (sample sizes were 10.0 g).
Electronic Supplementary Material (ESI) for Green ChemistryThis journal is © The Royal Society of Chemistry 2014

12
PIL RECYCLABILITY AND CHARACTERIZATION OF RECOVERED MATERIALS
Using the method previously described, lignin (Kraft lignin) was dissolved in each PIL to
corroborate the recyclability trends implied by the thermal stability data. These PIL/lignin
mixtures were connected to the vacuum distillation line to separate the PILs from the lignin. The
pure PILs (i.e., reagents) were separated and recovered in the receiving flask (distillate) (Fig. 3),
while the distilling flask retained the initially dissolved lignin.
As expected from the TGA analysis (Figs. S8 and S9), the PILs did not require a high
distillation temperature, especially with the application of a partial vacuum (Table S3). The
distillation temperature increased in the same order as the thermal stability trends observed from
the TGA data (Fig. S8). The amount of PIL recovered and its purity were determined both
gravimetrically and via NMR analysis (Table S3, Figs. S10-S12). The recovered PILs and lignin
exhibit similar thermal stability trends to those found for the initial PILs and Kraft lignin used
(Figs. S13-S15). Greater than 90% of the PILs were recovered, but small amounts of the PILs
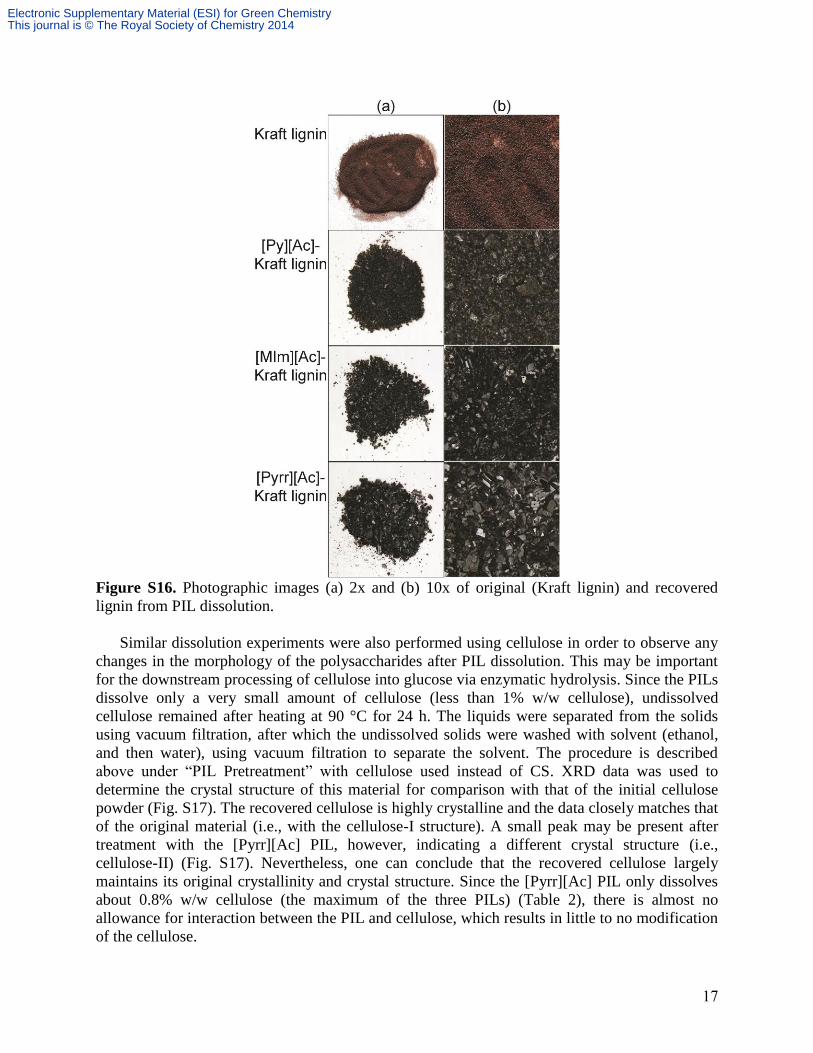
remained with the lignin. Changes in the physical appearance of the lignin are noted which is
most likely due to differences in particle size of the lignin upon re-precipitation (Fig. S16). The
loss in yield of the PILs may be due to some amount of PIL that is strongly coordinated to the
lignin and/or due to amides formed from the degradation side reaction (see below); it was found
that further mass loss occurred with additional periods of drying in a vacuum oven, or by
washing the lignin with a solvent (water/ethanol).
Figure S8. Variable-temperature TGA heating traces of PILs (5 °C min-1
).
Electronic Supplementary Material (ESI) for Green ChemistryThis journal is © The Royal Society of Chemistry 2014

13
Figure S9. Isothermal TGA heating traces (90 °C) of PILs. Note that the biomass processing
with the PILs occurs in sealed containers, in contrast to the TGA measurements.
Table S3. PIL yield after recovery from each PIL, distillation conditions and mole ratio of
acid-to-base from NMR analysis
PIL used % recovered
mole fraction
(acid:base)
(NMR)
distillation
conditions
(T, P)
[Py][Ac] 98.15 0.49:0.51 50, 0.1 torr
[Mim][Ac] 96.75 0.50:050 70, 0.1 torr
[Pyrr][Ac] 93.18 0.51:0.49 100, 0.1 torr
Electronic Supplementary Material (ESI) for Green ChemistryThis journal is © The Royal Society of Chemistry 2014

14
Figure S10. 1H-NMR spectra (δsolv = 4.75 ppm) of PIL ([Py][Ac]): (a) after synthesis and (b)
after distillation from Kraft lignin/PIL solution.
Figure S11. 1H-NMR spectra (δsolv = 4.75 ppm) of PIL ([Mim][Ac]): (a) after synthesis and (b)
after distillation from Kraft lignin/PIL solution.
Electronic Supplementary Material (ESI) for Green ChemistryThis journal is © The Royal Society of Chemistry 2014
15
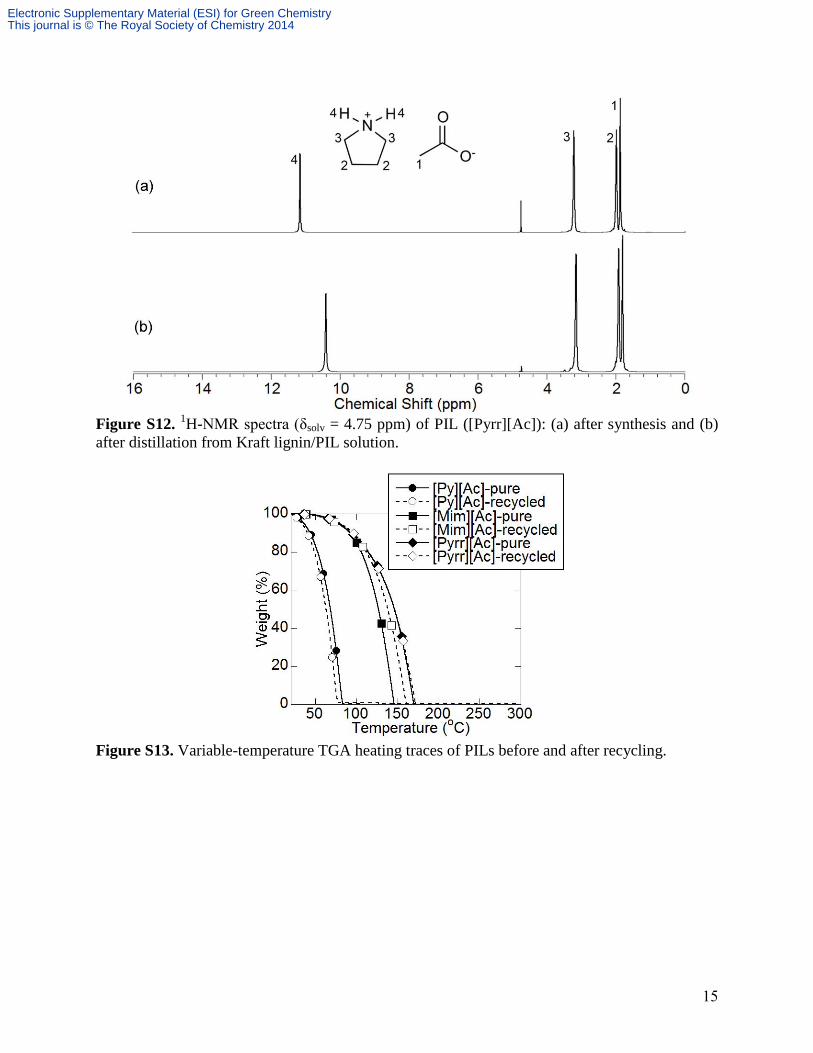
Figure S12. 1H-NMR spectra (δsolv = 4.75 ppm) of PIL ([Pyrr][Ac]): (a) after synthesis and (b)
after distillation from Kraft lignin/PIL solution.
Figure S13. Variable-temperature TGA heating traces of PILs before and after recycling.
Electronic Supplementary Material (ESI) for Green ChemistryThis journal is © The Royal Society of Chemistry 2014
16
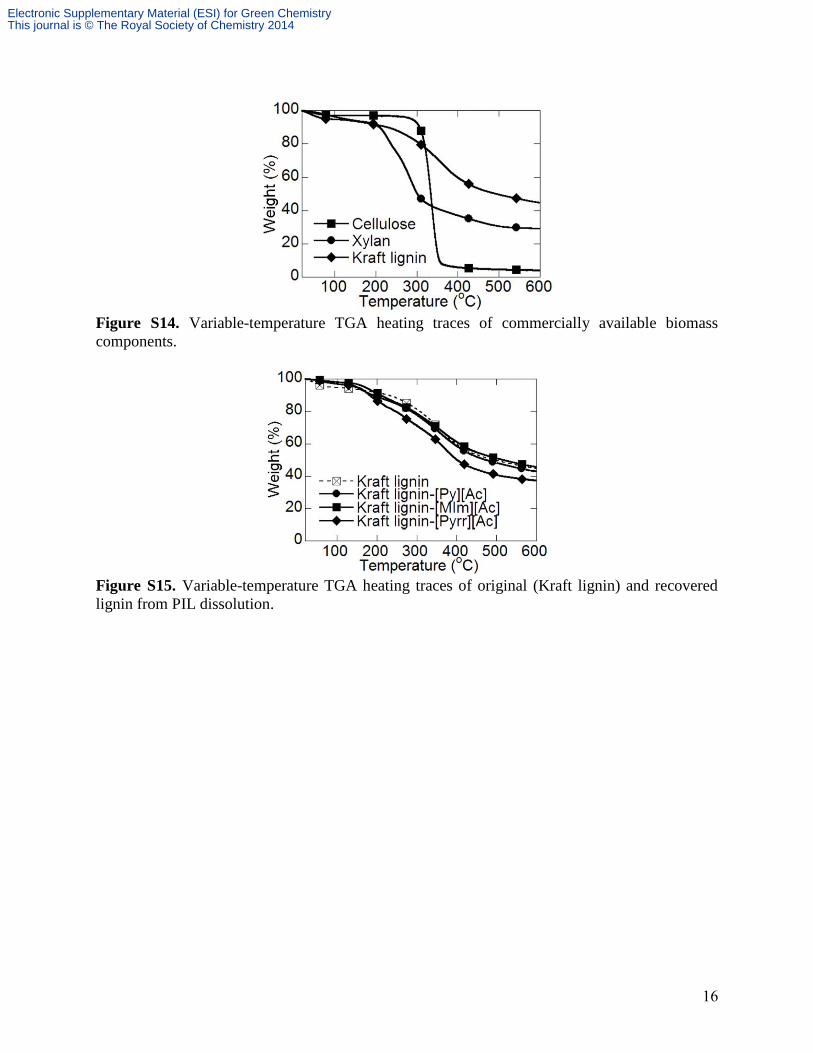
Figure S14. Variable-temperature TGA heating traces of commercially available biomass
components.
Figure S15. Variable-temperature TGA heating traces of original (Kraft lignin) and recovered
lignin from PIL dissolution.
Electronic Supplementary Material (ESI) for Green ChemistryThis journal is © The Royal Society of Chemistry 2014
17
Figure S16. Photographic images (a) 2x and (b) 10x of original (Kraft lignin) and recovered
lignin from PIL dissolution.
Similar dissolution experiments were also performed using cellulose in order to observe any
changes in the morphology of the polysaccharides after PIL dissolution. This may be important
for the downstream processing of cellulose into glucose via enzymatic hydrolysis. Since the PILs
dissolve only a very small amount of cellulose (less than 1% w/w cellulose), undissolved
cellulose remained after heating at 90 °C for 24 h. The liquids were separated from the solids
using vacuum filtration, after which the undissolved solids were washed with solvent (ethanol,
and then water), using vacuum filtration to separate the solvent. The procedure is described
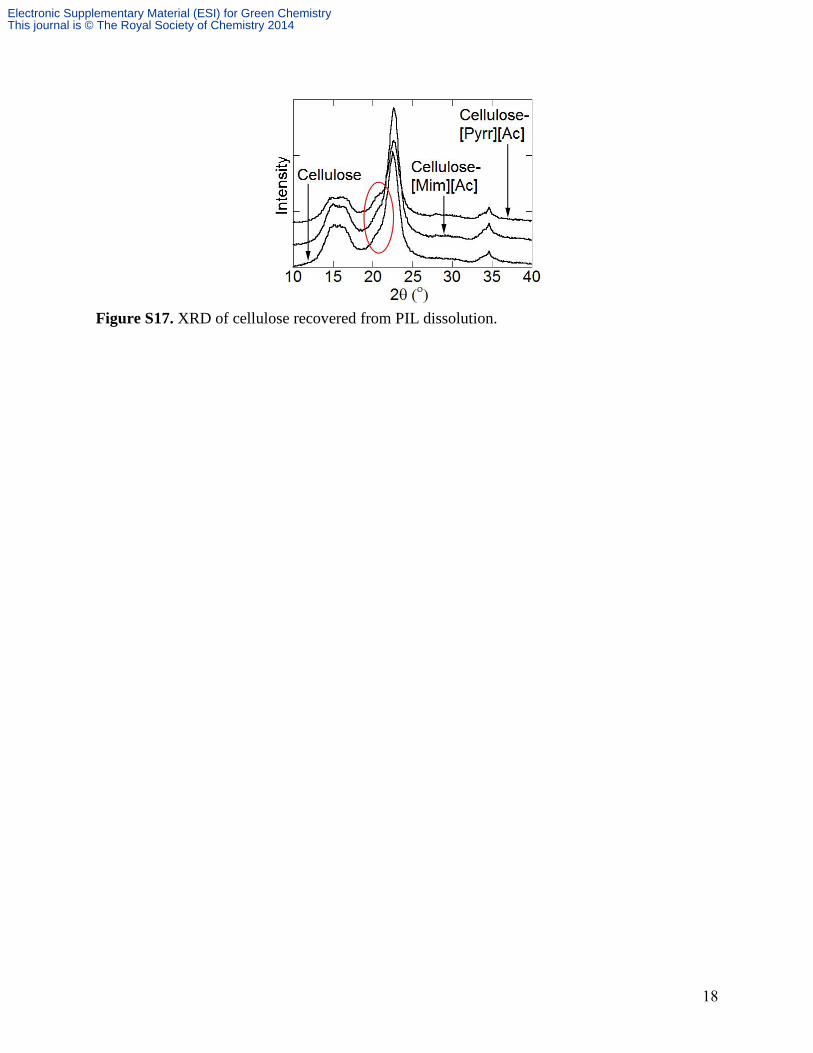
above under “PIL Pretreatment” with cellulose used instead of CS. XRD data was used to
determine the crystal structure of this material for comparison with that of the initial cellulose
powder (Fig. S17). The recovered cellulose is highly crystalline and the data closely matches that
of the original material (i.e., with the cellulose-I structure). A small peak may be present after
treatment with the [Pyrr][Ac] PIL, however, indicating a different crystal structure (i.e.,
cellulose-II) (Fig. S17). Nevertheless, one can conclude that the recovered cellulose largely
maintains its original crystallinity and crystal structure. Since the [Pyrr][Ac] PIL only dissolves
about 0.8% w/w cellulose (the maximum of the three PILs) (Table 2), there is almost no
allowance for interaction between the PIL and cellulose, which results in little to no modification
of the cellulose.
Electronic Supplementary Material (ESI) for Green ChemistryThis journal is © The Royal Society of Chemistry 2014
18
Figure S17. XRD of cellulose recovered from PIL dissolution.
Electronic Supplementary Material (ESI) for Green ChemistryThis journal is © The Royal Society of Chemistry 2014
19
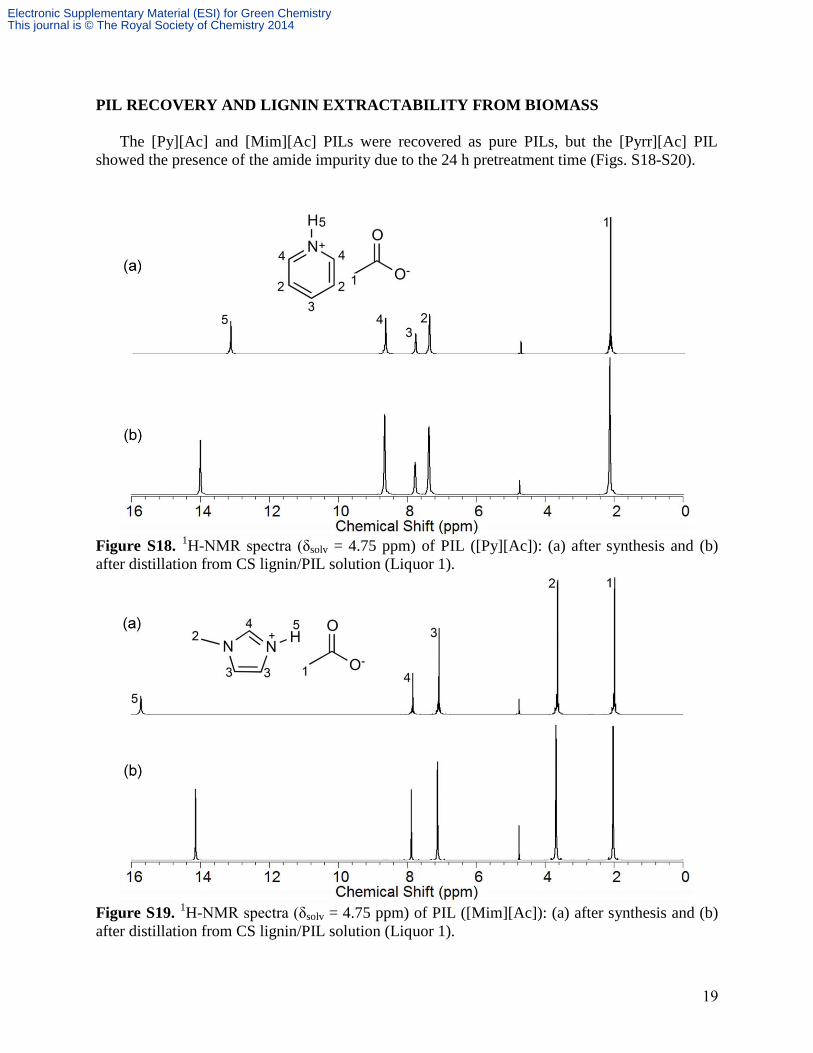
PIL RECOVERY AND LIGNIN EXTRACTABILITY FROM BIOMASS
The [Py][Ac] and [Mim][Ac] PILs were recovered as pure PILs, but the [Pyrr][Ac] PIL
showed the presence of the amide impurity due to the 24 h pretreatment time (Figs. S18-S20).
Figure S18. 1H-NMR spectra (δsolv = 4.75 ppm) of PIL ([Py][Ac]): (a) after synthesis and (b)
after distillation from CS lignin/PIL solution (Liquor 1).
Figure S19. 1H-NMR spectra (δsolv = 4.75 ppm) of PIL ([Mim][Ac]): (a) after synthesis and (b)
after distillation from CS lignin/PIL solution (Liquor 1).
Electronic Supplementary Material (ESI) for Green ChemistryThis journal is © The Royal Society of Chemistry 2014

20
Figure S20. 1H-NMR spectra (δsolv = 4.75 ppm) of PIL ([Pyrr][Ac]): (a) after synthesis and (b)
after distillation from CS lignin/PIL solution (Liquor 1).
A study of the time-dependent pretreatment of CS with the [Pyrr][Ac] PIL shows that an
increased reaction time is optimal for high lignin removal (Fig. S21). Using UV-Vis
spectroscopy, the absorbance of the liquid portion was measured at various time increments to
access the amount of lignin removed after various pretreatment times. The compositional
analyses for three samples are also included to support this data (0 h, 5 h and 24 h). The
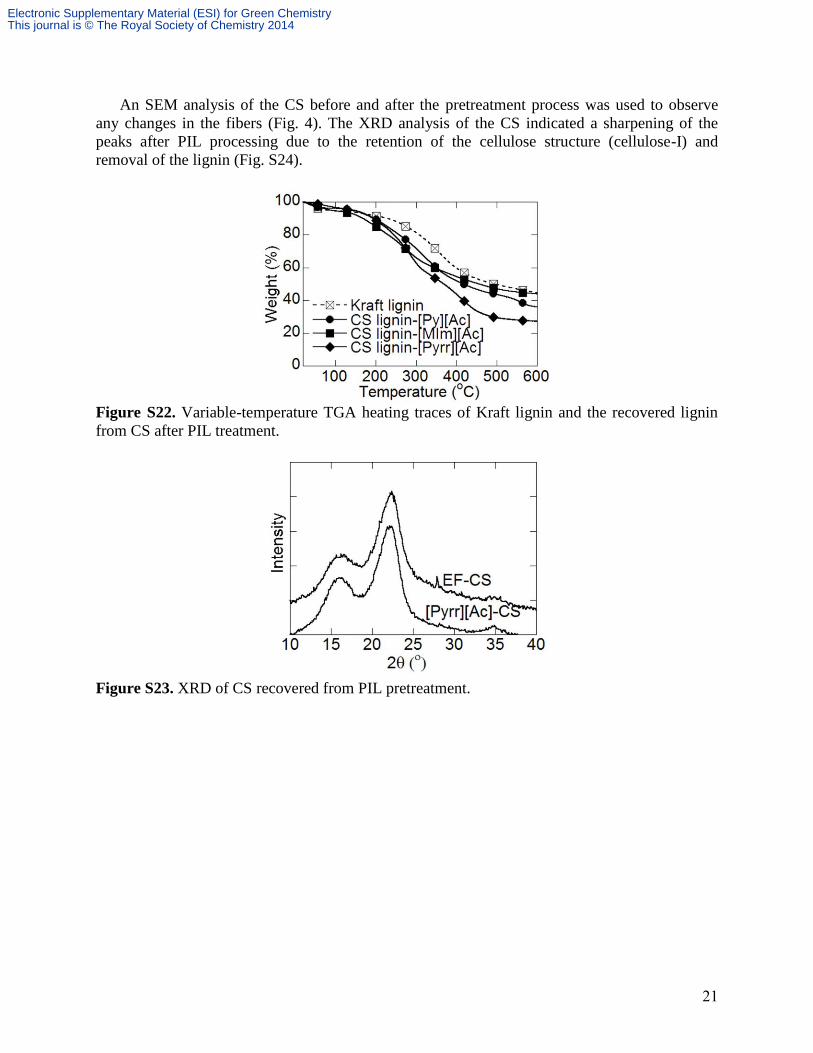
recovered lignin extracts exhibit similar thermal stability trends to that of Kraft lignin (Fig. S22).
Figure S21. Rate of lignin removal (% e is percent extracted) from CS with the [Pyrr][Ac] PIL
using UV/VIS analysis (absorbance data shown on left, compositional analysis data shown on
right).
Electronic Supplementary Material (ESI) for Green ChemistryThis journal is © The Royal Society of Chemistry 2014
21
An SEM analysis of the CS before and after the pretreatment process was used to observe
any changes in the fibers (Fig. 4). The XRD analysis of the CS indicated a sharpening of the
peaks after PIL processing due to the retention of the cellulose structure (cellulose-I) and
removal of the lignin (Fig. S24).
Figure S22. Variable-temperature TGA heating traces of Kraft lignin and the recovered lignin
from CS after PIL treatment.
Figure S23. XRD of CS recovered from PIL pretreatment.
Electronic Supplementary Material (ESI) for Green ChemistryThis journal is © The Royal Society of Chemistry 2014

22
EFFECT OF HEATING ON PILS
Heating the PILs at 90 °C for 24 h resulted in the discoloration of the [Mim][Ac] and
[Pyrr][Ac] PILs (Fig. S24). No significantly different peaks were observed in the NMR analysis
of the [Mim][Ac] PIL after the heating tests. For the [Mim][Ac] PIL, this change in color is
likely a result of amine discoloration of Mim (the base used to synthesize PIL).12
Oxidation
reactions are common in aromatic amines when they are left standing or exposed to air/water and
this is increased upon heating, but undetectable by NMR spectrometry.13
NMR analysis of the
[Pyrr][Ac] PIL, on the other hand, displayed new peaks after the heating tests, which indicates
the formation of a substantial amount of a side product/impurity (Fig. S24). Combinations of
saturated amines and carboxylic acids are susceptible to the formation of amides when given
enough energy input (Scheme S1).14
Energy, in the form of heat, is input during the dissolution
process and could therefore lead to the formation of amides.
Figure S24. Photos of PILs: (a) before and (b) after heating for 24 h at 90 °C.
Scheme S1. Formation of the amide 1-(pyrrolidin-1-yl)ethanone, a possible side product
that is found in recycled [Pyrr][Ac]
Electronic Supplementary Material (ESI) for Green ChemistryThis journal is © The Royal Society of Chemistry 2014

23
Figure S25. Variation in 1H-NMR spectra (δsolv = 4.75 ppm) of PIL ([Pyrr][Ac]) with heating
time showing: (a) full NMR spectrum, (b) = 3.1-3.7 ppm and (c) = 1.7-2.2 ppm.
Electronic Supplementary Material (ESI) for Green ChemistryThis journal is © The Royal Society of Chemistry 2014

24
NMR analysis of the [Pyrr][Ac] PIL after different heating times shows a shifting in the N-H
peak [ ≈ 8 to 12 ppm], which is believed to be due to the presence of water that is formed with
the amides (Scheme S1). The proton on the nitrogen is the most acidic proton and so will be
most affected by the presence of water molecules (see below). As the heating time increases, the
water content increases and the position of the N-H peak changes. There is also the development
of new peaks in the recovered PIL at = 2.08, 3.38 and 3.56 ppm (Fig. S25). The two distinct
peaks at = 3.38 to 3.56 ppm can be accredited to the protons on the cation alpha carbon atom
next to the nitrogen atom (Scheme S1, Fig. S25b). When the amide forms, there is hindered
rotation at that C-N bond that removes the symmetry of those two protons, causing the splitting
pattern observed (doublet of triplets). This effect is weaker on the beta protons, but a clear peak
at = 2.08 ppm is also observed to increase as the heating time increases (Fig. S25c).
Quantification of the amide content using UV/Vis and NMR analyses indicates the amount of
amide formed with increasing heating time. The NMR analysis was used to determine the ratio
of impurity to the pure PIL with time. The increasing linear trend observed (Fig. S26) indicates
that the impurity will continue to form providing pure reagents (starting material) are present in
the system and enough energy is introduced to excite them. The trend observed from the UV/Vis
spectra, however, is exponential and starts to level off after 8 h (Fig. S26) indicating that the
effect of the amide (impurity) on the absorbance is negligible after a certain amide concentration.
Figure S26. Rate of formation of amide from UV/Vis and NMR analyses.
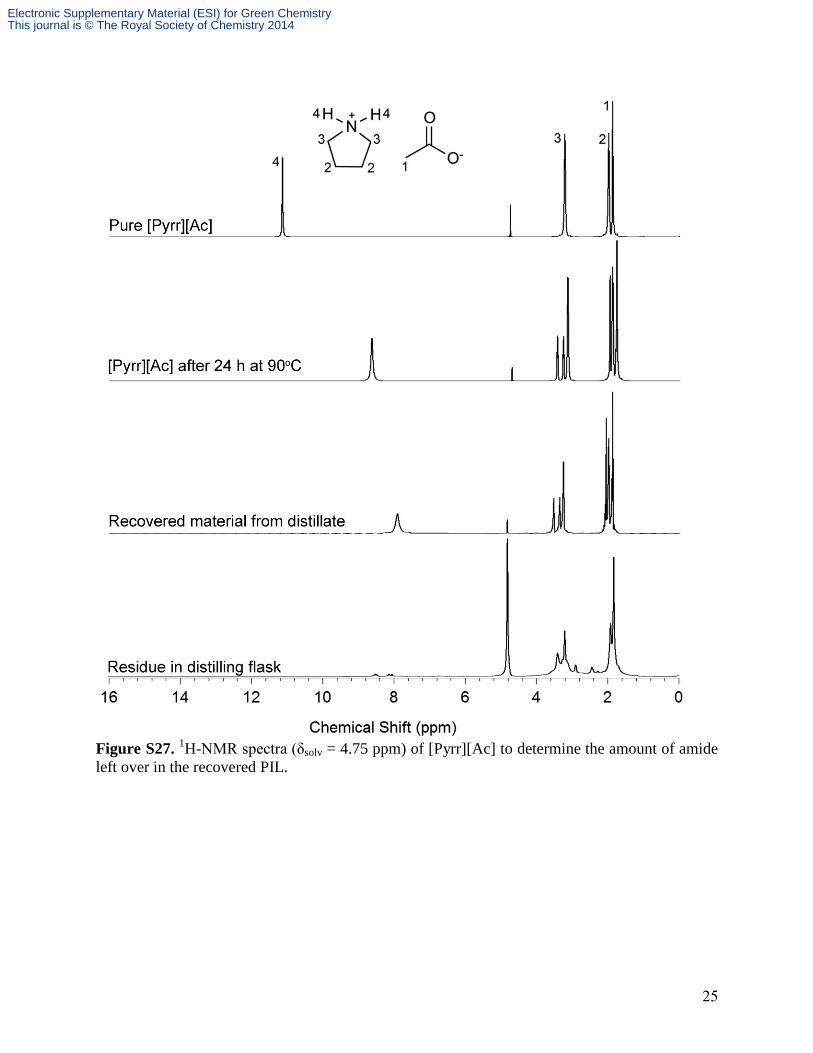
After the heating tests, an attempt was made to separate the amide impurity from the pure
PIL ([Pyrr][Ac]) by distillation. However, NMR peaks for the amide are observed in the
recovered material (Fig. S27). In addition, a residue remained in the distilling flask that could not
be recovered. The presence of amide impurity in the recovered PIL is likely due to the fact that
the amide has similar volatility characteristics as the PIL reagents (Pyrr and HAc). This prevents
selective separation of the PILs from the amide degradation product by simple distillation.
Electronic Supplementary Material (ESI) for Green ChemistryThis journal is © The Royal Society of Chemistry 2014
25
Figure S27.
1H-NMR spectra (δsolv = 4.75 ppm) of [Pyrr][Ac] to determine the amount of amide
left over in the recovered PIL.
Electronic Supplementary Material (ESI) for Green ChemistryThis journal is © The Royal Society of Chemistry 2014

26
EFFECT OF WATER CONTENT ON PILS (NMR ANALYSIS)
Recovered PILs from distillation always show a shift in the N-H peak that was suspected to
be due to small amounts of water introduced upon exposure to the atmosphere or from
interactions with biomass and biopolymers. To examine this further, different samples were
prepared by introducing various amounts of water into the [Pyrr][Ac] PIL (measured by Karl
Fisher). The NMR analysis of each sample confirms that small changes in water content do
affect the chemical shift of the N-H peak, which is likely due to changes in the H-bonding
network as water is added into the system (Fig. S28).
Figure S28. Effect of changing water content on the chemical shifts of the acidic protons in PILs
([Pyrr][Ac]).
Electronic Supplementary Material (ESI) for Green ChemistryThis journal is © The Royal Society of Chemistry 2014
27
REFERENCES:
(1) B. Hames, R. Ruiz, C. Scarlata, A. Sluiter, J. Sluiter and D. Templeton, Preparation of
Samples for Compositional Analysis, NREL Analytical Procedure LAP-021, Technical
Report NREL/TP-510-42620, National Renewable Energy Laboratory (NREL), Golden,
Colorado, 2008.
(2) A. Sluiter, R. Ruiz, C. Scarlata, J. Sluiter and D. Templeton, Determination of Extractives
in Biomass, NREL Analytical Procedure LAP-010, Technical Report NREL/TP-510-
42619, National Renewable Energy Laboratory (NREL), Golden, Colorado, 2008.
(3) G. L. Burrell, I. M. Burgar, F. Separovic and N. F. Dunlop, Phys. Chem. Chem. Phys.,
2010, 12, 1571-1577.
(4) A. Pinkert, K. N. Marsh and S. Pang, Ind. Eng. Chem. Res., 2010, 49, 11809-11813.
(5) A. Sluiter, B. Hames, R. Ruiz, C. Scarlata, J. Sluiter, D. Templeton and D. Crocker,
Determination of Structural Carbohydrates and Lignin in Biomass, NREL Analytical
Procedure LAP-002, Technical Report NREL/TP-510-42619, National Renewable Energy
Laboratory (NREL), Golden, Colorado, 2010.
(6) M. Yoshizawa, W. Xu and C. A Angell, J. Am. Chem. Soc., 2003, 125, 15411-15419.
(7) W. Xu and C. A. Angell, Science, 2003, 302, 422-425.
(8) P. Z. Walden, Physik Chem., 1906, 55, 207 and 246.
(9) C. A. Angell, N. Byrne and J.-P. Belieres, Acc. Chem. Res., 2007, 40, 1228-1236.
(10) H. C. Brown, D. H. McDaniel and O Häflinger, Determination of Organic Structures by
Physical Methods, ed. E. A Braude and F. C. Nachod, Academic Press, New York, 1955.
(11) H. K. Hall, J. Am. Chem. Soc., 1957, 79, 5441-5444.
(12) US Pat., US4861914, 1989.
(13) F. Gugumus, Oxidation Inhibition in Organic Materials, ed. J. Pospíšil and P. P.
Klemchuk, CRC Press, Boca Raton, 1989-1990, vol. 2, pp 144-146.
(14) T. L. Greaves, A. Weerawardena, C. Fong, I. Krodkiewska and C. J. Drummond, J. Phys.
Chem. B, 2006, 110, 22479–22487.
Electronic Supplementary Material (ESI) for Green ChemistryThis journal is © The Royal Society of Chemistry 2014