supporting information dynamic neural activity during … · interview for diagnostic and...
TRANSCRIPT

1
Supporting Information
Dynamic Neural Activity During Stress Signals Resilient Coping Rajita Sinha, Cheryl M. Lacadie, R. Todd Constable, and Dongju Seo
Departments of Psychiatry and Diagnostic Radiology, Yale University School of Medicine
I. Detailed Materials and Methods:
a. Participants
b. Procedures
c. Functional Magnetic Resonance Imaging (fMRI) Procedure
d. Functional MRI and Functional Connectivity Analyses
e. Blood Cortisol Collection, Storage and Analysis
II. Supplemental Tables and Figures
a. Supplemental Tables Table S1. Emotional and Behavioral Coping Characteristics
Table S2. Neural Correlates of Cortisol Response
Table S3. Brain Regions that Significantly Activated during Late relative to Early runs.
b. Supplemental Figures
Figure S1: Condition Main Effects in Whole Brain Analysis
Figure S2. Time Period Dependent Neural Changes Within Each Condition
Figure S3. Functional Connectivity of the Ventromedial Prefrontal Cortex During Stress,
Neutral, and Stress-neutral Contrast
III. References

2
I. Detailed Materials and Methods:
a. Participants:
Thirty, right-handed, non-smoking, community adults (73% women; mean age= 25.7(8.61); 76%
Caucasian; years of education=15.7(2.17)) who did not meet criteria for any psychiatric
disorders, including substance use disorders based on the assessment by the Structured Clinical
Interview for Diagnostic and Statistical Manual of Mental Disorders IV (DSM-IV-TR)(1)
participated in the study. Only normally cycling females in the follicular or early luteal phase of
the menstrual cycle were recruited to avoid potential effects of ovulatory and late luteal
variations in sex steroid hormones on stress responses (2). All study procedures were approved
by the Human Investigation Committee of the Yale University School of Medicine and all
participants signed a written informed consent. Prior to the fMRI scan, all participants were
assessed for demographic, psychiatric, brief cognitive/IQ measures and also completed a
physical health with laboratory assessments including renal, hepatic, pancreatic, hematopoietic,
and thyroid functions to ensure good health. A breathalyzer and urine toxicology screening was
used to confirm drug and alcohol abstinence for each assessment session and the day of the MRI
scan.
b. Procedures: On the scanning day, all subjects arrived at the Yale Stress Center between 12 –
2 pm and were given a standard lunch and then received training on fMRI experimental
procedure. Between 2-4 pm the subjects participated in the MRI scan, where upon arrival an
intravenous (IV) line was inserted in the non-dominant (left) arm of subjects by the nurse for
cortisol data collection. The subject then completed a practice task consisting of 10 trials using
stimuli that were not used for the in-scan fMRI task. After a 45 minute adaptation period, the
subject entered the MRI and a pulse oximeter was placed on their non-dominant forefinger to

3
obtain heart rate and the subject completed the functional scan and repeated blood draws via the
IV line were also obtained.
In a separate session, participants provided specific information on lifestyle behaviors
and coping responses using the COPE inventory (3), provided detailed information on alcohol
intake using the Calahan Quantity Frequency Variability Classification (4), Emotional Eating
subscale from the Dutch Eating Behavior Questionnaire (DEBQ; (5)) and response to “how often
do you get in arguments or fights?” as a behavioral index of emotional coping.
Experimental Task
Visual Stimuli: The visual stimuli consisted of 60 highly stressful and 60 neutral images selected
from the International Affective Picture System (IAPS; (6)based on the valence and arousal
levels of IAPS normative ratings. Average valence of IAPS normative ratings for selected
images were 2.36 (s.d. = .76) for stress and 5.3 (s.d.=.80) for neutral pictures on 9-point IAPS-
SAM scale (1=negative; 5=neutral; 9=positive)(62). Average arousal of IAPS normative ratings
were 6.2 (s.d. = .75) for stress and 3.0 (s.d.=.67) for neutral on 9-point IAPS-SAM scale
(1=calm/relaxed; 5=moderate; 9=excited)(7). Stressful and aversive stimuli content included
images of terror, violence, disgust, threat, victimization, mutilation etc. The neutral condition
consists of images with neutral contents (e.g., building, object, book, etc). In the beginning of
each condition, there were three baseline runs, each consisting of ten blank gray images with a
centered fixation cross (8, 9). In each condition (either stress or neutral), equivalent levels of
emotional intensity of pictures were achieved throughout the task, verified by no statistical
difference in valence and arousal IAPS normative ratings as well as in picture content across 6
runs. All visual stimuli were presented through a liquid crystal display panel mounted on the
head coil using E-prime software (Psychological Software Tools Inc, Pennsylvania, USA).
4
Sustained Stress/Neutral Exposure Task: Using a block design, the task involved participants
passively viewing and experiencing a series of visual images in Stress and Neutral conditions
(see Figure 1). All participants were trained in the visual stimulus task procedures and also
completed practice trials upon arrival for the scan session prior to the scan. Throughout the scan,
they also received specific and repeated instruction to keep their eyes open and view each image
as they were presented. Each condition consists of 3 baseline and 6 visual image runs of 60
seconds each. In each stress and no-stress, neutral condition, a homogeneous set of different
stress and aversive images for stress, and neutral images for the neutral condition were presented
consecutively in six contiguous runs. At the end of each 60 second run, participants made ratings
to acknowledge their viewing and experience of the images. The resulting experimental design
included the With-in Subjects factors of Condition 2 (stress, neutral) and Time period 3 (Early:
run 1-2; Mid: run 3-4; Late: run 5-6) to assess time dependent neural activity during stress and
neutral conditions. The order of stimuli and conditions were randomized and counterbalanced
across subjects and initial analyses showed no order effects in any of the results.
Within each 60 second run, each visual image was presented for 5 sec with a 1 sec inter-
stimulus interval. Each image was presented only once for the participant and occurred in a
random unpredictable order and without any participant control over the stimuli being presented.
After the completion of each 1-minute run, participants rated their level of stressfulness and
arousal as well as valence of each image with each scale displayed for 3 secs. The rating scale
was based on modified version of the Self-Assessment Manikin rating system (SAM; (7)). All
rating scales consist of numbers 1 through 9, with a rating of 1 indicating “not at all
(stressfulness, arousal)” or “very negative (valence)” and a rating of 9 indicating “very much” or
“very positive”. The “stressfulness” rating asks participants to rate their level of tension, anxiety

5
and distress while viewing the stimuli presented in the run. The “arousal” rating asks
participants to describe their level of arousal/relaxation for the stimuli presented during the run.
The “valence” rating asks the level of positive and negative valence related to the set of images
presented in the run. In order to select their ratings, the participant pressed buttons using a non-
ferromagnetic button box. Heart rate was concurrently monitored using a purse oximeter
throughout the task. The heart rate data of one subject was discarded due to pulse oximeter
malfunction. Blood sampling was performed at baseline, after each 6 run block and after a 4
minute recovery period for each condition for the assessment of cortisol levels. Difficulties with
the IV line resulted in no blood collection for two subjects.
c. Functional Magnetic Resonance Imaging Procedure
fMRI Acquisition: Images were obtained using a 3-T Siemens Trio MRI system equipped with a
standard quadrature head coil, using T2*-sensitive gradient-recalled single shot echo planar pulse
sequence. Participants were positioned in the coil and head movements were restrained using
foam pillows. A high resolution 3D Magnetization Prepared Rapid Gradient Echo (MPRAGE)
sequence (TR=2530 ms; echo time (TE) =2.77 ms; bandwidth=179 Hz/pixel; flip angle (FA) =
7°; slice thickness=1mm; field of view=256 x 256 mm; matrix=256 x 256) was obtained for
multi-subject registration. Anatomical images of the functional slice locations were next acquired
with spin echo imaging in the axial plane parallel to the AC-PC line with TR = 300 msec, TE =
2.46 msec, bandwidth = 310 Hz/pixel, flip angle = 60 degrees, field of view = 220x220 mm,
matrix = 256x256, 32 slices with slice thickness = 4mm and no gap. Finally, functional, blood
oxygen level dependent (BOLD) signals were acquired with a single-shot gradient echo planar
imaging (EPI) sequence. Thirty-two axial slices parallel to the AC-PC line covering the whole
brain were acquired with TR = 2,000 msec, TE = 25 msec, bandwidth = 2604 Hz/pixel, flip angle

6
= 85 degrees, field of view = 220x220 mm, matrix = 64x64, 35 images per slice, 32 slices with
slice thickness = 4mm and no gap.
fMRI data analysis: All data were converted from Digital Imaging and Communication in
Medicine (DICOM) format to ANALYZE format using XMedCon (10). During the conversion
process, the first three images at the beginning of the functional runs were discarded to enable
the signal to achieve steady-state equilibrium between radio frequency pulsing and relaxation.
Images were motion corrected for three translational and three rotational directions (11). Trials
with linear motion in excess of 1.5 mm or rotation greater than 2 degrees were discarded. The
three baseline and six visual stimuli runs were concatenated together to create a functional block
for each of the stress and the neutral conditions. Individual subject data were analyzed using a
General Linear Model (GLM) on each voxel in the entire brain volume with a regressor specific
for the block. The regressor was each visual image run relative to the baseline gray fixation
period, resulting in a relative stress images - stress baseline and neutral images - neutral baseline
contrast for each run. An average of these change response within each condition represented the
averaged response for each stress versus neutral comparison. The resulting functional images for
each condition were spatially smoothed with a 6 mm Gaussian kernel to account for variations in
the location of activation across subjects. The output maps were normalized beta-maps in the
acquired space (3.44mm x 3.44mm x 4mm). To take these data into a common reference space,
three registrations were calculated sequentially within the Yale BioImage Suite software package
(12,13), and then concatenated and applied as one registration. The first registration performs a
linear registration between the individual subject raw functional image and that subject's 2D
anatomical image. The 2D anatomical image is then linearly registered to the individual's 3D
anatomical image. The 3D differs from the 2D in that it has a 1x1x1 mm resolution whereas the

7
2D z-dimension is set by slice-thickness and its x-y dimensions are set by voxel size. Finally, a
non-linear registration is computed between the individual 3D anatomical image and a reference
3D image. The reference brain used is the Colin Brain (14) which is in Montreal Neurological
Institute (MNI) space(15).
For group level analysis, data were converted to AFNI format (16) and random mixed
effects models were implemented with whole brain voxel-based analysis using AFNI Software
(http://afni.nimh.nih.gov/afni/) to test the hypotheses. In the final model, a 2x3 ANOVA
(condition by timeperiod) was applied in which Condition (stress/neutral) and Time (Early: first
2 runs, Mid: middle 2 runs, Late: last 2 runs) are treated as the within subject fixed effect factor,
and subject as the random effect factor. Results were masked and converted back into
ANALYZE format for viewing in BioImage Suite (12,13). For all group-level analyses, a
FamilyWise Error rate (FWE) correction for multiple comparisons were conducted using Monte
Carlo simulations (17) in AlphaSim in AFNI (30). The AlphaSim parameters used were a
smoothing kernel of 6mm, a connection radius of 6.296mm, and a resolution of 3.44mm x
3.44mm x 4mm voxels. With these parameters, it was determined that an activation volume of
125 original voxels (5917 mm3) satisfied the p<0.05 threshold. To examine the relationship
between cortisol measures and brain activity, whole-brain regression analyses, were conducted
using BioImage Suite with the application of AFNI AlphaSim FWE correction for multiple
comparisons. We also conducted secondary post-hoc analyses including sex in the models to
assess it’s influence on the main findings.
d. Functional connectivity analysis: The functional connectivity analysis was performed using
BioImageSuite (www.bioimagesuite.org). A reference region in the VmPFC area was defined
functionally from Late (last 2runs) relative to Early (first 2runs) during the stress condition
8
(Figure 3a). This region was inversely transformed into individual subject space (using the
inverse transforms from the GLM analysis). For each subject, the time-course of the inversely
transformed reference region was computed as the average time-course across all pixels within
the reference region during the stress condition. Using a whole-brain voxel-wise Pearson
correlation, the time-course was correlated with the time-courses of all the other voxels in the
brain, fisher transformed to z-values, averaged across runs and finally spatially smoothed with a
6mm Gaussian filter.
e. Blood cortisol collection, storage, and analysis: Blood was collected in Ethylene-diamine-
tetra-acetic acid (EDTA) coated tubes (BD Biosciences, NJ, USA). Blood samples were
immediately stored on ice, plasma was separated by centrifugation at 4˚C for 10 minutes at 1000
X g. Aliquots of plasma was stored in polypropylene tubes at -80˚C until assayed. Cortisol were
assessed using core laboratory radioimmunoassay (RIA) procedure at the Yale Center for
Clinical Investigation. Spuriously high cortisol values during the neutral condition for one
subject led to exclusion of neutral condition cortisol data for one subject.

9
II. Supplemental Tables and Figures
a.! Supplemental Tables
Table S1: Mean of Emotional and Behavioral Coping for the Sample
Subject variable All ( N=30) DEBQ Emotional Eating Subscale a 29.69 (11.67) COPE Active Coping Subscaleb 12.82 (2.14)
Calahan Quantity Frequency Variability Classification (7)
Usual Drinking Quantity Per Week 2.43 (1.29) Drinking Frequency Per Week 1.16 (0.92) Max Quantity Per Drinking Occasion 5.46 (4.38) Frequency of Max Drinking Per Week 0.13 (0.14)
Emotional Coping Behavior (Arguments/Fights)
Never 5 (19%) 1-6 times / year 18 (67%) 1-3 times / month 2 (7%) 1-4 times / week 2 (7%)
a. Subscale score from Dutch Eating Behavior Questionnaire (8) b. Subscale score from the COPE inventory (9)

10
Table S2. Neural Correlates of Cortisol Response (S-N)
Neural Correlates Lat BA Coordinates Volume F r R2
(Clusters) X Y Z (mm^3) Limbic-ventral striatum* B 6 4 -15 9081 7.6 0.83 0.68 Hypothalamus B 1 0 -14 762 7.7 0.65 0.43 Amygdala/hippocampus R 19 -1 -23 997 7.8 0.72 0.52 Amygdala L -14 -2 -18 74 5.9 0.52 0.28 Ventral Striatum B 7 10 -6 1820 7.3 0.61 0.38 Ventromedial/lateral PFC B 9 42 -6 8104 6.6 -0.75 0.56 Anterior/lateral PFC R 10 28 51 6 3375 6.8 -0.69 0.48 Ventromedial PFC/ACC B 10, 11, 32 10 44 0 4385 6.5 -0.68 0.47 Results from whole-brain regression analysis with cortisol levels (Stress-Neutral). Mean F, r, R2 values and corresponding coordinates are denoted. Lat=laterality; L=left; R=right; B=bilateral; BA=Brodmann area; PFC=Prefrontal cortex; ACC=Anterior cingulate cortex Note: Two clusters associated with cortisol levels (S-N) were found. *The limbic-striatal cluster additionally includes the subcollasal gyrus, subgenual cingulate (BA 25) and midbrain. There was no outlier in the ventromedial/lateral prefrontal cortex (VmPFC/LPFC) cluster. There was one extreme value in the association between limbic-striatal cluster and cortisol levels verified by a Cook’s Distance score greater than 1; this value comes from hypothalamus and ventral striatum regions. The regression result was still statistically significant even after removing this value. To reduce the influence of this value, we implemented the Winsorization method (10, 11), such that the r values and scatterplots was presented after an extreme value was reigned in to the value of the next highest score in Figure 2 and Table S2.

11
Table S3. Brain Regions that Significantly Activated during Late relative to Early runs
Regions of Activation Lat BA Stress Neutral Stress - Neutral
Coordinates Volume t Coordinates Volume t Coordinates Volume t
X Y Z (mm³) X X Y Z X Y Z (mm³)
Ventromedial PFC B 11 -12 51 -21 5963 4.3 - - - - - 15 24 -18 2358 3.2
Ventral Striatum B - - - - - - - - - - 15 11 -6 1681 3.9
Ventrolateral PFC L 47, 45 -30 36 -3 2448 -3 - - - - - -36 23 -11 9646 -4.5
DmPFC/ACC/MCG B 6, 8, 9, 10, 32 12 -21 61 10350 -4.3 - - - - - -3 50 3 8674 -3.6
SFG/PCG/DLPFC L 6, 8, 9, 46 -12 -3 60 3245 -4 - - - - - -48 0 42 5133 -4.5
R 6, 8, 9, 44 24 42 27 8560 -4.9 21 -18 51 21273 -4.7 42 21 36 8447 4.0
Insula L 13 -36 16 -12 1302 -2.9 - - - - - -36 20 -8 2385 -4.0
R 13 43 -17 3 845 -4.3 - - - - - - - - - -
Hippocampus L - -36 -15 -18 451 -3.7 - - - - - - - - - -
R - 39 -24 -15 1368 -5.5 38 -31 -8 541 -3.9 36 -15 -15 499 -3.7
Thalamus B - 0 -15 12 5319 -4.7 3 -18 9 5567 -4.1 - - - - -
Brain Stem (midbrain) B - - - - - - -3 -33 -10 2891 -3.6 -9 -31 -18 4945 4.5
Superior/Middle TG L 21,22, 38 -45 -27 -9 12751 -4.6 - - - - - -48 0 -15 17055 -4.8 R 21,22, 38 47 -18 3 7700 -4.1 39 -27 -6 2740 -3.9 63 -7 -18 7042 -4.2
a Middle/inferior occipital G. B 18, 19 45 -75 -4 73284 7.1 45 -80 -6 33663 4.5 -27 -78 18 5731 3.7 Precuneus/SPL/IPL B 7, 39, 30 30 -57 51 15929 5.1 37 -70 49 16575 -4.4 -27 -57 57 36126 4.9
Cerebellum B - - - - - - 27 -51 -33 10378 -4.4 -9 -36 -21 6310 4.6

12
Table S3. Brain Regions that Significantly Activated during Late relative to Early runs.
Whole-brain FWE corrected thresholds at p<0.05. Max t values and corresponding coordinates are denoted. MNI coordinates are used. Lat = laterality; L = left; R = right; B=Bilateral; BA = Brodmann's area; PFC = Prefrontal Cortex; DmPFC = Dorsomedial PFC; DLPFC=Dorsolateral PFC; ACC = Anterior cingulate cortex; MCG = Middle cingulate gyrus; SFG=superior frontal gyrus; PCG=precentral gyrus; G=Gyrus. Activity that increased in the Late (last 2 runs) relative to the Early (first 2 runs) is indicated in bold type (Late > Early). a. The occipital lobe cluster only during Stress and Neutral conditions additionally includes parts of fusiform/inferior temporal gyrus and posterior cingulate cortex.
13
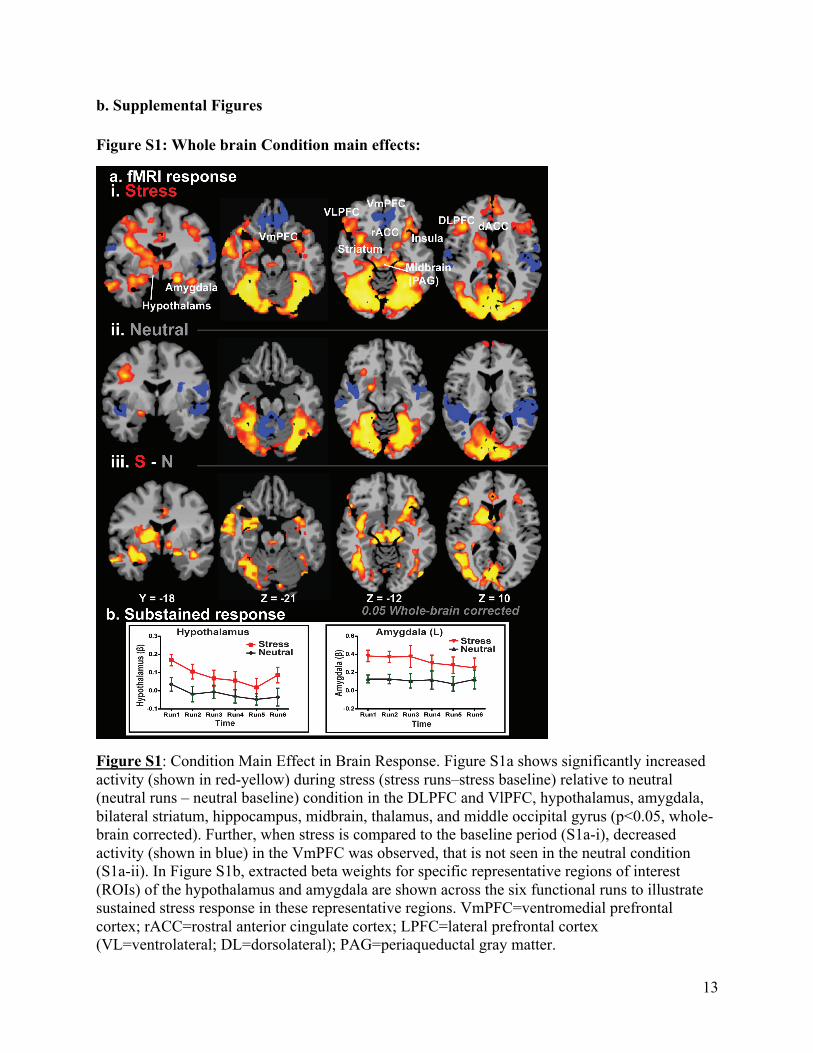
b. Supplemental Figures Figure S1: Whole brain Condition main effects:
Figure S1: Condition Main Effect in Brain Response. Figure S1a shows significantly increased activity (shown in red-yellow) during stress (stress runs–stress baseline) relative to neutral (neutral runs – neutral baseline) condition in the DLPFC and VlPFC, hypothalamus, amygdala, bilateral striatum, hippocampus, midbrain, thalamus, and middle occipital gyrus (p<0.05, whole-brain corrected). Further, when stress is compared to the baseline period (S1a-i), decreased activity (shown in blue) in the VmPFC was observed, that is not seen in the neutral condition (S1a-ii). In Figure S1b, extracted beta weights for specific representative regions of interest (ROIs) of the hypothalamus and amygdala are shown across the six functional runs to illustrate sustained stress response in these representative regions. VmPFC=ventromedial prefrontal cortex; rACC=rostral anterior cingulate cortex; LPFC=lateral prefrontal cortex (VL=ventrolateral; DL=dorsolateral); PAG=periaqueductal gray matter.

14
Figure S2. Time-period dependent neural changes

15
Figure S2. Time-period dependent neural changes Timeperiod-dependent changes were noted in the Late compared to the Early run periods (two-tailed p<0.05, whole-brain corrected). Fig. S2a: During Stress, in the Late compared to Early, increased activity was found in the VmPFC (BA 11) and posterior cingulate cortex, parts of parietal lobe (including the precuneus) and middle occipital gyrus, while decreased activity was shown in the lateral PFC, insula, superior/middle temporal gyrus, thalamus, precentral gyrus, and right anterior hippocampus. During stress, brain activity in the amygdala, hypothalamus, left hippocampus, putamen and midbrain (including periaqueductal gray area (PAG)) was sustained throughout all six functional runs. Fig. S2b: During Neutral, increased activity was found in the Late relative to the Early runs, in regions of posterior cingulate cortex (PCC) and middle occipital gyrus. Decreased activity was noted in the right lateral PFC, precentral gyrus, thalamus, and right hippocampus. Fig. S2c: In Stress-Neutral, increased activity in the Late runs was noted in the VmPFC (BA 11), ventral striatum, left IPL, midbrain including the periacqueductal gray area (PAG), and a small part of cerebellum close to the PAG. Decreased activity was found in the dorsomedial PFC, left lateral PFC, left anterior insula, and superior/middle temporal gyrus. Increased activity is shown in red/yellow and decreased activity is shown in blue color.
Note: VmPFC = Ventromedial prefrontal cortex, VLPFC = Ventrolateral prefrontal cortex, PCC = Posterior cingulate cortex; L = Left; R = Right. The coordinates are given in MNI space.
16
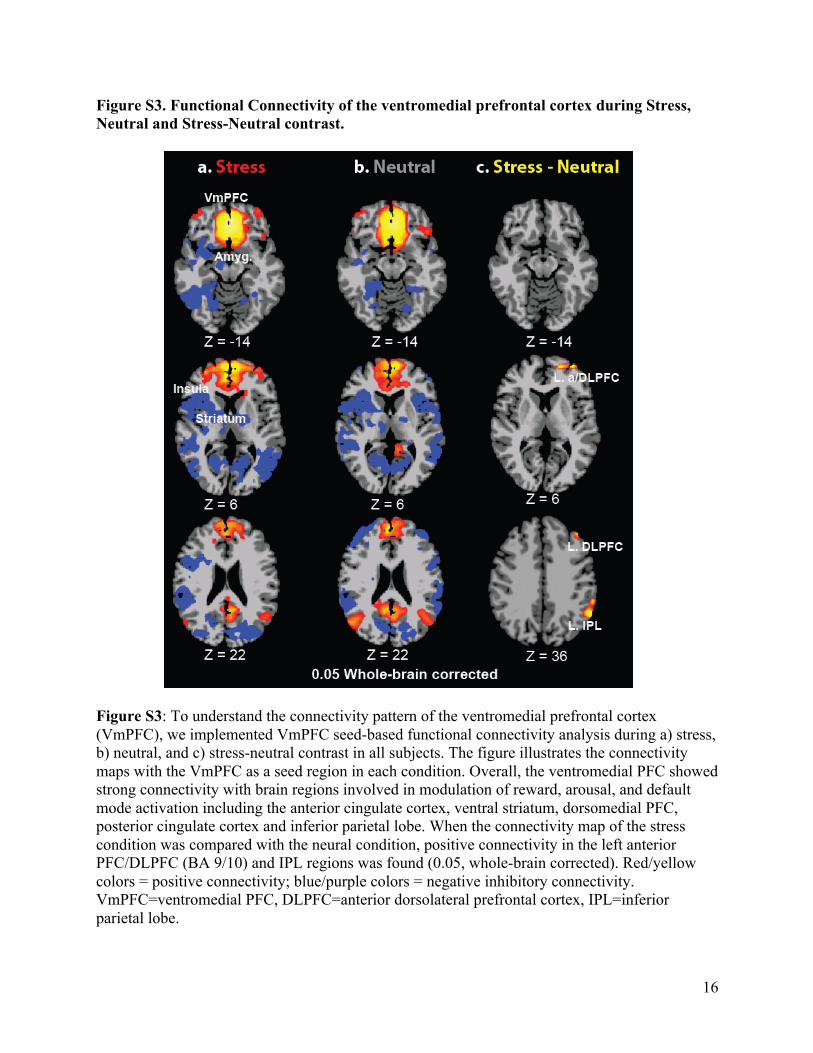
Figure S3. Functional Connectivity of the ventromedial prefrontal cortex during Stress, Neutral and Stress-Neutral contrast.
Figure S3: To understand the connectivity pattern of the ventromedial prefrontal cortex (VmPFC), we implemented VmPFC seed-based functional connectivity analysis during a) stress, b) neutral, and c) stress-neutral contrast in all subjects. The figure illustrates the connectivity maps with the VmPFC as a seed region in each condition. Overall, the ventromedial PFC showed strong connectivity with brain regions involved in modulation of reward, arousal, and default mode activation including the anterior cingulate cortex, ventral striatum, dorsomedial PFC, posterior cingulate cortex and inferior parietal lobe. When the connectivity map of the stress condition was compared with the neural condition, positive connectivity in the left anterior PFC/DLPFC (BA 9/10) and IPL regions was found (0.05, whole-brain corrected). Red/yellow colors = positive connectivity; blue/purple colors = negative inhibitory connectivity. VmPFC=ventromedial PFC, DLPFC=anterior dorsolateral prefrontal cortex, IPL=inferior parietal lobe.

17
III. References 1. First MB, Spitzer RL, Gibbon M, & Janet B (2002) Structured Clinical Interview for DSM-
IV-TR Axis I Disorders, Research Version (Biometrics Research, New York State Psychiatric Institute, New York).
2. Kirschbaum C, Kudielka BM, Gaab J, Schommer NC, & Hellhammer DH (1999) Impact of gender, menstrual cycle phase, and oral contraceptives on the activity of the hypothalamus-pituitary-adrenal axis. Psychosomatic medicine 61(2):154-162
3. Carver CS, Scheier MF, & Weintraub JK (1989) Assessing Coping Strategies: A Theoretically Based Approach. Journal of Peronslaity and Social Psycholoy 56(2):267-283.
4. Cahalan D, Cisin IH, & Crossley HM (1969) American drinking practices; a national study of drinking behavior and attitudes (Publications Division, Rutgers Center of Alcohol Studies; distributed by College & University Press, New Haven, New Brunswick, N.J.,) pp xxvi, 260 p.
5. van Strien T, Frijters JER, Bergers GPA, & Defares PB (1986) The Dutch Eating Behavior Questionnaire (DEBQ) for assessment of restrained, emotional, and external eating behavior. International Journal of Eating Disorders 5(2):295-315.
6. Lang PJ, Bradley MM, & Cuthbert BN (1999) International affective picture systems IAPS): Technical manual and affective ratings. (University of Florida, Center for Research in Pcychophysiology).
7. Bradley MM & Lang PJ (1994) Measuring emotion: the Self-Assessment Manikin and the Semantic Differential. Journal of behavior therapy and experimental psychiatry 25(1):49-59.
8. Taylor SF, Liberzon I, & Koeppe RA (2000) The effect of graded aversive stimuli on limbic and visual activation. Neuropsychologia 38(10):1415-1425.
9. Phan KL, Liberzon I, Welsh RC, Britton JC, & Taylor SF (2003) Habituation of rostral anterior cingulate cortex to repeated emotionally salient pictures. Neuropsychopharmacology, 28(7):1344-1350.
10. Nolfe E (2003) XMedCon- An open-source medical image conversion toolkit. European journal of nuclear medicine 30 (Supp.2).
11. Friston KJ, Williams S, Howard R, Frackowiak RS, & Turner R (1996) Movement-related effects in fMRI time-series. Magnetic resonance in medicine 35(3):346-355.
12. Duncan JS, et al. (2004) Geometric strategies for neuroanatomic analysis from MRI. NeuroImage 23 Suppl 1:S34-45.
13. Papademetris X (2006) BioImage Suite: An Intergrated medical image analysis suite [database on the Internet]. (Section of Bioimaging Sciences, Deptartment of Diagnostic Radiology, Yale School of Medicine New Haven).
14. Holmes CJ, et al. (1998) Enhancement of MR images using registration for signal averaging. J Comput Assist Tomogr 22(2):324-333.
15. Evans A, et al. (1993) 3D statistical neuroanatomical models from 305 MRI volumes. Nuclear Science Symposium and Medical Imaging Conference, pp 1813-1817.
16. Cox RW (1996) AFNI: software for analysis and visualization of functional magnetic resonance neuroimages. Comput Biomed Res 29(3):162-173.
17. Xiong J, Gao J-H, Lancaster JL, & Fox PT (1995) Clustered pixels analysis for functional MRI activation studies of the human brain. Human brain mapping 3:287-301.