supporting information a facile soft-template-morphology
TRANSCRIPT

Supporting Information
A Facile Soft-Template-Morphology-Controlled (STMC)
Synthesis of ZnIn2S4 Nanostructures and Excellent
Morphology Dependent Adsorption Properties
Afaq Ahmad Khan, Arif Chowdhury, Sunita Kumari and Sahid Hussain*
Department of Chemistry, Indian Institute of Technology Patna, Bihta, 801103
Email address: [email protected] Tel: +91-612-302 8022, Fax: +91-612-2277383
Electronic Supplementary Material (ESI) for Journal of Materials Chemistry A.This journal is © The Royal Society of Chemistry 2019

Table S1 Comparison of MG adsorption on ZIS-3 with other reported materials.
S.
No.
Adsorbent pH Qm (mg.g-1
) Reference
01 CO2 -activated porous carbon
Undefined 284 1
02 r-GO
3.7 476.2 2
03 Chitosan beads 7 360 3
04 Si-POPs 6 757 4
05 Fe-Cu based adsorbent 6.58 1399 5
06. Fe3O4@MgSi 4.8 125.15 6
07 TiO2/γCD NPs Undefined 244 7
08 Ternary Mg/(Al + Fe)
Layered Double Hydroxides 4 1072.82 8
09 Magnetic phosphate nanocomposites 5 192.31 9
10 AgOH‐AC nanoparticles 8 57.13 10
11 MgO/Fe3O4 nanoparticles
6 4031.96 11
12 PAC/graphene nanocomposite
Undefined 1862.6 12
13 ZnIn2S4 NS 4.3 1525 This work
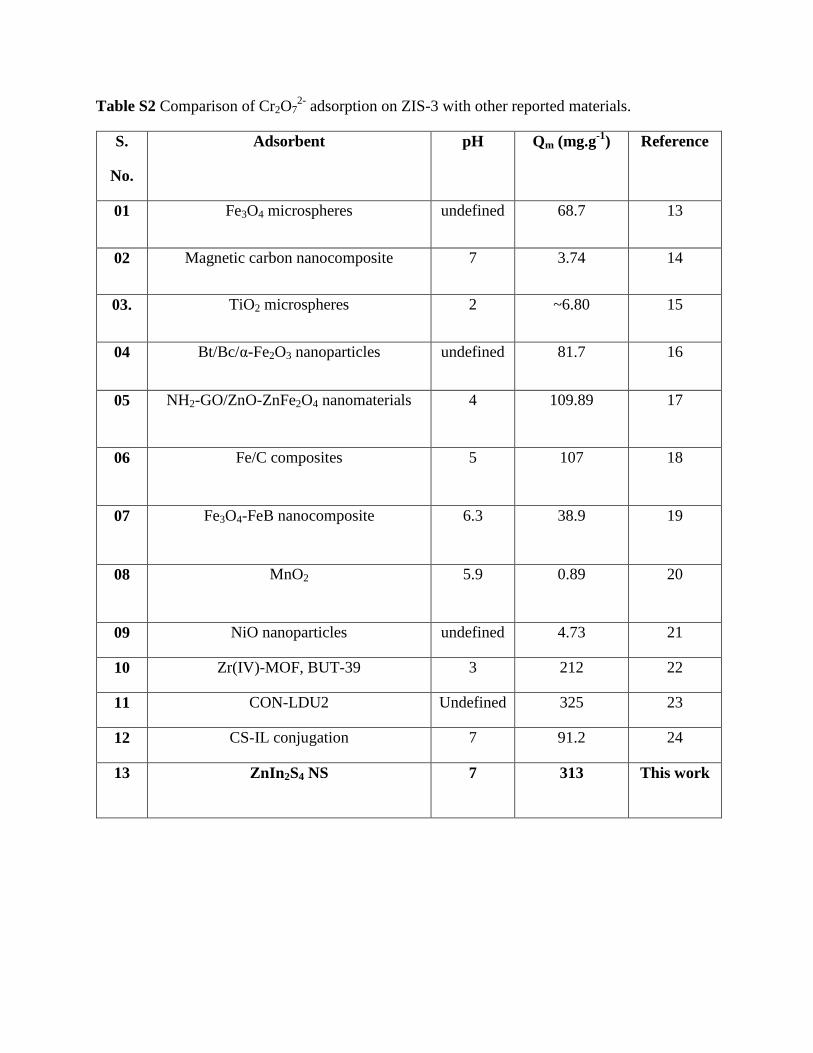
Table S2 Comparison of Cr2O7
2- adsorption on ZIS-3 with other reported materials.
S.
No.
Adsorbent pH Qm (mg.g-1
) Reference
01 Fe3O4 microspheres undefined 68.7 13
02 Magnetic carbon nanocomposite 7 3.74 14
03. TiO2 microspheres 2 ~6.80 15
04 Bt/Bc/α-Fe2O3 nanoparticles undefined 81.7 16
05 NH2-GO/ZnO-ZnFe2O4 nanomaterials 4 109.89 17
06 Fe/C composites 5 107 18
07 Fe3O4-FeB nanocomposite 6.3 38.9 19
08 MnO2 5.9 0.89 20
09 NiO nanoparticles undefined 4.73 21
10 Zr(IV)-MOF, BUT-39 3 212 22
11 CON-LDU2 Undefined 325 23
12 CS-IL conjugation 7 91.2 24
13 ZnIn2S4 NS 7 313 This work

Table. S3 Reaction condition for preparation of ZnIn2S4 NS
Fig. S1 P-XRD pattern of standard cubic and rhombohedral ZnIn2S4 (a), P-XRD of ZIS-3 with
standard hexagonal ZnIn2S4 (b) and reused ZIS-3 (c).
S.
No.
Sample
Name
Sulfur
source
(5 mmol)
Soft-template
(Surfactant)
Temp &
Time
(min)
mmol
In(OAc)3 Zn(OAc)2.2H2O
1. ZIS-1
Thiourea
Glycerol
150°C, 180
1
1 3. ZIS-2 PEG-200
4. ZIS-3 PEG-PPG-
PEG
10 20 30 40 50 60 70 80
(116)(022)
(110)
(102)
(006)
JCPDF No.: 065-2023
Inte
nsi
ty (
a.u
.)
2 theta (degree)
ZIS-3
10 15 20 25 30 35 40 45 50 55 60 65 70 75 80
2 theta (degree)
Hexagonal ZnIn2S
4
JCPDF No.: 065-2023 Inte
nsi
ty (
a.u
.)
Reused ZIS-3
(a) (b)
(c)
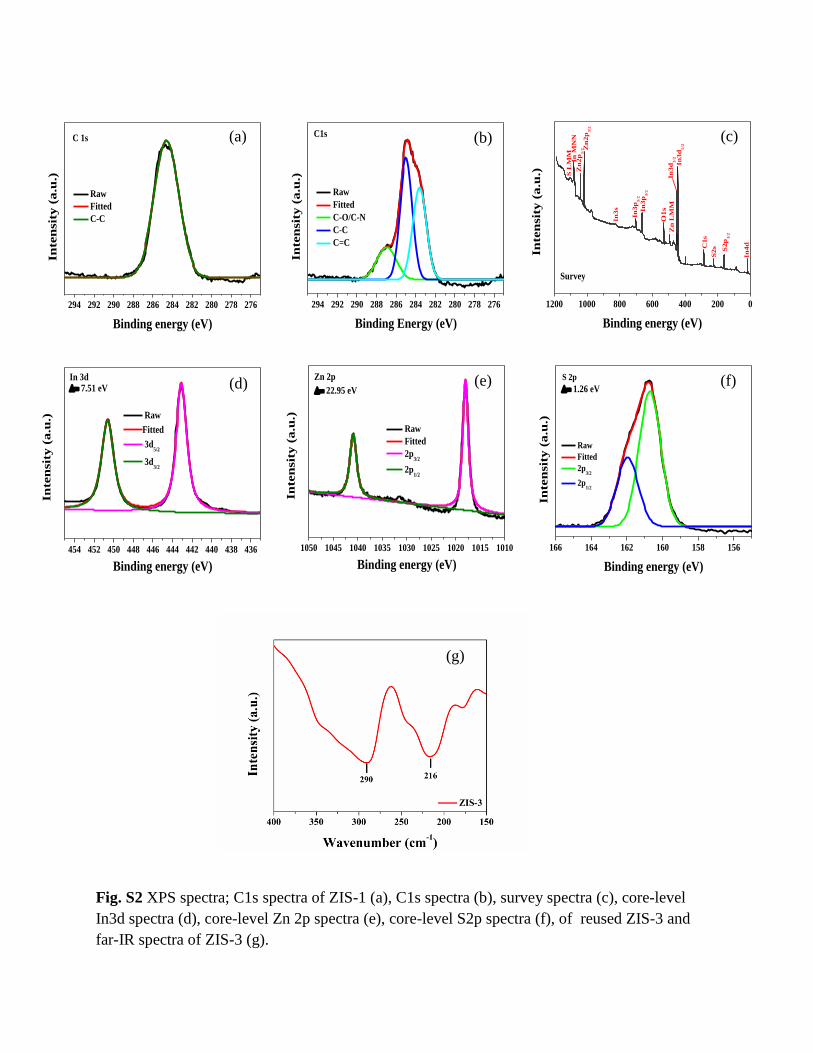
Fig. S2 XPS spectra; C1s spectra of ZIS-1 (a), C1s spectra (b), survey spectra (c), core-level
In3d spectra (d), core-level Zn 2p spectra (e), core-level S2p spectra (f), of reused ZIS-3 and
far-IR spectra of ZIS-3 (g).
166 164 162 160 158 156
1.26 eV
S 2p
Raw
Fitted
2p3/2
2p1/2
In
ten
sit
y (
a.u
.)
Binding energy (eV)
1050 1045 1040 1035 1030 1025 1020 1015 1010
22.95 eV
In
ten
sit
y (
a.u
.)
Binding energy (eV)
Raw
Fitted
2p3/2
2p1/2
Zn 2p
454 452 450 448 446 444 442 440 438 436
In
ten
sit
y (
a.u
.)
Binding energy (eV)
Raw
Fitted
3d5/2
3d3/2
In 3d 7.51 eV
1200 1000 800 600 400 200 0
In
MN
N
In
4d
S L
MM
In
3s
S2s S2p
3/2
Zn
LM
M
Zn
2p
1/2 Z
n2p
3/2
In
3p
1/2
In
3p
3/2
C1s
In
3d
3/2
In
3d
5/2
In
ten
sit
y (
a.u
.)
Binding energy (eV)
O1
s
Survey
294 292 290 288 286 284 282 280 278 276
Raw
Fitted
C-O/C-N
C-C
C=C
In
ten
sit
y (
a.u
.)
Binding Energy (eV)
C1s
294 292 290 288 286 284 282 280 278 276
C 1s
Raw
Fitted
C-C
In
ten
sit
y (
a.u
.)
Binding energy (eV)
(a) (b) (c)
(d) (e)
(g)
(f)

Fig. S3 FE-SEM micrograph: SE2 mode at 100K magnification (a), InLens mode at 100K
magnification (b), InLens mode at 200K magnification (c) of ZIS-1; InLens mode at 100K inset
with SE2 mode at 200K magnification (d) of ZIS-2; SE2 mode at 100K magnification (e),
InLens mode at 50.52K magnification (f) of ZIS-3; TEM micrograph of ZIS-3 (g-i).
Fig. S4 EDS line spectra of ZIS-1 (a) and ZIS-2 (b).
(a) (b) (c)
(g) (h) (i)
(a) (b)
(d) (e) (f)

Fig. S5 AFM topography of the ZIS-1 (a), ZIS-2 (b) and ZIS-3 (c).
(a) (b)
(c)

Fig. S6 Thickness profile curve of the ZIS-1 (a), ZIS-2 (b) and ZIS-3 (c).
(c)
(b)
(a)
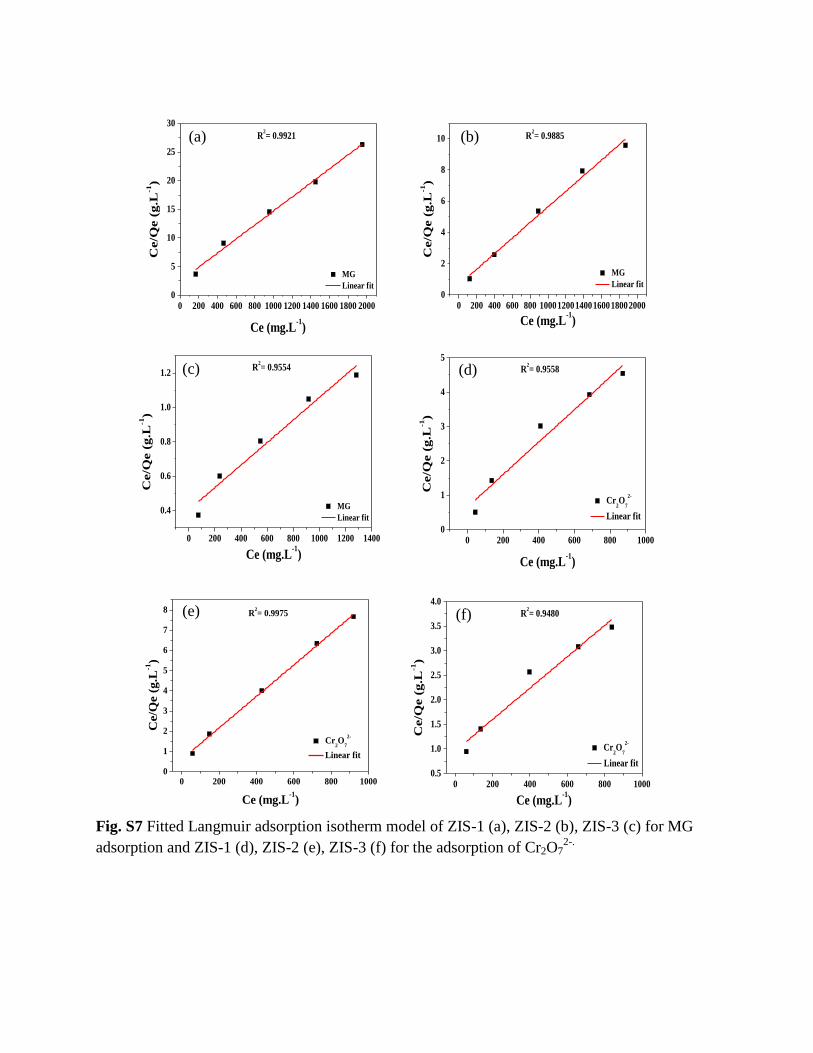
Fig. S7 Fitted Langmuir adsorption isotherm model of ZIS-1 (a), ZIS-2 (b), ZIS-3 (c) for MG
adsorption and ZIS-1 (d), ZIS-2 (e), ZIS-3 (f) for the adsorption of Cr2O72-.
0 200 400 600 800 1000 1200 1400 1600 1800 20000
5
10
15
20
25
30
R2= 0.9921
MG
Linear fit
Ce/Q
e (
g.L
-1)
Ce (mg.L-1)
0 200 400 600 800 1000120014001600180020000
2
4
6
8
10 R2= 0.9885
MG
Linear fit
Ce/Q
e (
g.L
-1)
Ce (mg.L-1)
0 200 400 600 800 1000 1200 1400
0.4
0.6
0.8
1.0
1.2R
2= 0.9554
MG
Linear fit
Ce/Q
e (
g.L
-1)
Ce (mg.L-1)
0 200 400 600 800 10000
1
2
3
4
5
R2= 0.9558
Cr2O
7
2-
Linear fit
Ce/Q
e (
g.L
-1)
Ce (mg.L-1)
0 200 400 600 800 10000
1
2
3
4
5
6
7
8
R2= 0.9975
Cr2O
7
2-
Linear fit
Ce/Q
e (
g.L
-1)
Ce (mg.L-1)
0 200 400 600 800 10000.5
1.0
1.5
2.0
2.5
3.0
3.5
4.0
R2= 0.9480
Cr2O
7
2-
Linear fit
Ce/Q
e (
g.L
-1)
Ce (mg.L-1)
(a) (b)
(c)
(e) (f)
(d)

Fig. S8 Fitted Freundlich adsorption isotherm model of ZIS-1 (a), ZIS-2 (b), ZIS-3 (c) for the
MG adsorption and ZIS-1 (d), ZIS-2 (e), ZIS-3 (f) for the adsorption of Cr2O72-.
5.0 5.5 6.0 6.5 7.0 7.5 8.0
3.8
3.9
4.0
4.1
4.2
4.3 R2= 0.9395
MG
Linear fit
lnQ
e
lnCe
4.5 5.0 5.5 6.0 6.5 7.0 7.5 8.04.7
4.8
4.9
5.0
5.1
5.2
5.3
R2= 0.9515
MG
Linear fit
lnQ
e
lnCe
4.0 4.5 5.0 5.5 6.0 6.5 7.0 7.5
5.2
5.4
5.6
5.8
6.0
6.2
6.4
6.6
6.8
7.0
7.2
R2= 0.9987
MG
Linear fit
lnQ
e
lnCe
3.5 4.0 4.5 5.0 5.5 6.0 6.5 7.0
4.4
4.6
4.8
5.0
5.2
5.4
R2= 0.9146
Cr2O
7
2-
Linear fit
lnQ
e
lnCe
(a) (b)
(c) (d)
4.0 4.5 5.0 5.5 6.0 6.5 7.04.1
4.2
4.3
4.4
4.5
4.6
4.7
4.8
4.9
R2= 0.9881
Cr2O
7
2-
Linear fit
lnQ
e
lnCe
(e)
4.0 4.5 5.0 5.5 6.0 6.5 7.04.0
4.2
4.4
4.6
4.8
5.0
5.2
5.4
5.6
R2= 0.9963
Cr2O
7
2-
Linear fit
lnQ
e
lnCe
(f)

Table S4 Separation factor (RL) of MG adsorption on ZnIn2S4 NS.
Adsorbent
RL
MG concentration (mg.L-1
)
200 500 1000 1500 2000
ZIS-1 0.5013 0.2868 0.1674 0.1182 0.0913
ZIS-2 0.3959 0.2077 0.1159 0.0803 0.0615
ZIS-3 0.7542 0.5511 0.3803 0.2904 0.2348
Table S5 Separation factor (RL) of Cr2O72-
adsorption on ZnIn2S4 NS.
Adsorbent
RL
Cr2O72-
concentration (mg.L-1
)
100 200 500 800 1000
ZIS-1 0.5824 0.4108 0.2181 0.1484 0.1224
ZIS-2 0.4388 0.2811 0.1352 0.0890 0.0725
ZIS-3 0.7713 0.6017 0.3767 0.2742 0.2321

Table S6 Kinetic parameters of the adsorption of MG dyes on ZnIn2S4 NS
Pseudo-first-order model Pseudo-second-order model
Adsorbent Conc.
(mg.L-1
)
qe,exp
(mg.g-1
)
K1 qe,cal
(mg.g-1
)
R2 K2 qe,cal
(mg.g-1
)
R2
ZIS-1
50 17.89 0.0068 12.14 0.9477 0.0028 17.42 0.9806
100 30.15 0.0071 19.55 0.7888 0.0017 28.92 0.9633
ZIS-2
50 49.73 0.0123 41.83 0.9403 0.0007 51.57 0.9701
100 60.39 0.0096 39.76 0.9303 0.0011 60.31 0.9913
ZIS-3
50 74.99 0.0656 8.09 0.7664 0.0505 75 1
100 124.65 0.0114 43.62 0.8477 0.0014 125 0.9988
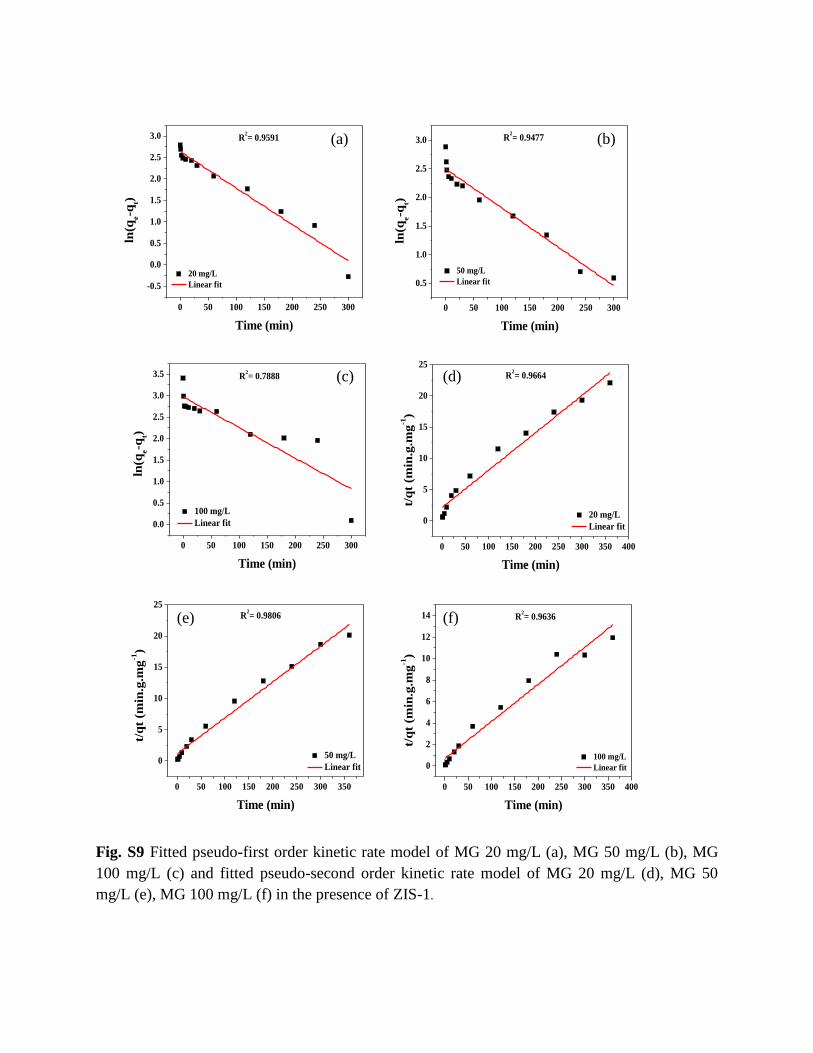
Fig. S9 Fitted pseudo-first order kinetic rate model of MG 20 mg/L (a), MG 50 mg/L (b), MG
100 mg/L (c) and fitted pseudo-second order kinetic rate model of MG 20 mg/L (d), MG 50
mg/L (e), MG 100 mg/L (f) in the presence of ZIS-1.
0 50 100 150 200 250 300
-0.5
0.0
0.5
1.0
1.5
2.0
2.5
3.0 R2= 0.9591
20 mg/L
Linear fit
ln(q
e-q
t)
Time (min)
0 50 100 150 200 250 300
0.5
1.0
1.5
2.0
2.5
3.0 R2= 0.9477
50 mg/L
Linear fit
ln(q
e-q
t)
Time (min)
0 50 100 150 200 250 300
0.0
0.5
1.0
1.5
2.0
2.5
3.0
3.5 R2= 0.7888
100 mg/L
Linear fit
ln(q
e-q
t)
Time (min)
0 50 100 150 200 250 300 350 400
0
5
10
15
20
25
R2= 0.9664
20 mg/L
Linear fit
t/q
t (m
in.g
.mg
-1)
Time (min)
0 50 100 150 200 250 300 350
0
5
10
15
20
25
R2= 0.9806
50 mg/L
Linear fit
t/q
t (m
in.g
.mg
-1)
Time (min)
0 50 100 150 200 250 300 350 400
0
2
4
6
8
10
12
14 R2= 0.9636
100 mg/L
Linear fit
t/q
t (m
in.g
.mg
-1)
Time (min)
(a) (b)
(c) (d)
(e) (f)

Fig. S10 Fitted pseudo-first order kinetic rate model of MG 20 mg/L (a), MG 50 mg/L (b), MG
100 mg/L (c) and fitted pseudo-second order kinetic rate model of MG 20 mg/L (d), MG 50
mg/L (e), MG 100 mg/L (f) in the presence of ZIS-2.
0 50 100 150 200 250 300
-0.5
0.0
0.5
1.0
1.5
2.0
2.5
3.0
3.5 R2= 0.9730
20 mg/L
Linear fit
ln(q
e-q
t)
Time (min)
0 50 100 150 200 250 300
0
1
2
3
4R
2 = 0.9404
50 mg/L
Linear fit
ln(q
e-q
t)
Time (min)
0 50 100 150 200 250 3000.0
0.5
1.0
1.5
2.0
2.5
3.0
3.5
4.0
4.5
R
2 = 0.9303
100 mg/L
Linear fit
ln(q
e-q
t)
Time (min)
0 50 100 150 200 250 300 350 400
0
2
4
6
8
10
12
14
16
R2= 0.9954
20 mg/L
Linear fit
t/q
t (m
in.g
.mg
-1)
Time (min)
0 50 100 150 200 250 300 350 400
0
1
2
3
4
5
6
7
8
50 mg/L
Linear fit
t/q
t (m
in.g
.mg
-1)
Time (min)
R2 = 0.9701
0 50 100 150 200 250 300 350 400
0
1
2
3
4
5
6
7
R2 = 0.9913
100 mg/L
Linear fit
t/q
t (m
in.g
.mg
-1)
Time (min)
(a)
(c)
(b)
(d)
(e) (f)

Fig. S11 Fitted pseudo-first order kinetic rate model of MG 20 mg/L (a), MG 50 mg/L (b), MG
100 mg/L (c) and fitted pseudo-second order kinetic rate model of MG 20 mg/L (d), MG 50
mg/L (e), MG 100 mg/L (f) in the presence of ZIS-3.
0 1 2 3 4 5-2
-1
0
1
2
3
4
R2= 0.5932
20 mg/L
Linear fit
ln(q
e-q
t)
Time (min)
0 50 100 150 200 250 300
0
1
2
3
4
5 R2= 0.8477
100 mg/L
Linear fit
ln(q
e-q
t)
Time (min)
0 50 100 150 200 250 300 350 400
0
2
4
6
8
10
12
R2= 1
20 mg/L
Linear Fit
t/q
t (m
in.g
.mg
-1)
Time (min)
0 50 100 150 200 250 300 350 400
0.0
0.5
1.0
1.5
2.0
2.5
3.0 R2= 0.9988
100 mg/L
Linear fit
t/q
t (m
in.g
.mg
-1)
Time (min)
(a) (b)
(c) (d)
(e) (f)
0 20 40 60 80 100-4
-3
-2
-1
0
1
2
3
4
5
R2= 0.7664
50 mg/L
Linear fit
ln(q
e-q
t)
Time (min)
-50 0 50 100 150 200 250 300 350 400
0
1
2
3
4
5
R2= 1
50 mg/L
Linear fit
t/q
t (m
in.g
.mg
-1)
Time (min)
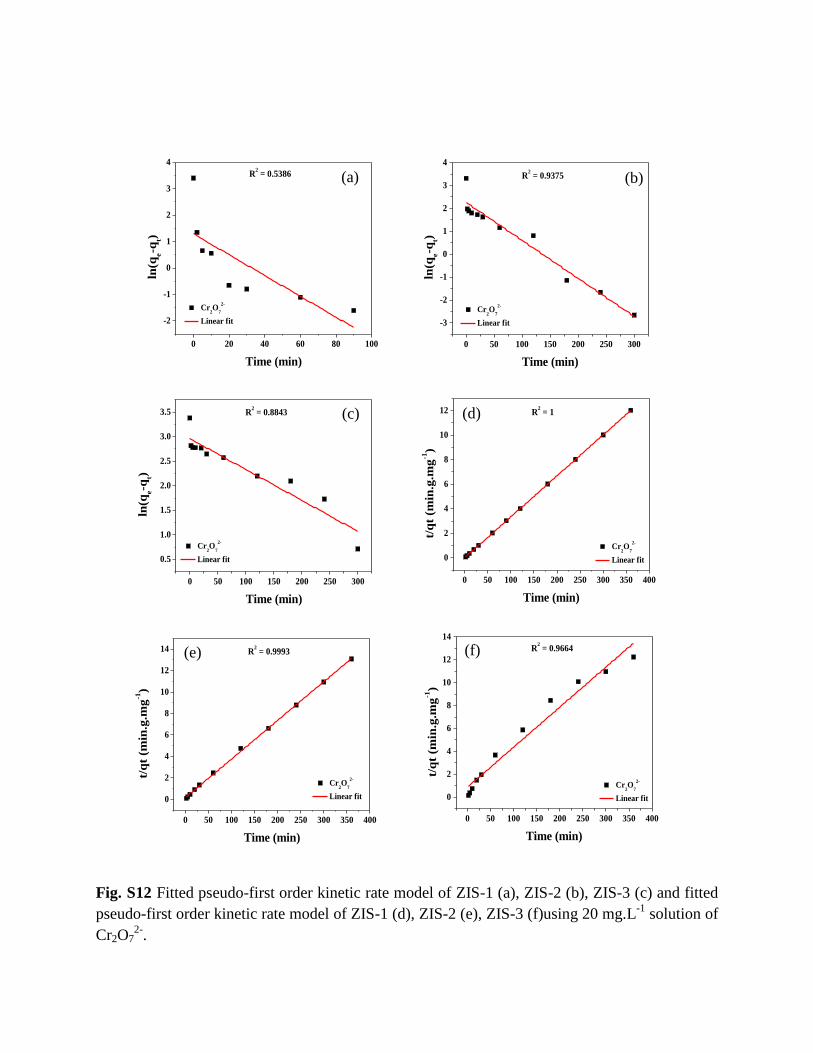
Fig. S12 Fitted pseudo-first order kinetic rate model of ZIS-1 (a), ZIS-2 (b), ZIS-3 (c) and fitted
pseudo-first order kinetic rate model of ZIS-1 (d), ZIS-2 (e), ZIS-3 (f)using 20 mg.L-1
solution of
Cr2O72-
.
0 20 40 60 80 100
-2
-1
0
1
2
3
4
R2 = 0.5386
Cr2O
7
2-
Linear fit
ln(q
e-q
t)
Time (min)
0 50 100 150 200 250 300
-3
-2
-1
0
1
2
3
4
R2 = 0.9375
Cr2O
7
2-
Linear fit
ln(q
e-q
t)
Time (min)
0 50 100 150 200 250 300
0.5
1.0
1.5
2.0
2.5
3.0
3.5
R2 = 0.8843
Cr2O
7
2-
Linear fit
ln(q
e-q
t)
Time (min)
0 50 100 150 200 250 300 350 400
0
2
4
6
8
10
12
14 R2 = 0.9993
Cr2O
7
2-
Linear fit
t/q
t (m
in.g
.mg
-1)
Time (min)
0 50 100 150 200 250 300 350 400
0
2
4
6
8
10
12
14
Cr2O
7
2-
Linear fit
t/q
t (m
in.g
.mg
-1)
Time (min)
R2 = 0.9664
(a) (b)
(c)
(e) (f)
0 50 100 150 200 250 300 350 400
0
2
4
6
8
10
12 R2 = 1
Cr2O
7
2-
Linear fit
t/q
t (m
in.g
.mg
-1)
Time (min)
(d)

Fig. S13 Effect of contact time on the adsorption of MG using ZIS-1 (a), ZIS-2 (b), and ZIS-3
(c) at the solution concentration of 50 mg.L-1
and 100 mg.L-1
.
0 50 100 150 200 250 300 350
0
5
10
15
20
25
30
35
qt(m
g.g
-1)
Time (min)
50 mg/L
100 mg/L
MG adsorption
0 50 100 150 200 250 300 350 400
0
10
20
30
40
50
60
70
qt (
mg
.g-1
)
Time (min)
50 mg/L
100 mg/L
MG adsorption(a) (b)
(c)
-50 0 50 100 150 200 250 300 350 400
0
20
40
60
80
100
120
140
qt(m
g.g
-1)
Time (min)
50 mg/L
100 mg/L
MG adsorption
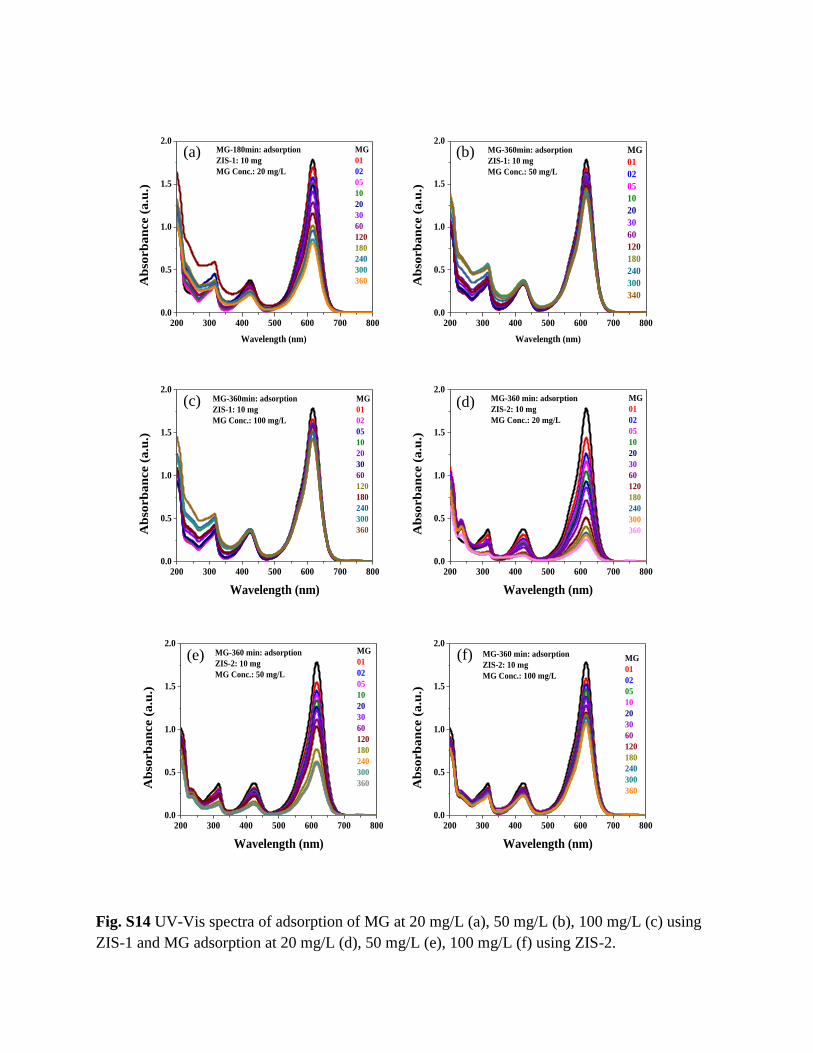
Fig. S14 UV-Vis spectra of adsorption of MG at 20 mg/L (a), 50 mg/L (b), 100 mg/L (c) using
ZIS-1 and MG adsorption at 20 mg/L (d), 50 mg/L (e), 100 mg/L (f) using ZIS-2.
200 300 400 500 600 700 8000.0
0.5
1.0
1.5
2.0MG
01
02
05
10
20
30
60
120
180
240
300
360
MG-180min: adsorption
ZIS-1: 10 mg
MG Conc.: 20 mg/L
Ab
sorb
an
ce (
a.u
.)
Wavelength (nm)
200 300 400 500 600 700 8000.0
0.5
1.0
1.5
2.0
MG
01
02
05
10
20
30
60
120
180
240
300
340
MG-360min: adsorption
ZIS-1: 10 mg
MG Conc.: 50 mg/L
Ab
sorb
an
ce (
a.u
.)
Wavelength (nm)
200 300 400 500 600 700 8000.0
0.5
1.0
1.5
2.0MG
01
02
05
10
20
30
60
120
180
240
300
360
MG-360min: adsorption
ZIS-1: 10 mg
MG Conc.: 100 mg/L
Ab
sorb
an
ce (
a.u
.)
Wavelength (nm)
200 300 400 500 600 700 8000.0
0.5
1.0
1.5
2.0MG-360 min: adsorption
ZIS-2: 10 mg
MG Conc.: 20 mg/L
Ab
sorb
an
ce (
a.u
.)
Wavelength (nm)
MG
01
02
05
10
20
30
60
120
180
240
300
360
200 300 400 500 600 700 8000.0
0.5
1.0
1.5
2.0MG
01
02
05
10
20
30
60
120
180
240
300
360
MG-360 min: adsorption
ZIS-2: 10 mg
MG Conc.: 50 mg/L
Ab
sorb
an
ce (
a.u
.)
Wavelength (nm)
200 300 400 500 600 700 8000.0
0.5
1.0
1.5
2.0
MG-360 min: adsorption
ZIS-2: 10 mg
MG Conc.: 100 mg/L
MG
01
02
05
10
20
30
60
120
180
240
300
360
Ab
sorb
an
ce (
a.u
.)
Wavelength (nm)
(a) (b)
(c) (d)
(e) (f)
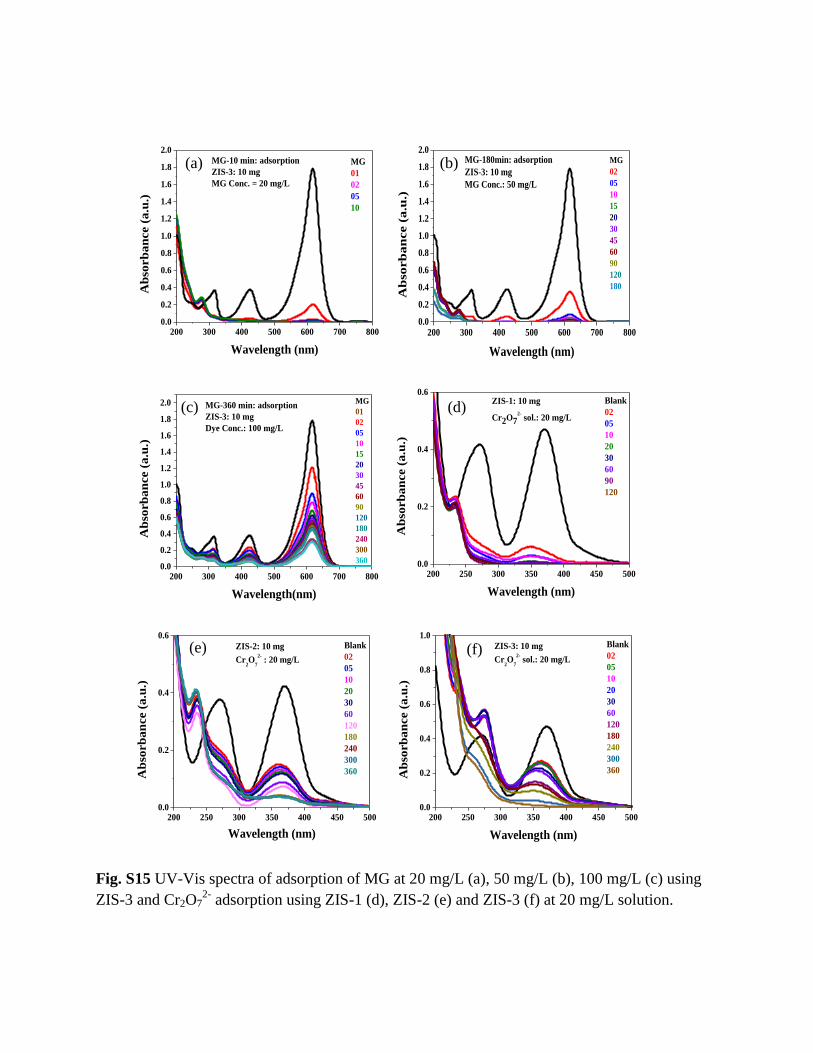
Fig. S15 UV-Vis spectra of adsorption of MG at 20 mg/L (a), 50 mg/L (b), 100 mg/L (c) using
ZIS-3 and Cr2O72-
adsorption using ZIS-1 (d), ZIS-2 (e) and ZIS-3 (f) at 20 mg/L solution.
200 300 400 500 600 700 8000.0
0.2
0.4
0.6
0.8
1.0
1.2
1.4
1.6
1.8
2.0
A
bso
rb
an
ce (
a.u
.)
Wavelength (nm)
MG-10 min: adsorption
ZIS-3: 10 mg
MG Conc. = 20 mg/L
MG
01
02
05
10
200 300 400 500 600 700 8000.0
0.2
0.4
0.6
0.8
1.0
1.2
1.4
1.6
1.8
2.0
MG
01
02
05
10
15
20
30
45
60
90
120
180
240
300
360
MG-360 min: adsorption
ZIS-3: 10 mg
Dye Conc.: 100 mg/L
Ab
sorb
an
ce (
a.u
.)
Wavelength(nm)
200 250 300 350 400 450 5000.0
0.2
0.4
0.6Blank
02
05
10
20
30
60
90
120
ZIS-1: 10 mg
Cr2O72-
sol.: 20 mg/L
Ab
sorb
an
ce (
a.u
.)
Wavelength (nm)
200 250 300 350 400 450 5000.0
0.2
0.4
0.6
ZIS-2: 10 mg
Cr2O
7
2- : 20 mg/L
Blank
02
05
10
20
30
60
120
180
240
300
360Ab
sorb
an
ce (
a.u
.)
Wavelength (nm)
200 250 300 350 400 450 5000.0
0.2
0.4
0.6
0.8
1.0
Blank
02
05
10
20
30
60
120
180
240
300
360
Ab
sorb
an
ce (
a.u
.)
Wavelength (nm)
ZIS-3: 10 mg
Cr2O
7
2- sol.: 20 mg/L
(a)
(d)
(e) (f)
(c)
200 300 400 500 600 700 8000.0
0.2
0.4
0.6
0.8
1.0
1.2
1.4
1.6
1.8
2.0
MG-180min: adsorption
ZIS-3: 10 mg
MG Conc.: 50 mg/L
MG
02
05
10
15
20
30
45
60
90
120
180
Ab
so
rb
an
ce (
a.u
.)
Wavelength (nm)
(b)
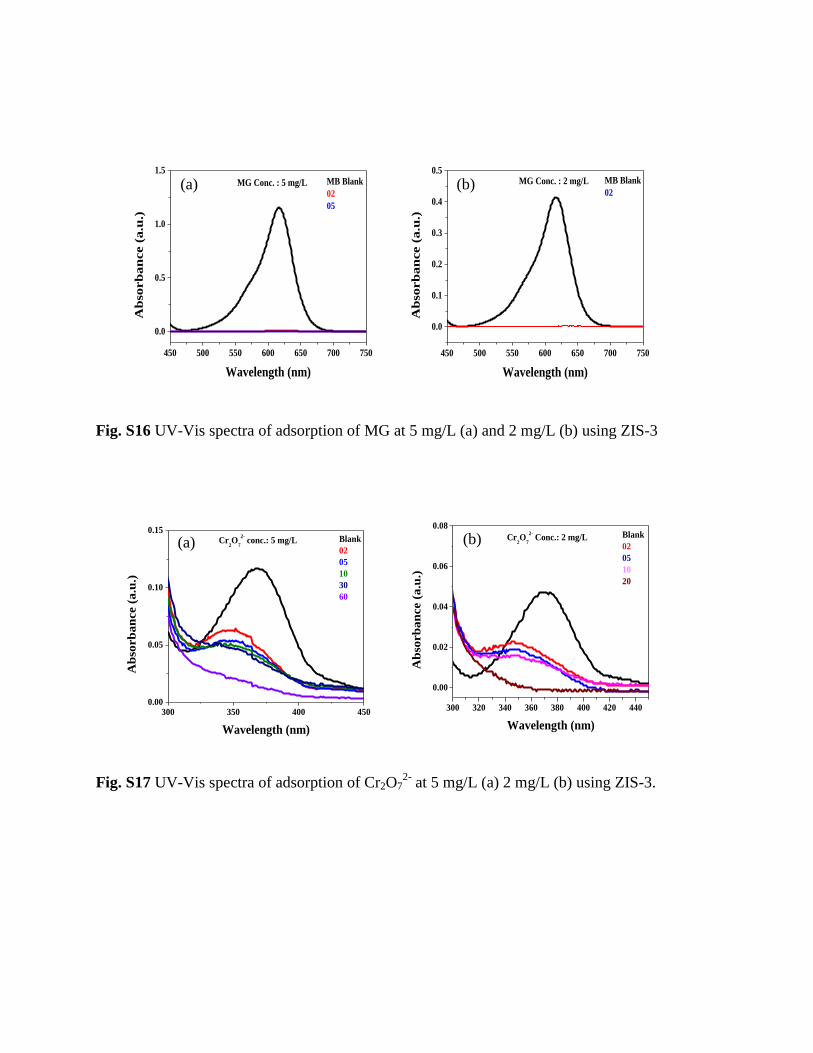
Fig. S16 UV-Vis spectra of adsorption of MG at 5 mg/L (a) and 2 mg/L (b) using ZIS-3
Fig. S17 UV-Vis spectra of adsorption of Cr2O72-
at 5 mg/L (a) 2 mg/L (b) using ZIS-3.
450 500 550 600 650 700 750
0.0
0.5
1.0
1.5
Ab
so
rb
an
ce (
a.u
.)
Wavelength (nm)
MB Blank
02
05
MG Conc. : 5 mg/L
450 500 550 600 650 700 750
0.0
0.1
0.2
0.3
0.4
0.5
Ab
so
rb
an
ce (
a.u
.)
Wavelength (nm)
MB Blank
02
MG Conc. : 2 mg/L
300 350 400 4500.00
0.05
0.10
0.15
Ab
sorb
an
ce (
a.u
.)
Wavelength (nm)
Cr2O
7
2- conc.: 5 mg/L Blank
02
05
10
30
60
300 320 340 360 380 400 420 440
0.00
0.02
0.04
0.06
0.08
Ab
sorb
an
ce (
a.u
.)
Wavelength (nm)
Blank
02
05
10
20
Cr2O
7
2- Conc.: 2 mg/L
(a) (b)
(a) (b)

Fig. S18 UV-Vis spectra of adsorption of Cr2O72-
at 1 mg/L (a), 2 mg/L (b) and 5 mg/L of
solution concentration using ZIS-1.
300 350 400 450 500-0.01
0.00
0.01
0.02
0.03
Blank
01
Cr2O
7
2- conc.: 1 mg/L
Ab
sorb
an
ce (
a.u
.)
Wavelength (nm)
300 350 400 450 500 550
0.00
0.02
0.04
0.06
Blank
01
Cr2O
7
2- Conc.: 2 mg/L
Ab
so
rb
an
ce (
a.u
.)
Wavelength (nm)
300 350 400 450 500
0.00
0.05
0.10
0.15
Cr2O
7
2- conc.: 5 mg/L Blank
02
05
07
Ab
sorb
an
ce (
a.u
.)
Wavelength (nm)
(a) (b)
(c)

Fig. S19 UV-Vis spectra of MG (50 mg/L) adsorption at pH 2 (a), pH 5 (b), pH 7 (c), pH 9 (d)
and initial absorbance of MG at pH 12 and pH 4.3 (e) after adsorption at pH 12 (f) using ZIS-3.
200 300 400 500 600 700 800
0.0
0.5
1.0
1.5
2.0
pH=12
pH=4.3
Absorbance = Initial
MG Conc.: 50 mg/L
Ab
sorb
an
ce (
a.u
.)
Wavelength (nm)
254 nm
200 300 400 500 600 700 8000.0
0.2
0.4
0.6
0.8
1.0pH: 2
ZIS-3: 10 mg
MG Conc.: 50 mg/L
MG
02
05
10
20
30
45
60
120
180
A
bso
rb
an
ce (
a.u
.)
Wavelength (nm)
200 300 400 500 600 700 8000.0
0.2
0.4
0.6
0.8
1.0
1.2
1.4
1.6
1.8
2.0
pH: 5
ZIS-3: 10 mg
MG Conc.: 50 mg/L
MG
02
05
10
20
30
45
60
Ab
sorb
an
ce (
a.u
.)
Wavelength (nm)
200 300 400 500 600 700 8000.0
0.2
0.4
0.6
0.8
1.0
pH: 7
ZIS-3: 10 mg
MG Conc.: 50 mg/L
MG
02
05
10
20
30
45
60
Ab
sorb
an
ce (
a.u
.)
Wavelength (nm)
254 nm
200 300 400 500 600 700 800
0.0
0.2
0.4
0.6
0.8
1.0MG
02
05
10
15
pH: 9
ZIS-3: 10 mg
MG Conc.: 50 mg/L
Ab
sorb
an
ce (
a.u
.)
Wavelength (nm)
254 nm
(a) (b)
(c) (d)
(e)
200 300 400 500 600 700 800
0.0
0.1
0.2
0.3
0.4
0.5
pH=12
pH=4.3
Absorbance = After 180 min
ZIS-3: 10 mg
MG Conc.: 50 mg/L
Ab
so
rb
an
ce (
a.u
.)
Wavelength (nm)
MG-OH (R%) = 93.44%
qe = 70.08 mg.g
-1
(f)
4.3 12

Fig. S20 Three form malachite green dye at different pH; malachite green ion (MG+), Malachite
green carbinol (MG-OH) and Protonated MG+ (MG
2+).
Fig. S21 FE-SEM micrograph of ZIS-3: (a-b) after MG adsorption, (c-d) after Cr2O72-
adsorption; EDS line mapping of ZIS-3: (e) after MG adsorption, (f) after Cr2O72-
adsorption.
(e) (f)
(a) (b) (c) (d)

Fig. S22 XPS spectra of ZIS-3 after Cr2O72-
adsorption; survey spectra (a), core-level S 2p
spectra (b), core-level In3d spectra (c), core-level O1s spectra (d) and core-level C 1s spectra (e).
1350 1200 1050 900 750 600 450 300 150 0
Zn
3p
3/2
In
4dS2p
3/2
S2s
In
3s
Zn
LM
M
In
MN
N
C1s
In
3d
3/2
In
3d
5/2
O1
s
Cr2p
3/2
In
ten
sit
y (
a.u
.)
Binding energy (eV)
Zn
2p
1/2
Zn
2p
3/2
In
3p
3/2
In
3p
1/2
Survey
465 460 455 450 445 440 435 430
In
ten
sit
y (
a.u
.)
Binding energy (eV)
Raw
Fitted
3d5/2
3d3/2
= 7.37 eV
In 3d
538 536 534 532 530 528 526 524 522 520
In
ten
sit
y (
a.u
.)
Binding energy (eV)
Raw
Fitted
Olatt
Oads
H2O
O 1s
172 170 168 166 164 162 160 158
In
ten
sit
y (
a.u
.)
Binding energy (eV)
Raw
Fitted
2p3/2
2p1/2
= 1.11 eV
S 2p
(e)
(d) (c)
(b) (a)
290 288 286 284 282 280 278 276 274 272 270
C1s
In
ten
sit
y (
a.u
.)
Binding energy (eV)
Raw
Fitted
C-C
C-O

References
1. M. Yu, Y. Han, J. Li, L. Wang, Chem. Eng. J., 2017, 317, 493−502.
2. K. Gupta and O. P. Khatri, Journal of Colloid and Interface Science, 2017, 501, 11–21.
3. D. Das and A. Pal, Chemical Engineering Journal, 2016, 290, 371–380.
4. G. Xiong, B.B. Wang, L.X. You, B.Y. Ren, Y.K. He, F. Ding, L. Dragutan, V. Dragutan
and Y.G. Sun. J. Mater. Chem. A, 2019, 7, 393-404.
5. P.Zhang, D.Hou, D.O’Connor,X. Li, S. Pehkonen, R.S. Varma, X. Wang, ACS
Sustainable Chem. Eng., 2018, 6, 9229−9236.
6. Liu, H.; Mo, Z.; Li, L.; Chen, F.; Wu, Q.; Qi, L. J. Chem. Eng. Data, 2017, 62,
3036−3042.
7. S. H. Mousavi, F. Shokoofehpoor, A. Mohammadi, J. Chem. Eng. Data, 2019, 64, 135-
149.
8. S. Das, S. K. Dash and K. M. Parida, ASC Omega, 2018, 3, 2532-2545.
9. F. Zhang, X. Tang, Y. Huang, A. A. Keller and J. Lan, Water research, 2019, 150, 442-
451.
10. E. Solaymani, M. Ghaedi, H. Karimi, M. H. A. Azqhandi and A. Asfaram, Appl
Organometal Chem. 2017, e3857.
11. F. Guo, X. Jiang, X. Li, X. Jia, S. Liang and L. Qian, Materials Chemistry and Physics,
2020, 240, 122240.
12. E. Mkrtchyan, A. Burakov and I. Burakova, Materials Today: Proceedings, 2019, 11,
404-409.
13. Y. Yu, Y. Li, Y. Wang and B. Zou, Langmuir, 2018, 34, 9359-9365.
14. J. Zhu, H. Gu, J. Guo, M. Chen, H. Wei, Z. Luo, H. A. Colorado, N. Yerra, D. Ding, T.
C. Ho, N. Haldolaarachchige, J. Hopper, D. P. Young, Z. Guo and S. Wei, J. Mater.
Chem. A, 2014, 2, 2256-2265.
15. Z. Yu, X. Gao, Y. Yao, X. Zhang, G.-Q. Bian, W. D. Wu, X. D. Chen, W. Li, C.
Selomulya, Z. Wu and D. Zhao, Journal of Materials Chemistry A, 2018, 6, 3954-3966.
16. Z.-H. Ruan, J.-H. Wu, J.-F. Huang, Z.-T. Lin, Y.-F. Li, Y.-L. Liu, P.-Y. Cao, Y.-P. Fang,
J. Xie and G.-B. Jiang, J. Mater. Chem. A, 2015, 3, 4595-4603.
17. S. K. Sahoo and G. Hota, ACS Applied Nano Materials, 2019, 2, 983-996.
18. Y. Cui, J. D. Atkinson, Chemosphere, 2019, 228, 694-701.

19. W. Shen, Y. Mu, T. Xiao and Z. Ai, Chemical Engineering Journal, 2016, 285, 57-68.
20. M. Gheju, I. Balcu and G. Mosoarca, J Hazard Mater, 2016, 310, 270-277.
21. M. A. Behnajady and S. Bimeghdar, Chemical Engineering Journal, 2014, 239, 105-113.
22. T. He, Y. Z. Zhang, X. J. Kong, J. Yu, X. L. Lv, Y. Wu, Z. J. Guo and J. R. Li, ACS Appl
Mater Interfaces, 2018, 10, 16650-16659.
23. Z. J. Li, H. D. Xue, Y. X. Ma, Q. Zhang, Y. C. Li, M. Xie, H. L. Qi and X. D. Zheng,
ACS Appl Mater Interfaces, 2019, DOI: 10.1021/acsami.9b17074.
24. Y. Wei, W. Huang, Y. Zhou, S. Zhang, D. Hua and X. Zhu, Int J Biol Macromol, 2013,
62, 365-369.