supporting immigration for an enhanced …
TRANSCRIPT

FACTA UNIVERSITATIS
Series: Economics and Organization Vol. 17, No 1, 2020, pp. 1 - 16
https://doi.org/10.22190/FUEO190927001C
© 2020 by University of Niš, Serbia | Creative Commons Licence: CC BY-NC-ND
Original Scientific Paper
SUPPORTING IMMIGRATION FOR AN ENHANCED
AGRICULTURAL SUSTAINABLE DEVELOPMENT
WITHIN THE EUROPEAN UNION1
UDC 314.742(4-672EU)
338.43: 502.131.1(4-672EU)
Mirela Cristea1, Graţiela Georgiana Noja
2, Constantin Stefan Ponea
3
1 University of Craiova, Faculty of Economics and Business Administration, Craiova,
Romania 2West University of Timişoara, Faculty of Economics and Business Administration,
East European Center for Research in Economics and Business, Timişoara, Romania 3Spiru Haret University, Faculty of Legal, Economic and Administrative Sciences,
Craiova, Romania
Abstract. Given the amplitude of migration in Europe and its potential to encourage or
hinder the agricultural development, the general objective of this paper is to assess this
possible potential on the long term, within a sustainable development frame of reference.
Along these lines, we have built up several scenarios that focus on the agricultural results
attained by ten EU Member States mainly targeted by immigrants, throughout the 2020-
2025 period (sustainable development extrapolation). We have elaborated a set of
indicators and within a panel in order to implement the spatial analysis and structural
equation modelling (SEM), as methodological endeavour. The results obtained, verified by
testing four hypotheses, show that a positive tendency in terms of increased government
agri-innovation support is revealed on the long run, through the economic (labour)
migration. Our findings outline that conclusive results of labour immigration could
reverse generating unbalances in the agricultural sector. Thus, the need to develop
accurate tailored policies is more than necessary by acknowledging the complex problems
of the rural areas and those of international migration, as well as the major discrepancies
among countries and stronger socio-economic interconnections.
Key words: agriculture sector, international migration, European integration,
sustainable development, econometric modelling
JEL Classification: J61, Q10, C31
Received September 27, 2019 / Accepted October 30, 2019
Corresponding author: Mirela Cristea
University of Craiova, Faculty of Economics and Business Administration, A.I.Cuza Street, No. 3, postal code
200585, Craiova, Romania
E-mail: [email protected]

2 M. CRISTEA, G. G. NOJA, C. S. PONEA
1. INTRODUCTION
Around the world, agriculture represents an important sector, especially by considering
its development potential (37% agricultural land out of the total land area in 2014,
according to the World Bank, 2017). Still, “due to its dependence on natural factors”
(Arisoy et al., 2017, p. 234), agriculture generates annual fluctuations of producers’ income,
due to the specific uncertainties (Cristea et al., 2008). This fact, in the long run, “leads to the
migration of farmers” (Arisoy et al., 2017, p. 246), thus inducing complex implications
upon the agriculture’s results.
The global updated statistics reveal the magnitude of international migration, from
which a high share of migrants are rural people, “revealed by the fact that around 40 percent
of international remittances are sent to rural areas” (FAO, 2017a, p. 98).
A series of migration research (e.g. Card et al., 2010; Krause et al., 2016), and especially
those focused on the Brexit implications after the June 2016 decision (e.g. Kierzenkowski et
al., 2016), have mainly analysed its effects by considering various factors. However, the
overall implications of migration, in Europe, on the agriculture field have been less analysed
by specialists, although this sector has a considerable potential, mainly through the
agricultural land. At the same time, there are a number of studies that have studied the
impact of migration upon agriculture in North America (e.g. Barkley, 1990; Martin, 1993),
Latin America (e.g. Balan, 1983; Aide & Grau, 2004) and Asia (e.g, Sunam, 2017). In
Europe, however, there are few studies taking into account the migration implications upon
the agricultural sector and most of these have outcomes for a particular country, such as
Albania (Miluka et al., 2010). In a previous research into this field, we have investigated
(Cristea & Noja, 2019) these complex implications at the level of the main targeted ten
European Union (EU) countries, for the period 2000-2016.
Based on this framework, the general objective of this research is to forecast the
implications of immigration upon the agriculture field on the long term (2020-2025
period), within the sustainable development goals (SDGs), for ten European Union Member
States (MS) mainly targeted by immigrants (namely Germany, France, the UK, Austria,
Sweden, Italy, Spain, Belgium, Denmark and Finland). Thus, this research represents a
further enhancement of that made by Cristea and Noja (2019), on the fore of sustainable
development. The SDGs are applied to all 193 countries of United Nations (UN), globally,
without any distinction for “developed” or “developing” states. The SDGs are also
centralized by the European Union (EU) Statistical Office (Eurostat database) for each
country, both MS, and non-EU countries.
The next section of the paper comprises a synthesis of literature review, summarizing
the main findings on migrants’ implications upon the agricultural sector in different
economies, along with the current situation of migration flows and main agricultural
outcomes in the EU. Further are presented the data and the methodology applied, followed
by main results, discussions and concluding remarks in the final stage of our research.

Supporting Immigration for an Enhanced European Union Agricultural Sustainable Development 3
2. THE LITERATURE REVIEW
2.1. Main findings of previous researches
There are several studies, which analyse the agriculture under the impact of the migration
process around the world; still, in Europe, these potential implications did not represent a
prevailing subject for researchers.
Thus, for the North America region, Barkley (1990) applied aggregate data for
migration in the United States of America (USA) and „a two-sector model of occupational
choice” (Barkley, 1990, p. 567) for the labour outputs in agriculture. He highlighted the
importance of accurate policies for increasing the farms’ income, with a further impact on
the employment levels in agriculture. Martin (1993) studied the impacts of trade and
migration upon agriculture in Mexico under the North American Free Trade Agreement
(NAFTA). He pointed out that this kind of agreement between USA and Mexico would
generate annual increase of migration from Mexico towards USA on the short-term by
100,000 persons. For the long-term, NAFTA is a keystone for reducing emigration from
Mexico by enhancing the economic growth and better job creation in Mexico. The author
found that the policies on the labour market of the hosting countries (e.g. USA), and also
the regulation on the migrants’ countries (e.g. Mexican land reforms, privatization, and
deregulation) would influence the migration process.
For Latin America, Balan (1983) investigated internal migration in relation with the
social structure of agriculture for a period of 100 years, which, in the last stage, “led to the
declining importance of peasant production and the increasing importance of wage labour”
(Balan, 1983, p. 151). Studying migration in Latin American on the background of
globalization, Aide and Grau (2004) have drawn up into attention the need for “social
programs on preparing rural migrants for an urban environment and promoting ecosystem
recovery in the marginal agriculture” (Aide & Grau, 2004, p. 1915). They underlined the
impact of the urbanization process determined by rural-urban migration on the agricultural
field, especially, on ecosystem conservation.
For Asia, Sunam (2017) highlighted the fact that for some researchers and policy-
makers the path to prosperity would be the non-agrarian sectors, while others consider land
of major importance, especially, in poverty decreasing. He criticizes the narrow framework
of their analysis, which overtakes the “strong linkages between agriculture, migration and
rural labour, but also stay silent on how rural people interpret changes or continuities in
their livelihoods” (Sunam, 2017, p. 67).
Working in the agricultural area, “is associated with low and insecure incomes, poor
occupational safety and health conditions, gender inequality in pay and opportunities, and
limited access to social protection” (FAO, 2017a, p. 100). Also, Barone and Mocetti (2011)
attest that low-skilled migration tends to grow participation among native women to labour
market, thus generating the increase of productivity and output in the agricultural sector.
Therefore, Boswell (2016) underlines the necessity for better “training and education
policies (ALMPs)” for natives (e.g. British labour force) since a significant reduction of
labour will generate damaging effects, including in the agricultural sector. Card et al. (2010)
identified and evaluated another variable, “the passive labour market policies (PLMPs)”,
with major effects over the labour market, which refer mainly to: keeping the income for
“the unemployment period through unemployment benefits; the earlier retirement which
4 M. CRISTEA, G. G. NOJA, C. S. PONEA
facilitate total or partial retirement of elder workers with decreased possibilities in
finding a job” (Cristea & Noja, 2019, p. 120).
Regarding migration, since most policy-makers from developing countries tried to
diminish it, or even to ignore it, they recommend to sustain migration, “becoming aware
of its potential”, by following priorities: “reducing the costs and risks faced by migrants;
ensuring that entitlements to state services are portable; facilitating remittances; improving
accountability and transparency in labour markets; and raising awareness of labourers’
rights” (Wiggins & Deshingkar, 2007, p. 3). In Europe, the Brexit decision (being in
process of finalization at the end of October 2019) will have a significant impact upon
migration flows. A possible diminishing of migration inflows could generate negative
effects (especially for the UK), particularly for low-salary fields, mainly targeted by
migrants, such as manufacturing, care jobs, food processing (Rienzo & Vargas-Silva, 2012).
2.2. Current situation of agriculture and international migration within the EU
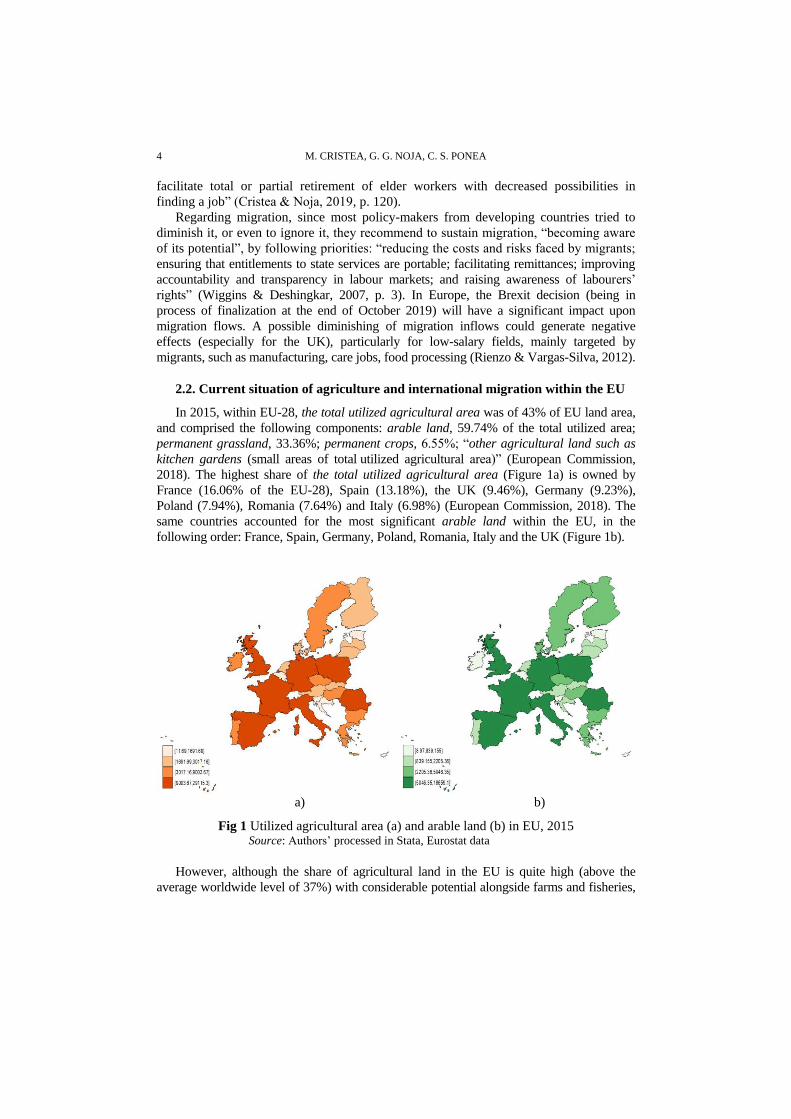
In 2015, within EU-28, the total utilized agricultural area was of 43% of EU land area,
and comprised the following components: arable land, 59.74% of the total utilized area;
permanent grassland, 33.36%; permanent crops, 6.55%; “other agricultural land such as
kitchen gardens (small areas of total utilized agricultural area)” (European Commission,
2018). The highest share of the total utilized agricultural area (Figure 1a) is owned by
France (16.06% of the EU-28), Spain (13.18%), the UK (9.46%), Germany (9.23%),
Poland (7.94%), Romania (7.64%) and Italy (6.98%) (European Commission, 2018). The
same countries accounted for the most significant arable land within the EU, in the
following order: France, Spain, Germany, Poland, Romania, Italy and the UK (Figure 1b).
a) b)
Fig 1 Utilized agricultural area (a) and arable land (b) in EU, 2015 Source: Authors’ processed in Stata, Eurostat data
However, although the share of agricultural land in the EU is quite high (above the
average worldwide level of 37%) with considerable potential alongside farms and fisheries,

Supporting Immigration for an Enhanced European Union Agricultural Sustainable Development 5
the agriculture’s share in EU’s GDP is very low, representing an average of 2.32% in 2016,
compared to 4.26% in all EU MS, respectively 4%, globally (World Bank, 2017). Thus, we
can notice that, on the one hand, among the countries with high agricultural potential there
are mostly developed countries (France, Spain, the UK, Germany, Italy), even though the
share of agriculture in these countries’ GDP is not significant (1% of GDP for the UK and
Germany, 2% for France and Italy, and 3% for Spain) (World Bank, 2017). On the other
hand, Poland and Romania have a large share of agricultural area among EU-28 (ranks 5
and 6), being the most important agricultural producers from the EU-28 (Marcu et al., 2015;
Done et al., 2012). Furthermore, these two countries face large emigration flows, with
important negative spillovers “on the size and structure of the labour force” (Noja et al.,
2018, p. 3), particularly in agriculture. Moreover, the highest contribution of agriculture to
GDP among the EU countries is for: Bulgaria (5%), Croatia, Greece, Hungary, Latvia,
Romania and Slovak Republic (4% of GDP in each country). These countries are mainly
emigration or labour-exporting countries so as the migration process reflects negatively in
terms of long-term economic development.
Nowadays, agriculture represents “the world’s biggest employer and largest economic
sector for many countries. Yet rural people – who produce 80 percent of our food – make
up four-fifths of the global poor” (FAO, 2017b, p. 5). Thus, if at the global level, the
employees in agriculture registered a share of 26.7% (866.3 millions) in the total number of
employees in 2016 (3240 millions), for EU-28 this share was 4.3% in 2016 (9,771 thousand
employees out of 226,716 thousand overall) found in a decreasing trend from 7.9% in 2000
(ILO, 2017). By comparing Eastern with Western Europe, the largest share of agricultural
workers can be found in Eastern Europe with 9.4% of total employees, compared to 2.1% in
Western Europe (Figure 2).
Fig 2 Shares of employment in agriculture in EU-28, 2016 Source: Own process data offered by the International Labor Organization (ILO)
Regarding the international migration situation, in 2015, large shares of international
migrants were accounted for by Europe (over 31%), followed by Asia (up to 31%) (UN
DESA, 2015). The total number of migrants in Europe (over 76 million people) has increased
with almost 4 million people compared to 2014, representing 31.25% from the total stock of
migrants at the worldwide level (over 243 million persons) (UN DESA, 2015). The highest
share of migrants’ stock in Europe is in Western Europe (35.96%), followed by Eastern

6 M. CRISTEA, G. G. NOJA, C. S. PONEA
Europe (25.85%), encompassing mostly rural people, “revealed by the fact that around
40 percent of international remittances are sent to rural areas” (FAO, 2017a, p. 98).
The most targeted 10 EU countries by migrants in 2015 were: “Germany (12 million
migrants stock), the UK (8.5 million), France (7.8 million), Spain (5.9 million), Italy (5.8
million), Sweden (1.6 million), Austria (1.5 million), Belgium (1.4 million), Denmark
(572 thousands), Finland (315 thousands)” (Noja et al., 2018, p. 4). Bilaterally, the main
migrant sending economies are in fact developing countries, with an important rural field
into the economy and a high share of agricultural employees looking for cross-border
low-skilled jobs (e.g. Poland, with 3.6 million of migrants, Romania, almost 3 million).
The inflow trend in 2016 compared to 2015 increases into the following EU-10
countries: Germany (by 30%), France (by 4%), Spain (by 18%), Sweden (by 26%), Austria
(by 3%), Belgium (by 7%) and Finland (by 8%). The decreasing is registered into the UK
(by -6%), Italy (by -21%), and Denmark (by -5%) (OECD, 2017). At the end of 2016, the
refugees’ situation registered “a total of 22.5 million displaced people, being considered the
highest on record, although the annual rate of growth has slowed since 2012” (OECD,
2017, p. 31). Large shares of asylum seekers in Europe were registered by Germany and
Italy, “Germany remained the top recipient, with over 720,000 applications, followed by the
United States (262,000) and Italy (123,000)” (OECD, 2017, p. 32).
Thus, we can see a double trend in international migration, one regarding the labour
mobility (migrants searching for better jobs), and the other, the flow of refugees and
asylum applicants (called “humanitarian migration”). On these credentials reflecting the
migration amplitude and agriculture potential in Europe, along with the Brexit
phenomenon and attaining the SDGs by all countries, we further investigate our general
and specific research objectives.
3. DATA AND METHODOLOGY
3.1. Data used
In our investigation, we analyse the data on the long term (2020-2025), within a
sustainable development frame of reference, especially after the Brexit negotiation deadline
(October 2019). Thus, we take into account the following dimensions for our data
(variables), most of them included into the SDGs: reducing poverty (SDG1, ”No Poverty”),
highly connected with the agricultural sector; well-being (SDG3) through the life
expectancy at birth; quality of education (SDG4), by educational attainment for tertiary
education; decent work (SDG8) for which we measure labour market indicators, such as
employment and unemployment rate, the labour market policies (ALMPs and PLMPs
respectively); industry innovation implications (SDG9), by the research and development
(RD) expenses for the business enterprise sector; income and living conditions, measured
through net earnings. These dimensions are included into 3 categories of data, representing:
a) the main agricultural outcomes; b) the immigration situation; c) SDGs presented above
and other representative indicators for the international activity, namely: Foreign Direct
Investment (FDI) (UNCTAD, 2017), and KOF index of globalization (KOF) (ETH Swiss
Federal Institute of Technology Zurich, 2017).
Thus, for the agricultural outcomes, we’ve considered the following data: “Value
Added by kind of economic activity (VA_AGRI), including agriculture, hunting, forestry,
Supporting Immigration for an Enhanced European Union Agricultural Sustainable Development 7
fishing” (UNCTAD, 2017); “agricultural factor income per annual work unit (AGRI_AWU);
government support to agricultural RD (GOV_AGRI)” (European Commission, 2018);
“merchandise trade matrix - food group (X_FOOD); merchandise trade matrix - agricultural
raw materials (X_AGRI_RM)” (UNCTAD, 2017). The immigration situation is measured by
“flows of immigrants and foreign population (IMIG)” (European Commission, 2018;
OECD, 2017), and “flows of asylum applicants” (ASYL) (UNHCR, 2017). For SDGs
attainment (European Commission, 2018), we include in our research the following
indicators: “at-risk-of-poverty rate” (POV); “life expectancy at birth” (LE); “educational
level reflected through the educational attainment for tertiary education” (EDU_T);
“employment rate” (ER); “unemployment rate of foreign population” (UR_F); “the active
labour market policies” (ALMPs) and “the passive labour market policies” (PLMPs); “RD
expenditures for the business enterprise sector” (BERD); “annual net earnings of a two-
earner married couple with two children” (EARN).
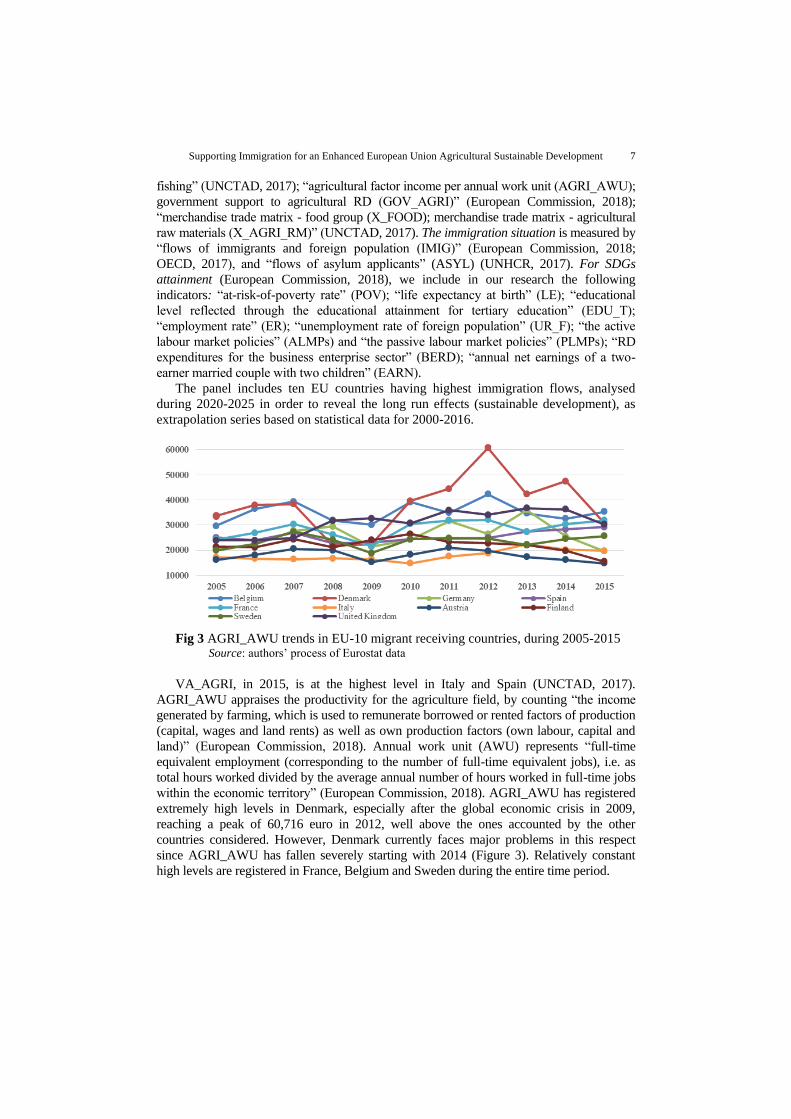
The panel includes ten EU countries having highest immigration flows, analysed
during 2020-2025 in order to reveal the long run effects (sustainable development), as
extrapolation series based on statistical data for 2000-2016.
Fig 3 AGRI_AWU trends in EU-10 migrant receiving countries, during 2005-2015 Source: authors’ process of Eurostat data
VA_AGRI, in 2015, is at the highest level in Italy and Spain (UNCTAD, 2017).
AGRI_AWU appraises the productivity for the agriculture field, by counting “the income
generated by farming, which is used to remunerate borrowed or rented factors of production
(capital, wages and land rents) as well as own production factors (own labour, capital and
land)” (European Commission, 2018). Annual work unit (AWU) represents “full-time
equivalent employment (corresponding to the number of full-time equivalent jobs), i.e. as
total hours worked divided by the average annual number of hours worked in full-time jobs
within the economic territory” (European Commission, 2018). AGRI_AWU has registered
extremely high levels in Denmark, especially after the global economic crisis in 2009,
reaching a peak of 60,716 euro in 2012, well above the ones accounted by the other
countries considered. However, Denmark currently faces major problems in this respect
since AGRI_AWU has fallen severely starting with 2014 (Figure 3). Relatively constant
high levels are registered in France, Belgium and Sweden during the entire time period.

8 M. CRISTEA, G. G. NOJA, C. S. PONEA
GOV_AGRI data have registered a major increase in Germany after 2004, this country
following an upward path afterwards, well above the one accounted by the other EU
countries considered. At the same time, Spain has made important efforts to support RD in
agriculture, with important positive output during 2004-2008 period. However, after the
global crisis in 2008-2009 this support has significantly diminished, even though it is still
above the one performed by most EU economies (Fig 4). France registered important
contribution in RD for agriculture in 2016, and the UK saw a visible decrease in the
amounts allocated for RD in agriculture.
Fig 4 GOV_AGRI in EU-10 migrant receiving countries during 2004-2016 Source: authors’ process of Eurostat data
X_FOOD and X_AGRI_RM capture “the international trade performance of the
agricultural field” (Cristea & Noja, 2019, p. 117) in selected countries and reveal the
importance of this sector for EU-10 economies. These two indicators highlight the
dominant position for Spain (food) and Austria (raw materials) (UNCTAD, 2017).
3.2. Methodology applied into research
Based on our general objective and by reviewing the current state of the literature on
agricultural results under the immigration impact, we have set out the following research
hypotheses (H):
H1. There is a strong relationship between VA_AGRI and IMIG/ASYL;
H2. There is a strong relationship between AGRI_AWU and IMIG/ASYL;
H3. IMIG and ASYL induce increased GOV_AGRI;
H4. IMIG and ASYL improve X_FOOD and X_AGRI_RM.
First, we have applied the standardisation procedure on our data, for a proper
equivalence among EU-10 MS, and to remove the fluctuation and associated disparities
within the panel, according to the Eq. (1) (OECD, 2005):
“sd
meanxy i
i
, (1)
where: yi represents the composite indicators, xi is the crude value of the indicator; and
sd, the standard deviation”.

Supporting Immigration for an Enhanced European Union Agricultural Sustainable Development 9
To forecast the variables during 2020-2025 we have applied the linear extrapolation,
based on statistical time series for 2000-2016. “The extrapolation formula used is
described by Eq. (2).
( ) ( ),11 2 1
2 1
x xy x y y y
x x
, (2)
where: x1, y1 and x2, y2 are the two endpoints of a linear graph; and x represents the point
of which value is to be extrapolated” (Noja et al., 2018, p. 6).
Then, we have applied particular macro-econometric models in order to appraise the
effects lead by immigration flows upon receiving economies’ agricultural results,
namely, spatial analysis models (lag and error), Eq. (3a) and (3b) (Viton, 2010).
“Spatial lag models:
,y Wy X u (3a)
Spatial error models:
,y X u ,u pWu (3b)
where: W is the inverse distance weights matrix”.
The standard macro-econometric model for VA_AGRI as dependent variable is built
up as “a baseline panel regression model, but reconfigured through the spatial
procedures” (Eq. 4a) for lag model, and Eq. 4b for error model):
,___
__
9876
543210
ititititit
ititititititit
uOFDIIFDIEARNTEDU
ALMPsBERDERASYLIMIGAGRIWVAAGRIVA
(4a)
.__
__
98
76543210
itititit
itititititititit
WuOFDIIFDI
EARNTEDUALMPsBERDERASYLIMIGAGRIVA
(4b)
The final stage of our methodology consists in applying the structural equations
modelling (SEM). SEM reveals the integrated analysis of immigration interlinkages
(direct, indirect and total) with agriculture field. The general representation of SEM is
shown into “equation system (5).
mtntx
mnc
ntx
mc
mty
mmb
ty
mb
tntx
nc
txc
mty
mb
tyb
tntx
nc
txc
mty
mb
tyb
...1
....11
............
22...
1212....
221
11...
1111....
211
(5)
where: t is the number of time periods; bij represents the yij endogenous variable’s parameters;
cij are the xij exogenous variable’s parameters, i=1, …, m; j=1, …, n” (Noja et al., 2018, p. 8).
4. RESULTS AND DISCUSSIONS
4.1. Variables extrapolation
Figure 5 reveals the 2025 timeline forecast of the agricultural indicators included in our analysis (the sustainable development frame) for EU-10 countries. Thus, VA_AGRI is at the highest level in the UK and Belgium for 2025 (Figure 5a). These forecasts shed initial

10 M. CRISTEA, G. G. NOJA, C. S. PONEA
lights on the importance of agriculture for the UK’s economy after the major challenges encountered within the Brexit context. Relatively constant high levels for AGRI_AWU are registered in France and Belgium (the same tendency as in 2015) (Figure 5b). Considering GOV_AGRI, the UK saw a visible decrease in the amounts allocated for RD in agriculture due to Brexit (Figure 5c). High levels of RD in agriculture will be registered by France and Germany. X_FOOD will tend to increase in Germany and Spain (Figure 5d). X_AGRI_RM of the UK will tend to decrease considerably until 2025 (Figure 5e).
VA_AGRI (a) AGRI_AWU (b) GOV_AGRI (c)
X_FOOD (d) X_AGRI_RM (e)
Fig 5 Agriculture outcomes forecast in 2025 for EU-10 MS Source: authors’ process in Stata
4.2. Spatial analysis models
Spatial results (Table 1) show that the immigration process requires a particular attention from policy makers across Europe, since our estimations for the 2020-2025 period reveal that the positive outcomes of IMIG could reverse leading to unbalances even in the agricultural sector (the statistically significant estimated coefficient is –0.0569). This is also the case of humanitarian migration (ASYL), since the results point out that increased inflows of ASYL tend to rather induce negative spillovers upon the VA_AGRI (the estimated coefficients are -0.111 and –0.131).
The uncertainty brought after 2020 reflects negatively also considering FDI inwards, which generate a slight diminishing in the agricultural results. Negative impacts are also registered for the ALMPs, and EDU_T, similar with those obtained for the period 2000-

Supporting Immigration for an Enhanced European Union Agricultural Sustainable Development 11
2016 (Cristea & Noja, 2019). In contrast, beneficial results can be registered in case of FDI outwards, with positive impacts on the agriculture’s productivity, thus raising the contribution of agriculture to GDP. Positive effects will be registered in terms of ER and EARN. Moreover, the results highlight the significance of BERD in growing the VA_AGRI (the estimated coefficients are positive and extremely significant at a threshold of 1%).
Table 1 Spatial lag and error models (robust and bootstrap) for VA_AGRI, 2020-2025
Variables
(1) (2) (3) (4) Spatial_lag
(robust) Spatial_lag (bootstrap)
Spatial_error (robust)
Spatial_error (bootstrap)
IMIG_st -0.0354 -0.0354 -0.0569* -0.0569* (0.0244) (0.0310) (0.0242) (0.0275) ASYL_st -0.111*** -0.111*** -0.131*** -0.131*** (0.0164) (0.0168) (0.0155) (0.0174) ER_st 0.273** 0.273* 0.286** 0.286* (0.0839) (0.135) (0.0875) (0.114) BERD_st 0.337*** 0.337* 0.362*** 0.362** (0.0904) (0.148) (0.0941) (0.126) ALMPs_st -0.182*** -0.182*** -0.219*** -0.219*** (0.0249) (0.0178) (0.0167) (0.0230) EDU_T_st -0.0870*** -0.0870** -0.0919*** -0.0919*** (0.0182) (0.0296) (0.0192) (0.0248) EARN_st 0.0923*** 0.0923* 0.102*** 0.102** (0.0258) (0.0407) (0.0285) (0.0326) FDI_I_st -0.0600** -0.0600* -0.0550** -0.0550* (0.0197) (0.0250) (0.0212) (0.0277) FDI_O_st 0.0139 0.0139 0.0163 0.0163 (0.0329) (0.0368) (0.0344) (0.0435) _cons 0.431 0.431 0.0426 0.0426 (0.236) (0.299) (0.143) (0.157)
Rho _cons 0.603* 0.603** (0.304) (0.227)
Sigma _cons 0.220*** 0.220*** 0.223*** 0.223*** (0.0241) (0.0203) (0.0253) (0.0242)
Lambda _cons 0.562 0.562 (0.381) (0.719)
Test parameters chi2(10)= 141.29 p=0.0000
chi2(10)= 602.05 p=0.0000
chi2(10)= 675.34 p=0.0000
chi2(10)= 753.39 p=0.0000
LM 1.899 (0.168)
1.899 (0.168)
0.949 (0.330)
0.949 (0.330)
Wald test of rho/ lambda
3.936 (0.047)
3.936 (0.047)
2.174 (0.140)
2.174 (0.140)
Acceptable range for rho: -3.509 < rho < 1.000; Acceptable range for lambda: -3.509 < lambda < 1.000
Moran’s I IMIG I=0.429; p=0.000; ASYL I=0.241; p=0.000; VA_AGRI=0.254; p=0.000
N 60 60 60 60
Note: standard errors in parentheses; * p < 0.05,
** p < 0.01,
*** p < 0.001
Source: authors’ research in Stata

12 M. CRISTEA, G. G. NOJA, C. S. PONEA
These aspects were also underlined by Kierzenkowski et al. (2016), Jirasek (2017)
and Cristea and Noja (2019), which proved that a reorient to innovation strategies
combined with supporting the international trade activity, could overcome the potential
difficulties registered after the Brexit.
The spatial lag models show that the positive evolution based on increased GOV_AGRI,
X_FOOD and X_AGRI_RM is registered on the long-term (Table 2), but only under the
influence of IMIG. For ASYL, the negative coefficients highlight the significance of
“accurate strategies, policies and targeted measures to be applied by the major receiving
countries to manage with growth immigration inflows and to properly cope with the refugee
crisis in Europe” (Cristea & Noja, 2019, p. 118). The immigrants can be well integrated into
receiving countries and can therefore increase the agricultural and overall outcomes, as
reflected by our estimations, given an accurate harmonized strategy applied at the European
level.
Table 2 Results of Spatial lag models, 2020-2025
Variables (1) (2) (3) (4) AGRI_AWU_st GOV_AGRI_st X_FOOD_st X_AGRI_RM_st
IMIG_st 0.0458 0.311*** 0.486*** 0.280*** (0.0349) (0.0275) (0.0294) (0.0461) ASYL_st -0.379*** -0.0835*** -0.0288* -0.0335** (0.0408) (0.0110) (0.0127) (0.0120) ER_st 0.0606 -0.531*** -0.410*** -0.0639 (0.148) (0.0855) (0.0806) (0.0745) BERD_e_st 0.483** 0.709*** -0.0630 0.213** (0.148) (0.0757) (0.0746) (0.0647) ALMPs_st -1.144*** 0.115*** 0.321*** -0.190*** (0.102) (0.0283) (0.0191) (0.0371) EDU_T_st -0.0359 -0.131*** -0.127*** 0.0305* (0.0261) (0.0160) (0.0159) (0.0135) EARN_st -0.171** -0.0612** -0.374*** -0.323*** (0.0640) (0.0226) (0.0285) (0.0513) FDI_I_st 0.296*** 0.102*** -0.110*** 0.0420** (0.0404) (0.0189) (0.0160) (0.0134) FDI_O_st -0.203*** -0.371*** 0.352*** -0.0504** (0.0507) (0.0282) (0.0219) (0.0166) _cons 2.089*** 1.031*** 1.162*** 0.278** (0.201) (0.0986) (0.114) (0.107)
Rho _cons -0.0122 0.899*** -0.135 0.116 (0.260) (0.0992) (0.132) (0.426)
Sigma _cons 0.465*** 0.253*** 0.202*** 0.197*** (0.0383) (0.0244) (0.0226) (0.0197)
N 60 60 60 60
Note: Standard errors in parentheses; * p < 0.05,
** p < 0.01,
*** p < 0.001
Source: authors’ research in Stata
Based on spatial lag models, we can say that: H1. There is a strong relationship between
VA_AGRI and IMIG/ ASYL is partially fulfilled (only for ASYL); H2. There is a strong
relationship between AGRI_AWU and IMIG/ ASYL is partially fulfilled (only for ASYL);

Supporting Immigration for an Enhanced European Union Agricultural Sustainable Development 13
H3. IMIG and ASYL induce increased GOV_AGRI is partially fulfilled (only for IMIG); H4.
IMIG and ASYL improve X_FOOD and X_AGRI_RM is partially fulfilled (only for IMIG).
4.3. SEM models
Considering SEM, we have verified Wald tests for equations, compared Likelihood
Ratios (LR) outcomes (LR test for model versus saturated and baseline versus saturated)
and Information criteria (Akaike’s, Bayesian). Thus, we have obtained 5 models
(VA_AGRI, AGRI_AWU, GOV_AGRI, X_FOOD and X_AGRI_RM) with conclusive
results for 2020-2025 (Figure 6).
(a) VA_AGRI (b) AGRI_AWU
EARN6.7
2.1
EDU_tert16
2.5
UR_F1.7
-.26
IMIG-.38
1 5.6
KOF_T1.9
-1.8
ASYL11
2 23
POV_R2.1
-.77
LE3
2.8
ER.044
3 .73
VA_agri-.91
4 .63
ALMP3.5
.19
PLMP3.5
-1
.32-.11
-.74
-.57-1.6
1.1-2.3
.22
-.0043
.29
-.13
-.18
EARN6.7
2.1
EDU_tert16
2.5
UR_F1.7
-.26
IMIG-.38
1 5.6
KOF_T1.9
-1.8
ASYL11
2 23
POV_R2.1
-.77
LE3
2.8
ER.044
3 .73
Agri_AWU-.15
4 2.5
ALMP3.5
.19
PLMP3.5
-1
.32-.11
-.74
-.57-1.6
1.1-2.3
.22
-.0043
.29
-.13
-.71
(c) GOV_AGRI (d) X_FOOD
EARN6.7
2.1
EDU_tert16
2.5
UR_F1.7
-.26
IMIG-.38
1 5.6
KOF_T1.9
-1.8
ASYL11
2 23
POV_R2.1
-.77
LE3
2.8
ER.044
3 .73
GOV_agri.17
4 2.4
ALMP3.5
.19
PLMP3.5
-1
.32-.11
-.74
-.57-1.6
1.1-2.3
.22
-.0043
.29
-.13
.11
EARN6.7
2.1
EDU_tert16
2.5
UR_F1.7
-.26
IMIG-.38
1 5.6
KOF_T1.9
-1.8
ASYL11
2 23
POV_R2.1
-.77
LE3
2.8
ER.044
3 .73
X_food.42
4 1.2
ALMP3.5
.19
PLMP3.5
-1
.32-.11
-.74
-.57-1.6
1.1-2.3
.22
-.0043
.29
-.13
-.22
(e) X_AGRI_RM
EARN6.7
2.1
EDU_tert16
2.5
UR_F1.7
-.26
IMIG-.38
1 5.6
KOF_T1.9
-1.8
ASYL11
2 23
POV_R2.1
-.77
LE3
2.8
ER.044
3 .73
X_agri_RM-.097
4 1.2
ALMP3.5
.19
PLMP3.5
-1
.32-.11
-.74
-.57-1.6
1.1-2.3
.22
-.0043
.29
-.13
-.24
Fig 6 SEM models, EU-10 MS, 2020-2025 Source: authors’ process in Stata

14 M. CRISTEA, G. G. NOJA, C. S. PONEA
Thus, in the 2020-2025 sample, we acknowledge that the extrapolation procedure is
subject to increasing uncertainty and the results obtained must be interpreted with caution.
Still, also in this case, the major determinants of the migration decision are the employment
opportunities for the foreign population, and the living standards at destination reflected
here particularly through the earnings levels (0.32 estimated coefficient associated with the
EARN variable). The results are opposite to Rienzo and Vargas-Silva (2012), which
revealed a reversed connection between migration flows and migrant’s earnings (especially
for the UK), but also to Cristea and Noja (2019), revealing negative implications for the
period 2000-2016. Moreover, the total employment rate (ER) increases significantly under
the labour immigration effects (extremely statistically significant estimated coefficients for
the IMIG variable, 0.22; while the ASYL coefficients are negative, but statistically
insignificant). The further impact of all these implications upon the agricultural sector for
the 10-EU MS is positive only in terms of increased GOV_AGRI, opposite to those obtained
for the period 2000-2016 (Cristea & Noja, 2019). However, the estimations reveal that there
is evidence to attest that an unfavourable implication on agricultural productivity
(AGRI_AWU has a negative estimated coefficient of -0.71*** that is extremely statistically
significant) at on this sectors’ contribution to GDP (VA_AGRI estimated coefficient is -
0.18* significant at the 0.05 level), if the immigration process is not properly managed in the
Brexit framework (deadline negotiations 2019). Moreover, there are also negative effects
upon the international trade activity deployed in the agricultural sector as reflected through
a reduction both in X_FOOD (-0.22 less statistically significant) and X_AGRI_RM (-0.24*
significant at the 0.05 level) in the light of new trade agreements established after the Brexit.
Thus, considering the SEM models, H1, H2, H3 are fulfilled, and H4 is rejected.
5. CONCLUSIONS
The results obtained, verified by testing 4 hypotheses (through both econometric
modelling procedures applied, spatial analysis and SEM, respectively), highlight: a strong
direct linkage between the value added by the agricultural sector and the immigration flows
(mainly humanitarian migration) (H1); instead, the productivity in the agricultural sector
(measured through the agricultural factor income per AWU) is affected (negatively) only by
humanitarian migration, labour migration having no statistical significance (low intensity)
(H2); immigration flows (economic migration) induce increased governmental efforts
focused on research and development to sustain the agricultural sector (H3); immigration
flows (economic migration) improve the international trade outcomes for the agricultural
sector (basic food and raw materials) (H4).
Thus, the need to develop policies for building a new Europe is more than necessary by
acknowledging the complex problems of the rural areas and those of international
migration, especially on the background of Brexit decision, characterized by the redemption
of major discrepancies and stronger socio-economic connections.
Acknowledgement: A part of this research was presented at the International Conference on
Economics, Business and Economic Thought (EBET), The Bucharest University of Economic Studies,
20 – 21 April 2018, Bucharest, Romania.
Supporting Immigration for an Enhanced European Union Agricultural Sustainable Development 15
REFERENCES
Aide, M. T., & Grau, R. H. (2004). Globalization, migration, and Latin American ecosystems. Science,
305(5692), 1915-1916 DOI: 10.1126/science.1103179
Arisoy, H., Bayramoglu, Z., Karakayaci, Z., & Oguz, C. (2017). The effect of agricultural support on the economic
sustainability of agricultural enterprises. Custos e Agronegocio On Line, 13(3), 233-253.
Balan, J. (1983). Agrarian structures and internal migration in a historical perspective: Latin American case
studies. The United States Agency for International Development (USAID), Document n. 016891, 151-185,
Retrieved from: https://www.popline.org/node/397850, Accessed on: 16 January 2019.
Barkley, A. P. (1990). The determinants of the migration of labor out of agriculture in the United States, 1940–
85. American Journal of Agricultural Economics, 72(3), 567–573 https://doi.org/10.2307/1243025
Barone, G., & Mocetti, S. (2011). With a little help from abroad: the effect of low-skilled immigration on the
female labour supply. Labour Economics, 18, 664-675.
Boswell, C. (2016). Migration: would limiting the free movement of labour be good or bad?. In: Jeffery, C. &
Perman, R. (Eds.), Britain’s Decision: Facts and Impartial Analysis for the EU referendum on 23 June
2016. Edinburgh: The David Hume Institute.
Card, D., Kluve, J., & Weber, A. (2010). Active Labour Market Policy evaluations: a meta-analysis. The Economic
Journal, 120, F452-F477.
Cristea, M., Drăcea, R., & Buziernescu, R. (2008). Possible risk coverage in agriculture through agricultural
insurances. Bulletin of University of Agricultural Sciences and Veterinary Medicine Cluj-Napoca.
Horticulture, 63(1-2), 157-162.
Cristea, M., & Noja, G.G. (2019). European agriculture under immigration effects: New empirical
evidence. Agricultural Economics, 65(3), 112-122, https://doi.org/10.17221/69/2018-AGRICECON
Done, I., Chivu, L., Andrei, J., & Matei, M. (2012). Using labor force and green investments in valuing the
Romanian agriculture potential. Journal of Food, Agriculture & Environment, 10(3&4), 737-741.
ETH Swiss Federal Institute of Technology Zurich. (2017). Kof index of globalization. KOF Swiss Economic
Institute. Retrieved from: http://globalization.kof.ethz.ch/, Accessed on: 12 December 2018.
European Commission. (2018). Eurostat database. Retrieved from: http://ec.europa.eu/eurostat, Accessed on:
16 January 2019.
FAO. (2017a). The future of food and agriculture – Trends and challenges. Retrieved from: http://www.fao.org/
3/a-i6583e.pdf, Accessed on: 16 January 2019.
FAO. (2017b). Food and agriculture: Driving action across the 2030 Agenda for sustainable development.
Retrieved from: http://www.fao.org/3/a-i7454e.pdf, Accessed on: 12 January 2019..
International Labour Organization (ILO). (2017). ILO’s world employment and social outlook reports,
Employment by sector - ILO modelled estimates.
Jirasek, M. (2017). The influence of national culture on changes in R&D expenses among agrochemical
firms. Agricultural Economics, 63, 524-530, https://doi.org/10.17221/230/2016-AGRICECON
Kierzenkowski, R., Pain, N., Rusticelli, E., & Zwart, S. (2016). The economic consequences of Brexit: a taxing
decision (The OECD Economic Policy Paper Series, 16).
Krause, A., Rinne, U., & Zimmermann, K. (2016). European labour market integration: what the experts think.
International Journal of Manpower, IZA Discussion Paper, 8383, 1-27.
Marcu, N., Meghisan, G. M., & Jitea, I. M. (2015). An evaluation of the Romanian fruits and vegetables
producers access to different types of Common Agricultural Policy instruments. Is there any real
consistency with the policy objectives?. Notulae Botanicae Horti Agrobotanici Cluj-Napoca, 43, 243-249.
Martin, P. L. (1993). Trade and migration: NAFTA and agriculture. Washington D.C.: Institute for
International Economics.
Miluka, J., Carletto, G., Davis, B., & Zezza, A. (2010). The vanishing farms? The impact of international
migration on Albanian family farming. The Journal of Development Studies, 46, 140-161.
Noja, G. G., Cristea, S. M., Yüksel, A., Pânzaru, C., & Drăcea, R. M. (2018). Migrants’ role in enhancing the
economic development of host countries: Empirical evidence from Europe. Sustainability, 10(3), 894.
doi:10.3390/su10030894
OECD. (2005). Handbook on constructing composite indicators: Methodology and user guide. Paris: OECD
Publishing.
OECD. (2017). International migration outlook. Trends in migration flows. http://dx.doi.org/10.1787/migr_outlook-
2017-en
Rienzo, C., & Vargas-Silva, C. (2012). Migrants in the UK: An overview. Migration Observatory briefing,
Oxford, Compas, University of Oxford.

16 M. CRISTEA, G. G. NOJA, C. S. PONEA
Sunam, R. (2017). In search of pathways out of poverty: Mapping the role of international labour migration,
agriculture and rural labour. Journal of Agrarian Change, 17(1), 67–80.
United Nations, Department of Economic and Social Affairs (UN DESA). (2015). Trends in international
migrant stock: Migrants by destination and origin. United Nations database, POP/DB/MIG/Stock/Rev.2015.
United Nations Conference on Trade and Development (UNCTAD). (2017). UNCTADstat, Retrieved from:
http://unctadstat.unctad.org/EN/, Accessed on: 16 January 2019.
Un Refugee Agency (UNHCR) (2017). Figures at a glance 2017, Retrieved from: http://www.unhcr.org/
figures-at-a-glance.html, Accessed on: 12 January 2019.
Viton P. A. (2010). Notes on spatial econometric models. City and Regional Planning, 870, 9-10.
Wiggins S., & Deshingkar P. (2007). Rural employment and migration: In search of decent work.
Agris: International Information System for the Agricultural Science and Technology, Retrieved from:
http://Agris.Fao.Org/Agris-Search/Search.Do?Recordid=Gb2013203036, Accessed on: 22 January 2019.
World Bank (2017). 3.2. World Development Indicators, Agricultural inputs, Retrieved from: http://wdi.
worldbank.org/table/3.2, Accessed on: 12 January 2019.
PODRŠKA IMIGRACIJI ZA POBOLJŠANJE
POLJOPRIVREDNOG ODRŽIVOG RAZVOJA
UNUTAR EVROPSKE UNIJE
Uzevši u obzir veličinu migracija u Evropi i njihov potencijal da poboljšaju ili unazade
poljoprivredni razvoj, opšti cilj ovog rada je da proceni njihove potencijalne dugoročne posledice,
u okviru referentnog okvira održivog razvoja. S tim u vezi, razradili smo nekoliko scenarija koji se
fokusiraju na poljoprivredni razvoj deset zemalja-članica EU sa najvećim prilivom imigranata, u
period 2020-2025 (ekstrapolacija održivog razvoja). Razradili smo set pokazatelja da bismo
implementirali prostornu analizu i modeliranje strukturalnih jednačina (SEM), kao metodološki
napor. Dobijeni rezultati, verifikovani tertiranjem četiri hipoteze, pokazuju da se na duge staze
otkriva pozitivna tendencija u smislu povećane državne podrške agri-inovacijama, kroz ekomomsku
migraciju (migraciju radne snage). Naši nalazi u glavnim crtama daju da bi konačni rezultati
migracije radne snage mogli da promene stvaranje disbalansa u poljoprivrednom sektoru. Stoga,
potreba da se razviju precizne prilagođene politike je više nego potrebna, time što će se prepoznati
kompleksni problem ruralnih oblast ii međunarodnih migracija, kao i velike razlike među zemljama
i veća socio-ekonomska povezanost.
Ključne reči: sector poljoprivrede, međunarodne migracije, Evopske integracije, održivi razvoj,
ekonomski modelling