supporting image geolocation with diagramming and
TRANSCRIPT

Supporting Image Geolocation with Diagramming and Crowdsourcing
Rachel Kohler, John Purviance, Kurt Luther Dept. of Computer Science and Center for Human-Computer Interaction
Virginia Tech, Blacksburg, VA USA {rkohler1, ffdd4846, kluther}@vt.edu
Abstract Geolocation, the process of identifying the precise location in the world where a photo or video was taken, is central to many types of investigative work, from debunking fake news posted on social media to locating terrorist training camps. Professional geolocation is often a manual, time-consuming process that involves searching large areas of satellite imagery for potential matches. In this paper, we ex-plore how crowdsourcing can be used to support expert im-age geolocation. We adapt an expert diagramming technique to overcome spatial reasoning limitations of novice crowds, allowing them to support an expert’s search. In two experi-ments (n=1080), we found that diagrams work significantly better than ground-level photos and allow crowds to reduce a search area by half before any expert intervention. We al-so discuss hybrid approaches to complex image analysis combining crowds, experts, and computer vision.
Introduction In an information society awash with misinformation, sep-arating truth from fiction is more important than ever. One of the foundations of modern investigations across many fields, including journalism, law enforcement, and human rights activism, is the verification of social media, especial-ly photos and videos (Barot 2014). Governments post pho-tos of political events, terrorist organizations share propa-ganda, and everyday people use smartphones to document crimes, natural disasters, and other important events. This visual media increasingly forms the core of news coverage and our understanding of the world, yet it often cannot be trusted. Photos and videos can be edited or shared with misleading contextual information, intentional-ly or by accident. Image verification is the challenging process of analyzing photos or videos posted by others and determining 1) if they are what they claim to be, or if not, 2) what they actually depict. One of the key subtasks of image verification is geolo-cation, which involves mapping the precise location in the
Copyright © 2017, Association for the Advancement of Artificial Intelli-gence (www.aaai.org). All rights reserved.
world where a photo or video was made. Geolocation al-lows the investigator to determine where the image was actually made, and compare that with contextual claims about its meaning and purpose. Expert geolocators draw on many skills and resources to make these determinations (Higgins 2014, 2015; Kohler and Luther 2017). The process is often manual, and some-times tedious. Experts inspect the image for clues, such as familiar landmarks, weather, architecture, and landscapes. Text and graphics, such as logos, road signs, business names, and phone numbers, can be researched online to narrow down possibilities. When these clues aren’t defini-tive, expert geolocators often turn to diagramming and satellite image analysis. They first draw an aerial diagram of the ground-level image under investigation, a spatial reasoning skill requiring substantial practice. Then, they use commercial GIS services like Google Maps and Ter-raServer to systematically search the area for distinctive buildings, roads, or other structures matching their dia-gram. Depending on the size and density of the search area, this process can require hours or days even for experts, and may still prove fruitless. If the image can’t be geolocated, it may not be verifiable. In this paper, we explore how crowdsourcing can sup-port this geolocation process, with the goal of helping an expert locate an image faster and more accurately. Crowds have proven to be effective at analyzing satellite imagery, but novice crowds lack an expert’s spatial reasoning skill in recognizing ground-level features from aerial imagery. We close the gap by leveraging the diagramming technique from expert practice and adapting it for novice crowds to improve their satellite image analysis. In two experiments (n=1080), we present a technique that uses crowdsourcing to reduce a geolocation search area by half while finding the target area 98.3% of the time. We found that giving crowds a ground-level photo results in unacceptably poor performance, but a medium-detail aerial diagram significantly improves their perfor-mance to near-perfect levels. We also present a prioritiza-tion technique that uses multi-worker crowd agreement to direct experts to the most promising search areas. We dis-
Proceedings of the Fifth Conference on Human Computation and Crowdsourcing
(HCOMP 2017)
98

cuss the real-world applications and next steps for this work, including new opportunities to leverage the com-plementary strengths of crowds, experts, and computer vision, for complex image analysis tasks like geolocation.
Related Work
Computer Vision Approaches to Geolocation Image geolocation is a longstanding problem of interest for computer vision researchers. One set of approaches uses scene recognition to classify images into categories such as “gas station,” “playground,” or “beach” (e.g., Xiao et al. 2010), but these approaches typically do not aim to provide precise geolocations. IM2GPS (Hays and Efros 2008) sought to bridge the gap between scene recognition and geographic information by comparing features in a ground photo to a reference dataset of 6.4 million geolocated Flickr images and outputting a distribution of the most probable regions of the earth. They were able to localize at the country level 25% of the 237 photos in their test set, and the median error was less than 500 km. More recently, PlaNet (Weyand, Kostrikov, and Philbin 2016) trained a convolutional neural network on 126 mil-lion geotagged photos from the web. The system takes a photo as input and generates a probability for 26,000 cells in a grid covering the earth. The authors evaluated their approach by comparing PlaNet to 10 expert players of Ge-oguessr, a geolocation game. PlaNet won 28 of the 50 rounds, but neither PlaNet nor experts were able to localize beyond the city or street level, and median error was 1100–2300 km. Computer vision approaches like IM2GPS and PlaNet cannot yet consistently achieve the point-level specificity typically required for verification work, but may provide excellent starting points for expert geolocators. Other work in computer vision seeks to bridge the gap between satellite and ground level imagery. Ghouaiel and Lefèvre (2016) developed a technique to automatically translate ground photos into aerial perspectives, but the approach requires panoramic photos and overall translation accuracy was 54%. Zhai et al. (2016) trained a neural net-work to generate ground-level panoramas from satellite imagery. Their approach shows promise, but had limited effectiveness in handling high variability features like buildings. Unlike these approaches, we bootstrap an expert diagramming technique to translate between ground and satellite images. Combining elements from the above categories, Where-CNN (Lin et al. 2015) used cross-view pairs of ground-level and 45º aerial imagery to train a neural network to localize ground-level photos. Their approach narrowed the location estimate to 1% of the search area for 7–22% of query images (depending on the city). While 45º imagery
is not yet available in many areas, these automated results provide a point of comparison to our crowdsourced results.
Crowdsourcing Image Analysis Crowds have been used to perform a variety of standalone or human-in-the-loop visual recognition tasks, due to the impressive capabilities of the human vision system (Parikh and Zitnick 2011). Applications include everything from document transcription (Little et al. 2010), to identifying meal components for calorie counting (Noronha et al. 2011), to general-purpose photo analysis requested by us-ers with visual impairments (Bigham et al. 2010). Many of these applications rely on crowds to identify everyday objects, scenes, or locations that don’t require specialized knowledge. However, tools like scaffolding and computer vision have been used to help novice crowds analyze less familiar content, like graphic designs (Greenberg, Easterday, and Gerber 2015) or accessibility issues (Hara, Le, and Froehlich 2013). A rich source of examples comes from citizen science, where novice crowds are trained to recognize and categorize diverse nat-ural phenomena, such as animals, plants, microorganisms, and even galaxies (Lintott et al. 2008; Wiggins and Crowston 2014). Crowds have often been used for satellite image analy-sis, especially humanitarian efforts like locating missing persons or assessing damage from natural disasters (Meier 2015). Much of the literature in this area comes from the fields of photo interpretation and remote sensing. These researchers emphasize the importance of expertise and the challenges novices face in performing these tasks. For ex-ample, Zacks et al. (2000) found that “novices often cannot translate their own observations of the real world into more abstract representations of the larger-scale picture.” To address these challenges, researchers recommend partner-ships between experts and novices (Bianchetti and MacEachren 2015; Kerle and Hoffman 2013; Hoffman and Markman 2001), an idea we explore in this paper.
Expert Image Geolocation and Diagramming Many types of professionals perform image geolocation, including journalists, intelligence analysts, human rights activists, and private investigators. Of these, the practice of journalists, who often view geolocation as a subset of veri-fication and fact-checking activities, is perhaps best under-stood. Brandtzaeg et al. (2016) interviewed social media journalists to understand their verification practices includ-ing tools, processes, and limitations. While they do address location verification, they do not describe geolocation practices in detail. Kohler and Luther (2017) conducted an interview study with geolocation experts focusing on their motivations, process, and use of collaboration and crowdsourcing. The
99

experts’ process involves examining the context of the im-age, extracting any visual clues that can be researched online, and finally using satellite imagery to find a precise location. They emphasize the importance of drawing dia-grams as a tool for converting a ground-level photo into a more effective abstraction. One expert, describing a video geolocation, said he would “draw a bird’s eye perspective, or a satellite image perspective, of how I think it may look like from the air. So I can then compare it with satellite imagery just to get a better impression.” Another expert emphasized the difficulty of this mental translation: “Per-spective distortion can throw off a novice or a beginner really easily because things that you see from the air tend not to look how you would think they would from the ground.” These observations align with psychological re-search showing that people with high spatial ability use different cognitive strategies for mental rotation tasks (Just and Carpenter 1985). Building on these findings, this paper explores how diagramming can provide a common ground for novice crowds to support experts in image geolocation.
Journalists have also produced their own documentation of geolocation processes. The Verification Handbook (Barot 2014), an edited collection by practicing journalists, features chapters on image and video verification. Belling-cat, the online community for citizen investigative journal-ists, has published multiple guides to geolocating images and videos (Higgins 2014, 2015). Their emphasis on dia-gramming, crowdsourcing, and leveraging satellite image-ry aligns well with the goals of this research.
In the following two studies, we consider how this dia-gramming technique can be adapted for crowds who lack an expert geolocator’s spatial thinking skills. We first ex-plore how to create the diagram and what level of detail is most effective in Study 1. We then compare the diagram-ming technique to ground-level photos in Study 2.
Study 1: Diagram Detail
Research Questions For Study 1, we asked the following research questions: • RQ1a: How does diagram level of detail affect quality
in crowdsourced image geolocation? We hypothesize that low detail diagrams will provide too much abstrac-tion to differentiate the correct subregion from others, resulting in higher false positives and lower true posi-tives than medium or high detail diagrams.
• RQ1b: How does diagram level of detail affect prioriti-zation in crowdsourced image geolocation? We hy-pothesize that higher detail diagrams will lead to higher agreement, because there is less ambiguity and therefore better chances of participants reaching similar conclu-sions. This will result in better prioritization.
System Design We built a web-based system using a Django/Python framework, a PostgreSQL database, and the Google Maps API for satellite imagery and GIS functions. The main component of the system is the crowd inter-face (Fig. 1). The left side of the interface showed a dia-gram (in low, medium, or high detail, depending on condi-tion). The diagram was randomly rotated, and the user could rotate it clockwise or counterclockwise by clicking arrow buttons underneath it. It also showed a small Google Map in Map mode of the region with the 16-subregion grid overlaid in black lines.
Figure 1. The crowd interface.
The right side of the interface showed a Google Map in satellite mode of the region, divided by a translucent grid of white lines into a 4 4 grid of 16 equal-sized subregions. The user could zoom in and out, and toggle Map/Satellite mode, but was confined to that subregion. The user clicked a green Yes / Maybe button if it looked like a potential match, or a red No button if it did not, and then clicked Next. This advanced the participant to the next subregion, and marked in either red or green the corresponding subre-gion in the small map. The system advanced through the subregions in a Creeping Line search pattern, following best practices used in search and rescue (Wollan 2004). The decision to have workers evaluate more than one subregion per micro-task may seem surprising. However, we found in pilot studies that workers who saw only one subregion tended to perform poorly due to lack of context. The problem was exacerbated when distinctive features were cropped or located in corners. After experimenting with different-sized regions, we ultimately settled on a 4 4 grid as striking an effective balance of context and effort. The top of the interface showed remaining task time and a button to launch the tutorial. The bottom provided a text-box for participants to provide feedback on the task, and a Finish button.
100
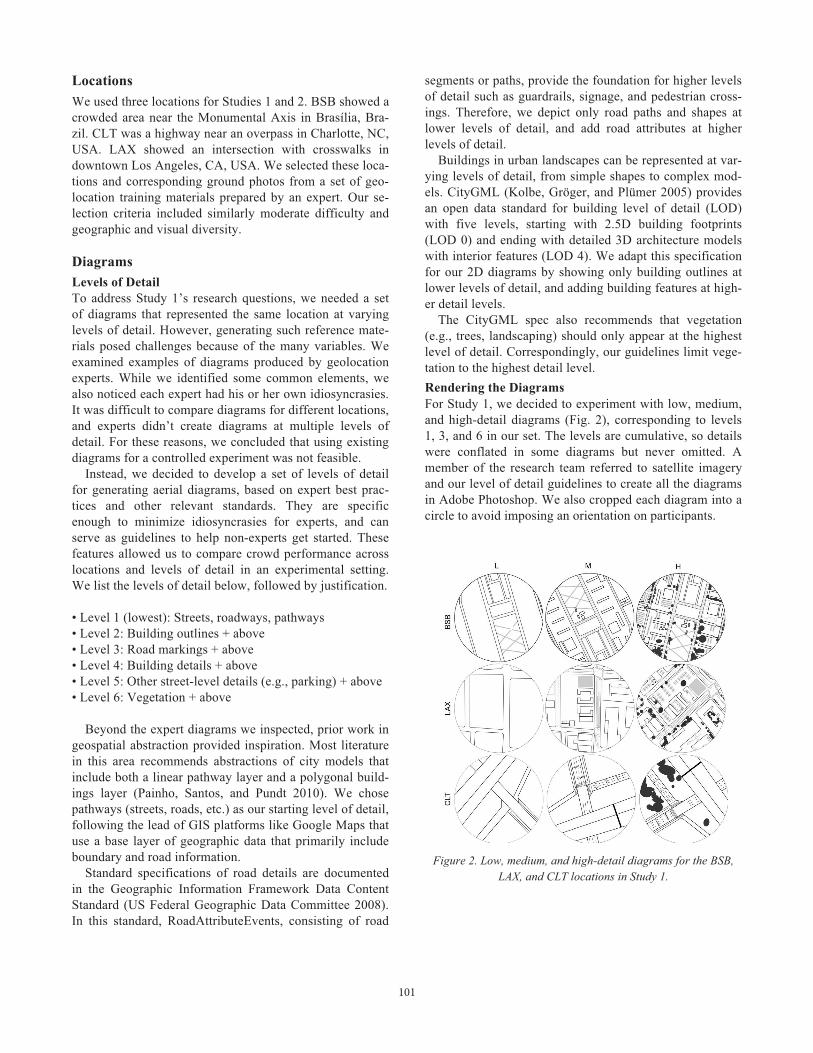
Locations We used three locations for Studies 1 and 2. BSB showed a crowded area near the Monumental Axis in Brasília, Bra-zil. CLT was a highway near an overpass in Charlotte, NC, USA. LAX showed an intersection with crosswalks in downtown Los Angeles, CA, USA. We selected these loca-tions and corresponding ground photos from a set of geo-location training materials prepared by an expert. Our se-lection criteria included similarly moderate difficulty and geographic and visual diversity.
Diagrams Levels of Detail To address Study 1’s research questions, we needed a set of diagrams that represented the same location at varying levels of detail. However, generating such reference mate-rials posed challenges because of the many variables. We examined examples of diagrams produced by geolocation experts. While we identified some common elements, we also noticed each expert had his or her own idiosyncrasies. It was difficult to compare diagrams for different locations, and experts didn’t create diagrams at multiple levels of detail. For these reasons, we concluded that using existing diagrams for a controlled experiment was not feasible. Instead, we decided to develop a set of levels of detail for generating aerial diagrams, based on expert best prac-tices and other relevant standards. They are specific enough to minimize idiosyncrasies for experts, and can serve as guidelines to help non-experts get started. These features allowed us to compare crowd performance across locations and levels of detail in an experimental setting. We list the levels of detail below, followed by justification. • Level 1 (lowest): Streets, roadways, pathways • Level 2: Building outlines + above • Level 3: Road markings + above • Level 4: Building details + above • Level 5: Other street-level details (e.g., parking) + above • Level 6: Vegetation + above Beyond the expert diagrams we inspected, prior work in geospatial abstraction provided inspiration. Most literature in this area recommends abstractions of city models that include both a linear pathway layer and a polygonal build-ings layer (Painho, Santos, and Pundt 2010). We chose pathways (streets, roads, etc.) as our starting level of detail, following the lead of GIS platforms like Google Maps that use a base layer of geographic data that primarily include boundary and road information. Standard specifications of road details are documented in the Geographic Information Framework Data Content Standard (US Federal Geographic Data Committee 2008). In this standard, RoadAttributeEvents, consisting of road
segments or paths, provide the foundation for higher levels of detail such as guardrails, signage, and pedestrian cross-ings. Therefore, we depict only road paths and shapes at lower levels of detail, and add road attributes at higher levels of detail. Buildings in urban landscapes can be represented at var-ying levels of detail, from simple shapes to complex mod-els. CityGML (Kolbe, Gröger, and Plümer 2005) provides an open data standard for building level of detail (LOD) with five levels, starting with 2.5D building footprints (LOD 0) and ending with detailed 3D architecture models with interior features (LOD 4). We adapt this specification for our 2D diagrams by showing only building outlines at lower levels of detail, and adding building features at high-er detail levels. The CityGML spec also recommends that vegetation (e.g., trees, landscaping) should only appear at the highest level of detail. Correspondingly, our guidelines limit vege-tation to the highest detail level. Rendering the Diagrams For Study 1, we decided to experiment with low, medium, and high-detail diagrams (Fig. 2), corresponding to levels 1, 3, and 6 in our set. The levels are cumulative, so details were conflated in some diagrams but never omitted. A member of the research team referred to satellite imagery and our level of detail guidelines to create all the diagrams in Adobe Photoshop. We also cropped each diagram into a circle to avoid imposing an orientation on participants.
Figure 2. Low, medium, and high-detail diagrams for the BSB, LAX, and CLT locations in Study 1.
101

Experiment Design Study 1 was a between-subjects experiment. The inde-pendent variable was diagram level of detail with three levels: low, medium, and high detail. Location depicted in the diagram was a co-variate with three levels: BSB, LAX, or CLT. Therefore, there were nine possible conditions. The dependent variables were the participant’s binary judgements on each of the 16 subregions. We recruited participants from Amazon Mechanical Turk (MTurk). We randomly assigned each worker to one of the nine conditions, and we assigned 60 workers to each condition, for a total of 540 workers. Pilots showed that workers took an average of five minutes to complete the task, so we paid $1.21 per task, reflecting minimum wage in our location for 10 minutes of work. We restricted the task to US-based workers but used no other qualifications. Task and Procedure Each participant accepted the HIT and completed an online consent form. The participant saw the crowd interface and completed a short, self-paced tutorial. The participant then proceeded to examine each of 16 subregions in the grid and mark it as Yes / Maybe or No. After completing all 16 judgements, the worker provided optional feedback on the HIT and submitted the task. This generated a unique code that the participant submitted to MTurk to receive pay-ment. Based on average completion times in pilot studies, we set the time limit at 10 minutes, to encourage fast re-sponses and minimize distraction. All tasks had exactly one correct subregion and 15 distractors. We took care to design the crowd task and interface to be as realistic as possible from the worker’s perspective. Workers didn’t know whether their region contained a cor-rect subregion, and received no feedback on their judge-ments. Therefore, the worker experience would be the same for real-world scenarios where it was unknown whether the region contained a correct subregion. Data Cleaning and Analysis We performed simple quality control by discarding tasks where workers provided all yes answers (16 yes judge-ments) and re-recruiting workers for those tasks. Aside from being a strong signal of low effort, an all-yes task does not provide any insight to prioritize the search space. We found in pilot studies that individual workers showed high variance in task performance. After experi-menting with different aggregation strategies (e.g., majori-ty vote, individual averages) and worker counts, we found that forming triads (groups of three workers) with a one-yes rule yielded the best results. The one-yes rule means that if at least one of the three workers judged a subregion to be a Yes / Maybe, then it would be categorized as a yes, while only a unanimous judgement of No across all three workers would be categorized as a no. We found that the one-yes rule is a good fit for our geolocation task, a type of
needle-in-the-haystack problem, where false negatives are much worse than false positives. As a convenient byprod-uct, the one-yes rule allows us to calculate worker agree-ment within the triad as a signal of confidence, which sup-ports expert prioritization. We randomly grouped the 60 workers for each condition into 20 triads per condition in the results that follow. Next, we compared each triad’s judgement to our gold standard to calculate true positives and false positives. We used these measures rather than the more traditional preci-sion and recall because, as mentioned above, geolocation is a needle-in-the-haystack problem. To calculate prioritization, we examined the set of sub-regions marked Yes / Maybe for each triad and identified the highest level of agreement (low, moderate, or high). If the correct subregion was among those with the highest agreement, the triad received a prioritization score of one; otherwise it got a zero. Since there are three levels of prior-itization, random chance would win 33.3% of the time. We performed all statistical analysis in R. Shapiro–Wilk tests showed that the dependent variables failed a normali-ty assumption (p < 0.001 for true positives, false positives, and prioritization). Therefore, we used Kruskal–Wallis tests as a non-parametric alternative to ANOVAs. We used Dunn’s tests to perform post-hoc analysis, with Bonferroni correction to adjust p-values for multiple comparisons.
Results Quality Overall, the crowd performed well in identifying the gold standard subregion across all conditions, but performed best with the medium-detail diagram (Fig. 3). The true positive rate (percentage of triads that marked the correct subregion as a Yes / Maybe) ranged from 91.7% (low and high detail) to 98.3% (medium detail). The effect of level of detail on true positives trended towards significance, 2(1) = 2.311, p = 0.129, but post-hoc tests showed no sig-
nificant differences.
Figure 3. True positives by level of detail for Study 1.
102

For false positives (mean percentage of incorrect subre-gions marked Yes / Maybe) a typical crowd triad narrowed down the search area by about half. Specifically, medium detail produced the fewest false positives (M = 42.3%) compared to low (M = 64.1%) and high (50.8%). However, the effect of level of detail was not significant, 2(15) = 10.49, p = 0.788.
The boxplot for false positives (Fig. 4) shows that low detail fared much worse than the other diagrams. The third quartile for low detail was 93.3%, so a worker triad with low detail had a 1 in 4 chance of returning almost all the subregions as false positives. In contrast, medium detail’s third quartile was 68.4%, and its median was just 33.3%.
Figure 4. Boxplot showing false positives by level of detail for Study 1.
PrioritizationThe agreement results for true positives show considerable variation. A single worker in each triad was responsible for marking the correct subregion anywhere from 5% to 75% of the time, depending on condition. Moderate and high agreement (two or three yes judgements) occurred 5–70% of the time, depending on condition.
There was low agreement for false positives across all conditions. Incorrect subregions are flagged by a single worker about 30–40% of the time in most conditions, and false positives show moderate or high agreement about 10–35% of the time.
Agreement was generally effective for prioritizing the subregions most likely to be true positives. Correct priori-tization of true positives ranged from 70.9% (low detail) to 81.4% (medium) to 85.5% (high). However, level of detail did not significantly affect prioritization, 2(1) = 0.232, p =0.630.
Discussion RQ1a asked how diagram detail would affect quality. We found that true positives were high (greater than 90%) for
all levels of detail, but medium diagrams performed the best, and this difference trended towards significance. The search space was reduced by about half across all levels of detail. Once again medium performed best, with 42.3% false positives, but the difference was not significant. Fur-ther, the boxplot showed that third quartile false positives for low detail were over 90%, compared to under 70% for medium detail, and a median of just 33%. RQ1b asked how diagram detail affected prioritization. There was considerable variation in agreement, with a sin-gle member of a triad marking the correct subregion any-where from 5–75% of the time. This result underscores the need for the one-yes rule for our problem type, where per-fect recall is key. More importantly, we also found that all diagram levels led to correct prioritization 70–85% of the time, a substantial improvement over the 33% of random chance, but level of detail was not a significant factor. Taken together, the above findings suggest that crowd triads can effectively reduce a search area by about half while maintaining near-perfect recall. We also saw that agreement within the triad can be used to double the chances of prioritizing the correct subregion. We also found evidence that the medium-detail diagram yields bet-ter results than low- or high-detail. Given these promising results, we conducted a second study to investigate how the medium-detail diagram compared to a ground-level photo in crowdsourced image geolocation.
Study 2: Reference Material
Research Questions For Study 2, we asked the following research questions: • RQ2a: How does reference material affect quality in
crowdsourced image geolocation? We hypothesize that the diagram will yield higher true positive rates because it distills the most important features, but it will also yield higher false positives because an abstraction can potentially match more areas due to lack of discriminat-ing details.
• RQ2b: How does reference material affect prioritiza-tion in crowdsourced image geolocation? We hypothe-size that agreement will be lower for the ground-level photo because spatial transformation is difficult for nov-ices, and prioritization will be correspondingly low.
System Design The system for Study 2 was largely similar to Study 1, with the exception of the reference material. In the aerial dia-gram-only condition, the interface looked identical to Study 1, with the diagram appearing with a random orien-tation in the top left. Buttons underneath the diagram al-lowed for clockwise or counterclockwise rotation. In the ground photo-only condition, the diagram and rotation
103

buttons were replaced with the ground photo. In the both condition, there was a toggle that allowed the user to switch between the diagram and the ground photo.
Locations and Diagrams The locations were the same as Study 1, to enable compar-isons and to replicate the effects of the medium-detail dia-gram. However, because Study 2 directly compared dia-grams to photos, we redacted the diagrams (Fig. 5) to show only the areas that were visible from the ground photo.
Figure 5. Ground-level photos and redacted aerial diagrams for Study 2.
Experiment Design Study 2 was a between-subjects experiment. The inde-pendent variable was reference material with three levels: diagram only, photo only, or both. Location was a co-variate with three levels: BSB, LAX, or CLT. Therefore, there were nine possible conditions.
The rest of the experiment design was identical to Study 1. We recruited 540 participants from Amazon Mechanical Turk and randomly assigned each worker to one of the nine conditions (60 workers per condition). Worker had the same payment and qualifications as above.
The task, procedure, and data cleaning and analysis were identical to Study 1.
Results Quality For true positives, the diagram-only condition performed best, with 98.3% of triads marking the correct subregion (Fig. 6). The both condition performed slightly less well with a 90% success rate. Ground photo-only trailed behind with 78.3% of triads finding the correct subregion. Refer-ence material had a significant effect on true positives, 2(1) = 4.111, p < 0.05. Post-hoc analysis showed that true
positives were significantly higher for diagram-only com-pared to ground photo-only, z = 3.476, p < 0.01. Likewise, the both condition performed marginally significantly bet-
ter than ground photo-only, z = 2.028, p = 0.128. There was no significant difference in true positives for the both condition vs. diagram-only, z = -1.448, p = 0.443.
Figure 6. True positives by reference material for Study 2.
For false positives (Fig. 7), the crowd generally reduced the search area by about half, regardless of reference mate-rial. Diagram-only produced slightly more false positives (M = 51.3%), followed by both (M = 48%) and then ground photo (47%), but the differences were not signifi-cant, 2(15) = 12.691, p = 0.626.
Figure 7. Boxplot of false positives by reference material for Study 2.
We conducted a follow-up analysis to understand how workers in the both condition used the reference material. We found that on average, these workers spent just 28% of their time with the diagram, compared to 72% of the time with the ground photo. This result is surprising, because although these workers spent less than a third of their time looking at the diagram, they still performed almost as well as the diagram-only workers. Prioritization As with Study 1, we did not observe many clear patterns in agreement. For true positives, high agreement (three yes judgements per triad) and low agreement (one yes judge-ment) both ranged from 0–70%. For false positives, we
104

saw low agreement for 30–50% of triads across conditions, with moderate or high agreement ranging from 0–30%. Prioritization of true positives using agreement was roughly double that of chance across all conditions, from 57.6% (diagram-only) to 70.2% (ground photo-only). The type of reference material did not significantly affect the prioritization, 2(1) = 0.465, p = 0.495.
Discussion RQ2a asked how the type of reference material—ground photo, aerial diagram, or both—affected the crowd’s quali-ty. We found that the diagram by itself results in signifi-cantly higher true positives compared to the ground photo by itself. The diagram allows crowds to achieve near-perfect performance (98.3% of triads found the correct subregion), whereas only 78.3% of triads found it in the ground photo-only condition. Our intuition is that experts would be less likely to trust a crowd that misses the target one out of every five times, so the ground photo by itself may not be a viable approach. False positives were around 50% for all conditions and reference material did not have a significant effect. This means that in all cases, the crowd reduced the search area by about half. More importantly, for the diagram-only con-dition, the search area was cut in half while still including the correct subregion 98.3% of the time. Further, the sig-nificance test showed that quality is not a zero-sum game: the diagram condition’s excellent true positives do not come at a cost of more false positives. RQ2b asked about how the reference material affected prioritization. We did not see clear patterns of agreement in true positives or false positives, which strengthens the case for our use of the one-yes rule. Agreement data allowed us to prioritize the correct subregions about twice as well as chance, regardless of the reference material used. The above results indicate that the aerial diagram yields a significant improvement in quality for crowdsourced image geolocation. When a triad of workers is shown just the ground-level photo, they miss the correct subregion one out of every five times. When the photo is replaced with an aerial diagram, crowds found the target 98.3% of the time, with no increase in false positives. Crowds reduce the search area by half, and we can use agreement data within a triad to double our chances of correctly prioritizing the correct subregion among the subset marked Yes / Maybe. Therefore, the evidence suggests that crowds provided with a diagram could substantially augment an expert’s image geolocation process.
Conclusion and Future Work Responsible investigation of social media requires rigorous verification to separate fact from fiction, including both
accidental and deliberate misinformation. Image geoloca-tion provides a mechanism for pursuing this truth, but it is an arduous task, requiring experts to notice multitudes of clues, gather and synthesize diverse online information, perform complex spatial transformations, and search large areas of satellite imagery for obscure details, all while un-der time pressure. This paper explored how crowdsourcing could support experts in a geolocation task. We contribute a new dia-gramming technique, adapted from expert practice, that can be used to help novice crowds more effectively ana-lyze satellite imagery. The levels of detail we articulate can also provide a starting point for non-experts to begin draw-ing, and not just using, these diagrams. We also contributed two large-scale crowdsourcing ex-periments demonstrating the value of our work. Study 1 showed the overall viability of our diagramming technique and provided evidence that that a medium-detail diagram yields the best quality and prioritization results. Study 2 extended these findings by showing that aerial diagrams are significantly better than ground-level photos in sup-porting crowdsourced satellite image analysis. As our study locations were all city-based, our results primarily speak to urban geolocation tasks. Our approach may also extend to rural areas, which share many task characteristics with geolocation of urban imagery, but also face some distinct challenges, such as scarcity vs. overa-bundance of image clues (Mehta, North, and Luther 2016). The approach presented here seeks to minimize expert intervention, but future work is needed to understand how best to integrate the crowd’s judgements into an expert’s workflow. Other opportunities involve leveraging comput-er vision tools to support crowds and experts, such as: • Context identification: Photos and videos on social me-
dia often have surrounding context suggesting a general location (e.g., a country or city name), but many do not. Systems like PlaNet could suggest high-probability sec-tors to narrow the search space for crowds.
• Diagram generation: Ground-to-aerial systems like Where-CNN could not only suggest potential location matches, but also extract distinctive features to help ex-perts build a diagram more quickly and accurately.
• Image comparison: Sketch recognition systems like Google’s Quick, Draw! could compare an expert dia-gram to satellite imagery and return potential matches.
More generally, we propose that hybrid pipelines or mixed-initiative systems composed of crowds, experts, and algorithms, each complementing the others with their re-spective strengths, offer the greatest potential to support complex image analysis and sensemaking. This paper of-fers a glimpse of these possibilities in demonstrating how
105

novice crowds can augment the work of experts in image geolocation and verification tasks.
Acknowledgements We thank the study participants, the anonymous reviewers, and members of the Crowd Lab. This research was funded in part by NSF awards 1527453 and 1651969.
References Barot, Trushar. 2014. “Verifying Images.” In Verification Hand-book: A Definitive Guide to Verifying Digital Content for Emer-gency Coverage. http://verificationhandbook.com/book/chapter4. php. Bianchetti, Raechel A., and Alan M. MacEachren. 2015. “Cogni-tive Themes Emerging from Air Photo Interpretation Texts Pub-lished to 1960.” ISPRS International Journal of Geo-Information 4 (2): 551–71. doi:10.3390/ijgi4020551. Bigham, Jeffrey P., Chandrika Jayant, Hanjie Ji, Greg Little, An-drew Miller, Robert C. Miller, Robin Miller, et al. 2010. “VizWiz: Nearly Real-Time Answers to Visual Questions.” In Proceedings of the 23Nd Annual ACM Symposium on User Inter-face Software and Technology, 333–342. UIST ’10. New York, NY, USA: ACM. doi:10.1145/1866029.1866080. Brandtzaeg, Petter Bae, Marika Lüders, Jochen Spangenberg, Linda Rath-Wiggins, and Asbjørn Følstad. 2016. “Emerging Journalistic Verification Practices Concerning Social Media.” Journalism Practice 10 (3): 323–42. doi:10.1080/17512786.2015. 1020331. Ghouaiel, Nehla, and Sébastien Lefèvre. 2016. “Coupling Ground-Level Panoramas and Aerial Imagery for Change Detec-tion.” Geo-Spatial Information Science 19 (3): 222–32. doi:10.1080/10095020.2016.1244998. Greenberg, Michael D., Matthew W. Easterday, and Elizabeth M. Gerber. 2015. “Critiki: A Scaffolded Approach to Gathering De-sign Feedback from Paid Crowdworkers.” In Proceedings of ACM Creativity & Cognition 2015. Glasgow, Scotland: ACM. Hara, Kotaro, Vicki Le, and Jon Froehlich. 2013. “Combining Crowdsourcing and Google Street View to Identify Street-Level Accessibility Problems.” In Proceedings of the SIGCHI Confer-ence on Human Factors in Computing Systems, 631–640. CHI ’13. New York, NY, USA: ACM. doi:10.1145/2470654.2470744. Hays, J., and A. A. Efros. 2008. “IM2GPS: Estimating Geograph-ic Information from a Single Image.” In 2008 IEEE Conference on Computer Vision and Pattern Recognition, 1–8. doi:10.1109/ CVPR.2008.4587784. Higgins, Eliot. 2014. “A Beginner’s Guide to Geolocating Vide-os.” Bellingcat. July 9. https://www.bellingcat.com/resources/ how-tos/2014/07/09/a-beginners-guide-to-geolocation/. ———. 2015. “Searching the Earth: Essential Geolocation Tools for Verification.” Bellingcat. July 25. https://www.bellingcat. com/resources/how-tos/2015/07/25/searching-the-earth-essential-geolocation-tools-for-verification/. Hoffman, Robert R., and Arthur B. Markman, eds. 2001. Inter-preting Remote Sensing Imagery: Human Factors. 1 edition. Bo-ca Raton, Fla: CRC Press.
Just, Marcel Adam, and Patricia A. Carpenter. 1985. “Cognitive Coordinate Systems: Accounts of Mental Rotation and Individual Differences in Spatial Ability.” Psychological Review 92 (2): 137–72. Kerle, N., and R. R. Hoffman. 2013. “Collaborative Damage Mapping for Emergency Response: The Role of Cognitive Sys-tems Engineering.” Nat. Hazards Earth Syst. Sci. 13 (1): 97–113. doi:10.5194/nhess-13-97-2013. Kohler, Rachel, and Kurt Luther. 2017. “Crowdsourced Image Geolocation as Collective Intelligence.” In Collective Intelligence 2017. New York, NY, USA. Kolbe, Thomas H., Gerhard Gröger, and Lutz Plümer. 2005. “CityGML: Interoperable Access to 3D City Models.” In Geo-Information for Disaster Management, edited by Professor Dr Peter van Oosterom, Dr Siyka Zlatanova, and Elfriede M. Fendel, 883–99. Springer Berlin Heidelberg. doi:10.1007/3-540-27468-5_63. Lin, Tsung-Yi, Yin Cui, Serge Belongie, and James Hays. 2015. “Learning Deep Representations for Ground-to-Aerial Geolocali-zation.” In Computer Vision and Pattern Recognition (CVPR). Boston, MA. http://vision.cornell.edu/se3/wp-content/uploads/ 2015/04/geocvpr15.pdf. Lintott, Chris J., Kevin Schawinski, An e Slosar, Kate Land, Steven Bamford, Daniel Thomas, M. Jordan Raddick, et al. 2008. “Galaxy Zoo: Morphologies Derived from Visual Inspection of Galaxies from the Sloan Digital Sky Survey.” Monthly Notices of the Royal Astronomical Society 389 (3): 1179–89. doi:10.1111/j.1365-2966.2008.13689.x. Little, Greg, Lydia B. Chilton, Max Goldman, and Robert C. Miller. 2010. “Exploring Iterative and Parallel Human Computa-tion Processes.” In Proceedings of the ACM SIGKDD Workshop on Human Computation, 68–76. HCOMP ’10. New York, NY, USA: ACM. doi:10.1145/1837885.1837907. Mehta, Sneha, Chris North, and Kurt Luther. 2016. “An Explora-tory Study of Human Performance in Image Geolocation Tasks.” In HCOMP 2016 GroupSight Workshop on Human Computation for Image and Video Analysis. Austin, TX, USA: AAAI. Meier, Patrick. 2015. Digital Humanitarians: How Big Data Is Changing the Face of Humanitarian Response. Null edition. Boca Raton, FL: Routledge. Noronha, Jon, Eric Hysen, Haoqi Zhang, and Krzysztof Z. Gajos. 2011. “Platemate: Crowdsourcing Nutritional Analysis from Food Photographs.” In Proceedings of the 24th Annual ACM Symposi-um on User Interface Software and Technology, 1–12. UIST ’11. New York, NY, USA: ACM. doi:10.1145/2047196.2047198. Painho, Marcos, Maribel Yasmina Santos, and Hardy Pundt, eds. 2010. Geospatial Thinking. Springer. http://www.springer.com/ us/book/9783642123252. Parikh, Devi, and C. Lawrence Zitnick. 2011. “Human-Debugging of Machines.” In . https://filebox.ece.vt.edu/~parikh/Publications/ParikhZitnick_CSS_NIPS2011_human_debugging.pdf. US Federal Geographic Data Committee. 2008. “Geographic Information Framework Data Content Standard — Federal Geo-graphic Data Committee.” https://www.fgdc.gov/standards/ pro-jects/framework-data-standard. Weyand, Tobias, Ilya Kostrikov, and James Philbin. 2016. “PlaNet - Photo Geolocation with Convolutional Neural Net-works.” ArXiv:1602.05314 [Cs], February. http://arxiv.org/ abs/1602.05314.
106

Wiggins, Andrea, and Kevin Crowston. 2014. “Surveying the Citizen Science Landscape.” First Monday 20 (1). http://firstmonday.org/ojs/index.php/fm/article/view/5520. Wollan, Helen. 2004. “Incorporating Heuristically Generated Search Patterns in Search and Rescue.” Master’s Thesis, Univer-sity of Edinburgh. https://pdfs.semanticscholar.org/a20f/ 5518053ab18c78dfcae58f53a8702c84b380.pdf. Xiao, J., J. Hays, K. A. Ehinger, A. Oliva, and A. Torralba. 2010. “SUN Database: Large-Scale Scene Recognition from Abbey to Zoo.” In 2010 IEEE Computer Society Conference on Computer Vision and Pattern Recognition, 3485–92. doi:10.1109/CVPR. 2010.5539970. Zacks, Jeffrey M., Jon Mires, Barbara Tversky, and Eliot Hazel-tine. 2000. “Mental Spatial Transformations of Objects and Per-spective.” Spatial Cognition and Computation 2 (4): 315–32. doi: 10.1023/A:1015584100204. Zhai, Menghua, Zachary Bessinger, Scott Workman, and Nathan Jacobs. 2016. “Predicting Ground-Level Scene Layout from Aer-ial Imagery.” ArXiv:1612.02709 [Cs], December. http://arxiv.org/ abs/1612.02709.
107