supporting effective interaction with tabletop groupware · i supporting effective interaction with...
TRANSCRIPT

i
SUPPORTING EFFECTIVE INTERACTION WITH TABLETOP GROUPWARE
A DISSERTATION
SUBMITTED TO THE DEPARTMENT OF COMPUTER SCIENCE
AND THE COMMITTEE ON GRADUATE STUDIES
OF STANFORD UNIVERSITY
IN PARTIAL FULFILLMENT OF THE REQUIREMENTS
FOR THE DEGREE OF
DOCTOR OF PHILOSOPHY
Meredith June Morris
April 2006

ii
© Copyright by Meredith Morris 2006
All Rights Reserved

iii
I certify that I have read this dissertation and that, in my opinion, it is fully adequate in scope and quality as a dissertation for the degree of Doctor of Philosophy. _________________________________ (Terry Winograd) Principal Advisor I certify that I have read this dissertation and that, in my opinion, it is fully adequate in scope and quality as a dissertation for the degree of Doctor of Philosophy. _________________________________ (Scott Klemmer) I certify that I have read this dissertation and that, in my opinion, it is fully adequate in scope and quality as a dissertation for the degree of Doctor of Philosophy. _________________________________ (Andreas Paepcke) Approved for the University Committee on Graduate Studies.

iv
Abstract
We encounter tables in a variety of situations in our everyday lives – at work, at
school, at home, and in restaurants, libraries, and other public venues. The ubiquity of
this furniture results from the utility of its affordances: tables’ horizontal surfaces
afford the placement of objects, and their large surface area affords the spreading,
piling, and organization of these items; chairs afford sitting and relaxing, making work
around tables leisurely and comfortable; and, perhaps most importantly, tables afford
face-to-face collaboration amongst a small group of co-located individuals.
Enhancing traditional tables by adding computational functionality combines
the collaborative and organizational benefits of horizontal surfaces, as well as their
ability to hold tangible interaction objects, with the power and adaptability of digital
technology, including the ability to archive, search, and share digital documents and
the ability to quickly access related information. Combining the productivity benefits
of computing with the social benefits of around-the-table interaction has value for
many commonplace activities, such as business, education, and entertainment. The
recent introduction of hardware that detects touch input from multiple, simultaneous
users has made computationally-augmented tables, or “interactive tables,” practical.
This dissertation contributes a sequence of novel prototypes that explore the
properties of group interaction with interactive tables. It presents the results of user
experiments on the ways people share information and control in the unique setting of
interactive face-to-face shared computer use. On the basis of these it proposes design
principles that will produce tabletop groupware that better facilitates human-computer
interaction and cooperative processes. These principles relate to appropriate uses for

v
different regions of the table’s surface, techniques for reducing visual clutter, the
utility and visibility of access permissions for virtual objects, methods for influencing
users’ social interactions via tabletop interface design, consideration of how tabletop
interface design influences and facilitates different work styles, and appropriate
usability metrics for evaluating this class of software.
Considering tabletop design holistically, including both the human-computer
and human-human interactions that take place during tabletop activities, can lead to
the development of more usable and useful tabletop groupware.

vi
Acknowledgments
I’d like to thank my advisor, Terry Winograd, not only for his guidance during my five
years at Stanford, but for kick-starting my academic career by giving me a research
internship when I was a random undergraduate from Brown who emailed to ask for a
summer job in his lab. I’d also like to thank Andreas Paepcke, with whom I’ve
enjoyed weekly discussions about research and life, and Scott Klemmer, who has
brought new energy into the HCI group.
I’m also grateful to Andy van Dam, whose introductory programming course
at Brown University inspired me to pursue computer science and whose advice and
encouragement motivated me to apply to graduate school. I’d also like to acknowledge
the Pennsylvania Governor’s School for the Sciences, which provided my first
exposure to computer programming, giving me the confidence to sign up for CS15
when I arrived at Brown.
Generous financial support from a National Science Foundation Graduate
Fellowship and from the AT&T Labs Fellowship Program helped smooth the way to
my Ph.D. I’d especially like to thank ALFP mentors Julia Hirschberg and Brian
Amento, and also Liz Loia, the ALFP administrator, who gracefully responded to
email bombardments. I’d also like to thank Mitsubishi Electric Research Labs, who
generously donated three DiamondTouch tables to our lab. My internship at MERL,
and subsequent collaborations with Chia Shen, Kathy Ryall, and Cliff Forlines, helped
inspire the work described in this dissertation.
Without a great support staff, no students would ever finish their Ph.D.’s – I’d
especially like to thank Heather Gentner and Ada Glucksman for handling my ten

vii
zillion reimbursement requests and for their holiday-decorating enthusiasm. John
Gerth’s help in keeping the labs computers hacker- and virus-free, and Kathi
DiTomasso’s help (and chocolate) in the grad affairs office have also been
indispensable.
The Graphics Lab has been a fun, supportive, and pleasantly distracting work
environment. I’d especially like to thank the Cookie Office and the Gslackers (Dave
Akers, Mike Cammarano, Billy Chen, Jim Chow, Kayvon Fatahalion, Gaurav Garg,
Daniel Horn, Mike Houston, Neel Joshi, Jeff Klingner, Ren Ng, Doantam Phan,
Augusto Roman, Rachel Weinstein, Bennett Wilburn, and Ron Yeh). I’d also like to
thank Thai-café aficionados T.J. Giuli, Sergio Marti, and Beverly Yang, who made
lunch more fun and proved that graduation is possible.
The HCI group (and alums) were the people I worked with most closely. I’m
fortunate to have had such a talented group of people to collaborate and debate with:
Tico Ballagas, Jan Borchers, Karen Grant, Bjoern Hartmann, Wendy Ju, Manu Kumar,
Brian Lee, Heidy Maldonado, Dan Maynes-Aminzade, Doantam Phan, Anne Marie
Piper, Maureen Stone, Josh Tyler, and Ron Yeh. I’d especially like to thank my
officemates, Ron and Monzy, who have graciously tolerated my usurpation of floor
space for the DiamondTouch table, and the ultra-girliness of my “cute puppy” office-
decoration scheme. Monzy’s mechanical talent was key in mounting the
DiamondTouch projectors from the ceiling of our office and the iRoom.
I’d like to thank my parents, Gloria and Emanuel Ringel, and my siblings,
Amy and Ben, who supported my choice to pursue my Ph.D. at Stanford, even though
it’s a long way from Fort Washington, PA. I’d also like to thank fellow Fort
Washingtonians, Xin Hu (MIT, Electrical Engineering) and Andy Bressler (Penn,
Math), who understand the grad student experience firsthand, and don’t mind making
long-distance phone calls to chat about it.
Most of all, I’d like to thank my husband, Dan Morris, whose companionship
has made the journey from Miss to Mrs. to Dr. an enjoyable one.
viii
Contents
Abstract ..............................................................................................................iv
Acknowledgments..............................................................................................vi
1 Introduction .............................................................................................1
1.1 Contributions ..........................................................................................3
1.2 Dissertation Roadmap ............................................................................5
2 Related Work...........................................................................................7
2.1 Single Display Groupware .....................................................................7
2.2 Traditional Tabletop Work Practices......................................................8
2.3 Interactive Table Technologies and Interactions....................................9
2.3.1 Standard Technology for Systems in this Dissertation.............12
3 Integrating Public and Private Information.......................................13
3.1 Fluid Techniques for Document Sharing .............................................14
3.1.1 Fluid Document Sharing Techniques .......................................15
3.1.1.1 Release.......................................................................16
3.1.1.2 Relocate .....................................................................16
3.1.1.3 Reorient .....................................................................17
3.1.1.4 Resize ........................................................................18
3.1.2 Evaluation.................................................................................19
3.1.3 Method......................................................................................19
3.1.3.1 Participants ................................................................19
3.1.3.2 Setup ..........................................................................19
3.1.3.3 Procedure...................................................................20
3.1.3.4 Questionnaire.............................................................20

ix
3.1.4 Results ......................................................................................20
3.1.5 Fluid Techniques for Document Sharing: Conclusions............23
3.2 Individual Audio with Single Display Groupware...............................24
3.2.1 System Hardware......................................................................25
3.2.2 System Software.......................................................................26
3.2.2.1 Sound API .................................................................26
3.2.2.2 SoundTracker ............................................................27
3.2.2.3 Song Objects..............................................................28
3.2.2.4 Scene Objects ............................................................29
3.2.3 User Study ................................................................................30
3.2.3.1 Participants ................................................................30
3.2.3.2 Measures....................................................................30
3.2.3.3 Procedure...................................................................31
3.2.4 Results ......................................................................................35
3.2.4.1 Task Strategies...........................................................35
3.2.4.2 Communication .........................................................39
3.2.4.3 Productivity ...............................................................42
3.2.4.4 Overall Usability .......................................................43
3.2.4.5 Tabletop Use..............................................................43
3.2.5 Discussion.................................................................................44
3.2.6 Related Work............................................................................46
3.2.6.1 Visual Privacyware....................................................46
3.2.6.2 Audio Privacyware ....................................................47
3.2.6.3 Audio and Ambient Awareness.................................48
3.2.7 Individual Audio with Single Display Groupware: Conclusion
49
3.2.8 Discussion: Quantifying Collaboration ....................................49
3.3 Integration with Auxiliary Devices ......................................................54
4 Managing Display Elements.................................................................59
4.1 Centralized versus Replicated Controls................................................60

x
4.1.1 The TeamTag System...............................................................61
4.1.1.1 Motivation .................................................................61
4.1.1.2 Infrastructure .............................................................63
4.1.1.3 Two Candidate Interface Designs .............................63
4.1.1.4 Design Considerations...............................................66
4.1.2 Evaluation.................................................................................68
4.1.3 Results ......................................................................................70
4.1.3.1 Preferred Interface .....................................................70
4.1.3.2 Collaboration .............................................................70
4.1.3.3 Co-Touching..............................................................72
4.1.3.4 Orientation of Information ........................................73
4.1.3.5 Table Regions............................................................74
4.1.3.6 General Usability.......................................................75
4.1.4 Discussion.................................................................................75
4.1.4.1 Design Guidelines: Control Replication....................78
4.1.4.2 Design Guidelines: Control Location........................79
4.1.5 Related Work............................................................................79
4.1.6 Centralized versus Replicated Controls: Conclusion ...............81
4.2 Techniques for Co-Present Collaborative Search.................................82
4.2.1 Related Work............................................................................83
4.2.2 The TeamSearch System ..........................................................84
4.2.3 Evaluation.................................................................................90
4.2.4 Results ......................................................................................91
4.2.4.1 Quality .......................................................................91
4.2.4.2 Efficiency ..................................................................92
4.2.4.3 Collaboration .............................................................93
4.2.4.4 Satisfaction ................................................................95
4.2.5 Discussion.................................................................................95
4.2.6 Techniques for Co-Present Collaborative Search: Conclusion 98
4.3 Multi-Modality for Clutter Reduction ..................................................99

xi
4.3.1 Private Audio for Captions.......................................................99
4.3.2 Private Audio for Progressive Assistance ..............................101
4.3.3 Private Audio for Role Specific Information .........................101
4.3.4 Multi-Modality for Clutter Reduction: Conclusion................102
4.4 Drawers...............................................................................................102
4.4.1 Drawers: Informal Evaluation ................................................105
4.5 Challenges of Tabletop Peripheral Displays ......................................107
4.5.1 Tables as Ambient Displays: Motivations..............................108
4.5.2 The AmbienTable...................................................................109
4.5.3 Challenges and Design Guidelines.........................................112
4.5.4 Tabletop Peripheral Displays: Conclusion .............................114
4.6 Cooperative Efforts with MERL ........................................................114
4.6.1 Impact of Group Size and Table Size.....................................115
4.6.2 Observations of Tabletop Use “In the Wild” .........................116
4.6.3 iDwidgets: Identity-Differentiating Widgets..........................116
4.6.4 DiamondSpin Tabletop Interface Toolkit...............................117
5 Mediating Group Dynamics...............................................................118
5.1 Multi-User Coordination Policies.......................................................119
3.1.1 Survey of User Expectations ..................................................119
3.1.1.1 Survey 1 – Paper Documents ..................................120
3.1.1.2 Survey 2 - Digital Documents .................................121
3.1.1.3 Discussion................................................................121
5.1.2 Coordination Policies: Motivation .........................................124
5.1.3 Design Considerations............................................................126
5.1.4 Global Coordination Policies .................................................129
5.1.5 Whole-Element Coordination Policies ...................................131
5.1.6 Application Scenarios.............................................................134
5.1.7 Multi-User Coordination Policies: Conclusion ......................136
5.2 Supporting Cooperative Language Learning......................................138
5.2.1 Related Work..........................................................................139

xii
5.2.2 System Description.................................................................140
5.2.3 Design Variations ...................................................................145
5.2.4 Evaluation...............................................................................149
5.2.4.1 Context 1 – Controlled Lab Setting.........................150
5.2.4.2 Context 2 – Authentic Classroom Use ....................150
5.2.5 Findings ..................................................................................151
5.2.5.1 Visual vs. Audio Feedback......................................151
5.2.5.2 Public vs. Private Feedback.....................................152
5.2.5.3 Piles vs. Centered ....................................................154
5.2.5.4 Interaction Visualizations ........................................155
5.2.5.5 General Observations ..............................................156
5.3.6 Discussion...............................................................................156
5.3.6.1 Methodological Limitations ....................................157
5.3.6.2 Feedback from Foreign Language Instructors.........158
5.3.7 Supporting Cooperative Language Learning: Conclusion .....159
5.3 Cooperative Gestures..........................................................................159
5.3.1 Implementation: CollabDraw .................................................162
5.3.2 Evaluation...............................................................................171
5.3.2.1 Results .....................................................................172
5.3.3 Discussion...............................................................................176
5.3.3.1 Lessons Learned ......................................................176
5.3.3.2 Design Space ...........................................................178
5.3.3.3 Future Work.............................................................181
5.3.4 Related Work..........................................................................182
5.3.5 Cooperative Gestures: Conclusion .........................................183
5.4 SIDES .................................................................................................184
5.4.1 Related Work..........................................................................185
5.4.2 Design Process........................................................................186
5.4.2.1 Design Goals ...........................................................187
5.4.2.2 Game Design ...........................................................187

xiii
5.4.2.3 DiamondTouch Implementation..............................188
5.4.3 Evaluation...............................................................................189
5.4.3.1 Play Testing Session 1.............................................189
5.4.3.2 Findings (Session 1) ................................................191
5.4.3.3 Prototype Iteration ...................................................193
5.4.3.4 Play Testing Session 2.............................................194
5.4.3.5 Findings (Session 2) ................................................196
5.4.4 Discussion...............................................................................201
5.4.5 SIDES: Conclusion.................................................................204
6 Conclusions and Future Work...........................................................205
6.1 Design Guidelines for Interactive Tables ...........................................206
6.1.1 Table Regions.........................................................................206
6.1.2 Clutter Reduction....................................................................207
6.1.3 Access Permissions ................................................................207
6.1.4 Group Dynamics.....................................................................208
6.1.5 Work Styles ............................................................................208
6.1.6 Usability Metrics ....................................................................209
6.2 Limitations..........................................................................................209
6.3 Future Work........................................................................................211
6.4 Closing Remarks ................................................................................212
Bibliography ...................................................................................................213
xiv
List of Tables
Table 1: Error rates when using the “relocate” and “resize” techniques......................21
Table 2: Subjects’ average rank of ease of use for each technique. .............................22
Table 3: Subjects’ average agreement with the statements. .........................................22
Table 4: Mean responses to the Likert-scale questions completed by participants......39
Table 5: Collective tokens received higher ratings regarding collaboration. ...............95
Table 6: Coordination policies, grouped by conflict type and initiative. ...................129
Table 7: CollabDraw’s cooperative gestures, classified.............................................178
Table 8: Categories for Conversation/Behavior Analysis ..........................................197

xv
List of Illustrations
Figure 1: Traditional and interactive tables....................................................................1
Figure 2: The “release” technique for sharing..............................................................16
Figure 3: The “relocate” technique for sharing. ...........................................................17
Figure 4: The “reorient” technique for sharing. ...........................................................18
Figure 5: The “resize” technique for sharing. ..............................................................18
Figure 6: The “relocate” technique was significantly faster. .......................................21
Figure 7: Users can receive private information over their individual earbuds. ..........26
Figure 8: Song objects in SoundTracker.. ....................................................................28
Figure 9: Scene objects in SoundTracker. ....................................................................30
Figure 10: The initial layout of the table in each condition. ........................................32
Figure 11: A typical example of the table’s layout partway through the study.. .........33
Figure 12: A typical table configuration near the end of the study.. ............................34
Figure 13: Table dominance scores. .............................................................................36
Figure 14: Song replacement actions. ..........................................................................37
Figure 15: Time spent talking in each condition. .........................................................41
Figure 16: Analytical division of the table into “local areas” for each user.................44
Figure 17: The user has transferred content from her PDA to the table.......................55
Figure 18: The PDA interface for Multi-User Piles Across Space.. ............................56
Figure 19: Screenshot of the tabletop display with annotations superimposed............56
Figure 20: Four users at a DiamondTouch table label photos using TeamTag............61
Figure 21: Centralized controls version of the TeamTag interface. .............................64
Figure 22: Replicated controls variation of the TeamTag interface.............................66
Figure 23: The majority of participants preferred the replicated-controls interface. ...70

xvi
Figure 24: A four-person group uses TeamSearch.......................................................83
Figure 25: The starting configuration of TeamSearch .................................................85
Figure 26: TeamSearch with collective query tokens. .................................................88
Figure 27: TeamSearch with parallel query tokens. .....................................................89
Figure 28: Photo from the AudioNotes system. .........................................................100
Figure 29: Flashcards in an educational tabletop application. ...................................101
Figure 30: The Drawers system. ................................................................................104
Figure 31: The AmbienTable in the Stanford iRoom.................................................110
Figure 32: The iRoom activity visualization. ............................................................113
Figure 33: Voting coordination policy. ......................................................................130
Figure 34: Duplicate coordination policy...................................................................131
Figure 35: Personalized Views coordination policy...................................................132
Figure 36: Tear coordination policy. ..........................................................................132
Figure 37: Explicit coordination policy......................................................................134
Figure 38: Four students using the MatchingTable software. ....................................138
Figure 39: The ClassificationTable at the beginning of a task. ..................................141
Figure 40: The ClassificationTable application.. .......................................................142
Figure 41: The MatchingTable appliation.. ................................................................143
Figure 42: The PoetryTable application. ....................................................................144
Figure 43: Interaction Visualizations.. .......................................................................149
Figure 44: The “partner” and “modify ink” gestures.. ...............................................164
Figure 45: The “clear screen” gesture. .......................................................................165
Figure 46: The “throw-and-receive” and “pull” gestures...........................................166
Figure 47: The “combine” gesture. ............................................................................167
Figure 48: The “enlarge” gesture ...............................................................................167
Figure 49: The “neaten” gesture.................................................................................168
Figure 50: The “exchange” gesture. ...........................................................................169
Figure 51: The “animate photo” gesture. ...................................................................170
Figure 52: The “exit” gesture. ....................................................................................170
Figure 53: Subjects had to recreate this drawing using CollabDraw. ........................172
xvii
Figure 54: SIDES interface components. ...................................................................188
Figure 55: Four students playing SIDES during Play Testing Session 1. ..................190
Figure 56: SIDES “turn taking” buttons.....................................................................195
Figure 57: Positive, aggressive, and non-responsive behaviors for Group 1. ............198
Figure 58: Positive, aggressive, and non-responsive behaviors for Group 2. ............198

1
1 Introduction
(a) (b)
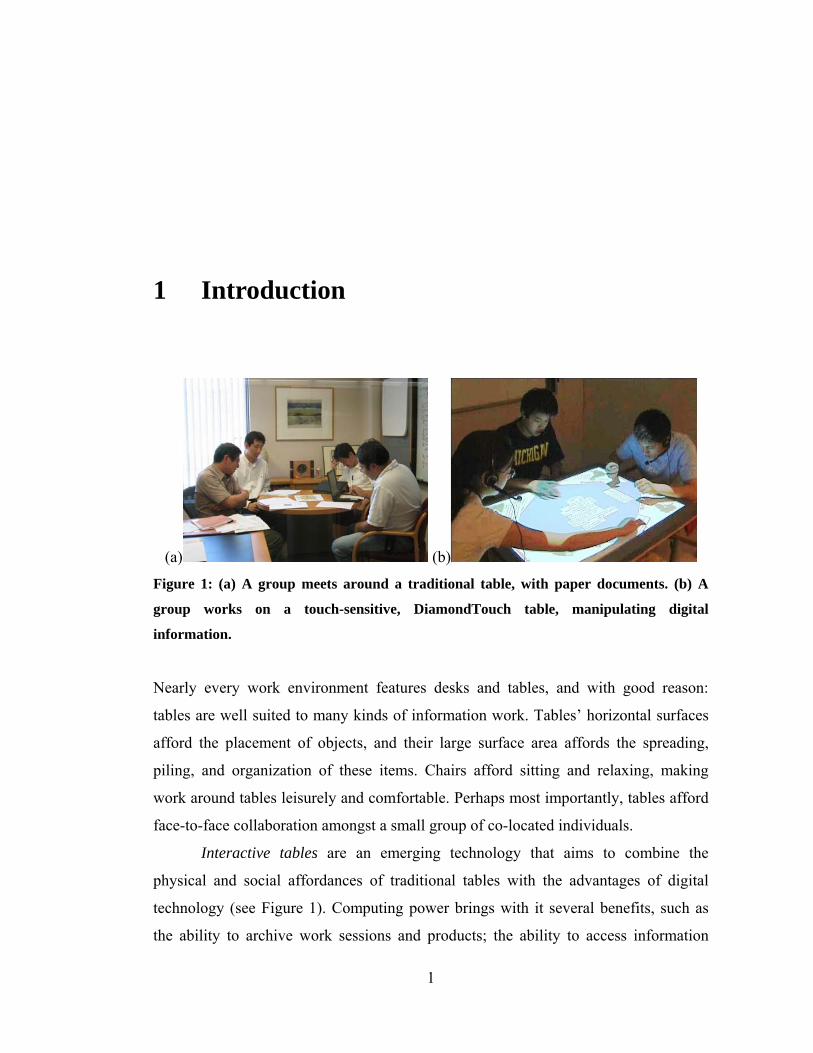
Figure 1: (a) A group meets around a traditional table, with paper documents. (b) A
group works on a touch-sensitive, DiamondTouch table, manipulating digital
information.
Nearly every work environment features desks and tables, and with good reason:
tables are well suited to many kinds of information work. Tables’ horizontal surfaces
afford the placement of objects, and their large surface area affords the spreading,
piling, and organization of these items. Chairs afford sitting and relaxing, making
work around tables leisurely and comfortable. Perhaps most importantly, tables afford
face-to-face collaboration amongst a small group of co-located individuals.
Interactive tables are an emerging technology that aims to combine the
physical and social affordances of traditional tables with the advantages of digital
technology (see Figure 1). Computing power brings with it several benefits, such as
the ability to archive work sessions and products; the ability to access information

2
from external sources via connections to the Internet or local digital libraries; the
ability to quickly search through a set of documents to find a desired item; the ability
to conveniently export and share work products with others; and, of course, the ability
to use interactive computing applications and simulations.
In the past decade, computing has moved beyond the desktop-PC model and
into a variety of small (e.g., cell phones, PDAs) and large (e.g., walls, tables) form-
factors, as technology continues to move toward Mark Weiser’s vision of ubiquitous
computing [173]. These new form factors afford different work practices than
traditional PCs, and consequently require different user interfaces to support these
work practices. For example, software designed for traditional PCs is intended for use
by a single person at a time, using a mouse and keyboard, and viewing the display
from a single, pre-determined angle. Interactive tables, however, have an entirely
different usage model that makes traditional software designs inappropriate, because
these devices are intended for simultaneous use by co-located teams, interaction is
often by direct-touch or stylus, and the horizontal form-factor has no canonical
viewing angle.
Interactive tables are a form of single display groupware (SDG) [150]. Most
prior research on designing software for SDG has focused on large, interactive
whiteboard-style displays, such as the Interactive Mural [49] and Designer’s Outpost
[69]. Around-the-table collaboration has different properties than collaboration around
vertical displays, and merits exploration as a design space with distinct issues. For
example, shoulder-to-shoulder work at vertical displays tends to promote a single
leader who controls most of the interaction, while face-to-face work around tables
results in more turn-taking and participation from all group members [121]. As a
consequence of this increased parallelism, certain design issues rise in prominence.
This thesis explores the issue of interface design for interactive tables. Through
observation and experimentation, we observe the properties of group interaction with
these devices, and offer a series of interaction techniques and user interface designs
appropriate for the needs of this unique form-factor. The emergence of several
hardware platforms supporting tabletop computing over the past five years (e.g.,
3
DiamondTouch [31], DViT [145], LumiSight [84], and SmartSkin [114]) suggests that
the design questions and solutions addressed by this dissertation will have broad
impact as these devices begin to move from research labs into the commercial sphere.
This work addresses three key design challenges of interactive tables. First,
when people work around traditional tables, they often bring sources of personal or
private information, such as paper notebooks or laptops, which they periodically
consult during the group activity. Providing affordances for sources of private,
personal, or customized content in the context of a shared tabletop display is important
for allowing transference of these traditional work practices, and for allowing for both
tightly-coupled and loosely-coupled group work. Second, the arrangement of
information on a shared tabletop display is challenging for several reasons. The lack of
a canonical viewing angle makes handling orientation of items on the tables surface a
table-specific issue. Reducing the visual clutter that results from displaying enough
content to be of interest to several users on a single, shared surface is also key to table
UI design. Third, one of the primary reasons people perform tasks at tables is because
of the social affordances they provide. Consequently, when designing next-generation
interactive table technology, considering the impact of this technology on group
dynamics is a key issue (and vice-versa – the impact of group dynamics on the use of
the technology likewise has important bearing on interactive table design).
Combining the productivity benefits of computing with the social benefits of
around-the-table interaction has applications in business, education, and entertainment.
We have explored the properties of group interaction with interactive tables and their
associated design challenges by building and evaluating a series of novel prototypes.
In the following sections, we discuss in detail systems and studies that address the
challenges of integrating access to public and private information, managing display
elements, and mediating group dynamics.
1.1 Contributions
This dissertation presents a series of novel prototypes we built and experiments we
conducted as a basis for the formulation of design guidelines for improving the

4
usability and utility of interactive tables. The major contributions presented in this
thesis are:
Novel interaction techniques for tabletop systems: We introduce several
novel interaction techniques for tabletop user interfaces. These techniques include the
release, relocate, reorient, and resize gestures for interactively altering document
access permissions; multi-user coordination policies for preventing and reacting to
breakdowns in social protocols regarding application-level and document-level
conflicts; individually-targeted audio as a means of supplementing a shared tabletop
display with sources of private, customized, and/or orientation-independent
information; and cooperative gestures for encouraging participation, mediating
reachability, implicit access control, and increasing awareness of potentially disruptive
application actions.
Comparisons of interface design choices for tabletop UIs: We present the
results of user experiments comparing alternative user interface designs for tabletop
displays. These evaluations include a comparison of the tradeoffs involved in choosing
a centralized vs. replicated widget layout; interpreting user inputs collectively vs. in
parallel; and evaluating the impact on participation equity of feedback privacy,
feedback modality, spatial layout, and interaction visualizations.
Design guidelines for tabletop groupware: Based on our experiences in
designing, implementing, and evaluating interactive tables, we identify key design
challenges for supporting effective interaction with tabletop groupware. We formulate
design guidelines relating to these challenge areas, including appropriate uses for
different regions of the table’s surface, techniques for reducing visual clutter, the
utility and visibility of access permissions for virtual objects, methods for influencing
users’ social interactions via tabletop interface design, consideration of how tabletop
interface design influences and facilitates different work styles, and appropriate
usability metrics for evaluating this class of software. Additionally, we identify
application domain areas, including education, bio-diversity research, information
search, and ambient displays, which take advantage of the affordances of tabletop
technologies.

5
1.2 Dissertation Roadmap
The remainder of this dissertation is organized as follows:
In Chapter 2, we discuss related literature, including work on single display
groupware, social science investigations of the use of table and wall displays,
hardware support for interactive tables, and other projects exploring software design
and interaction techniques for tabletop displays.
Chapters 3, 4, and 5 explore three key challenges in tabletop groupware
design: integrating public and private information, managing display elements, and
mediating group dynamics. Each of these chapters presents prototype systems that
explore and evaluate interaction designs that address these issues.
Chapter 3, on integrating public and private information, describes three
interaction techniques related to this challenge: techniques for transitioning documents
between states of public and private accessibility, a system for supplementing a shared
tabletop with individually-targeted audio information, and a technique for transferring
piles of documents between personal digital assistants and a tabletop display.
Chapter 4, on managing display elements, explores issues related to the
orientation and placement of objects on the tabletop, as well as to the reduction of
visual clutter. Topics covered include comparing centralized versus replicated widget
layouts, collective or parallel interpretations of group inputs, and techniques for
reducing clutter on the shared display by offloading content to audio channels or to
virtual “drawers.”
Chapter 5, on mediating group dynamics, explores the impact of tabletop user
interface design on social dynamics (and vice-versa – the impact of group dynamics
on the use of the technology). This chapter discusses multi-user coordination policies
for mediating the impact of social protocol violations, modifications to educational
software to reduce free-riders, and cooperative gesturing interaction techniques.
In Chapter 6, we distill the lessons learned from building and evaluating the
systems described in chapters 3 to 5 into a set of design guidelines and considerations
to inform the design of next-generation interactive table systems. We summarize the

6
contributions and limitations of this dissertation work, and discuss areas for further
exploration.

7
2 Related Work
This chapter provides an overview of work related to interactive tables. Additionally,
more detailed discussions of related work are included with the project descriptions
within Chapters 3 to 5. These local descriptions describe the ways in which related
literature specifically connects to each of our systems and experiments, as well as
mentioning specific sub-categories of literature (e.g., on search, photo-labeling, or
gesture) that is not broadly applicable to the general topic of interactive tables.
Prior work related to interactive tables falls into three main categories: research
on single-display groupware; social-science studies on the use of traditional tables;
and efforts in advancing the state of the art in tabletop hardware, software, and user
interface design. This chapter gives highlights of related literature in each of those
three categories; additionally, project-specific discussions in Chapters 3 to 5 provide
more detailed discussions and extensive examples of related work in these core areas.
2.1 Single Display Groupware
Single Display Groupware (SDG) refers to systems where a group of co-located users
shares a single, typically large, display [150]. SDG supports collaboration by
providing group members with a shared context. However, the design of SDG
involves challenges. For instance, in their initial description of SDG Stewart et al. note
that “new conflicts and frustrations may arise between users when they attempt
simultaneous incompatible actions.” The tightly-coupled navigation aspects of SDG
give rise to one class of these difficulties – what one user views, all must view. Single

8
Display Privacyware [141] is one proposed solution to this difficulty, allowing users
to view private information in combination with the shared display either by viewing
alternating-frame overlays in specialized goggles, such as in Agrawala et al.’s [2] or
Shoemaker and Inkpen’s [141] systems, or by combining an auxiliary display, such as
a PDA (personal digital assistant), with the shared screen, as in the Pebbles system
[100]. Besides the difficulty of group members all viewing the same output on the
shared display, requiring them to effectively coordinate their interactions can be
challenging. Groupware systems tend to rely on social protocols (standards of polite
behavior) to avoid conflicts among group members. However, Greenberg and
Marwood note several instances when these protocols are insufficient to mediate
groupware use [44], such as when conflicts are caused by accident or confusion, by
unanticipated side-effects of users’ actions, or by interruptions or power struggles.
2.2 Traditional Tabletop Work Practices
The study of interactive tables as a specialized SDG form-factor can be informed by
studies of traditional table use. Studies comparing the use of tables to whiteboards
have found that the shoulder-to-shoulder work style enabled by whiteboards tends to
promote a single leader who controls most of the interaction, while face-to-face
collaboration around tables results in more turn-taking and more participation from all
group members [121]. Studies show that the orientation of items on tables plays
important communicative and coordinating roles, in addition to impacting legibility
[72]. The design of traditional board games has been studied to better understand
techniques used to minimize the negative impact of odd orientations on
comprehension [177]. Work around tables tends to transition between periods of
closely-coupled group work and times of more individual activity [36] [83]. Groups
tend to informally treat the center of a table as a shared, public space, while
considering the spaces nearest themselves as areas reserved for individual use [132].
Tang also observed the division of the table into separate work areas and the
importance of orientation, as well as noting the importance of gesturing to refer to

9
shared context on the tabletop [159]. Rogers et al. have also noted the importance of
pointing gestures on shared tabletops, which they dub “finger talk” [120].
Studies of small-group interaction from other fields can also inform interactive
table design, such as work from the field of proxemics (the study of personal space)
[52], work on legitimate peripheral participation (by which novice group members
benefit from observing more experienced members’ actions) [76], and work on the
educational benefits and challenges of small group work (such as identifying the “free
rider” problem, in which underperforming students participate less in group projects
[65]).
2.3 Interactive Table Technologies and Interactions
There are several technologies that can be used to create interactive tables. The main
interaction-enabling technologies are camera-based vision systems, stylus input
devices, and direct-touch sensing surfaces.
Systems that augment horizontal surfaces with cameras and then use computer
vision and image processing techniques to recognize objects on and/or interactions
with the table are exemplified by the DigitalDesk [175] [176]. The DigitalDesk
system created an interactive horizontal surface by superimposing projected
information onto a traditional desk. Additionally, a camera observed manipulations of
items on the desk, and the projected output was updated accordingly. Another example
of this class of interactive table is the Lumisight table [84], which uses cameras and
RFID to track finger positions and tagged objects on its surface. A key innovation of
the Lumisight table is in its bottom-projected display, which uses four projectors
aimed in different directions in combination with four orthogonally layered pieces of
Lumisty film (which transmits light only at specific angles) in order to create a
tabletop display that can simultaneously provide four distinct views, depending on
which side of the table it is seen from. The Actuated Workbench [104] is a table
technology that uses computer vision to locate items on the table’s surface. The
workbench also contains several electro-magnets that can be programmed in a manner

10
such as to move the recognized tangible objects on the table’s surface, thus facilitating
physical, rather than only virtual, output.
Several systems use tablets or screens that accept stylus-based input to create
an interactive table. For example, the InteracTable [151] was a custom-built, bottom-
projected table that allowed users to interact with a stylus. It interacted with other
components in the i-LAND project’s ubiquitous computing environment.
ConnecTables [158] are stylus-operated, single-user, mobile, drafting-table-height
desks. When two ConnecTables are placed in face-to-face proximity, they can be
treated as a single, larger display (for instance, allowing a document to be dragged
from one to the other). The Personal Digital Historian (PDH) [134] allowed a group of
users to view digital photos on a tabletop display, and manipulate them using a
Mimio1 stylus. Users of the PDH table could use the styli to switch between several
views of photos that facilitated search and storytelling, viewing the images sorted
according to who was in them, what event was depicted, when the photo was taken, or
where it was taken. The TractorBeam project [105] explores the appropriateness of
direct-touch as compared to stylus interaction with tables, and preliminary findings
suggest that styli may be considered more comfortable for reaching across longer
distances when using a “tractor beam” technique where the stylus can be aimed toward
a distant target and used to bring it closer, without requiring the user to reach all the
way across the table.
Some systems allow direct-touch (with fingers), rather than stylus-mediated
input, using resistive or capacitive sensing technologies. For example, DViT [145] is a
SMARTBoard that augments direct-touch sensing with cameras mounted in each of
the board’s four corners. The cameras allow DViT boards to disambiguate two
simultaneous touch inputs. DiamondTouch [31] is a multi-user, multi-touch input
device. Up to four users sit on special chairs, and capacitive coupling allows the
device to associate touches with chair ID. Multiple points of touch from each user are
detected. Rekimoto’s SmartSkin [114] is another type of multi-touch capacitive
1 http://www.mimio.com/

11
sensing technology, although it cannot distinguish which user is the source of each
touch input.
Additionally, several combination systems use auxiliary displays, such as
laptops or PDAs, with tables. For instance, the STARS gaming system [80] uses PDAs
to provide players of an interactive tabletop game with private data. The Caretta
system [153] supports urban planning tasks by providing users with private
information on PDAs while they layout their map collaboratively on a tabletop
display. The UbiTable [135] allows two users to share content from their laptops by
dragging items to a special portal area of the laptop’s display. Those items then appear
on a shared DiamondTouch surface, where they can be collaboratively viewed,
annotated, and copied, and can then be transported back to either laptop via another
portal. Augmented Surfaces [113] combines laptops with a table using the
“hyperdragging” interaction technique, where users can seamlessly drag items from
their laptop onto the table’s surface.
The recent increase in technologies that facilitate the creation of interactive
tables motivated Scott et al. to propose a list of design issues for tabletop groupware
[131], which identified high-level challenges such as supporting transitions between
personal and group work, mediating access to shared digital objects, and handling
simultaneous user actions.
Software for interactive tables follows several different paradigms. Some
work, such as the urban planning table at the University of Colorado [4] or projects at
the MIT Media Lab like the metaDESK [165] combine tabletop software with
manipulables. Using tables in combination with Virtual Reality systems is another
approach, which can be seen in systems like the Responsive Workbench [2], where
users wearing head-mounted displays could view a 3D image on a tabletop. Ambient
technology, which subtly presents peripheral information to users, is another paradigm
for tabletop development. de Bruijn and Spence explore this concept with a prototype
coffee shop table that supports opportunistic browsing by presenting thumbnails of
potentially relevant information around the table’s border [29]. Most interactive table
software development, however, has focused on a software-only (rather than tangible)

12
paradigm, displays 2D (rather than VR) information, and is meant for focused,
interactive use (rather than as a presentation medium for ambient data).
2.3.1 Standard Technology for Systems in this Dissertation
All systems2 that were created and evaluated as part of this dissertation use the
Mitsubishi Electric Research Laboratory’s DiamondTouch table [31], a touch-
sensitive, multi-user input device that uses capacitive coupling to provide user
identification information along with each touch event. This identification information
was necessary for several of our applications; other tabletop input technologies such as
SmartSkin [114] or DViT [145] could support the techniques we describe if they were
augmented with cameras or other means of associating user input with user identity.
The DiamondTouch device does not contain a display, but is combined with a ceiling-
mounted projector to co-located output on top of the touch table. Up to four users sit
around the table, each on a color-coded chair. The color of a user’s chair is often
associated with them in various interface components. All software created for the
systems and experiments that constitute this dissertation were written using the
DiamondSpin [136] Java toolkit for creating tabletop interfaces.
2 The AmbienTable, described in Section 4.5, is an exception – it does not use the DiamondTouch
technology since it was developed before that technology was available.

13
3 Integrating Public and Private Information
Shared display interfaces afford a closely-coupled navigation style – all users typically
view the same information3. Integrating sources of private information with an SDG
system allows increased parallelization of activity, permits user-specific customization
of content, and preserves control over sharing private or sensitive information. Users
of traditional, non-augmented tables naturally divide the work surface into distinct
regions for personal work and for group objects and activities, as shown by Scott et
al.’s studies [132]; we hypothesize that simultaneously supporting both group and
personal tasks is key to designing effective tabletop groupware. Shoemaker and
Inkpen [141] implemented a single display privacyware system that used shutter-
glasses to allow users of a vertical SDG system to simultaneously view user-specific
content overlaid on the shared display. However, wearing shutter glasses prevents eye
contact between group members, thus impeding a key aspect of face-to-face
collaboration. We explore techniques that integrate public and private content in a
fluid and non-intrusive manner, such as interactions for sharing digital documents and
combining private audio with a shared tabletop. The remainder of this chapter is
organized as follows: 3 Note that the LumiSight Table [84], which uses semi-transparent film and multiple projectors, allows
users at different sides of a shared tabletop to simultaneously view different content. This technology
was developed concurrently with our system for augmenting a shared display with private sources of
content. Note that showing different visual content to users of a shared display creates difficulties with
shared context and deictic pointing; providing one visual display but with audio supplements preserves
awareness of what context is shared by all users and allows understanding of gestural references.

14
Section 3.1 presents four gestures (release, relocate, reorient, and resize) for
fluidly transitioning digital documents on a tabletop display in between states of
public and private accessibility. Allowing users to dynamically switch documents
between public and private modes supports transitions between periods of closely-
coupled and loosely-coupled group work that occur in traditional work environments.
Allowing documents to be in an owner-access-only mode (where they cannot be
moved or modified by other users) provides a degree of “privacy” within the context
of a shared tabletop display. In this context, “privacy” refers to control over a digital
document (e.g., the ability to manipulate, modify, or copy that item) rather than
techniques to prevent the observation of private content, which are presented instead
in section 3.2.
Section 3.2 describes a technique for supplementing a shared tabletop work
surface with sources of individually-targeted audio information. This information can
be used to provide each user with contextually-appropriate information depending on
which items they interact with on the tabletop. By using audio, rather than visual
methods, of supplementing the shared display, users can maintain eye contact while
accessing a private data stream, which is an important aspect of team communication,
and which allows for unobservable information access.
Finally, section 3.3 describes a system for integrating PDAs with a shared
tabletop display, by allowing users to “teleport” piles of information between these
small, personal devices and the table, to enable group inspection of items, or as an
intermediate step before transferring these items back to another personal computing
device. This project is part of a collaborative effort (the “Piles Across Space” system
[61] [171]) with Tony Hsieh, Jane Wang, and Andreas Paepcke; section 3.3 discusses
the aspects of this system related to supplementing the tabletop display with personal
digital assistants.
3.1 Fluid Techniques for Document Sharing
Typical meetings transition between phases of individual work and times of active
collaboration among everyone present. Prior studies of group work [36] [83] have
15
established that quick, smooth transitioning between individual and group work during
collaboration is a natural skill. The importance of the ability to maintain a personal
workspace during collaborative activities is reinforced by Tang’s observation [159]
that users of traditional (non-computational) tables often maintain distinct, individual
work areas. Thompson’s work [161] also highlights this fact by noting that students in
a school library preferred quadrilateral, rather than round, tables because they allowed
clearer demarcation of individual work areas. In their list of guidelines for the
development of collaborative tabletop software, Scott et al. [131] note that the ability
to support transitions between personal and group work is a desirable trait for tabletop
groupware applications.
To support more fluid transitions between group and personal work around a
multi-user computational tabletop, we present four interaction techniques that can
facilitate changing the accessibility of electronic documents, so that items can be made
accessible to all users during periods of group work, and can be returned to owner-
only accessibility during individual work. These techniques can be used individually
or in combination to more naturally support this existing work practice.
3.1.1 Fluid Document Sharing Techniques
We use the term “sharing” to refer to the ability to dynamically change the
accessibility of a digital document by transitioning between a “personal” access
control policy (whereby only the document’s owner can move or alter the document)
and a “public” access control policy (whereby all users at the table can move or alter
the document). To support sharing we introduce four interaction techniques – release,
relocate, reorient, and resize.
These interactions were prototyped using our standard experimental setup,
described in section 2.3.1. The concept of supporting fluid transitions between group
and individual work is applicable to other forms of single display groupware [150] in
addition to the specific hardware and software platforms we chose to use.

16
3.1.1.1 Release
This technique mimics interactions with paper documents. If user A “holds” an
electronic document and user B attempts to take it, then if user A continues to hold the
document, user B will come away empty-handed. However, if user A releases his
touch from the document, user B will successfully acquire it (see Figure 2).
Figure 2: The “release” technique for sharing: User B attempts to take the document
User A is holding. User A releases the document in order to transfer access privileges to
User B.
3.1.1.2 Relocate
We have implemented a tabletop layout in which different portions of the table can be
associated with different users. Moving a document into a public region of the table
transitions it to a public mode, while moving it to a user- owned region (demarcated
by color or lines) makes it private (see Figure 3). We support flexible partitioning of
the work surface by initially presenting a surface that is completely public. When a
user joins the group at the table, she can touch the portion of the table closest to her,
thereby claiming that region as her own. That region’s color changes to match the
color of the user’s chair in order to provide feedback that it is now a private region. If
all four sides of the table are claimed as private spaces, the center of the surface still
remains available as a public work area. When a user leaves the group, double-tapping
her private region opens a contextual menu that presents the option of relinquishing
her portion of the table to the public domain.
Although Bullock and Benford [21] propose using space to provide access
control in multi-user environments, they are referring to a metaphor of space within

17
the application (e.g., an application with different “rooms,” where only some users
have permission to access certain rooms), rather than referring to physically
partitioning the work surface into areas with different access permissions. The
UbiTable [135] also partitions a work surface to indicate access permissions, and was
implemented using the DiamondSpin toolkit with our “relocate” sharing technique.
Figure 3: The “relocate” technique for sharing: When the document is in User A’s
private area, it is inaccessible to other users. By moving the document to the center
(public) section of the table, it becomes publicly accessible.
3.1.1.3 Reorient
The reorient interaction is also inspired by observations of people’s interactions with
paper – Kruger and Carpendale [72] observed that people changed the orientation of
physical documents on a table to indicate whether they were personal or public. We
allow sharing of a document by orienting it toward the center of the table, while
orienting it toward the outside (e.g., toward the user who owns it) transitions it back to
a personal mode (see Figure 4).

18
Figure 4: The “reorient” technique for sharing: When User A’s document faces him it is
not accessible to other users. User A rotates his document to face the center of the table
in order to make it publicly accessible.
3.1.1.4 Resize
With the resize technique, making a document smaller than a threshold size makes it
private, while enlarging it opens it to public access (see Figure 5). The association of a
larger size with increased access seems appropriate in light of the findings of Tan and
Czerwinski [154], who observed that displaying electronic correspondence at a larger
size invited more snooping, although it is not clear from their study whether the
observed differences in perceived information privacy resulted from the size disparity
between displays, or from the different affordances suggested by traditional monitors
versus wall-projected displays.
Figure 5: The “resize” technique for sharing: User A’s small document is inaccessible to
other users. User A enlarges his document, thereby making it public.

19
3.1.2 Evaluation
We conducted an evaluation to measure performance and qualitative differences
among our four interaction techniques for sharing – releasing, relocating, reorienting,
and resizing. In addition to observing subjects using these techniques, we posed the
following hypotheses:
H1. Pairs of subjects would be able to exchange private documents faster using
some techniques than others.
H2. Pairs of subjects would commit fewer errors while exchanging private
documents with some techniques than others.
H3. Visual feedback showing the accessibility of documents would result in
fewer errors.
H4. Differences in the perceived ease of use and naturalness would exist
among the four techniques.
3.1.3 Method
3.1.3.1 Participants
Fifteen pairs of subjects (14 males, 16 females) from outside our lab participated in the
study. Their ages ranged from 18 to 33 years old. All of the pairs knew each other
prior to the study and none of the pairs had significant experience with tabletop
interfaces.
3.1.3.2 Setup
The digital documents displayed by the test application were simple images with a
clear orientation. Each document was movable, turnable, and resizable by its owner.
During each trial, the application displayed which of the four techniques the pair
should use. Finally, the test application logged the time pairs took to complete each
task as well as the number and type of errors made.

20
3.1.3.3 Procedure
Pairs sat opposite from one another across the tabletop. Each session began with
instructions on how to move, turn, and resize documents on the table. The tutorial then
included written instructions on how to use each of the four sharing techniques to
change the accessibility of a document. Subjects were given the chance to practice
each of the techniques and ask questions. When they were finished practicing, pairs
were asked to perform a series of simple document exchanges in which each subject
had to first make their document accessible to their partner and then had to take their
partner’s document.
Each exchange used one of the four techniques and either provided visual
feedback or did not. Visual feedback was provided in the form of colored tabs along
the edge of each document. The tabs corresponded to the colors of the chairs each user
sat in. If a tab was transparent, it indicated that the user in the corresponding chair
could not access the document; conversely, opaque tabs indicated that the
corresponding user could access the item. While we conjecture that providing such
feedback is helpful in a multi-user, multi-document setting in which several different
access policies are simultaneously in effect, the best way to present this visual
feedback is still an open question and was not the focus of this work.
The order in which the techniques and feedback appeared was balanced to
control for condition. The pairs participated in 64 such trials (4 techniques, by 2
feedback conditions, with 8 repetitions each). To balance learning effects, only the last
4 of every 8 repetitions were included in analyses.
3.1.3.4 Questionnaire
At the end of the study, both subjects were asked to fill out a short questionnaire
designed to elicit subjects’ subjective preferences among the four techniques.
3.1.4 Results
There is a significant difference among the four techniques in task times (H1). The
testing application recorded the task time for every trial, measured from the moment

21
the two documents appeared on the screen to the moment both documents had been
successfully exchanged. The technique used significantly affected the task time
(F(3,117)=50.4,p<0.0001) – relocate was more efficient than the other three
techniques. The mean task times for each of the four conditions are shown in Figure 6.
There is a slightly significant difference among the four techniques in error rate (H2).
For each trial, the testing application recorded how often a subject attempted to take a
document that they did not have permission to take. Additionally, the application
recorded unnecessary steps performed by either of the subjects (such as resizing a
document when they only had to reorient it). The relocate and resize techniques seem
to have slightly significantly lower error rates than the release and reorient conditions
(F(3,117)=2.34, p=0.07). The error rates for each of the four conditions are shown in
Table 1.
Figure 6: Sharing documents with the “relocate” technique was significantly faster than
with the other three techniques.
Table 1: Error rates were lowest when using the “relocate” and “resize” techniques to
share documents.
Release Relocate Reorient Resize
Mean Errors 1.45% 0.0% 1.65% 0.4%

22
Table 2: Subjects’ average rank of ease of use for each technique. Lower scores reflect
easier methods.
Release Relocate Reorient Resize
Avg. Rank
2.8 1.1 2.9 3.1
Table 3: Subjects’ average agreement with the statements. Higher values show more
agreement.
Statement Avg. It’s easy to share documents with Release 4.9 It’s easy to share documents with Relocate 6.9 It’s easy to share documents with Reorient 4.4 It’s easy to share documents with Resize 4.6 The Release technique was natural to use. 3.8 The Relocate technique was natural to use. 6.8 The Reorient technique was natural to use. 3.3 The Resize technique was natural to use. 4.9
There was no significant difference between the feedback and no-feedback
conditions in error rate (H3). The mean number of errors between these two conditions
was indistinguishable. (on average, 0.007 vs. 0.010, F(1,119)=0.30, n.s.)
There is also no significant difference between the feedback and no-feedback
conditions in task time. Because the overall error rate was very low for all conditions,
we thought that while visual feedback did not seem to affect the error rate, it might
allow pairs to perform their tasks more rapidly. However, the mean task times in the
feedback and no-feedback conditions were indistinguishable (on average, 5305 ms vs.
5353 ms respectively, F(1,113)=0.0004, n.s.). Figure 6 shows the similarity between
the averages for each technique, and the lack of a significant interaction effect. This
may reflect the fact that the task involved only two documents and users at a time;
visual feedback might become more useful as the number of users and/or documents
increased. This is a question left for a future study. While feedback did not prove to be

23
numerically significant, subjects strongly agreed with the statement “The colored
tabs showing ownership made it easier to share documents” (on average, 5.18 on a 7-
point Likert Scale) and strongly disagreed with the statement “The colored tabs
cluttered the interface” (2.58 on a 7-point scale).
There is a significant difference among the four techniques in regard to users’
perception of ease of use (H4). Each subject was asked to rank the four techniques by
“how easy it was to share a document with your partner,” with 1 being the easiest and
4 being the hardest. There is a significant difference among the four techniques, with
subjects strongly favoring the relocate method (F(3,116)=44.26,p<0.0001).
Additionally, subjects were asked to rate their agreement on a seven-point Likert Scale
with statements about the ease of use and naturalness of the four techniques. The
average results from the ranking and agreement are shown in tables 2 and 3.
Subjects were able to quickly learn and then successfully perform each of the
four techniques. While this was an unstated hypothesis, we were pleased to see high
success rates across the board. Virtually all of the trials were successful, with only 13
out of the 484 total trials being unsuccessful. Of these 13, all but 2 took place in the
relocate condition and involved a subject placing a document directly in his partner’s
area rather than the public area in the middle of the table, a situation that we recorded
as a failure since no “exchange” was made. In general, subjects seemed able to quickly
learn these techniques and were able to switch between them without any noticeable
trouble.
3.1.5 Fluid Techniques for Document Sharing: Conclusions
This work introduced four tabletop interaction techniques (release, relocate, reorient,
and resize) for transitioning documents between public and personal accessibility. A
formal study of these techniques demonstrated that users quickly understood and
mastered these four methods of sharing. This work addressed the issue of integrating
public and private information in tabletop groupware systems by providing
interactions for transitioning digital documents on the tabletop between modes of
public and private accessibility.

24
This is an important step toward creating co-located groupware that supports
the swift, fluid transitions between periods of individual work and active collaboration
that have been observed in meetings around traditional tables. Developing and
evaluating other mechanisms to support flexible access control for co-located
groupware is a rich area for further study.
3.2 Individual Audio with Single Display Groupware
Single Display Groupware systems present numerous challenges, such as clutter
caused by limited display real estate and the inability to convey private or personalized
information to members of the group. Since the group shares a single surface, all
information is visible to all group members. Channels for conveying private
information have several practical applications, including transmission of private or
secure data and reduction of problematic clutter.
Single Display Privacyware [141] (SDP) extends the notion of Single Display
Groupware to incorporate auxiliary mechanisms for conveying private or customized
content to individual users of a shared display. Several examples of privacyware have
been explored, including systems using specialized shutter glasses, such as those
described by Agrawala et al. [2] and by Shoemaker and Inkpen [141], systems using
auxiliary displays such as PDAs and laptops, such as SharedNotes [43], Pebbles [100],
Pick and Drop [112], and the UbiTable [135], and systems using physical partitioning
of the shared surface, such as the PDH [134] and RoomPlanner [181] systems. The use
of multimodal interfaces as a solution to the single display privacyware problem is a
relatively unexplored area. A few systems (e.g., Jam-O-Drum [16] and STARS [80])
using audio for entertainment purposes have been developed, but their utility has not
been formally evaluated, nor have systems using private audio channels to support
group productivity tasks been explored. We discuss these previous systems in more
detail in Section 6.
This section describes a multimodal approach to SDP. Our system uses
individual sound channels to provide private information to specific users. We discuss
the implementation of our system, and we present the results of an initial study that
25
demonstrates the applicability of this approach to a collaborative task. The quantitative
and qualitative results suggest that private audio has potential as a means of
supplementing shared displays. We conclude with a discussion of related work.
3.2.1 System Hardware
These interactions were prototyped using our standard experimental setup, described
in section 2.3.1. Figure 7 depicts our system configuration.
The system runs on a consumer-grade PC (3.0 GHz Pentium 4 with 1 GB
RAM), with five off-the-shelf soundcards added. One of the soundcards is connected
to a set of standard PC speakers, while each of the other four is connected to an
earbud-style headset. We chose to use earbuds (small knobs that fit inside the ear)
rather than standard headphones (which cover the entire ear) in order to facilitate
collaboration. Users of the system wear a single earbud in one ear, so they can still
converse at normal volumes with their co-workers. The decision to use single-ear
audio is reinforced by a study of Sotto Voce [3] (a PDA-based museum guide system),
which found that using one-eared headsets allowed users to comfortably converse with
each other. Additional literature [37] suggests that listeners are better able to
differentiate multiple audio sources if they are directed to different ears; the single-
earbud approach leverages this fact by presenting system-generated audio to one ear
and allowing conversation to be perceived contralaterally.

26
Figure 7: Four users sitting around a tabletop display can receive private information
over their individual earbuds.
3.2.2 System Software
The following sections describe the SoundTracker application software.
Understanding the functionality and interface of this software is background
knowledge helpful for interpreting the results of our system evaluation, presented in
section 3.2.3.
3.2.2.1 Sound API
We have implemented a Java library that allows sound clips (wav, mp3, MIDI, etc.)
and text-to-speech requests to be sent to one or more sound channels. To play a sound,
the programmer specifies either the text to be spoken or the sound file to be played,
along with a bit mask indicating which subset of the soundcards should output the
sound. In this manner, it is possible to specify that sound X should, for example, be
played only over soundcard 1 (connected to the first user’s earbud), while sound Y
should be played over soundcards 3 and 4 (user 3 and 4’s earbuds). Multiple sounds

27
can be simultaneously mixed over each of these channels. Our library provides several
ways to control sounds – in addition to the ability to play, pause, and stop the audio, it
is also possible to seek to an absolute or relative offset within each audio stream.
We created a Java library so that our private sound API would be compatible
with DiamondSpin [136]. Because the current implementation of the Java Sound API
does not provide access to individual audio devices, our library uses the Java Native
Interface to pass requests to a C++ back-end. The C++ module uses Direct Show and
the Microsoft Speech API to route audio clips and text-to-speech requests to
individual sound devices. Each sound is loaded or rendered to a shared data buffer,
and asynchronous playback requests are submitted for each requested output device.
3.2.2.2 SoundTracker
We developed a prototype application in order to explore the feasibility of using
private audio to supplement a shared display. This application, SoundTracker, allows
up to four users to browse a collection of photographic stills from a movie (each
representing a particular scene) and a collection of mp3 songs (represented on-screen
by their titles). Songs can be bound to scenes by dragging song titles onto images,
allowing users to choose a “soundtrack” for the film.
This application is representative of a broader class of groupware that supports
tasks where multiple users are involved in collaborative decision-making involving a
large number of documents or other objects. Although the SoundTracker application’s
use of an audio-centric task limits its generalizability, it was designed primarily to
focus on basic interface issues, such as exploring the impact of private audio on group
behavior in a controlled setting. With this larger goals in mind, we conducted a user
study using our private audio system and the SoundTracker application in order to
ascertain whether multiple private audio channels had potential as a useful way to
augment single display groupware. This study addressed several questions:
• What effect does the use of private audio channels have on work strategies as
compared to the use of a system with no private source of information?

28
• How does wearing earbuds and listening to different audio sources affect
communication among group members?
• How does the use of private audio channels affect group productivity as
compared to a system with no private source of information?
• How does the use of private audio affect the overall usability of the system?
The remainder of this section describes additional features of SoundTracker; in
Section 3, we describe details of the user study conducted with this application.
3.2.2.3 Song Objects
A song is represented by a label containing the song’s title and a musical note icon
(see Figure 8a). To move a song around the table, a user can touch the title area with
his finger and drag the song object to its new position. In order to play the song, a user
can touch the musical note icon, and the song will be played through that user’s
earbud. Touching the icon a second time will stop the song. When a song is played, its
note icon changes color, and a slider appears, which can be used to navigate forward
and backward within the song (see Figure 8b).
Multiple users can play the same song simultaneously by each touching the
musical note icon. Each user has a personal seek slider (color-coded according the
color of the user’s chair) for that song (see Figure 8c). If one user touches the note a
second time to turn off the song, it turns off only for him, and continues playing for
any other users who had previously activated it.
(a)
(b) (c)
Figure 8: Song objects in SoundTracker. (a) A song object, in the off state (not playing
any sound). Touching the title area allows a user to move the song object around the
table, and touching the note icon plays the song over that user’s earbud. (b) A song

29
object, being played by the user in the green chair (the object takes on the chair’s color
to reflect its current operator). When a song is played, a slider appears that allows the
user to seek forward and backward within the song. (c) More than one user can
simultaneously play the same song. By using their individual slider bars, users can each
listen to different sections of the same song.
3.2.2.4 Scene Objects
Scene objects represent scenes from a movie. Each scene object consists of a “tray”
(an initially blank area where song icons can be placed), a photographic still, and a
“speech bubble” icon (see Figure 9a). Touching the photo or its tray with a finger
allows users to move it about the table in the same manner as the song objects.
Touching the speech bubble plays a brief caption (ranging from 2 to 7 seconds), which
summarizes the plot of that scene, over the earbud of the user who touched it. If the
user does not want to play the entire caption, he can touch the speech bubble icon a
second time in order to turn it off. As with the song objects, more than one user can
simultaneously play the same caption.
Users can associate songs with scenes by dragging a song object into the tray.
The song will then “snap” into the bottom of the tray (see Figure 9b) and will remain
attached if the scene object is moved around the table. A song can be disassociated
manually by dragging it outside the borders of the tray, or by replacing it with a new
song.
It is possible for a single user to play both a song and a scene caption over his
earbud at the same time. However, we imposed a restriction that each user can play at
most one song and one caption. We imposed this limit because we found during our
pilot testing that it was possible to attend to both a song and a caption simultaneously,
but multiple songs or multiple captions became muddled and difficult to comprehend.
Because users are sitting at four different angles around the table, there is no single
“correct” orientation for scene or song objects. To address this difficulty, we used the
user-identification capability of the DiamondTouch combined with our prior
knowledge of the fixed locations of the chairs. Whenever a user touches a scene or

30
song object, that object is re-oriented to face that user, using the transformations
provided by the DiamondSpin toolkit.
(a) (b)
Figure 9: (a) A scene object consists of a picture, a speech bubble icon, and a tray.
Touching the speech bubble plays a brief caption summarizing the scene’s plot. (b)
Dragging a song object onto the scene and releasing it adds it to the scene’s tray.
3.2.3 User Study
We conducted a preliminary user evaluation of the SoundTracker system in order to
ascertain the potential value of enhancing a shared interactive tabletop with
individually-targeted audio, and to address the design questions posed in section 3.2.2.
3.2.3.1 Participants
We recruited sixteen paid subjects (thirteen men and three women), ranging in age
from eighteen to twenty-four years. None of the subjects had prior experience using a
DiamondTouch table, but all were experienced computer users. All had normal
hearing and normal color vision. The sixteen subjects were divided into four groups of
four users each. Twelve additional users (three groups of four) served as pilot subjects.
3.2.3.2 Measures
Several types of quantitative and qualitative data were gathered. The SoundTracker
software was instrumented to log time-stamped records of all interactions, including
events related to moving songs and scenes about the table, events related to playing
songs and captions, and associations and disassociations of songs and scenes. All
groups were videotaped and observed by the experimenter, who took notes
throughout. Finally, after using the system, all participants completed a questionnaire
containing both Likert-scale and free-form questions.

31
3.2.3.3 Procedure
When a group arrived for the study, the four group members were seated one on each
side of the DiamondTouch table. Participants were told they would be working
together as a group during the study, and were asked to introduce themselves to the
rest of the group. The group then completed a tutorial in which they were introduced
to the basic functionality of the SoundTracker application.
After the tutorial, each group was presented with seventeen images captured
from a popular movie, each representing a particular scene from the film, and thirty-
four icons representing songs selected from a popular music collection. The group was
instructed to construct a “soundtrack” for the film by assigning songs to images. The
criteria for a good soundtrack were subjective, but groups were instructed to consider
elements such as the song’s tempo and emotional content and how they might fit with
the mood of a scene. To further motivate subjects to make careful selections, they
were told that after all groups had finished the experiment, a panel of judges would
review each group’s final soundtrack selection and would vote on which one was the
“best,” awarding a prize (gift certificates) to the winning group. Participants were
instructed to notify the experimenter when they felt they had reached a consensus on
the final soundtrack selection. A twenty-minute time limit was enforced.
Each group was asked to perform this task twice: In one pass through the task,
the “private sound” condition, captions and songs were played over individual
earbuds. In the “public sound” condition, captions and songs were played over a
single, shared speaker. The restrictions on per-user songs and captions were the same
in both conditions. The ordering of the two conditions was balanced among groups.
Scenes were selected from a different movie in each condition – “The Princess
Bride” (MGM, 1987) and “Titanic” (Paramount Pictures, 1997) – and two disjoint
sets of songs were used. The association between movies and conditions was also
balanced among groups. Each movie always appeared with the same set of songs,
which were not selected from the film’s original soundtrack. Three of the sixteen
participants had never watched “The Princess Bride,” and a different three subjects
had never seen “Titanic” – however, these individuals were distributed such that in

32
each group at least two group members (and usually three or four) had seen each of
the films. Also, before beginning the application, the experimenter read a summary of
the movie’s plot to the group.
Figure 10: The initial layout of the table in each condition has the scene objects arranged
in a circle with the song objects piled in the center.

33
Figure 11: A typical example of the table’s layout partway through the study. Some
songs and scenes have been paired, and songs and captions are being played.

34
Figure 12: A typical table configuration near the end of the study. Scenes have been
assigned songs and are piled in one area of the table, in order to reduce clutter. Users are
playing some songs to verify their agreement with the group’s final selections.
Figure 10 shows the configuration of the table at the beginning of an
experiment. The seventeen scene objects are arranged in a circle, facing the outer
edges of the table, ordered chronologically according to their order in the film. The
thirty-four song objects are piled randomly in the middle of the circle. Figure 11
shows a screenshot of a table configuration captured several minutes into an
experiment – some song-scene pairings have been made, and users are playing some
songs and captions. Figure 12 shows a typical end-of-condition scenario, where all
scenes have been associated with songs, and have been piled in one area of the table
to reduce clutter.
After completing both experimental conditions, all sixteen subjects
individually completed a questionnaire that contained both Likert-scale questions and

35
free-form response questions about subjects’ experiences. Table 4 summarizes the
results of the Likert-scale questions.
3.2.4 Results
The questionnaire, log, and observation results paint an interesting picture of the
effects of private versus public audio regarding task strategies, communication,
productivity, and usability.
3.2.4.1 Task Strategies
Subjects were asked several free-form questions on the post-study questionnaire. One
such question asked, “Please describe how your strategy for assigning the soundtrack
differed between the headphones and public speakers conditions.” Responses followed
a consistent pattern, indicating that in the private audio condition groups tended to use
a divide-and-conquer strategy while following a more serial strategy in the public
audio condition. For example, one subject wrote, “With headphones, we worked
individually until we found something we liked and then shared with the group. With
speakers we went through each song and picture together.” In the public condition,
whenever someone accidentally began playing a song while another song was already
playing, he immediately turned it off and apologized to the group. No groups ever
intentionally played multiple songs simultaneously over the speakers, but they did
sometimes play one song and one caption simultaneously without apparent
comprehension difficulty.
Another strategic difference we observed was that the private audio created a
more “democratic” setting, where all users participated in selecting interesting songs
and scenes and suggesting pairings. Shy users who were not as willing to speak up in
the public condition participated more in the private condition, non-verbally making
suggestions by creating scene-song pairings that were later discussed by other group
members.
By contrast, in the public condition, one or two group members often took on a
leadership role, suggesting pairings and controlling the interface. Rogers and Rodden
[122] note that use of traditional, shoulder-to-shoulder single display groupware (such

36
as electronic whiteboards) typically results in situations where the more dominant
group member controls most of the interaction while others play a supporting role.
Informal observations by Rogers [120] suggest that tabletop groupware promotes
more participation by all group members than shoulder-to-shoulder displays. Our
observations further this line of inquiry by suggesting that participation by all group
members can be further increased by the addition of private audio channels.
0
5
10
15
20
25
play song create pairingEvent Type
Tabl
e D
omin
ance
Sco
re
speakersheadsets
Figure 13: The lower table dominance score (standard deviation among the percent of
song plays and song/scene pairings initiated by each group member) indicates more
equitable participation in the private condition as compared to the public condition. A
higher score indicates less equal participation among group members.
The software logs of user actions support our observations that groups had
more “democratic” behavior when using headphones as compared to the public
condition. To assess the degree to which all four users were participating in the task,
we measured the number of song play events and song/scene pairing events that each
user was responsible for in each condition. We propose that a uniform distribution of
these events among users suggests more uniform participation in the task. For each
group, we counted the percentage of table events that were associated with each user.
We then computed the standard deviation of those percentages within each group. We
call this value a “table-dominance” score. A higher “table dominance” value indicates

37
a less uniform distribution of events among users, while a lower score reflects more
equal contributions among group members. The results are summarized in Figure 13,
averaged over the four groups. For each type of event (playing songs and creating
song/scene pairs), the “table dominance” value was significantly higher for the public
sound condition (p<.05), indicating that a subset of users tended to dominate the
manipulation of items on the table. This may reflect the fact that shy or unassertive
users felt more empowered to contribute in the private case.
0
10
20
30
40
50
60
70
80
total replacementsaver
age
num
ber o
f rep
lace
men
ts m
ade
per
grou
p
speakersheadsets
Figure 14: Groups in the private condition were more likely to replace previously
established song/scene pairings than groups in the public condition.
Groups replaced songs assigned to scenes (e.g., after a song had been
associated with a scene, it was removed and a new song was added instead) more
frequently (p<.05) in the private condition (an average of 69.5 replacements per
group) than in the public condition (an average of 29.25 replacements per group) (see
Figure 14). This could be indicative of several factors – perhaps the groups just got it
“right” the first time when they all focused on one task together in the public
condition. Or, it could reflect the fact that, in the private condition, groups
collaborated on the task by actively reviewing – and often replacing – choices made
by other group members. Of the replacements made in the public condition, 68.4%
38
were self-replacements (a user replacing a song-scene pairing that he had created) and
31.4% were other-replacements (replacing a pairing that had been established by
another user). In the private condition, 58.3% were self-replacements and 41.7% were
other-replacements.
Not surprisingly, in the public condition groups were unlikely to play more
than one song and/or one caption at a time, while in the private condition several users
simultaneously played sounds. As one would expect, in the private condition, users
played songs and captions more frequently (an average of 221 songs and 78.25
captions per group) than in the public condition, in which they played an average of
93.5 songs and 36.5 captions per group (songs: p<.02, captions: p<.01). Longer clips
of songs were played in the private audio condition, with an average duration of 11.56
seconds, as compared to 7.45 seconds in the public case (p<.05). While we anticipated
that there would be more songs played in the private condition, we had also expected
that there would be greater coverage of the songs in the private case, since we thought
that the lower number of play events with public audio might also mean that some
songs were not explored at all. However, we were surprised to see that this was not the
case – nearly all of the thirty-four songs were played at least once in both conditions
(an average of 33.75 per group in the private condition, and 33.25 in the public
condition). It is possible that this is a ceiling effect – it would be interesting to see
whether both conditions still result in equal coverage of songs if either the number of
songs were increased or if the allotted task time were shortened.

39
Table 4: This table shows the mean responses to the Likert-scale questions completed by
each of the sixteen participants from 1 = strongly disagree to 5 = strongly agree.
Mean
I found it difficult to communicate with my group when wearing
headphones
1.88
I found it uncomfortable to wear headphones 2.25
I enjoyed using headphones to complete the task 4.0
I enjoyed using public speakers to complete the task 3.31
I found it easy to complete the task using headphones 3.88
I found it easy to complete the task using public speakers 3.19
I felt satisfied with the group’s soundtrack selection in the
headphones condition
4.19
I felt satisfied with the group’s soundtrack selection in the public
speakers condition
4.06
3.2.4.2 Communication
Subjects did not report that private audio reduced group communication. They
disagreed (mean = 1.88) with the statement “I found it difficult to communicate with
my group when wearing headphones.” Another indication that participants felt the
group communicated and worked well together in the private audio condition is their
agreement (mean = 4.19) with the statement “I felt satisfied with the group’s
soundtrack selection in the headphones condition.” Respondents agreed with the
corresponding statement about the public condition (mean = 4.06), indicating that
participants felt the group was equally satisfied with their final selections in both
conditions.
On the post-study questionnaire, subjects’ free-form responses to, “Please
describe how your level of and quality of communication with the other participants

40
differed between the headphones and public speakers conditions” varied. Three
respondents indicated that one nice aspect of communication in the public condition
was the fact that “everyone is focused on the same task,” although another subject
wrote that in the private condition “we could imitate a speaker-like effect by all
listening to the same music clip or scene caption.” Another person wrote, “With the
speakers, it was hard to communicate because all of us had to listen to one song at a
time and we all had to hear it. With the headphones, one person could listen to a song
while the other three talked. There were more combinations of listening and
communication possible.” However, most participants indicated that communication
levels were about the same in each condition.
Our observations during the study and of the additional three pilot groups
supported the self-reports that earbuds didn’t impede communication. In fact, analysis
of the videotapes shows that all groups spent more time talking with each other in the
private condition than in the public condition. Figure 15 shows, for each group, the
percentage of time that group talked during the private condition and the percentage of
time that group talked during the public condition – all groups spoke more with the
headsets than with the speakers. The fact that groups in the public condition tended not
to speak while a song was playing over the speakers likely accounts for this difference,
although it could also reflect the fact that groups in the private condition needed to talk
more to accomplish the task because they lacked the shared context present in the
public condition.

41
0
10
20
30
40
50
60
70
80
group 1 group 2 group 3 group 4
Perc
ent o
f tim
e sp
ent t
alki
ng
speakersheadsets
Figure 15: Each group spent more time talking in the private condition than in the
public condition.
In addition to the differences in amount of conversation between conditions,
the nature and distribution of the conversation also differed. In the public condition,
groups typically played one song at a time for several seconds without speaking, and
then would turn the song off and discuss its merits for pairing with a particular scene.
This produced a pattern of music-talk-music-talk.
In the private condition, however, groups usually were quiet for the first few
minutes of the session, as they spent this time exploring a subset of the songs and
scenes in parallel. After that initial quiet period, they spoke frequently, with
conversation falling into the following categories:
• Advertising – users often told the rest of the group about a certain genre of
song they had discovered, to see if others might be able to match it to a scene.
• Querying – users often asked the rest of the group whether anyone else had
found a song fitting certain criteria in order to match a certain scene.
• Verifying – users often asked the rest of the group to verify that a song-scene
pairing they had created was appropriate. Other group members would then
listen to the song and caption and discuss their suitability as a match.

42
• Strategizing – one or more group members would propose a strategy, such as
creating piles of songs that matched certain criteria (e.g., a happy pile and a sad
pile), or creating piles of verified pairings in order to reduce clutter and avoid
repeating work.
3.2.4.3 Productivity
Subjects found it significantly easier (p<.05) to complete the task in the private
condition – the statement “I found it easy to complete the task using headphones”
received a mean score of 3.89, while “I found it easy to complete the task using public
speakers” received only a 3.19. Subjects’ free-form comments on the questionnaire
indicated that they perceived the private condition as allowing them to complete the
task more efficiently.
The number of times groups “changed their minds” about a particular song-
scene pairing by replacing one song with another could be taken as a measure of the
quality of their final soundtracks. As mentioned in Section 4.1 (see Figure 14), groups
replaced assignments significantly more frequently in the private condition than in the
public condition, which may indicate that groups were able to put more thought and
effort into the soundtracks produced in the private condition.
Pilot studies revealed that groups given unbounded time to complete the task
took much longer using public speakers than private earbuds. This is probably a result
of the increased efficiency of the divide-and-conquer strategies enabled by private
audio, although it could also indicate that groups spent more time discussing and
debating each choice in the public condition, perhaps because they were all always
focused on the same task. However, because the pilot groups took such a long time
with the task, we imposed the twenty-minute time limit, reminding people when five
minutes and one minute remained. In the public condition, groups had to hurry a great
deal when they got these reminders, whereas in the private condition groups were
nearly finished by this time anyway, and usually used the remaining time to
thoroughly review their chosen pairings

43
3.2.4.4 Overall Usability
In addition to reporting that it was easier to complete the task in the private condition
(as discussed in Section 4.3), subjects also found the private condition slightly more
enjoyable than the public condition (p=.085), giving a mean score of 4.0 to the
statement “I enjoyed using headphones to complete the task,” but only giving a mean
of 3.31 to “I enjoyed using public speakers to complete the task.” Overall, subjects felt
that wearing the earbud was not particularly uncomfortable, as suggested by their
disagreement (mean = 2.25) with the statement “I found it uncomfortable to wear
headphones.”
The questionnaire also asked subjects, “Which session did you prefer? Please
comment on the reasoning behind your choice.” Ten of the sixteen participants said
they preferred the private condition, while six said they preferred the public condition.
For those who preferred the private condition, a common justification was greater
efficiency due to the ability to work in parallel on parts of the task, and feeling more
comfortable exploring songs without worrying about bothering other users. People
who preferred the public condition felt it helped the group focus more on common
tasks.
3.2.4.5 Tabletop Use
Although observing the impact of private audio channels was our primary interest, we
also observed interesting patterns in the use of space on the shared tabletop. Clutter on
the table was a significant issue – it was not possible to spread all seventeen scene
objects and thirty-four song objects across the table without overlapping them. Groups
consistently came up with piling strategies to help reduce clutter. Three of the four
groups created a “finished” pile, where they put scene-song pairings that they had all
agreed were final, both to save space and to prevent wasting time by unnecessarily
revisiting those decisions. Two of the groups also created a “rejection” pile of songs
that everyone agreed would not be appropriate matches for any of the scenes. The use
of piles for information organization in computing systems is discussed at length in
Mander et al.’s work [81].

44
We also analyzed the spatial distribution of object interactions. The table was
divided into five equally-sized zones, illustrated in Figure 16. Four of these zones
correspond to the “local space” of each user, and a fifth zone represents a center
“neutral” area. These zones are purely an analytical construct, and were not reflected
in the software’s UI. Each time a user manipulated an object on the table, the logged
event was tagged as an “own-area” event (if it took place in the user’s local area), an
“other-area” event (if it took place in another user’s local area), or a “neutral- area”
event. We found a disproportionately small number of “other-area” events. Only 27.9
percent of song play events, for example, were tagged as “other-area”, despite the fact
that other users’ local areas constitute 60 percent of the tabletop. We do not expect
that this was the result of reach length limitations; the DiamondTouch has an 88 cm
diagonal, so it is small enough for even petite adults to comfortably reach across the
entire table. This tendency to avoid other users’ local areas is in keeping with
observations of physical table use that suggest that people establish personal territories
[132] [159]. There was no significant difference in the spatial distribution of events
between the public and private conditions.
Figure 16: An illustration of the analytical division of the table into “local areas” for
each user.
3.2.5 Discussion
Although further experimentation will be required to draw broad conclusions, our
results indicate that individual audio channels can be a useful addition to single
display groupware. With private audio, group members participated more equitably in
the task, spoke to each other more frequently, and managed the available time more
45
effectively than when individual audio channels were not available. Users also
indicated that they found the system enjoyable and easy to use.
A next step is to evaluate the use of individual audio in situations where the
audio conveys text, rather than music. It is possible that people are less able to focus
on their conversations with other group members when they are listening to speech;
however, based on the use of the scene captions in our application, we suspect that
occasionally listening to brief text clips that supplement the information on the shared
display may not be overly distracting.
In the original design, the “seek” sliders were not available for song objects –
songs always played from their beginning until they completed or were turned off.
However, pilot testing revealed that this was frustrating to users who wanted to briefly
browse songs. Since the early seconds of a song are often not representative of the
overall tempo or mood, the ability to seek is important. This brings up a point
applicable for the design of more general interfaces for augmenting shared displays
with private audio – because audio information must be reviewed serially and cannot
be quickly scanned like visually presented material, providing interfaces that allow
users to navigate within (and perhaps even change the playback rate of) their audio
stream, whether it is music or speech, is critical.
Although users indicated in the questionnaires that they did not find the
earbuds uncomfortable, improvements could still be made that would make the system
more appealing for everyday or long-term use, such as suggestions on headset type
preference in Grinter and Woodruff’s research [45]. Using wireless headsets would be
a large improvement, since it would allow users greater mobility as well as reducing
the likelihood of tripping over long wires. There are also less invasive, though more
expensive, alternatives to using headsets as a means of delivering the private audio –
for example, the Audio Spotlight [110] can “shine” a sound beam at a specific person.
One common suggestion provided by the free-form questionnaire comments was to
provide a mechanism for users to “push” the sounds they were hearing to other users’
headsets. In our study, if a user wanted others to hear the same thing she was listening
to, she would have to ask out loud for others to touch the same song, and would

46
sometimes even give instructions about how far to seek (“Everyone go to ¾ of the way
from the beginning.”).
3.2.6 Related Work
3.2.6.1 Visual Privacyware
There are several systems that provide a private source of visual information to users
of Single Display Groupware. The three main approaches for adding private visual
data are the use of shutter glasses or head-mounted displays, the use of several
smaller, auxiliary displays, and physically partitioning the shared space.
Shoemaker and Inkpen [141] use alternating-frame shutter glasses to present
disparate views of a shared display to two users – each user sees the same basic
information on the display, but each sees only his own cursor, contextual menus, and
user-specific task instructions. Agrawala et al. [2] use a similar technique to present
two users with stereo views of the same 3-D model from different perspectives based
on where each user is standing.
Auxiliary displays can also be used to provide privacy, and are analogous to
the personal pads of notepaper that people bring with them to traditional meetings.
Greenberg et al.’s SharedNotes [43] lets users make personal notes on PDAs that they
can selectively transfer to a large, shared display. Myers et al.’s PebblesDraw [100]
allows users to simultaneously operate a shared drawing program from individual
PDAs. Rekimoto’s Pick-and-Drop technique [112] allows users to “pick up” and
“drop” information using a stylus in order to transfer data between a PDA and a large
display. The UbiTable [135] uses laptops as auxiliary devices – users keep private
information on their laptops, but can wirelessly transfer items they wish to
collaboratively discuss onto a shared tabletop display. iROS [63] allows people to use
their laptops to post content to (or get content from) large shared displays using its
“multibrowse” mechanism.
A third option for visually presenting private information is to physically
partition the shared display. The Personal Digital Historian [134] has a central area
where commonly referenced digital photos can be displayed and manipulated. The

47
corners of the display, however, are semi-private spaces where an individual user can
keep another collection of photos. This is an affordance of standard physical tables as
well – papers situated on far sides of the table and oriented toward other users
effectively become private [72]. Wu and Balakrishnan [181] take a different approach
to physical partitioning; when a user places his hand vertically and slightly tilted on
top of a top-projected tabletop display, the system detects this gesture and takes
advantage of the top-projection to project “secret” information onto the user’s tilted
palm.
There are several drawbacks associated with visual privacyware solutions. The
use of alternating-frame shutter glasses does not generalize well to more than two
users, because presenting private data to n users reduces the effective maximum
refresh rate by a factor of (1/n), causing perceptible flickering. Also, this requires
users to wear specialized goggles or headmounts, which many people find invasive.
Requiring specialized glasses may also reduce eye contact among users and thus
reduce group collaboration. The use of auxiliary displays such as PDAs and laptops
has drawbacks as well – as Shoemaker and Inkpen point out in [141], these devices do
not support the ability to provide information in visual juxtaposition with the shared
display, and thus may not be appropriate for certain types of user-specific information,
such as cursors or contextual menus, which are only relevant in relation to other items
on the main display. Collaboration may also be inhibited by the distraction of each
person looking at his individual device. Furthermore, the need to look back and forth
between the laptop/PDA and the main screen may create extra cognitive load,
reducing overall productivity. Using PDAs to convey private information also requires
users to look away from the main display to examine the PDA, thus revealing to other
users that they are examining private data.
3.2.6.2 Audio Privacyware
Multimodal SDG interfaces that use private audio channels to convey personalized
information to group members are relatively unexplored. Magerkurth et al [80]
mention that users playing their competitive tabletop computer board game wear
48
headphones to receive secret game-related data, and that informal observations of
game play suggested this was well-received by players.
The Jam-O-Drum system [16], an environment for collaborative percussion
composition, allows sound to be distributed to individual users via user-directed
speakers. The Jam-O-Drum creators mention that they tried having each drummer
wear a headset that would play their own drum music more loudly than the drum
music of the rest of the group, in order to help them better monitor their performance.
Their informal observations suggest that this seemed to reduce communication among
group members. Although the Jam-O-Drum’s negative experience with using headsets
in a groupware environment has discouraged others from pursuing this avenue, we
have found from our user experiment that the use of headsets did not impede
communication, suggesting that this idea deserves reexamination as a potential
interface. There are several differences between our system and Jam-O-Drum that
could have lead to this difference in communication levels – two of the most salient
differences are that (1) we used an earbud in a single ear to convey audio, while they
used headphones that covered both ears, which may have made it more difficult to
communicate with other group members, and (2) Jam-O-Drum continuously played
audio over all of the headphones, since audio was the focus of their application. In
contrast, users in our experiment received audio only on demand, as a means to help
them complete a multimodal task.
The Sotto Voce system [3], a museum exploration system, presents the
converse of the system described in this paper; users with private visual displays
(PDAs) can passively share audio data.
All of these different types of privacyware – shutter glasses, auxiliary displays,
physical space partitioning, and individual audio channels – have unique advantages
and disadvantages. Exploring which types of privacyware would be most applicable to
different groupware scenarios is an area that warrants further study.
3.2.6.3 Audio and Ambient Awareness
One common use of audio in groupware has been to provide people with ambient
awareness of other group members’ activities. Examples include explorations of using
49
sound to provide ambient awareness in media spaces (systems that use media such as
video and audio to create a shared “space” for distributed work groups) [143], and
using spatialized, non-speech audio to provide awareness of the activities of users
working on different segments of a very large display [98]. An avenue for future work
would be to compare our current implementation of private audio with an
implementation that included mechanisms for ambient awareness of other group
members’ activities, perhaps by mixing in portions of other users’ private sound at a
lower volume. Sotto Voce [3] and the Jam-O-Drum [16] used differential volume to
distinguish between a user’s own sounds and sounds generated by other users, but did
not explore how this awareness information altered behavior as compared to only
providing a user’s own sounds.
3.2.7 Individual Audio with Single Display Groupware: Conclusion
We have introduced a system for augmenting a shared tabletop display with individual
audio channels as a means of conveying private or personalized information to
individual members of a group. We conducted a user study with a prototype
application – SoundTracker – that utilizes private audio channels. Quantitative and
qualitative results showed that private audio, as compared to using a single set of
standard PC speakers, resulted in changes in groups’ task strategies, and did not
impede group communication. We are encouraged by these results, which suggest
potential utility in supplementing single display groupware applications with private
audio channels.
3.2.8 Discussion: Quantifying Collaboration
Based on our experiences designing and evaluating SoundTracker, we have identified
several potential methods of measuring the degree of and quality of collaboration
within the group. While Pinelle et al. [108] identify some “mechanics of
collaboration,” we have found these are not suited to the type of evaluation we are
doing, since their mechanics are intended as a “discount usability” checklist for use
during early prototyping stages, whereas we need criteria that can be
observed/measured when studying a finished design with groups of real users. We

50
therefore propose thirteen metrics that can be collected when evaluating an interface
with groups of users. We assess their reliability in quantifying collaboration, and we
discuss the practical challenges associated with collecting each metric.
Amount of talking: The percent of time a group spends talking can be a good
indicator of the degree to which they actively collaborate. While it isn’t perfect (some
key communication might occur through other channels, such as gesturing), when
combined with other measures it can be useful. The distribution of how much
individual group members talk can also be revealing – this can indicate whether the
speech is truly collaborative (e.g., all group members speak with comparable
frequency) or is simply a monologue by one individual who has taken over the task.
However, measuring the speech/silence ratio in a group environment is difficult and
subjective in practice. One possibility is to have one or more observers of the live
event (or a videotape of the event) use a stopwatch to directly collect this data.
Another possibility is automated analysis – extracting the soundtrack of a video
recording of the session and using software to determine what percentage of that
sound is silence. Both methods are challenging – using human timers is tedious and
time-consuming, while computer analysis can be difficult if there is other noise in the
environment (e.g., noise generated by the application itself or background noise such
as fans or computer humming).
Types of talking: In addition to measuring how much talking occurs, it may be useful
to break this talk down into various speech acts. An understanding of the relative
frequency of various types of speech (planning strategy, coordinating access to
resources, asking advice of other group members, etc) in the various study conditions
can contribute toward an understanding of how the technology has altered the group’s
collaborative style. A standardized list of the types of speech acts that are relevant
specifically to the study of shared-display groupware would make this process more
meaningful. Liston’s work on identifying effective techniques for information-sharing
among construction project planning teams [77] is an example of initial research in
51
this direction. She classifies meeting content as being either explanative, predictive,
descriptive, or evaluative, and explores how different proportions of these four acts
relate to meeting effectiveness.
Distribution of actions among group members: For devices that can attribute
identity to inputs (such as the DiamondTouch table, or a system with multiple mice), it
is possible to automatically record which user performed each interaction. This data
can be analyzed to give an indicator of collaboration by looking at the distribution of
touches/interactions among users. A roughly equal distribution indicates a very
different collaborative style than a distribution where one user has performed most of
the actions. This analysis can be further broken down according to the type of
interaction performed by each user, which can reveal strategies such as specialization.
Location of interactions: For devices that can associate input events with specific
users, it can be informative to analyze the location on the shared device where these
inputs occur. Do users only interact with objects that are located near them on the
table, or do they often perform actions in central regions of the table, or even in the
areas closest to other group members? Such data can be indicative of collaboration –
for instance, by revealing the presence of a shared region of the table where all users
touch.
Number of people who handle each object: Another measure of collaboration can be
the number of people that interact with key objects in the application, such as digital
photos, puzzle pieces, etc. A high score on this measure indicates that group members
passed items among each other (multiple people handle each object), rather than
working completely independently (only one user handles each object). Although this
is often a reasonable indicator of collaboration, it does not necessarily reflect other
possible methods of collaborating – for instance, instead of passing an object to other
group members, one group member might ask out loud for others to look at it, but

52
might do all of the handling of the object herself. Hopefully, this latter strategy would
then be captured by our “amount of talking” measure.
Reorientation of objects: People often orient materials such as text or images toward
others to indicate willingness to share them, as illustrated by Kruger et al.’s studies
[72]. For tabletop systems built using software such as DiamondSpin [136], which
allows arbitrary re-orientation of objects, recording how often users reorient items can
be indicative of the degree to which they are actively collaborating on those items with
other users. It is not a flawless indicator, however – in our work, we have observed
users employing several workarounds for the orientation problem, including users
rotating their heads to read sideways text alongside another user rather than
reorienting the item in question, or passing an item around the table (which could be
captured by the “number of people that handle each object” measure), or moving the
item to a central area for simultaneous viewing by all group members (which could be
captured by the “location of interactions” measure).
Task outcome: The outcome of the task the users are completing with a groupware
application can be an indicator of successful collaboration. In theory, groups that
collaborate more effectively should produce better results, since they have the input of
more people’s knowledge and skills. However, in our experiences testing tabletop
groupware we have found that this is not always the case – sometimes “too many
cooks spoil the broth,” and users “over-collaborate” by second-guessing each others’
answers, resulting in lower scores for groups that collaborated the most. This
demonstrates the need for assessing not only how much users collaborate, but also
how effectively they collaborate.
Number of corrections: The degree to which group members correct or modify their
work can be interpreted as an indicator of collaboration. In particular, we have
observed that many of the groups that collaborate effectively adopt a strategy of
double-checking pieces of a group task that have been completed by other group

53
members. This tends to result in a higher number of items that have values assigned
and then re-assigned, as compared to groups that do not collaborate closely in this
manner. This indicator is not as useful for groups that adopt a serial strategy, such as a
group where all members simultaneously focus on one item at a time. In that case,
most of the “changing one’s mind” about the correct answer occurs verbally, with the
final agreed-upon choice being assigned only once, and no subsequent checking step.
Hopefully the “amount of talking” measure would capture this difference in strategy.
Time: The time taken to complete the task is a standard measure for single-user
programs, but is not straightforward as a measure of how well groupware supports
collaboration. For instance, a longer completion time might indicate more
collaboration, as it could reflect an increased amount of time spent in discussion with
other group members, or an increase in time taken as a result of double-checking each
others’ work. However, a decrease in total time taken could also indicate high
collaboration, for example if it reflects the fact that the group developed an effective
strategy of parallelizing aspects of the task. A more effective use of time as a metric of
collaborative activity might be to examine the time spent on specific activities (e.g.,
talking, interacting with various components of the software, etc.) rather than treating
task time as a single entity.
Learning: Something which can be difficult to assess, but is a good indicator of the
collaborative benefit provided by an application, is the degree to which group
members learn from each other during the task. Lave and Wegner [76] note that the
phenomenon of legitimate peripheral participation, through which novices absorb
knowledge and skills from observing the actions of more experienced co-workers, can
be an important learning mechanism. If relevant for the chosen task, the degree to
which users learn from working with others could be assessed through pre- and post-
task questionnaires or interviews.

54
Self-reports: One lightweight method of ascertaining the amount and quality of
collaboration is to ask group members themselves, either through post-task
questionnaires or through interviews. This subjectively-quantified data can be useful,
especially as a means for evaluating how some of the more speculative quantitative
measures apply to particular tasks and groups.
Strategy type: Understanding the impact of interface design on collaborative styles is
challenging; coming up with a standardized taxonomy of SDG work strategies would
be useful in this regard. In our usability studies, group work strategies could be
classified roughly into one of three categories: parallel (all group members perform
similar actions in parallel), serial (all group members focus together on one item at a
time), and assembly-line (all group members work in parallel on different aspects of
the task). It is not necessarily clear that any of these basic strategies is more or less
collaborative than others in general, although some might be more effective for a
particular task.
A challenge for tabletop UI researchers, as a group, is to begin to develop standard
methods of measuring and classifying collaborative activity that can ultimately make
knowledge transfer and results-sharing more effective for the CHI and CSCW
communities.
3.3 Integration with Auxiliary Devices
This chapter focuses on techniques for supplementing shared tabletop displays with
personal and private content. Section 3.1 explored techniques for limiting access to
items on the tabletop, and section 3.2 introduced a technique for supplementing a
tabletop with personal audio content. We now turn our attention to a third technique
for incorporating private and personal content into a shared tabletop system: allowing
users to transfer content between small, personal devices and the shared, public
display.

55
Piles Across Space (PAS) is a system that allows PDA users to create virtual
piles of content (e.g., photo thumbnails or other iconic file representations) that reside
off-screen in order to address the clutter problem for small display devices. These
piles can be created dynamically by flicking information items to them with a stylus,
indicating the off-screen area in which the piles conceptually reside. A separate
publication examines single-user interaction with the PAS system [61]. This section
describes an extension of PAS that supports co-located collaboration. Co-located
groups can move piles of information items to and from a tabletop display to enable a
back-and-forth workflow between the private PDA space and this public display area.
Note that this work involved the creation of a prototype system demonstrating
the concept of sharing piles of content between PDAs and a table; however, there has
not been any formal usability testing or evaluation of the PAS + Table system.
Figure 17: Three users by the tabletop display. The center user has transferred content
from her PDA to the table to share with her coworkers.
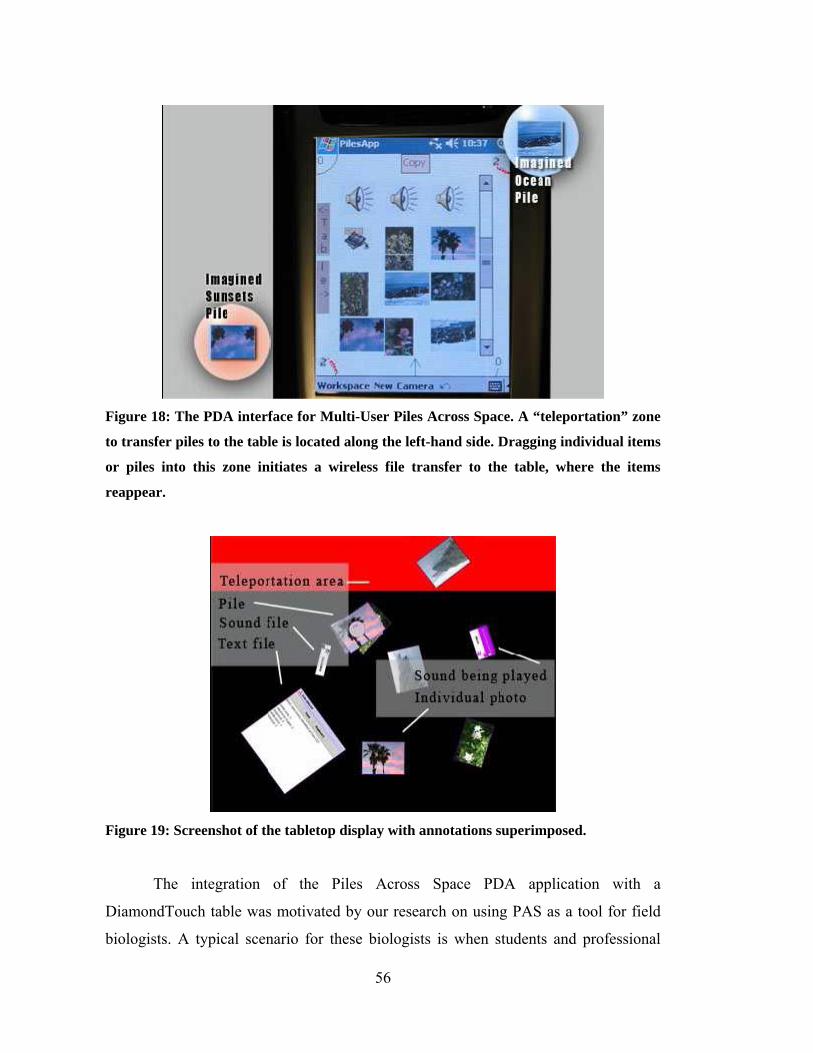
56
Figure 18: The PDA interface for Multi-User Piles Across Space. A “teleportation” zone
to transfer piles to the table is located along the left-hand side. Dragging individual items
or piles into this zone initiates a wireless file transfer to the table, where the items
reappear.
Figure 19: Screenshot of the tabletop display with annotations superimposed.
The integration of the Piles Across Space PDA application with a
DiamondTouch table was motivated by our research on using PAS as a tool for field
biologists. A typical scenario for these biologists is when students and professional
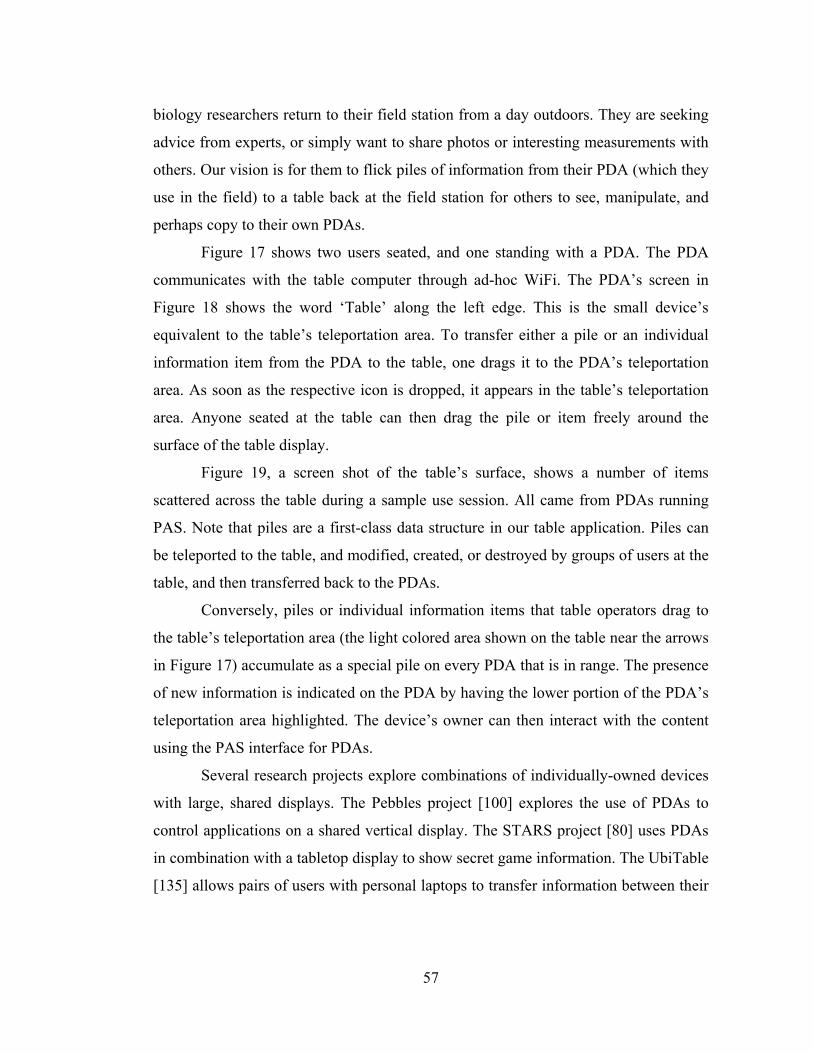
57
biology researchers return to their field station from a day outdoors. They are seeking
advice from experts, or simply want to share photos or interesting measurements with
others. Our vision is for them to flick piles of information from their PDA (which they
use in the field) to a table back at the field station for others to see, manipulate, and
perhaps copy to their own PDAs.
Figure 17 shows two users seated, and one standing with a PDA. The PDA
communicates with the table computer through ad-hoc WiFi. The PDA’s screen in
Figure 18 shows the word ‘Table’ along the left edge. This is the small device’s
equivalent to the table’s teleportation area. To transfer either a pile or an individual
information item from the PDA to the table, one drags it to the PDA’s teleportation
area. As soon as the respective icon is dropped, it appears in the table’s teleportation
area. Anyone seated at the table can then drag the pile or item freely around the
surface of the table display.
Figure 19, a screen shot of the table’s surface, shows a number of items
scattered across the table during a sample use session. All came from PDAs running
PAS. Note that piles are a first-class data structure in our table application. Piles can
be teleported to the table, and modified, created, or destroyed by groups of users at the
table, and then transferred back to the PDAs.
Conversely, piles or individual information items that table operators drag to
the table’s teleportation area (the light colored area shown on the table near the arrows
in Figure 17) accumulate as a special pile on every PDA that is in range. The presence
of new information is indicated on the PDA by having the lower portion of the PDA’s
teleportation area highlighted. The device’s owner can then interact with the content
using the PAS interface for PDAs.
Several research projects explore combinations of individually-owned devices
with large, shared displays. The Pebbles project [100] explores the use of PDAs to
control applications on a shared vertical display. The STARS project [80] uses PDAs
in combination with a tabletop display to show secret game information. The UbiTable
[135] allows pairs of users with personal laptops to transfer information between their

58
own devices and a shared tabletop display. Piles are not the central data structure in
that work.
This work addresses the issue of integrating public and private information in
tabletop groupware systems by demonstrating a technique for teleporting piles of
multimedia content between PDAs and a shared tabletop display.

59
4 Managing Display Elements
Efficient use of screen real-estate is a challenge for all SDG systems, but this is
particularly true for tabletop systems where all group members are likely to participate
in interactions. Displaying items of group interest and items relevant only to individual
users, as well as displaying multiple copies of basic GUI widgets (i.e., a copy of a
menu in reach of each user) can lead to cluttered displays. Horizontal displays further
complicate matters by introducing the need to orient information to maximize
readability by users on different sides of the display [136]. We explored widget
placement and clutter-reduction techniques for tabletop displays.
Section 4.1. presents a user experiment comparing two alternative widget
layouts for a tabletop system: a single, shared set of controls (e.g., menus and buttons)
located centrally so as to be accessible to all group members, and a set of controls
replicated around each edge of the table. We describe the tradeoffs of these two design
alternatives, and the impact of each design on various aspects of collaboration.
Section 4.2 presents an exploration of whether input manipulables (in this case,
tokens used to visually specify Boolean queries) should be interpreted collectively
(e.g., all user’s tokens contribute to a single state) or in parallel (e.g., interpret the
configuration of each user’s inputs separately).
Section 4.3 looks at how individually-targeted audio can be used to reduce
clutter on a tabletop display and as a means of avoiding orientation-based legibility
issues. This builds on the audio privacyware system introduced in section 3.2.
Section 4.4 describes Drawers, a system for reducing clutter on a tabletop
display by providing virtual storage areas for each user. The information stored in

60
drawers can be transferred between different tables, and used across a variety of
applications.
Section 4.5 explores design issues relevant to the design of peripheral or
ambient displays that take advantage of tabletop technology, and section 4.6 discusses
projects that were collaborative efforts with researchers from MERL (Mitsubishi
Electric Research Laboratories): Chia Shen, Kathy Ryall, Frederic Vernier, and
Clifton Forlines. In that section, we present the DiamondSpin toolkit, which simplifies
the construction of tabletop interfaces and employs a Polar-coordinate programming
model to support orientation-independent interfaces.
4.1 Centralized versus Replicated Controls
Single display groupware (SDG) systems [150], such as interactive tabletops, support
group work by allowing multiple people to work together with a shared context, thus
facilitating communication and productivity. However, designing single display
groupware involves many challenges. For instance, there is potential for clutter due to
representing information of interest to multiple participants, such as multiple copies of
control widgets or more than one cursor (note that the need to represent cursors can be
removed through the use of direct-touch surfaces, such as the DiamondTouch device
used in our experimental setup).
Interactive tables are an increasingly popular form of single display groupware
that support face-to-face social interaction. There are toolkits available to simplify
development of tabletop CSCW applications, such as DiamondSpin [136] and the
DiamondTouch Toolkit [30]. These toolkits enable the construction of many interface
styles, but provide no guidance as to which design choices are preferable for a
particular application or audience.
In this section we explore an issue that is relevant to designers of tabletop
groupware – deciding how many copies of basic interaction widgets to create, and
how to position them on the shared display. We compare two endpoints on the
spectrum of control placement possibilities: we provided groups with either a single,
shared set of control widgets in the center of the tabletop or displayed a separate set of

61
controls in front of each user (still on the shared tabletop display). These controls were
menu-like widgets that allowed users to select labels for digital photos. We evaluated
the differences between the centralized-controls and replicated-controls designs for
TeamTag, a system for collaborative photo annotation.
4.1.1 The TeamTag System
Figure 20: Four users sit around a DiamondTouch table to label photos using TeamTag.
4.1.1.1 Motivation
The increasing popularity of digital photography, which allows users to capture very
large numbers of images, has increased the need for photo-labeling applications. These
applications, which include commercial systems such as Adobe Photoshop Album4
and research systems such as PhotoFinder [140], allow users to associate custom
4 http://www.adobe.com/products/photoshopalbum/main.html

62
metadata with their digital photos. Emerging online services, such as Flickr5 allow
multiple, remote users to collectively annotate photos with free-form tags. This
metadata is useful for enabling search of photo collections. TeamTag (see Figure 20)
is a tabletop photo-labeling application that allows groups of up to four co-located
users to collaboratively associate custom metadata with digital images.
Current photo-labeling software is designed for a single user at a traditional
PC. However, this is a task that can benefit from a collaborative interface, both for
entertainment and efficiency purposes. Labeling a set of vacation photos together as a
family could be an enjoyable activity that promotes reminiscence of a shared
experience; the group effort could also speed up labeling and result in a more
complete set of labels (e.g., Dad forgets the name of a landmark shown in one photo,
but Mom remembers it). Collaborative photo-labeling is also useful beyond the realm
of personal collections – it can be an important part of productivity and educational
activities. For example, field biologists at Stanford university find it useful to help
each other label photos taken on research expeditions. Collaboration allows each
biologist to contribute her specific expertise in identifying the species and equipment
depicted in the photos. In our exploration of design variants of TeamTag, we used a
photo-labeling scenario inspired by a productivity/educational scenario, rather than
personal photo collections, so that we could ask a number of users to interact with the
same content.
In the process of developing TeamTag, we faced a design dilemma: should the
system display a single copy of the labeling widgets for all four users to share, or
should it use additional screen space (which is a precious resource in an SDG system)
to provide each group member with his own widget set? This question is relevant to a
variety of tabletop groupware applications and is a step toward exploring the broader
question of how to balance the needs of individuals versus the needs of the group as a
whole in the design of single display groupware. The issue of balancing individual-
oriented versus group-oriented interface needs has been considered in the context of
distributed CSCW systems [50], but the design suggestions for distributed systems are 5 http://www.flickr.com/
63
not directly applicable to co-located SDG. This particular design issue is especially
relevant for tabletop interfaces, since the underlying hardware (such as the
DiamondTouch [31]) allows truly simultaneous interaction by several users, and since
direct-touch interaction makes reachability an issue, thus making multiple copies of
interaction widgets potentially more appealing, despite the additional screen space
they occupy.
The remainder of this section explores this issue in depth. This exploration is
situated in the context of the TeamTag application, but collaborative photo-labeling
applications themselves are not the focus of this work.
4.1.1.2 Infrastructure
The TeamTag application was prototyped using the standard experimental setup of
DiamondTouch + DiamondSpin, described in section 2.3.1. Input to the system
includes a set of digital photos and a text file containing categories of metadata that
should be associated with the photo collection. Metadata assignments can be exported
automatically to a spreadsheet or other generic format, so that they can be available for
search or as input to other applications.
4.1.1.3 Two Candidate Interface Designs
We have explored two alternative designs for TeamTag. The two interface designs –
centralized and replicated control placement – are related to the choice between
designing groupware interfaces that lend themselves to either more closely-coupled or
more loosely-coupled group work.

64
Figure 21: This screenshot shows the “centralized controls” version of the TeamTag
interface. Each circle represents a category of metadata, with each sector displaying a
label from that category. All four users share this set of annotation controls. The control
displaying four labels from the “diet” category has been enlarged for readability in this
document. Photos can be freely moved around the tabletop.
The “centralized-controls” design (see Figure 21) places the metadata in the
center of the table. Each metadata category is materialized as one circle in the central
region. Each circular widget is subdivided into sectors, with each sector corresponding
to one possible value of the respective category. For example, one of the circular
controls represents the category of “habitat,” with sectors corresponding to “desert,”
“ocean,” “grasslands,” “forest,” etc. The text label of each sector faces the circle’s
outer edge. We chose to orient the text in this manner in order not to bias the interface
toward favoring any particular side of the table. Users in this design freely distribute
photographs around the perimeter of the table by dragging them with their fingers. The
orientation of a dragged photo changes dynamically to face the user at the closest table
edge. A user creates an association between a photo and metadata by tapping her
finger on a photo, thereby selecting it. Any circle sector that this user subsequently

65
touches triggers an association of that metadata with her selected photograph. A user
can therefore associate several metadata values with the selected photo by tapping
rapidly on sectors of each of the circular widgets. For example, a user touches a photo
of baboons that is on the table. The photo highlights to indicate it is selected by that
user. Then the user sequentially touches multiple attributes that are to be associated
with the chosen image. For example, she might touch “omnivore,” “Africa,” and
“grasslands” to indicate the diet, location, and environment of the baboons. Other
users can select other photographs and construct associations at the same time; the
circle sectors are large enough to fit several fingers at once, and the user-identification
features of the DiamondTouch table are used to insure that simultaneous actions are
resolved in the appropriate way (e.g., the labels Mary touches are applied to her
currently-selected photo and the labels Jack touches are applied to his currently-
selected photo).
In contrast to the photos, the circular controls are stationary. A user can rotate
a circle with his finger (in the same manner as one would use a rotary phone dial),
which turns the circle about its center point, thus allowing a user to view different
parts of the text right-side-up if he desires. The control rotates back to its original
position when the user removes his hand.
The “replicated-controls” design (see Figure 22) inverts the location of photos
and metadata. Photos are located in the central area of the table, while metadata
categories and values are arranged in a series of rectangular controls around the table’s
edge. Each rectangle stack corresponds to one of the circular widgets from the
centralized-controls design, with each constituent element of a stack corresponding to
a possible value for the category. For each category, four copies of the rectangle are
displayed, one on each side of the table. The text in each rectangle is oriented toward
the side of the table that it faces. As in the first design, this “replicated-controls”
version allows photos to be dragged, but the metadata widgets remain stationary.

66
Figure 22: This screenshot shows the “replicated controls” variation of the TeamTag
interface. Each rectangle represents a category of labels, with each subdivision
displaying a label from that category. The rectangles for each category are replicated for
each user. One copy of the control displaying four labels from the “diet” category has
been enlarged for readability in this document. Photos can be freely moved around the
tabletop.
With either design, a user may inspect an image’s metadata by touching the
photo with two fingers, which opens a popup window rooted to that image. The popup
lists the current metadata categories and values associated with that photo. The text of
a popup is oriented to face the nearest table edge. Popups may be dragged around the
table for easier viewing or sharing with other users; they automatically re-orient their
text to align to the nearest table edge.
4.1.1.4 Design Considerations
When designing the TeamTag software, the choice between centralized or replicated
arrangement of the labeling controls was not clear – there were several issues we
hoped to clarify through user testing:

67
Which design best facilitates collaboration? A potential strength of the
centralized-controls scheme is a shared focus of attention on the controls, which could
result in increased collaboration. This scheme may also promote incidental learning
[76], due to the increased visibility of other group members’ labeling choices, and may
reduce errors by increasing the likelihood of noticing when a teammate mislabels an
item. Conversely, the replicated-controls design emphasizes a shared focus on the
photos (by locating them centrally), which is also desirable.
Will the oddly-angled text on the centralized controls reduce usability? Unlike
in the replicated-controls design, the display text on the shared, centralized controls is
not right-side-up for all users.
Which design uses screen real-estate more effectively? Although the
centralized controls take up a smaller proportion of screen real-estate than is required
to copy each control four times in the replicated-controls design, the center-of-the-
table space that they occupy might be more valuable.
Will users prefer one design over the other? Although each of the designs
offers the same functionality, does the variation in the placement of control widgets
impact usability and user preferences?
Will the placement of the controls impact comfort? The centralized design
requires users to reach farther in order to tag photos, which could impact task speed as
well as be a source of discomfort. However, in the replicated variation, users must
place the photos farther from themselves, creating similar ergonomic difficulties.
As a result of the variation in placement of the shared and replicated controls,
we needed to alter related aspects of these widgets, such as the orientation of the text
they displayed and the widget shape. In the replicated-controls condition, it is logical
that the text on the widgets be oriented toward the person for whom those controls are
intended. However, in the centralized-controls condition, having all of the text
oriented in a single direction would have biased the controls to be more useful for one
of the four group members. Having the orientation of the text change automatically to
face the currently-interacting user would also not be a viable design, since the
DiamondTouch permits all four group members to simultaneously interact with the

68
same widgets. Thus, we chose to orient the text on the centralized controls outward
(and thus to design the widgets with a circular shape), to avoid biasing them toward
one particular group member. We chose not to use this circular shape in the design of
the replicated controls, however, since one drawback of replication is that it uses
additional screen real-estate. Therefore, in order to avoid unnecessarily handicapping
the replicated-controls design, we chose a rectangular shape that minimized the space
occupied by each widget. Previous comparisons between pie-shaped and rectangular
menus [23] have found that users are evenly split in their preference for the two
widget shapes; because this prior work implies that it is unlikely that preference would
be biased toward either the circular or rectangular shape, we felt the use of different-
shaped widgets was justified to avoid the potentially larger confounds of biasing the
interface toward a single member of the group by using rectangles for the shared
widgets, or of handicapping the replicated widgets by using less space-efficient
circles.
4.1.2 Evaluation
Twenty-four paid subjects (sixteen male, eight female) participated in the evaluation
of the centralized and replicated-controls design alternatives of TeamTag. Subjects
ranged in age from seventeen to forty-five years old. Subjects were divided into six
groups, with four users in each group. The study had a within-subjects design – each
group used both interfaces (centralized controls and replicated controls), in a balanced
order.
Additionally, subjects experienced a third experimental condition where they
used a tablet PC version of TeamTag. This third interface did not use an interactive
table; rather, each group member had their own tablet PC. Each tablet contained a
copy of all of the labeling controls, and distribution of the photos amongst the four
users’ tablets was coordinated over a wireless network. This tablet PC interface
differed too greatly from our tabletop interface designs to allow for meaningful
comparisons. As all conditions were counter-balanced, elision of the third condition
should not have an impact on the observed differences between the centralized and
replicated conditions. Thus, this chapter compares only the two tabletop interfaces.

69
TeamTag was instrumented to record all interactions (e.g., who touched where
at what time). Additionally, users completed a questionnaire after the study that
contained both free-form and Likert-scale questions. We also collected observational
data, both from live observation of the experiments and from analysis of video
recordings.
To have a photo-labeling task that could be held constant across several groups
of users, we chose a set of images and metadata that could be labeled based on
everyday knowledge, rather than using personal photo collections that required user-
specific information or authentic bio-diversity field photographs that required
specialized training to classify. The images were of various common and exotic
animals, such as one might see on a trip to the zoo, and the metadata that needed to be
applied were items such as the type of animal (mammal, reptile, bird, insect, etc.), the
animal's diet (omnivore, herbivore, carnivore), the terrain where the animal was found
(grasslands, forests, desert, etc.), and other categories of comparable difficulty. The
content was designed to be within the normal trivia and reasoning ability of most
people, but challenging enough that assistance from other group members would be
helpful.
Subjects were told that their group’s goal was to label each photo with the
appropriate values for each of the metadata categories presented. Before each
condition, groups had a tutorial in which the features of the interface were
demonstrated and they were allowed to practice and ask questions about the interface.
The tutorial used a different set of images and categories than those used in the study
conditions.
For each study condition, groups were given twenty images to label. They
were given a different set of images for each condition. Subjects labeled two sets of
images with each interface – for one set they had six different categories of metadata
to add, and for the other set they had only three metadata categories to add to each
image. The order of image sets, number of categories, and condition was counter-
balanced among groups using a Latin Square design.
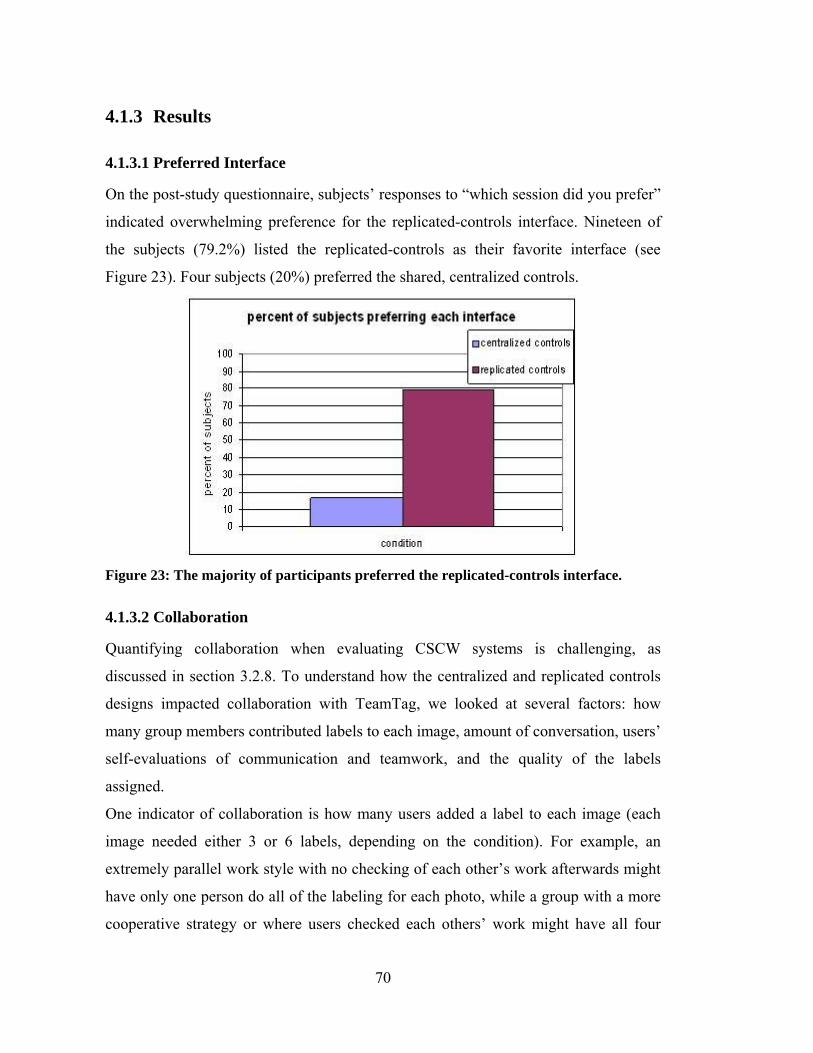
70
4.1.3 Results
4.1.3.1 Preferred Interface
On the post-study questionnaire, subjects’ responses to “which session did you prefer”
indicated overwhelming preference for the replicated-controls interface. Nineteen of
the subjects (79.2%) listed the replicated-controls as their favorite interface (see
Figure 23). Four subjects (20%) preferred the shared, centralized controls.
Figure 23: The majority of participants preferred the replicated-controls interface.
4.1.3.2 Collaboration
Quantifying collaboration when evaluating CSCW systems is challenging, as
discussed in section 3.2.8. To understand how the centralized and replicated controls
designs impacted collaboration with TeamTag, we looked at several factors: how
many group members contributed labels to each image, amount of conversation, users’
self-evaluations of communication and teamwork, and the quality of the labels
assigned.
One indicator of collaboration is how many users added a label to each image (each
image needed either 3 or 6 labels, depending on the condition). For example, an
extremely parallel work style with no checking of each other’s work afterwards might
have only one person do all of the labeling for each photo, while a group with a more
cooperative strategy or where users checked each others’ work might have all four

71
users contribute labels to each image. For the table with replicated controls an average
of 1.24 users contributed labels to each image. This number was significantly higher
(t(5)=3.55, p<.02) with the centralized-controls interface, with an average of 1.56
users contributing metadata to each photo.
Automated analysis of the soundtrack from the video recordings of each session
found that groups spent 44.7% of each session conversing with each other when using
the shared controls, and 42.4% of the time talking to each other when using the
replicated controls. There was no statistically significant difference between these two
levels of conversational activity.
A free-form question asked subjects to describe the level and quality of their
communication with their group in each condition. Subjects distinguished little
between the two conditions as to which facilitated more communication. This feeling
was reflected in subjects’ 7-point Likert scale (7 = strongly agree, 1 = strongly
disagree) responses to the statement “I felt that my group worked closely as a team”
for each condition. The means for centralized-controls and replicated-controls (5.63
and 6.00, respectively) were not significantly different.
We initially hypothesized that subjects might be uncomfortable with the shared
controls because the central location of the controls might subject their labeling
behavior to more scrutiny from the team – e.g., they might be more embarrassed if
they mislabeled something since it would be more likely that someone would notice
the labeling action if it occurred in the center of the table. The questionnaire asked
users if they felt hesitant guessing when they were unsure of the answers in each
condition. Participants indicated they felt more comfortable guessing with more
distributed controls, as reflected by giving a mean score of 4.38 for the centralized
controls and 4.17 for the replicated controls, indicating a greater hesitance to guess
with the centralized design. However, although these scores trended in the direction
we expected, the differences were not statistically significant.
Task outcome is another indicator of collaborative success. Increased
collaboration could help groups label more of the images correctly. However, this may
not have been true for our task, since subjects had not studied animal facts beforehand

72
and so random variation in groups’ a priori knowledge of the chosen subject matter
likely overshadows any impact of the interface on accuracy of the labeling.
Performance in each condition was similar, with mean scores of 65.6% of metadata
assigned correctly with the centralized controls and 66.9% in the replicated-controls
condition.
4.1.3.3 Co-Touching
Even though the DiamondTouch hardware and TeamTag software support concurrent
touches by multiple users, and the shared circular widgets were large enough to fit
several fingers on a single sector, subjects were hesitant to simultaneously touch the
shared circular controls. For instance, we observed one user reaching toward the “diet”
category control, but when another user touched it, he immediately withdrew his hand,
hovering nearby and waiting for her to complete her action before he began. The
hesitance of users to “collide” with each other when using the centralized controls was
evidenced by the lack of co-touching on these shared widgets. Across all six groups,
there were a total of only thirteen co-touching events (where a co-touch is defined as
more than one user touching the same control within .5 seconds of another user). Thus,
co-touching represented only 0.9% of the 1,372 total touches across all groups of the
centralized controls.
Subjects had space on the post-study questionnaire for unstructured responses to
questions, such as explaining why they liked or disliked a particular interface. One
recurring theme in these free-form responses was participants’ discomfort with the
possibility of accidentally bumping or touching other users’ hands when using the
shared set of centralized controls. Ten of the twenty-four questionnaires (41.7%)
mentioned this in the free-form comments, even though there was no question
specifically about this topic. For example, one subject said that he preferred the
replicated-controls over the centralized-controls because “our hands didn’t go on top
of each other.”
Although groups mainly used a parallel strategy where each group member
would simultaneously label photographs, one group used an assembly-line strategy
with the centralized controls, as a means of avoiding the problem of having to collide
73
hands with other users. They took each image and passed it clockwise around the
table, and each user was then responsible for adding the metadata from the controls
nearest him. A second group discussed using an assembly-line strategy for the shared
controls, but ultimately decided on the parallel strategy because some group members
felt that they were not knowledgeable enough about the metadata categories that
happened to be located nearest them.
4.1.3.4 Orientation of Information
Despite the fact that users often commented that the ability to rotate the circular
widgets with a “rotary phone” interaction in order to view text right-side-up was
“cool” or “neat” when it was demonstrated to them in the tutorial, they rarely made
use of this capability – each user performed an average of 1.9 rotations during the
study.
The unimportance of viewing the labels right-side-up was further supported by
the questionnaire responses. The statement “I found it useful to be able to rotate the
circles” received a mean score of 3.0, which falls on the “disagreement” end of the 7-
point Likert scale. We found this surprising, since we had anticipated that subjects
would not want to read text upside-down and might use the rotation to alleviate this
difficulty. The one subject who rotated the circles frequently (15 times during the
session) was also the only non-fluent English speaker in our study. For someone
unfamiliar with the language, the ability to view text right-side-up seemed more
desirable. Since the terms were already familiar to subjects (they saw the same
categories in each condition, and were familiarized with the potential categories
during the initial instructions for the experiment), they probably were able to rely on
recognizing words at a glance, as opposed to needing to read them each time, thereby
lessening the importance of the text’s odd orientation. Users were more likely to rotate
the controls during the beginning of the condition (76.1% of rotations occurred during
the first half of each session), implying that as subjects memorized the labels, there
was less need to re-orient them for reading.
Users also did not seem to mind reading rotated text in the popups that displayed
currently-assigned metadata – 57.1% of all popups were opened outside of the
74
initiating user’s table quadrant, which meant the text would have been oriented away
from that user. However, only 47.4% of popups that were opened outside of a user’s
quadrant were subsequently dragged (dragging the popup into a user’s quadrant would
result in the text becoming re-oriented to face that user). This indicates that 27.1% of
all popups invoked during the study (395 out of 1,459) were not displayed right-side-
up for the invoking user. This suggests that reading text at odd orientations may not be
as problematic an issue for tabletop interfaces as was initially thought, at least for
relatively short text segments that remain fixed throughout a use session.
Orientation of the images did not seem to be an issue either. While it was very
common for a user to drag a photo into the center and then ask other group members
to look at it to help her answer a question, this image would still only be right-side-up
for one of the users. Only on rare occasions did users then pass the image around so
that they could each see it right-side-up – they seemed to do this when the image was
particularly tricky to recognize, such as when one group passed a photo of a platypus
to each group member in turn, because nobody was able to identify it.
4.1.3.5 Table Regions
As noted in other studies of tabletops, such as Ryall et al.’s work [125], users
displayed a strong tendency toward not touching regions of the table that were closest
to other group members, perhaps because of informal social rules that suggest that the
region in front of each user is for her personal use, while the center of the table is a
shared region [132].
The central region of the table was clearly important to users. Although people
generally kept an image they were working with on the part of the table nearest them,
they used the center as a group area. Groups used the center both as an area for
directing group attention, by frequently dragging an unidentified photo into the center
and then asking other group members for their opinion on what it might be, and also as
a place where groups placed photographs that everyone agreed were properly tagged.
Despite the fact that in the centralized-controls condition the center of the table was
largely occupied by the control widgets, this shared central area was so important to
75
users that they still used the small amount of space between all of the circular controls
as a place to put these focal images and “finished” piles.
The questionnaire asked users to indicate on a 7-point Likert scale whether they
felt either of the tabletop interfaces seemed cluttered. We hypothesized that subjects
might find the centralized-controls interface more cluttered, since it took up valuable
center-of-the-table real-estate. Although the responses trended in this direction, there
was no statistically significant difference, with a mean score of 4.21 for the centralized
controls, indicating more agreement that the table seemed cluttered than the mean of
3.42 for the replicated controls.
4.1.3.6 General Usability
We were pleased that subjects found both interfaces easy to learn, indicated by their
agreement with the statement “I found it easy to learn how to label photos” for each of
the interfaces (mean of 5.75 and 6.33 for centralized controls and replicated controls,
respectively, on a 7-point Likert scale). It was also encouraging to note that the
groups’ discussions focused on the task and not on the interface – the most common
type of speech was asking other group members if they knew the appropriate metadata
for a particular image.
4.1.4 Discussion
Based on the quantitative and qualitative results of our user study, we can revisit the
design questions that we initially posed:
Which design best facilitates collaboration? Although we expected that the
centralized controls would facilitate more collaboration than the replicated set, there
turned out to be little difference between the two interfaces in this regard. The two
interfaces were statistically indistinguishable on all but one of our measures of
collaboration (the centralized controls resulted in more contributors per image than the
replicated set).
Will the oddly-angled text on the centralized controls reduce usability?
Although we initially thought that readability of oddly-angled text might be a large
factor in making the centralized controls unappealing, from our study we learned that

76
this was not a major consideration for applications where the angled text consists of
relatively short strings that remain constant throughout a session, although other work,
such as that by Kruger et al. [72], has shown that proper orientation can be important
for longer documents. Recent work by Wigdor and Balakrishnan [178] suggests that
deviations from upright orientation impact reading performance only slightly on
tabletop interfaces, a finding confirmed by our results.
Which design uses screen real-estate more effectively? Even though the
centralized-controls scheme devotes fewer pixels to the control widgets than
replicating them for each user, their occupation of the valuable center-of-the-table
space was problematic, perhaps because it violated users’ tendencies to establish
personal “territories” [132] around the table, and because it reduced the availability of
the central region for accomplishing shared tasks, such as examining difficult-to-
identify photos.
Will users prefer one design over the other? Users had a clear preference for
the replicated-controls interface.
Will the placement of the controls impact comfort? Reach distance did not play
a major role in the usability of either interface. Although the tabletop was large, the
center of the table was easily within arm’s length of most adults. Although none of the
users complained that the centralized controls were difficult to reach, many users felt
socially uncomfortable about the forced physical proximity of using the shared set of
widgets. This negative response to co-touching echoes findings in the area of
proxemics (the study of personal space) [52].
In this study we did not assess the impact of the interface on incidental
learning, although we hypothesize that the centralized controls, by increasing the
visibility of others’ actions, might better facilitate peripheral awareness. Incidental
learning and awareness may also be facilitated with the replicated-controls interface
by using controls that display feedthrough based on other group members’ interactions
with their copies of each widget, such as those provided by the MAUI groupware
toolkit [56].

77
One limitation of this study was in the composition of our subject groups,
which was random; group members did not know each other prior to the study. In
many real-world applications, however, group members working together at a tabletop
would have a higher degree of familiarity. As a result, the aversion to co-touching that
made the shared controls unpopular with our test population may be less of an issue
for many common use cases. The acceptability of co-touching likely varies with task
type, as well. For example, it would probably be more acceptable for a game to
involve the “risk” of co-touching, than for a productivity application.
Exploring additional variations of the widget-layout design space (e.g.,
repositionable and/or collapsible widgets) also merits further attention. In this study,
we intentionally chose the fixed-location widgets in order to facilitate understanding
the endpoints of the control-placement spectrum (allowing users to choose the widget
placement themselves would have inhibited our ability to contrast these divergent
design choices). However, further work to separate out the effects related to the
number of copies of the controls (shared versus replicated) from the effects related to
the placement of the controls (center versus borders) would provide additional insight
into this issue. One design we did not explore was “hideable” widgets, which might
appear and disappear, or grow and shrink based on use frequency. Because the tags in
the labeling widgets were accessed repeatedly and frequently, requiring users to locate
and/or open the widgets would have resulted in an undesirable tradeoff of task time for
increased screen space.
Our study presents an initial exploration of the tradeoffs in deciding whether to
use replicated or shared widgets for co-located tabletop applications. Because tabletop
technology has only recently been introduced, there is currently a dearth of published
advice available to guide the design of multi-user tabletop interfaces. The aim of this
study is to increase awareness about the subtle design decisions that can impact the
usability and acceptability of tabletop interfaces. We hope that our initial experiences
and findings in this area provide a jumping-off point for additional detailed
exploration of basic tabletop interface design issues.

78
Based on our study of the centralized- and replicated-controls variants of
TeamTag, we offer suggestions relating to two aspects of tabletop interface design:
control replication (i.e., how many copies of control widgets should appear on the
table) and control location (i.e., where on the table control widgets should be placed).
4.1.4.1 Design Guidelines: Control Replication
Our experience with TeamTag suggests that creating multiple copies of frequently-
used controls (one copy per user) is a good design strategy. Even though replicating
controls uses additional screen real-estate, it alleviates users’ proxemic and hygienic
concerns that can result from control sharing. However, the generalizability of this
advice depends on both task type and group composition.
The photo-labeling task supported by TeamTag enabled a high degree of
parallel activity. Tasks that engender a less parallel work style might encounter less
difficulty with a shared-controls interface, since the incidence of simultaneous control
access by multiple individuals would be far lass likely, thus reducing the potential for
problematic co-touching incidents. TeamTag’s content also modeled a
productivity/education-oriented task (i.e., the photos labeled were from a collection
relating to classifying fauna rather than a collection of personal photos). We
hypothesize that the intimate proxemics of shared controls may be considered more
acceptable in the context of entertainment/socially-oriented tasks, such as tabletop
games.
In addition to the formality of a task and the work style it engenders, the
composition of a group can also impact the acceptability of a tabletop interface that
uses shared, rather than replicated, controls. In our evaluation of TeamTag, group
composition was random – group members did not know each other prior to the study.
In many real-world applications, however, group members working together at a
tabletop would have a higher degree of familiarity. As a result, the aversion to co-
touching that made shared controls unpopular with our test population may be less of
an issue for applications whose target user population is more closely-knit groups.
79
4.1.4.2 Design Guidelines: Control Location
Based on our comparison of variants of the TeamTag interface, it seems preferable to
design tabletop UIs that locate controls near users’ seats, thus leaving the center of the
table open. This central space is then available to users for a variety of communicative
purposes (e.g., as a focal area for items currently being discussed, or as a storage area
for organizing sets of related objects). However, we qualify this recommendation by
noting that certain aspects of task type or physical configuration may make controls
located along a table’s edges less optimal.
The photo-labeling task studied was one in which all data on the table was
public (i.e., there were no objects on the table that were restricted for use by only a
single member of the group). However, some tabletop tasks involve the presence not
only of public data, but also of individually-owned materials. Scott et al.’s
observations of traditional table use [132] show that people prefer to locate personal
and private materials along the edges of the table nearest their seats. Thus, a tabletop
UI that locates controls in front of users’ seats might reduce the available table-edge
screen real-estate for storage of personal materials, and applications that involve a
large amount of data of this type may find centrally-located controls to be preferable.
The physical configuration of a tabletop workspace also impacts the
preferability of different control-location schemes. In particular, very large table sizes
(e.g., interfaces for conference-room sized tables) further reduce the desirability of
centrally-located controls since they may be physically unreachable by users. Single,
shared copies of controls that have been located near the table’s edge in order to
preserve the availability of the central region would be similarly problematic for users
located at a distant end of a very large table. Re-locatable controls, rather than controls
that remain fixed in place, might be preferable in such an environment.
4.1.5 Related Work
The introduction of new touch-sensing technologies such as DiamondTouch [31] has
facilitated research on tabletop interfaces for supporting collaborative work, such as
SoundTracker [90], evaluations of the impact of group size and table size [125], and

80
DiamondSpin [136]. However, none of these interfaces deal with issues of centralized
versus replicated placement of controls. The Personal Digital Historian (PDH) [134] is
a tabletop system that allows a co-located group of users to search through and discuss
a collection of digital photos. PDH allowed users to replicate menus around the edge
of the table, but did not compare this choice in menu placement to other alternatives.
Also, since simultaneous multi-user interaction was not possible with that system (the
PDH project used a single stylus for interaction, which had to be shared among group
members), the issue of shared versus replicated controls was not as relevant (i.e., the
impact of this design choice on parallel work styles was not applicable). Other CSCW
systems for photo management, such as Crabtree et al.’s work [27], focus on
distributed interfaces, while our work focuses on co-located systems. The focus of the
TeamTag work is not on interfaces for digital photo management; rather, we use a
digital photo management application as a motivating example and vehicle for
studying the more general issue of control placement on tabletop displays.
Although some systems such as Pebbles [100] and STARS [80] use distributed
controls via PDAs in combination with single-display groupware [150], these projects
do not explore how a shared-controls design would affect their systems. In contrast,
we have presented two designs – shared, centralized controls and replicated controls
on a single display – and empirically evaluated their impact on group dynamics and
productivity. Sharing a single display is important for a number of applications. For
example, Scott et al.’s research on educational game software for children [130] has
found that children playing in pairs found it easier to work and form shared
understandings when using a single monitor rather than two separate monitors. Our
work focuses specifically on the issue of widget placement for small-group
interaction, and does not replicate the entire application on separate displays for each
user.
The topic of widget placement for single display groupware is raised by
Bederson et al. [12] who propose “local tools” (repositionable widgets). MMM [14] is
a multi-device, multi-user editor. The MMM system allowed user-positionable menus
to deal with the problem of wasting space by replicating menus on each screen versus

81
only allowing them to appear in one fixed position. In contrast to these systems, our
work presents an empirical study to address the issue of widget placement, and
compares fixed-place, rather than relocatable, widgets.
Zanella and Greenberg [183] identify design considerations for single display
groupware widgets, pointing out that widgets should be placed such as to avoid
interference between users (e.g., one user’s view or reach of a widget is blocked by
another user), but also so as to provide awareness of others’ activities. We explore
these tensions in our comparison of widget placement. In their list of guidelines for
tabletop displays, Scott et al. [131] identify “support of simultaneous user actions” and
“providing shared access to digital objects” as key areas for future research. Our
exploration of impacts of centralized versus replicated control placement on tabletop
usability and collaboration is a step toward addressing these issues.
4.1.6 Centralized versus Replicated Controls: Conclusion
This work addresses the issue of managing display elements for tabletop groupware
systems by comparing two alternative layout options for GUI controls on shared
tabletops. We have presented a usability study comparing alternative designs of the
TeamTag collective photo annotation software, which differed in whether they
provided a centralized set of shared controls or replicated controls for each user. Users
strongly preferred the replicated controls for two main reasons: (1) the desire to use
the center of the table for other semantically important tasks, and (2) users’ aversion to
accidentally touching a teammate’s hand when using the shared controls. The unusual
orientation of the text on the shared controls, however, did not appear to be a factor in
the unpopularity of that design. Our findings relating to co-touching, orientation of
information, and the importance of the central region of the table are applicable to the
design of a variety of collaborative tabletop interfaces.

82
4.2 Techniques for Co-Present Collaborative Search
Section 4.1 described a comparison of centralized versus replicated control layouts;
the placement of GUI controls is a core issue relating to the chapter theme of
managing display elements on interactive tabletops. The TeamTag system described in
the previous section inspired further investigation of the utility of interactive tables as
a platform for digital photo management. This section describes a related application,
TeamSearch, that explores the tradeoffs between individual- and group-oriented
interfaces for searching through digital photo collections on interactive tables.
The emergence of computationally-enhanced tables offers software designers
the opportunity to develop applications that support co-located collaboration among
groups of users, such as collaborative exploration of digital libraries by co-present
groups. Collaborative search for information is not well-supported by current SDG
technology, although data exploration is a task often accomplished in small-group
settings. For example, a group of business colleagues or students might search through
a repository of charts and documents to compile relevant bits of information into a
report or presentation, or a family might search through a collection of personal digital
photographs to assemble a themed album. We have developed TeamSearch, an
application supporting co-present collaborative search of metadata-tagged digital
content on an interactive table (see Figure 24).

83
Figure 24: A four-person group uses TeamSearch at a DiamondTouch table to find
photos from a metadata-tagged repository.
4.2.1 Related Work
Several systems enable collaborative work around interactive tables. The UbiTable
[135] allows two users to transfer digital media from their laptops to a tabletop display
where it can be shared and annotated. RoomPlanner [181] allows users to create
furniture arrangements using special gestures on an interactive tabletop. The
InteracTable [151] allows groups to annotate digital content on a computationally-
enhanced table. ConnecTables [158] allow users of combine mobile desks to create a
larger horizontal work surface and share and exchange documents. SoundTracker [90]
is a tabletop application for group music exploration. These projects all address the
creation and/or manipulation of digital content using tables; in contrast, TeamSearch
explores using interactive tables to support collaborative search of digital content.
The Personal Digital Historian (PDH) [134] is a tabletop application that
supports storytelling by allowing a group of users to collectively interact with a set of
digital photos. PDH allows users to query the photo collection along one of four

84
possible dimensions – who is in a photo, what event is depicted, or where or when the
photo was taken. However, the hardware used in the PDH system supports interaction
by only one group member at a time, so PDH’s creators were unable to explore truly
collaborative query formation.
Many research and commercial systems, such as PhotoFinder [140], Fotofile
[74], Adobe’s Photoshop Album6, Apple’s iPhoto7, and Google’s Picasa8, offer photo
tagging and searching capabilities. These systems are all designed for operation by a
single user, while TeamSearch focuses on multi-user, collaborative search of digital
content.
Studies have shown that many people have trouble specifying Boolean queries
[42] [157]. To make query formulation more accessible, systems such as Kaleidoquery
[99], Pane and Myers’ tabular-layout query language [103], CBM [139], and Tangible
Query Interfaces [166] allow a single user to specify Boolean queries using a visual or
tactile scheme rather than an abstract language. TeamSearch extends the concept of
visual query formation to include collaborative queries. Prior work on collaborative
information retrieval, such as the Ariadne system [163] focuses on allowing remote
users to assist each other, while our focus is on co-located collaborative search.
However, the focus of this paper is on exploring different styles of collaborative query
formation rather than on contributing a novel style of non-verbal query specification.
4.2.2 The TeamSearch System
TeamSearch is a multi-user application that allows four-member groups to
collaboratively search collections of digital content, such as photos, that have been
previously associated with relevant metadata. Users form Boolean-style9 queries by
arranging circular “query tokens” on the tabletop (see Figure 25).
6 http://www.adobe.com/products/photoshopalbum 7 http://www.apple.com/ilife/iphoto 8 http://www.picasa.com 9 Since our goal is to explore support for co-located collaborative querying and not to contribute to the
literature on visual query languages, TeamSearch does not offer complete Boolean expressivity, but

85
TeamSearch users sit around a DiamondTouch table (see Figure 24), using our
standard equipment setup (as described in Section 2.3.1).
Figure 25: The starting configuration of TeamSearch consists of several components: (a)
The collection of photos being searched is represented as a pile in the center of the table.
(b) The shaded rectangular regions on each side of the table are where thumbnails that
match the current query will be displayed. (c) A pile of query tokens (round objects
labeled “?”) is located on each side of the table. (d) Circular widgets represent the
schema of the photo collection’s metadata. Each circle corresponds to a category (e.g.,
“people” or “location”), and each wedge within a circle corresponds to a specific
metadata value for that category (e.g., “Alex,” “Larry,” or “Lisa”). Users search the
photo collection by placing query tokens on top of target metadata values, and
rather interprets all token combinations as an “AND” (during pilot testing we found that this
simplification made it easier for users to specify queries, which was not surprising given prior studies
on the difficulty many people have with the Boolean conceptual model, such as [3, 20]).
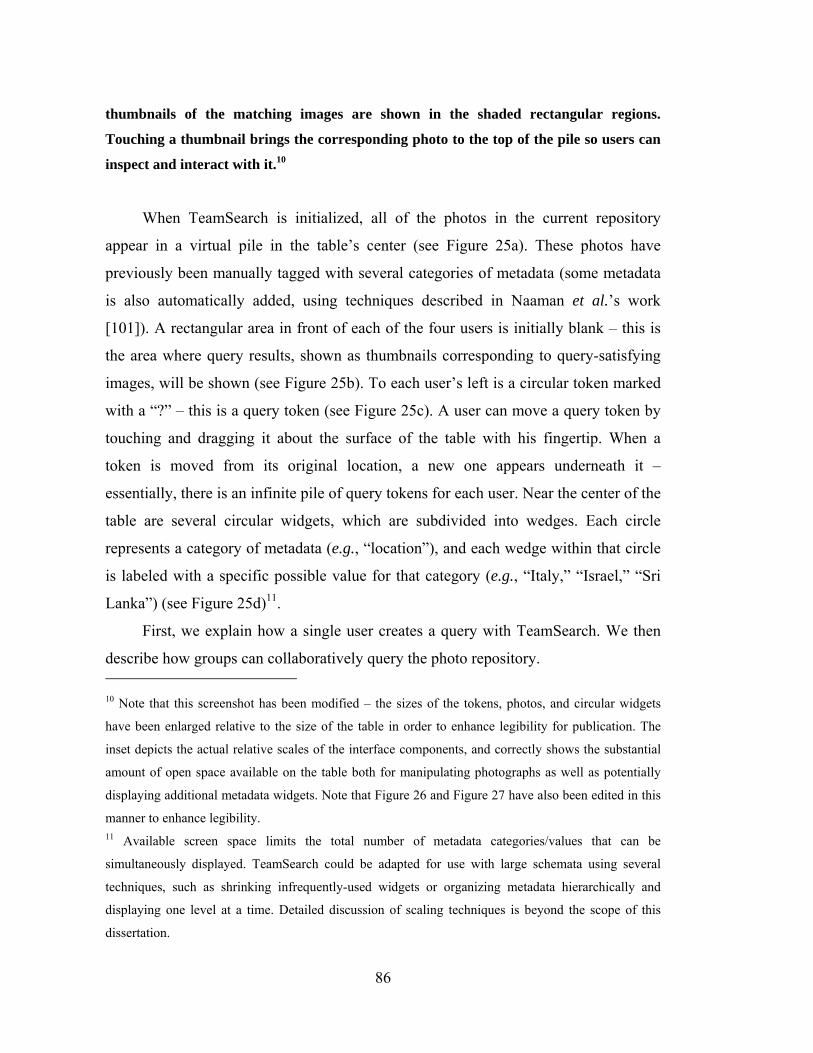
86
thumbnails of the matching images are shown in the shaded rectangular regions.
Touching a thumbnail brings the corresponding photo to the top of the pile so users can
inspect and interact with it.10
When TeamSearch is initialized, all of the photos in the current repository
appear in a virtual pile in the table’s center (see Figure 25a). These photos have
previously been manually tagged with several categories of metadata (some metadata
is also automatically added, using techniques described in Naaman et al.’s work
[101]). A rectangular area in front of each of the four users is initially blank – this is
the area where query results, shown as thumbnails corresponding to query-satisfying
images, will be shown (see Figure 25b). To each user’s left is a circular token marked
with a “?” – this is a query token (see Figure 25c). A user can move a query token by
touching and dragging it about the surface of the table with his fingertip. When a
token is moved from its original location, a new one appears underneath it –
essentially, there is an infinite pile of query tokens for each user. Near the center of the
table are several circular widgets, which are subdivided into wedges. Each circle
represents a category of metadata (e.g., “location”), and each wedge within that circle
is labeled with a specific possible value for that category (e.g., “Italy,” “Israel,” “Sri
Lanka”) (see Figure 25d)11.
First, we explain how a single user creates a query with TeamSearch. We then
describe how groups can collaboratively query the photo repository. 10 Note that this screenshot has been modified – the sizes of the tokens, photos, and circular widgets
have been enlarged relative to the size of the table in order to enhance legibility for publication. The
inset depicts the actual relative scales of the interface components, and correctly shows the substantial
amount of open space available on the table both for manipulating photographs as well as potentially
displaying additional metadata widgets. Note that Figure 26 and Figure 27 have also been edited in this
manner to enhance legibility. 11 Available screen space limits the total number of metadata categories/values that can be
simultaneously displayed. TeamSearch could be adapted for use with large schemata using several
techniques, such as shrinking infrequently-used widgets or organizing metadata hierarchically and
displaying one level at a time. Detailed discussion of scaling techniques is beyond the scope of this
dissertation.

87
Suppose User X wants to find all of the photos in the collection that were taken
in Sri Lanka, so he queries the collection. He takes one of the query tokens from his
token pile and drags it with his finger into the wedge marked “Sri Lanka” within the
circular widget that contains the “location” metadata category. He places the token on
that wedge and releases it. In the shaded rectangular region in front of User X, several
thumbnail images appear12. Each of these thumbnails corresponds to an image from
the collection that satisfies the criterion “location=Sri Lanka”. In order to find the
original, full-resolution image, User X can press on one of the thumbnails with his
finger. The corresponding image will move up to the top of the pile in the center of the
table and will blink to aid User X in locating it. User X can then touch that image with
his finger and move it around the table, resize or reorient it, view other metadata
associated with it, etc. Suppose User X wants to further revise his query to find a more
specific image – he wants to find an image from Sri Lanka that has his brother Larry
in it. To refine his query, he takes another token from his token pile, and places this
one on the wedge marked “Larry” within the circular widget representing the “people”
category. The display of thumbnails in front of him updates to show matches only for
photos satisfying the query “location:Sri Lanka AND people:Larry.”
This querying technique can be extended in order to permit all four people
sitting around the table to work collaboratively on a search task. We consider two
implementation alternatives that offer different interpretations of how the system
should process simultaneous token placements by members of the group – collective
and parallel querying.
12 Note that thumbnail size depends on the number of photos that match a query; thumbnails scale down
in order to fit more query results into the given space. For very large collections, alternatives such as
scrolling the results area might be preferable, in order to keep thumbnails at a useful size. Detailed
discussion of scalability techniques is beyond the scope of this dissertation.

88
Figure 26: TeamSearch with collective query tokens: all tokens contribute to a single
query.
Under the collective query tokens implementation, when tokens are placed onto
the circular widgets the system interprets all tokens collectively as a single query no
matter which group member placed them. For example, if User X placed a token on
“Larry” and User Y placed a token on “Lisa” and a token on “Sri Lanka,” then the
result would be a single query “location:Sri Lanka AND people:Larry AND
people:Lisa,” and the thumbnails that matched that query would be displayed in front
of each user (see Figure 26).
Parallel query tokens offer a more relaxed interpretation of collaborative
querying, which permits individual group members to form distinct queries in parallel
with other users at the table. This design is influenced by observations of group work
indicating that small-group tasks tend to transition between periods of tightly-coupled

89
group activity interspersed with periods of more loosely-coupled individual work [36]
[83].
Figure 27: TeamSearch with parallel query tokens: each group member’s tokens
(distinguished by color) form distinct queries.
Under this implementation, when tokens are placed onto circular widgets the
system interprets all tokens placed by each individual user as a single query, for a
maximum of four queries at any one time (one per user). Each user’s query tokens are
a different color, to make this distinction clear. Using parallel query tokens, if User X
placed a token on “Larry” and User Y placed a token on “Lisa” and a token on “Sri
Lanka,” then the result would be that the thumbnails matching the query
“people=Larry” would be shown in front of User X, the thumbnails matching
“people=Lisa AND location=Sri Lanka” would be shown in front of User Y, and no

90
thumbnails at all would be shown in front of the two users who placed no tokens (see
Figure 27).
When developing TeamSearch, it was not apparent whether the collective or
parallel query scheme was more appropriate for use by co-located groups
collaboratively searching through digital collections towards a common goal. Prior
work on the tradeoffs between group-oriented versus individual-oriented designs for
CSCW systems have focused on distributed systems [50] [148], but have not explored
how these issues apply to SDG. To better understand the benefits and drawbacks of
each querying style, we conducted an empirical study. The purpose of this experiment
was to clarify questions relevant to designing interface mechanisms to support co-
located collaborative search, such as: (1) Does either design allow people to reach
their search goals more effectively? (2) Does either design facilitate more efficient
searching? (3) Does either design promote more effective collaboration among group
members? (4) Will users have strong preferences for either of the designs?
4.2.3 Evaluation
We recruited sixteen paid subjects to participate in our study. Subjects’ ages ranged
from twenty to thirty years old, and they were evenly split between genders.
Participants completed the experiment in groups of four users at a time, for a total of
four groups. The experiment had a within-groups design, with each group completing
two search tasks using two different sets of photos with analogous metadata schemata,
with one task using collective query tokens and one using parallel tokens. The order of
photo sets and token types was balanced using a Latin Square design.
In each condition, a collection of seventy-five digital images was shown on the
table. Each image in the set was associated with four categories of metadata: people,
location, event, and year. There were five possible values for each of the four
categories (e.g., year={2000 | 2001 | 2002 | 2003 | 2004}). A single photo could have
multiple people associated with it, but only a maximum of one value each for the other
three categories. The photos were not from the subjects’ personal collections, so they
had to rely on querying, rather than recognition or brute force search, to find specific
photos. Groups were told to choose a subset of the images for the purpose of making
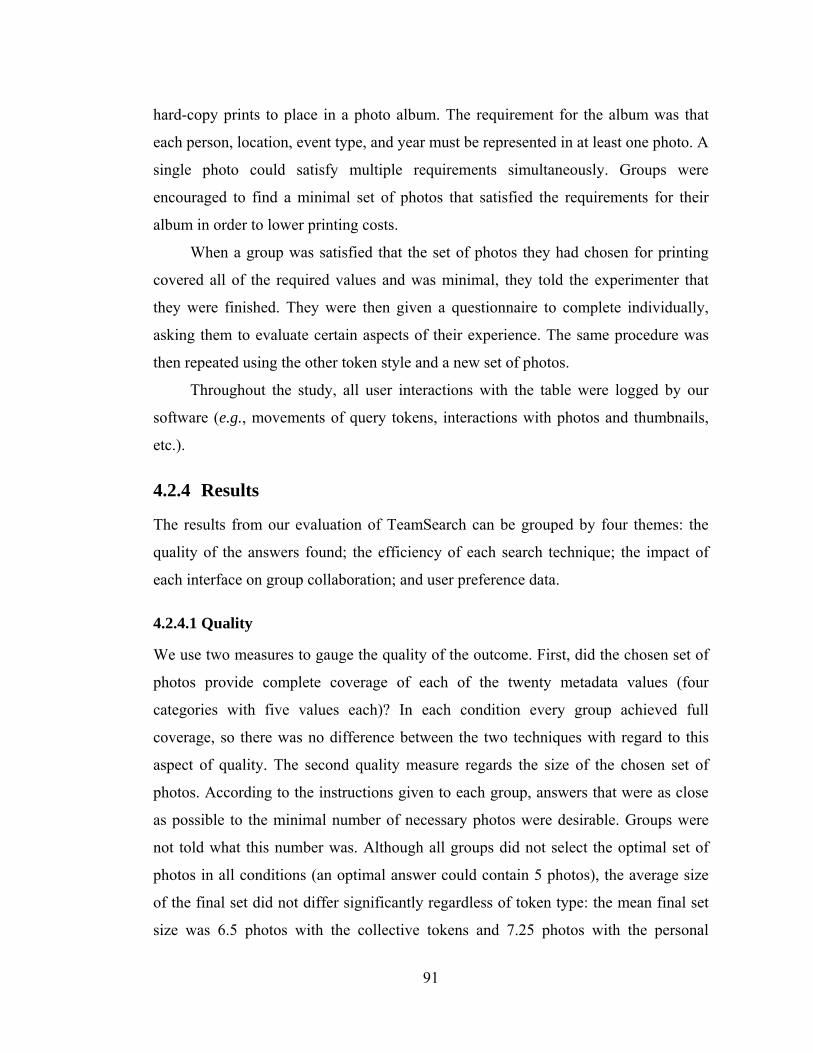
91
hard-copy prints to place in a photo album. The requirement for the album was that
each person, location, event type, and year must be represented in at least one photo. A
single photo could satisfy multiple requirements simultaneously. Groups were
encouraged to find a minimal set of photos that satisfied the requirements for their
album in order to lower printing costs.
When a group was satisfied that the set of photos they had chosen for printing
covered all of the required values and was minimal, they told the experimenter that
they were finished. They were then given a questionnaire to complete individually,
asking them to evaluate certain aspects of their experience. The same procedure was
then repeated using the other token style and a new set of photos.
Throughout the study, all user interactions with the table were logged by our
software (e.g., movements of query tokens, interactions with photos and thumbnails,
etc.).
4.2.4 Results
The results from our evaluation of TeamSearch can be grouped by four themes: the
quality of the answers found; the efficiency of each search technique; the impact of
each interface on group collaboration; and user preference data.
4.2.4.1 Quality
We use two measures to gauge the quality of the outcome. First, did the chosen set of
photos provide complete coverage of each of the twenty metadata values (four
categories with five values each)? In each condition every group achieved full
coverage, so there was no difference between the two techniques with regard to this
aspect of quality. The second quality measure regards the size of the chosen set of
photos. According to the instructions given to each group, answers that were as close
as possible to the minimal number of necessary photos were desirable. Groups were
not told what this number was. Although all groups did not select the optimal set of
photos in all conditions (an optimal answer could contain 5 photos), the average size
of the final set did not differ significantly regardless of token type: the mean final set
size was 6.5 photos with the collective tokens and 7.25 photos with the personal
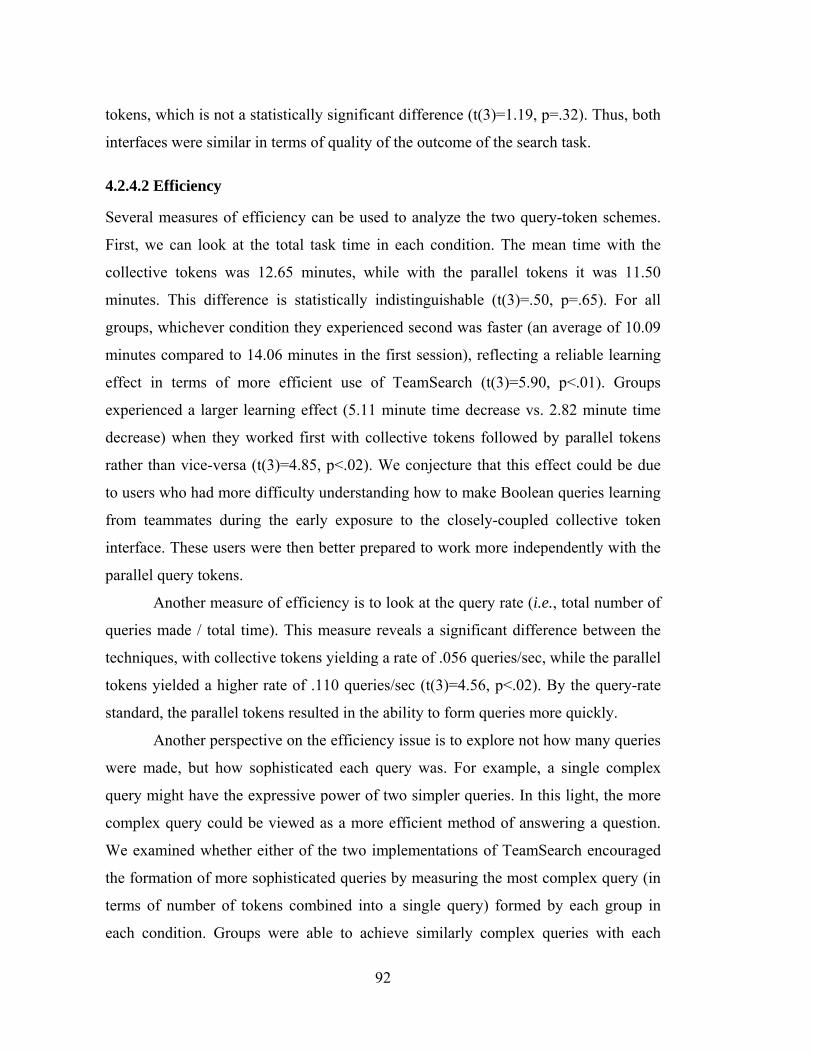
92
tokens, which is not a statistically significant difference (t(3)=1.19, p=.32). Thus, both
interfaces were similar in terms of quality of the outcome of the search task.
4.2.4.2 Efficiency
Several measures of efficiency can be used to analyze the two query-token schemes.
First, we can look at the total task time in each condition. The mean time with the
collective tokens was 12.65 minutes, while with the parallel tokens it was 11.50
minutes. This difference is statistically indistinguishable (t(3)=.50, p=.65). For all
groups, whichever condition they experienced second was faster (an average of 10.09
minutes compared to 14.06 minutes in the first session), reflecting a reliable learning
effect in terms of more efficient use of TeamSearch (t(3)=5.90, p<.01). Groups
experienced a larger learning effect (5.11 minute time decrease vs. 2.82 minute time
decrease) when they worked first with collective tokens followed by parallel tokens
rather than vice-versa (t(3)=4.85, p<.02). We conjecture that this effect could be due
to users who had more difficulty understanding how to make Boolean queries learning
from teammates during the early exposure to the closely-coupled collective token
interface. These users were then better prepared to work more independently with the
parallel query tokens.
Another measure of efficiency is to look at the query rate (i.e., total number of
queries made / total time). This measure reveals a significant difference between the
techniques, with collective tokens yielding a rate of .056 queries/sec, while the parallel
tokens yielded a higher rate of .110 queries/sec (t(3)=4.56, p<.02). By the query-rate
standard, the parallel tokens resulted in the ability to form queries more quickly.
Another perspective on the efficiency issue is to explore not how many queries
were made, but how sophisticated each query was. For example, a single complex
query might have the expressive power of two simpler queries. In this light, the more
complex query could be viewed as a more efficient method of answering a question.
We examined whether either of the two implementations of TeamSearch encouraged
the formation of more sophisticated queries by measuring the most complex query (in
terms of number of tokens combined into a single query) formed by each group in
each condition. Groups were able to achieve similarly complex queries with each
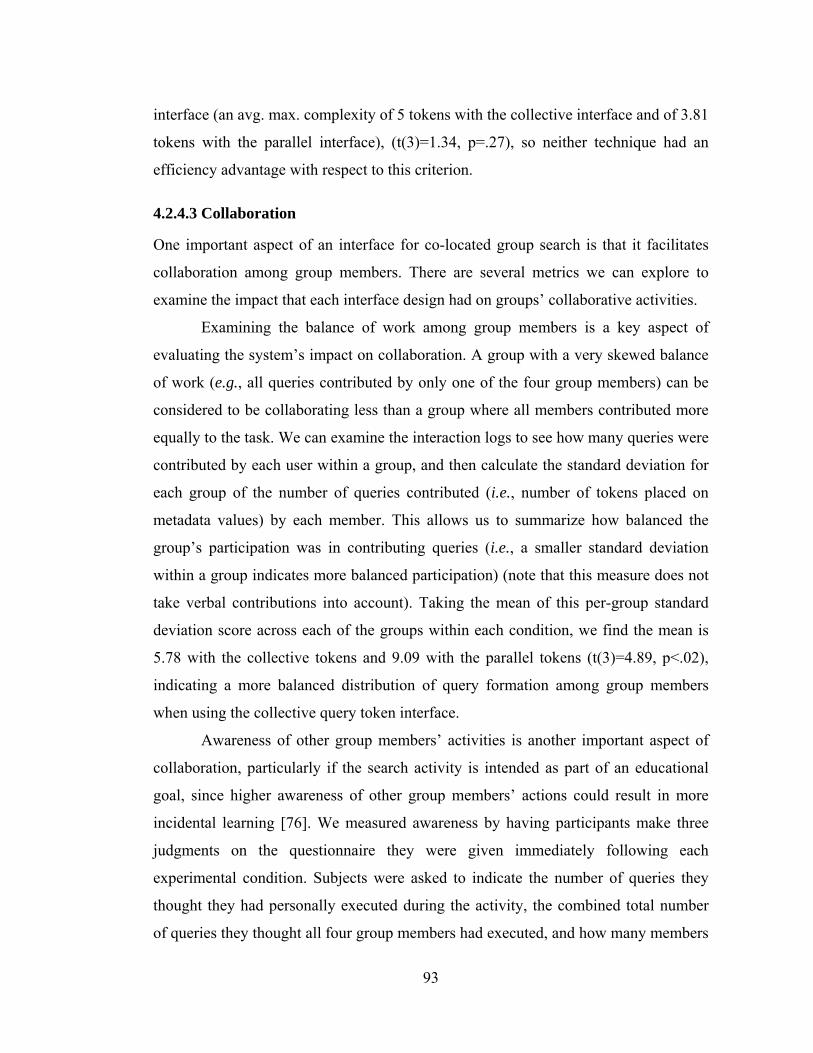
93
interface (an avg. max. complexity of 5 tokens with the collective interface and of 3.81
tokens with the parallel interface), (t(3)=1.34, p=.27), so neither technique had an
efficiency advantage with respect to this criterion.
4.2.4.3 Collaboration
One important aspect of an interface for co-located group search is that it facilitates
collaboration among group members. There are several metrics we can explore to
examine the impact that each interface design had on groups’ collaborative activities.
Examining the balance of work among group members is a key aspect of
evaluating the system’s impact on collaboration. A group with a very skewed balance
of work (e.g., all queries contributed by only one of the four group members) can be
considered to be collaborating less than a group where all members contributed more
equally to the task. We can examine the interaction logs to see how many queries were
contributed by each user within a group, and then calculate the standard deviation for
each group of the number of queries contributed (i.e., number of tokens placed on
metadata values) by each member. This allows us to summarize how balanced the
group’s participation was in contributing queries (i.e., a smaller standard deviation
within a group indicates more balanced participation) (note that this measure does not
take verbal contributions into account). Taking the mean of this per-group standard
deviation score across each of the groups within each condition, we find the mean is
5.78 with the collective tokens and 9.09 with the parallel tokens (t(3)=4.89, p<.02),
indicating a more balanced distribution of query formation among group members
when using the collective query token interface.
Awareness of other group members’ activities is another important aspect of
collaboration, particularly if the search activity is intended as part of an educational
goal, since higher awareness of other group members’ actions could result in more
incidental learning [76]. We measured awareness by having participants make three
judgments on the questionnaire they were given immediately following each
experimental condition. Subjects were asked to indicate the number of queries they
thought they had personally executed during the activity, the combined total number
of queries they thought all four group members had executed, and how many members

94
of the group (from 0 to 3) they felt had executed more queries than they had
personally. We compared these assessments to the actual data recorded by our system
to check accuracy. More accurate assessments of these values would indicate higher
awareness of one’s own and/or others’ interactions with TeamSearch. The mean
difference between the perceived and actual number of queries done personally by
each group member was 5.84 with collective tokens and 11.25 with parallel tokens
(t(15)=2.95, p<.01). The mean difference between the perceived and actual number of
queries done by all group members was 20.38 with collective tokens and 35.53 with
parallel tokens (t(15)=2.54, p<.03). The mean difference between the perceived and
actual number of group members who had contributed more queries than the survey
respondent was .81 with collective tokens and 1.19 with parallel tokens (t(15)=2.42,
p<.03). In all three of these cases, the lower mean difference for collective tokens
indicates a higher awareness than with parallel tokens.
We also gathered participants’ subjective self-reports regarding various aspects
of collaboration. These self-report data indicate that the collective query tokens
facilitated more effective collaboration with group members than did the parallel
query tokens. Subjects answered three Likert-scale questions (7-point scale) relating to
various aspects of collaboration. For each of the three questions (see Table 5), the
average rating was significantly better for the collective tokens.

95
Table 5: Collective tokens received higher mean ratings on a 7-point Likert scale
regarding their impact on collaboration.
Collective
tokens
Parallel
tokens p-value
I worked closely with the other
members of my group to accomplish
this task.
5.75 4.88 p<.04
Members of the group communicated
with each other effectively. 5.75 5 p≤.05
The group worked effectively as a team
on this task. 5.75 4.81 p<.03
4.2.4.4 Satisfaction
After completing both conditions, each participant individually completed a
questionnaire asking her to make comparisons between the two conditions. On this
survey, the majority of subjects (10 of 16, 62.5%) reported a preference for the
collective interface as compared to the parallel interface. Subjects also reported greater
satisfaction with the task outcome when using the collective tokens (as indicated by
mean scores given on a 7-point Likert scale for: “I am satisfied with the set of photos
that my group selected”), with a mean of 6.0 for the collective tokens and 4.88 for the
parallel tokens (t(15)=3.74, p<.01).
4.2.5 Discussion
Based on the quantitative and qualitative data gathered during our study, we can
revisit the design questions that initially motivated our exploration of the comparative
strengths and weaknesses of the collective and parallel query token interfaces for co-
located collaborative search of digital photo collections. The increased awareness,
more equitable distribution of work, and heightened satisfaction with the collective
tokens suggests that the more team-centric interface offers benefits beyond the

96
“staples” of efficiency and result quality that are usually considered when designing
interfaces for searching digital media.
Does either design allow people to reach their search goals more effectively?
Groups were able to achieve their search goals for the study task (complete coverage
of all categories/values, and small answer-set size) equally well with either search
interface.
Does either design facilitate more efficient searching? We had initially
expected that the parallel query tokens might facilitate more efficient searching, since
they provide group members with more independence and flexibility, allowing the
group to present several queries to the system simultaneously (up to one query per
user). However, we found only minimal efficiency benefits to the parallel scheme,
which resulted in a faster query formation rate than the collective interface, but which
did not significantly impact total time spent on the search task or query complexity.
Based on the results of our study, it seems that the potential efficiency benefits
introduced by parallelism might have been cancelled out by the learning benefits of
the collective tokens, which seem to have helped “weaker” group members more
quickly catch on to how to use TeamSearch by providing the opportunity for them to
work in synchrony with more query-savvy group members. It is likely that, with
longer-term use, the efficiency benefits of the parallel scheme would become more
pronounced; however, our results regarding collaboration and satisfaction suggest that
some of the less tangible benefits of camaraderie and teamwork might still bend
preferences toward the collective query interface.
Does either design promote more effective collaboration among group
members? Because the collective tokens facilitate a more closely-coupled work style,
we suspected that they would result in an increased sense of collaboration among
users. This suspicion was borne out by subjects’ self-reports of several dimensions of
collaborative activity. Feelings of working closely as a team and of communicating
well with the group were rated significantly higher with the collective interface.
The collective interface also resulted in higher awareness by participants about
both their own and other group members’ contributions to the task. While we had

97
expected that the collective interface would facilitate more awareness about others’
contributions, we had thought that the parallel tokens might facilitate increased self-
awareness by more explicitly highlighting individual contributions (through the color-
coding of the tokens). One possible explanation for the increased personal awareness
in the collective condition is that people felt more of a need to recall and emphasize
their own contribution in this case, since the collective interface did not make it
obvious who had contributed which parts of the queries.
Finally, the collective interface resulted in more even distribution of the work
of query formation among group members. Again, we were initially surprised by this
result, since prior work on SoundTracker [90] found that adding more individual
flexibility to a group tabletop system resulted in more equal distribution of work
among the group members; for that reason, we had expected that the parallel query
tokens might result in more balanced participation, while the use of the collective
tokens might end up being dominated by a single, aggressive group member.
However, the challenging nature of forming Boolean-style queries [42] [157] might
have been a key factor in changing the nature of participation in this task (as compared
to the task studied in [90] which was a tabletop entertainment application rather than a
tabletop search application). With the parallel interface, participants who were more
confused by query formation might have felt unable to contribute a query on their
own, but with the collective tokens often the more dominant individuals would direct
other group members where to place tokens in order to help the group form a
collective query, thus encouraging participation from all group members. The
increased confidence of “weaker” users with the collective tokens is reflected by the
questionnaire responses of the only two participants in our study who had never heard
of the concept of Boolean queries. These two subjects indicated more agreement with
the statement “I was confused about how to form queries” for the parallel tokens
interface (rating of 4 and 5 on a 7-point scale) than with the same statement about the
collective tokens (rating of 2 and 3). These two subjects were in different groups, and
one experienced the parallel condition first while the other experienced the collective
condition first, so ordering effects are not a likely explanation for their preference.

98
Will users have strong preferences for either of the designs? Although subjects
ranked both interfaces as similarly easy to use and understand, the majority of
participants in our study preferred using the collective, rather than the parallel, tokens,
and also reported greater satisfaction with the final set of photos their group selected
with the collective interface. Perception of teamwork was highly correlated with self-
reported satisfaction with the outcome (r=.525, p<.04). We were surprised by this,
since our ongoing work on collaborative photo-labeling has found that users prefer
individual sets of controls when performing labeling tasks on an interactive table.
Perhaps the more challenging nature of the search task as compared to the labeling
task influenced the preference for more closely-coupled teamwork in this situation.
4.2.6 Techniques for Co-Present Collaborative Search: Conclusion
We have introduced TeamSearch, a tabletop application that enables small, co-located
groups to search for digital photos from a metadata-tagged repository. Because co-
located group query formation is a relatively unexplored domain, we needed to answer
basic questions to improve the design of the TeamSearch interface – whether an
interface for group query formation should consider search constraints provided by
each group member as contributing to a single, complex query (collective query token
interface) or whether each group member’s searches should be executed individually
(parallel query token interface). Our evaluation found only minor differences between
the two interfaces in terms of search quality and efficiency, but found that the
collective interface offered significant benefits in terms of facilitating stronger
collaboration and awareness among group members and in terms of users’
preferences. The advantages of the collective interface may be related to the
difficulties of forming Boolean-style queries and the fact that this interface allows
group members with weaker query-formation skills to learn from other group
members. Our evaluation of these two alternative querying interfaces for TeamSearch
is a valuable first step toward understanding the unique requirements for designing
successful tabletop interfaces that enable co-located groups to access digital media
repositories. This work addresses the issue of managing display elements for tabletop
groupware systems by exploring the tradeoffs of whether changes to graphical
99
interface elements on interactive tables should be interpreted collectively or in
parallel.
4.3 Multi-Modality for Clutter Reduction
Stewart et al.’s [150] seminal paper on Single Display Groupware suggests several
challenges posed by shared display space, including limited screen area. Even large,
projected displays tend to have the same number of pixels as single-user monitors,
despite the fact that SDG applications often need to display more information because
of their multi-user nature.
Although fundamental changes in display technology may eventually
overcome resolution-based constraints (systems such as the Interactive Mural [49],
having a resolution of 4096 by 2304 exist today, but are rare, custom-built, and
prohibitively expensive), the limits of human attention will remain constant. Even
when higher resolutions permit the display of information relevant to each of the n
users of an SDG system, work such as Gutwin and Greenberg’s [51] suggests that
large amounts of information providing awareness of the activities of other users could
result in overload, reducing productivity.
Individually-targeted audio can be used to supplement a shared tabletop
display with sources of private information, as discussed in section 3.2. In this section,
we present prototype systems that utilize this multi-modal information presentation
technique as a means of reducing clutter on a shared display and of avoiding
orientation-based legibility problems that can negatively impact a tabletop usage
experience. Note that this section presents proof-of-concept prototypes, but that we
have not conducted experimental evaluations of these prototypes.
4.3.1 Private Audio for Captions
AudioNotes is a tabletop application that allows groups of users to share digital
photographs. These photos can have captions associated with them, as indicated by the
“speech bubble” widget (see Figure 28). When a user touches the bubble, a
personalized caption is displayed to him privately through individually-targeted audio.

100
(This message can alternatively be displayed on a personal auxiliary device, such as a
PDA or laptop.) For instance, when Alma touches the caption widget on a photo of her
family, she hears “Dad, Mom, and me at the Mission Beach,” while her friend Fred
hears “Mr. and Mrs. Reyes and Alma at Mission Beach.” Currently, personalized
captions are created manually by system users, although better face-recognition from
photographs combined with information from personal address books could be used to
automate the creation of such captions in the future.
By presenting the caption via audio, tabletop clutter is reduced since space
need not be allocated for displaying the photos caption. The personalization of
captions, described above, would not be possible with a static, visual caption (or
would increase clutter even further by requiring space to display N captions
underneath each photo!). Audio captions also reduce orientation-related legibility
issues, since all users can simultaneously hear the caption, whereas a visual caption
cannot simultaneously be right-side-up for all users of a tabletop system (without
replication, which would aggravate the clutter issue).
Figure 28: The “speech bubble” icon on this photo from the AudioNotes system is an
identity-aware caption widget that allows personalized variants of photo captions to be
available to different users.
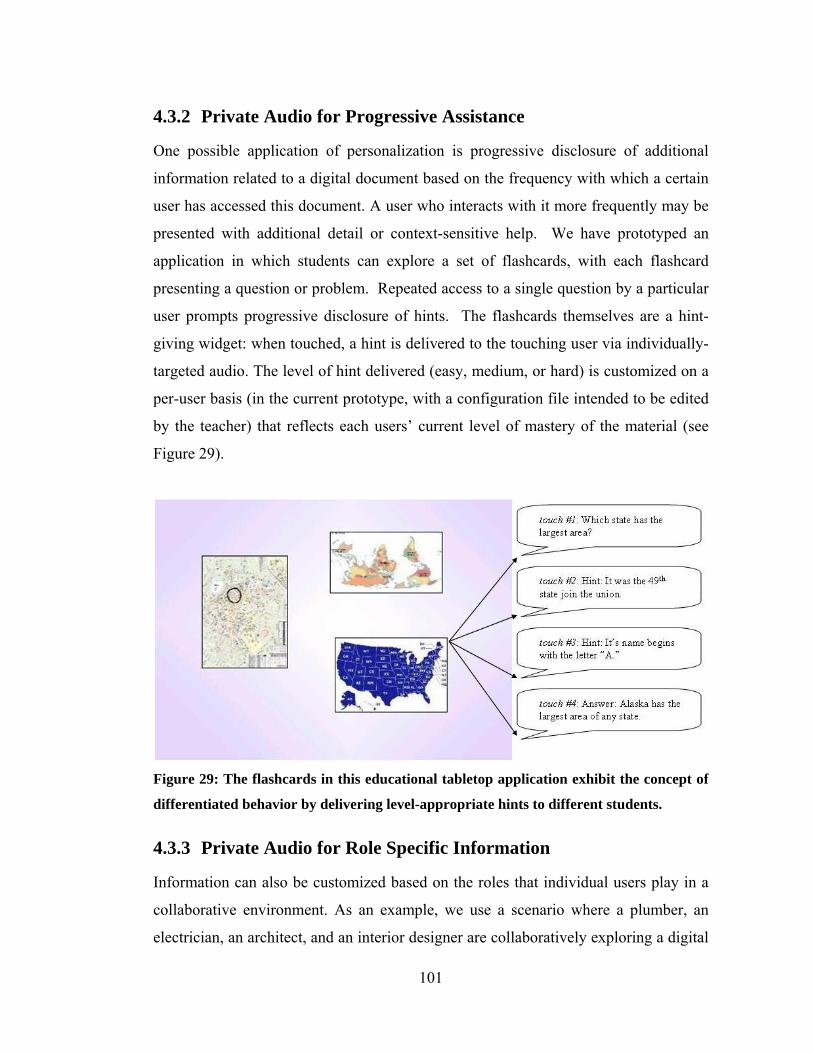
101
4.3.2 Private Audio for Progressive Assistance
One possible application of personalization is progressive disclosure of additional
information related to a digital document based on the frequency with which a certain
user has accessed this document. A user who interacts with it more frequently may be
presented with additional detail or context-sensitive help. We have prototyped an
application in which students can explore a set of flashcards, with each flashcard
presenting a question or problem. Repeated access to a single question by a particular
user prompts progressive disclosure of hints. The flashcards themselves are a hint-
giving widget: when touched, a hint is delivered to the touching user via individually-
targeted audio. The level of hint delivered (easy, medium, or hard) is customized on a
per-user basis (in the current prototype, with a configuration file intended to be edited
by the teacher) that reflects each users’ current level of mastery of the material (see
Figure 29).
Figure 29: The flashcards in this educational tabletop application exhibit the concept of
differentiated behavior by delivering level-appropriate hints to different students.
4.3.3 Private Audio for Role Specific Information
Information can also be customized based on the roles that individual users play in a
collaborative environment. As an example, we use a scenario where a plumber, an
electrician, an architect, and an interior designer are collaboratively exploring a digital

102
house plan. When users touch a given room, each person might receive information
pertinent to their job role: the electrician may hear about the number of outlets, the
plumber about the types of piping, the architect about the dimensions of the room, and
the designer about the room’s purpose. This type of personalization avoids cluttering
the interface with information of interest to only one user.
4.3.4 Multi-Modality for Clutter Reduction: Conclusion
Our prototypes of AudioNotes (which allows for personalized audio captions) and
extensions that enable progressive assistance and role-specific information expand on
the individual-audio techniques introduced in section 3.2. This work relates to
managing display elements for tabletop displays by demonstrating the utility of
supplementing a tabletop display with private audio feedback as a means of reducing
visual clutter and alleviating orientation-based legibility challenges.
4.4 Drawers
The previous section described ways in which individually-targeted audio could be
used to reduced visual clutter on a shared tabletop display. Another technique to
manage clutter is by providing a virtual space to offload non-critical content until it is
needed, thus freeing up additional display area for key data items. To explore this
design choice, we have developed Drawers, a prototype system for reducing clutter on
tabletop displays. This work was done in collaboration with Björn Hartmann, whose
d.tools physical prototyping toolkit [54] facilitated system development.
Drawers is inspired by analogies with traditional desks and tables, which often
include drawers for the storage of documents and tools. We have supplemented a
DiamondTouch table with four drawers created using the d.tools toolkit (see Figure
30). The physical affordance is intended to make drawers simple and natural to use by
drawing on peoples’ existing knowledge of traditional furniture interactions. Pulling
out the physical drawer handle opens a virtual drawer on the tabletop. Items (e.g.,
digital documents or widgets) can be dragged with a finger between the drawer and
the main section of the table. Moving items between drawers and the tabletop results

103
in file transfers between the primary computer associated with the table and a USB
flash drive which is inserted into the drawer. In this way, the contents of drawers are
portable across distinct table installations. By turning the physical knob on the
drawer’s handle, the contents of the virtual drawer can be scrolled, so as to create an
unbounded storage space.

104
(a)
(b)
(c)
Figure 30: (a) A physical drawer, built with d.tools, affords pulling and pushing, as well
as scrolling (by rotating the knob). The drawer has a slot for plugging in a USB flash
drive. (b) Four drawers are attached to the DiamondTouch table, one on each side. (c)
Pulling out the physical drawer handle opens a virtual drawer on-screen, which can be
used to store data objects, such as the digital photos shown here.

105
4.4.1 Drawers: Informal Evaluation
In order to gain user feedback on the “Drawers” concept, we conducted an informal
observational study of system use. Three students from the Stanford Graphics Lab
took digital photos of the annual lab ski trip. We collected these photos, and chose 14
of the best photos from each user’s collection, which were placed into per-user
drawers (i.e., each user had the photos he had taken in his own drawer initially). The
functionality of Drawers was demonstrated, and all users had the opportunity to try
them out. The group was then told to create a photo collage to represent the ski trip.
They were also told that they could receive copies of each others’ photos to keep after
the study by copying them between each others’ drawers. We observed and took notes
throughout the session, and the participants were instructed to ask us questions or
make comments to us on their experience as needed throughout the session, which
lasted for approximately one hour. We then discussed the experience with users after
the study. Preliminary lessons learned from that experience are discussed in the
remainder of this section.
Mappings: One user noted that the inverse mapping of the physical and virtual
drawers (i.e., pulling out the drawer handle opens the drawer inward toward the center
of the table) was confusing at first, but later clarified that he got used to this mapping
immediately. Two users commented that the mapping between the physical drawer
knob and the direction of scrolling of the virtual drawer was confusing, and had to be
“rediscovered” each time they wanted to scroll.
Clutter/Organization: The table quickly became cluttered during the photo
collage activity, and the group surprised us by commandeering the unutilized drawer
on the fourth side of the table as a “trash can,” a place to put photos that they deemed
irrelevant. Users also made use of their drawers in a partially open state, to prevent the
drawers themselves from cluttering the table, and sometimes asked other group
members to close their own drawers in order to make more space or allow them to see
106
something that was hidden underneath. Users also requested adding “snap to grid” or
other types of auto-organization within the virtual drawers.
Privacy/Ownership: We were surprised to see that users reached into other
people’s virtual drawers, both to remove or add content, despite the fact that we had
associated drawers with individual ownership. Participants did comment, however,
that they would not think of physically opening or closing other users’ drawers, and
indeed instead verbally requested these types of actions. One user suggested that the
semantics of removing an item from a drawer might relate to which user took out the
item: items taken from one’s own drawer would be literally removed, but items that
another user takes out of one’s drawer would be copied.
Sharing/Storage: Users did not take advantage of the ability to use drawers as
a means of sharing content for use after the tabletop activity (i.e., taking copies of
photos that other users shot). However, the users in our study mentioned that they had
already shared their photos separately from our study context, so a lack of proper
motivation in our scenario, rather than a fundamental failure in our design, might have
accounted for this behavior.
Awareness: One user commented he felt “blind” to what was in his drawer,
and suggested that making drawers more easily “glanceable” by providing a default
zoomed-out overview of the contents upon opening it might help increase his
awareness of drawer contents. A user also suggested that it would be helpful to have
some type of force feedback from the physical drawer handle to give an impression of
how full a drawer currently was.
Physicality: Users mentioned several positive aspects of the tangible drawer
interface, such as the enabling of bimanual interactions (one hand manipulating the
drawer and another interacting elsewhere on the table) (this might be more of an
advantage for technologies that do not accept multiple user touches, unlike the
DiamondTouch). One user mentioned that he did not need to search for his drawer –
because it was physical, it was easy for him to find, and he didn’t have to worry about
it being obscured by other content on the table. Another user felt that the physical
interface gave him more fine-grained control over the position and scrolling

107
parameters. The benefits of incorporating physicality into user interfaces are
considered in Klemmer et al.’s work [70].
In summary, our initial observations of Drawers system use were encouraging,
and suggest potential improvements to the system for making Drawers an effective
technique for providing clutter reduction in a shared tabletop system, and as a natural
metaphor for information sharing.
4.5 Challenges of Tabletop Peripheral Displays
This chapter’s focus is the management of display elements for interactive table UIs.
Many of the techniques described, such as the placement of GUI controls or clutter
reduction through the addition of private audio or virtual drawers, are relevant to
interactive software applications. However, digital tabletops that serve other purposes
may have different visual layout requirements. In this section, we consider how using
a table as a peripheral display impacts interface design.
People tend to gather around tables both for work and for recreation, making
them a tempting space to present awareness information. We motivate the use of
tables as ambient displays in ubiquitous computing spaces, and reflect on lessons
learned from our experiences with the AmbienTable, a prototype tabletop peripheral
display deployed in the iRoom.
Ambient displays, peripheral displays presenting non-critical material, are a
growing area of interest within the ubicomp research community. Such displays are
often embodied in physical objects, such as the Information Percolator [55] or
Dangling String [174], although some projects have shown peripheral information on
secondary monitors or projected onto the walls of a room, such as Kimura [78] or the
Infocockpit [156]. Although physical and vertically-projected ambient displays have
been explored, there has been little investigation in the space of horizontally projected
peripheral displays. de Bruijn and Spence [29] proposed using ambient technology
embedded in a coffee table to support opportunistic browsing; however, they did not
explore the ramifications of choosing to use a table for this purpose. Simply
repurposing an ambient display designed for vertical projection by displaying it

108
horizontally would not address the unique affordances and obstacles inherent in
designing tabletop interfaces.
Note that this section describes our prototype system, the AmbienTable; this
system ran on the Stanford iRoom’s iTable13 for a period of three weeks in early 2004,
and some aspects of the display, such as the Event Heap Visualizer, had observable
impacts on iRoom users’ awareness of unusual Event Heap behaviors. However, we
did not conduct any formal experimental evaluation of the AmbienTable system.
4.5.1 Tables as Ambient Displays: Motivations
Social conventions surrounding the use of tables make them appealing as vehicles for
ambient technology. Tables are widely and cheaply available, and are incorporated
into the design of nearly all workplaces and meeting areas, as well as in homes and
educational settings. Furthermore, any “normal” table can be transformed into a
display simply by adding a projector – this is appealing, since it is difficult and time-
consuming to construct custom physical displays. Augmenting tables in this manner is
also in keeping with Weiser’s vision of ubiquitous computing [173], by subtly
blending technology into everyday objects. The idea of using tables to display ambient
information should not be too surprising to people, as standard tables already, in a
sense, provide us with ambient data – a glance at the contents of a table can cue us in
as to whether we are in a dentist’s waiting room, an office, or the playroom of young
children. Using digital tables to display these sorts of social cues and awareness
information is a logical step.
Furthermore, in a situation where several people share a space, such as a lab or
meeting room, tables are often considered public areas, while vertical displays are
temporarily “owned” by the current discussion leader, as noted by Rogers and Lindley
[121]. Thus, the more public table area might be favored as a place to display ambient
information relevant to the entire group.
13 Note that the iTable is a different hardware platform than the DiamondTouch device used in the other
systems described in this dissertation. The iTable is a custom system (described in section 4.5.2) that
predates the availability of DiamondTouch technology.

109
Another motivation for using tables in this manner stems from considering the
weaknesses of tables. Because people tend to place objects (plates, mugs, papers) on
horizontal surfaces, a table is often not well-suited for use as a main display since
critical information could be occluded. However, the multi-purpose nature of tables
does not preclude them from showing information of peripheral importance. In a
ubiquitous computing environment, using a table as an ambient display allows users to
get more mileage out of the existing components of their space.
Naturally, the specific goals of a project should be taken into account when
selecting the appropriate type of display to create. For instance, tables are not practical
in situations where an ambient display is meant to be viewed simultaneously by a
large crowd of people, since the number of viewers is limited by the available seating
space around the table. However, the aforementioned motivations should encourage
designers of ambient technology to consider using tables, particularly if they are
constructing a software, rather than a physical, peripheral display.
4.5.2 The AmbienTable
(a)

110
(b)
Figure 31: (a) The AmbienTable was created for the “iTable” in the Stanford iRoom, a
bottom projected conference table. (b) The AmbienTable contained several displays,
which rotated slowly so that they could be viewed by users seated at various points
around the table. Clockwise, from top: iRoom Activity Visualization, the EventHeap
Visualizer, iClipboard Tracker, and the Food@Gates awareness display.
To aid our exploration of issues involving the use of tables as ambient displays, we
constructed the AmbienTable (see Figure 31), which displays peripheral visualizations
on a horizontal display in the iRoom [63], a ubiquitous computing testbed. The display
is bottom-projected onto a four-foot-by-three-foot screen embedded in a conference
table. The AmbienTable software is written entirely in Java, using the DiamondSpin
toolkit [136]. The display showed several visualizations relevant to users of the
iRoom: the Event Heap Visualizer, the iClipboard Tracker, the iRoom Activity
Visualization, and the Food@Gates Visualization. All of them are implemented in
Java.

111
Event Heap Visualizer: This visualization, used for debugging and system
awareness, displays the status of the iRoom’s Event Heap [63] server. The Event Heap
server acts as a “bulletin board” to which machines in the iRoom post messages and
from which machines can consume messages. The visualization of this server’s status
is abstract, depicting each message as a circle, with color, transparency, size, and
position each representing various metadata about the event. This display has
increased system awareness and understanding, and has helped identify the cause of
technical breakdowns in the iRoom. Several incidents illustrate this benefit:
In one instance, a user attempting to multibrowse (send a special kind of event)
with the same machine as both the source and recipient of the message, noticed that
her computer had frozen. Initially, she thought her own machine was broken, but a
glance at our visualization indicated the true nature of the problem – an infinite
number of circles were appearing located near the spot on the display that represented
her machine. The realization that her action caused an infinite number of events to be
posted to the server identified a previously unknown bug in the iRoom’s
infrastructure.
Another aspect of the iRoom’s infrastructure was improved when a user
observed that a certain category of events were displayed as circles with an unusually
large diameter, indicating that their default time to live was exceptionally high, which
caused the events to remain on the server too long, potentially clogging it.
On another occasion, users of the iRoom who were not involved in designing
or maintaining the infrastructure gained insight into the system design as a result of
observing the Event Heap Visualizer. Several users who were observing the
visualization noticed that executing a single “multibrowse” action caused two circles
to appear, prompting a discussion of whether sending two messages in response to a
single event was the most efficient way to design that particular application.
More details on how this visualization facilitated awareness and debugging
among iRoom users can be found in [88].
112
iClipboard Tracker: The iRoom has a global clipboard (the “iClipboard”), which
allows for copy-and-paste operations among machines. However, people often paste
and are surprised by the results, because there is no way to view the intermediate
contents of the clipboard. This application simply displays the current clipboard
contents.
iRoom Activity Visualization: This visualization provides awareness of recent
activity by others in the iRoom. It tracks the toggling the room’s X10
(http://www.x10.com) lights as an approximation of periods of activity.
Food@Gates: This display shows a schematic diagram of the building housing our
Computer Science Department (the Gates Building). An email client monitors a
popular mailing list where people post announcements of free food left over from
lunch meetings, and the location of the food. Upon receiving such a message, the
visualization highlights the appropriate part of the building map and also displays an
icon in that area indicating the type of food available. This gradually fades over a
period of 5 minutes, since that is the typical lifespan of free food in a situation where
graduate students are involved. In the first iteration of the AmbienTable, the
Food@Gates visualization displayed a short text description of the type of food
available (e.g., “Chinese” or “Pizza Chicago”); however, casual use suggested that
reading text at odd angles was difficult, so subsequent versions replaced this text with
simple icons.
4.5.3 Challenges and Design Guidelines
Our experiences creating and deploying the AmbienTable have allowed us to identify
several challenges inherent in using tables as peripheral displays, and to formulate
design suggestions to address these challenges.

113
(a) (b)
Figure 32: (a) The original activity visualization conveyed misinformation when viewed
upside-down. (b) The revised activity visualization is orientation-independent.
Orientation: Unlike vertical displays, tables do not have a single privileged viewing
angle. Because there is no single privileged angle of view for tables, it is important to
consider designing ambient displays that are rotation-invariant, or, at minimum, do not
convey misinformation if viewed at a non-standard angle. For example, the
AmbienTable’s visual depiction of activity levels in the iRoom originally displayed a
line graph (see Figure 32a), which had different interpretations when viewed upside-
down. The revised visualization (see Figure 32b) uses line thickness instead of line
height to convey activity levels, and uses changes in brightness to indicate the
direction of time flow. Since text is difficult to read at non-standard angles,
minimizing the use of text makes an ambient display more table-friendly.
Size: Because a table may be large enough to seat several people, a user at one end of
the table may not be able to see a part of the display that is farther from them. Unlike
vertical displays, users are not equidistant from the entire display. Ensuring that
everyone at the table gets to see all of the information is another challenge associated
with this form factor. Possible solutions to this problem include choosing a smaller
table size, having the display rotate so that everyone eventually sees all parts of it, or
having a design that involves periodic repetition of the display at different points
around the table.
Shape: Furthermore, unlike traditional vertical displays, which are typically rectangles
with the same (4:3) aspect ratio, tables vary widely in shape – rectangles, squares,
circles, ovals, even octagons are all relatively common. If a single software application
114
is written, it may not look correct on each of these different table types. One possible
solution is to develop using the DiamondSpin tabletop interface toolkit [136], which
facilitates constructing various polygonal tabletop interface geometries.
Occlusion: The potential for occlusion by other objects could be an obstacle
depending on the specific contents of a display – someone using a stock ticker monitor
could become frustrated if it were occluded at just the moment when it happened to
display a price change that was of interest to them. If time-sensitive information is
displayed, it may be desirable to periodically rearrange different parts of the display so
that there is an increased probability that key items will eventually be uncovered. Top-
projection can also help with occlusion issues, as the projected information will be
shown on top of objects placed on the table – although projection onto most objects is
less legible than projection onto the table (partially because these objects are not on
the same focal plane as the tabletop), there is still more information conveyed than if
the objects completely occluded bottom-projected information.
4.5.4 Tabletop Peripheral Displays: Conclusion
The ubiquity of tables makes them an intriguing vehicle for conveying ambient
information, and their familiarity and unobtrusiveness make them appropriate for
content intended as peripheral. Based on our experience developing the AmbienTable
prototype, we have discussed several challenges and corresponding design suggestions
that are applicable to designers of tabletop ambient displays. This work addresses the
issue of managing display elements for tabletop groupware systems by identifying
layout considerations (orientation, occlusion, table size and shape) relevant to the
design of successful ambient tabletop displays.
4.6 Cooperative Efforts with MERL
A portion of my experience in understanding the properties of group interaction with
tabletop displays and designing interactions and interfaces to better support tabletop
interaction comes from joint research efforts with researchers from Mitsubishi Electric
115
Research Laboratories (MERL). In this section, I briefly summarize a few projects led
by researchers from MERL (primarily Chia Shen, Kathy Ryall, Frederic Vernier, and
Clifton Forlines), in which I participated: a study of the impact of group size and table
size on work styles, an informal compendium of observations of DiamondTouch use
in a variety of contexts, a discussion of identity-differentiating widgets (iDwidgets),
and the creation of the DiamondSpin tabletop interface toolkit.
4.6.1 Impact of Group Size and Table Size
While many groups have reported experience in developing digital tabletop
applications, no one had formally examined the impact of interactive table size and its
interaction with group size. In our CSCW 2004 paper [125], we report on the results of
an experiment that begins to investigate the issue of size on shared digital tabletops
that afford simultaneous multi-user touch operations. We identify a number of size-
related issues that are important considerations for any designer of tabletop
environments (e.g., resource management, work strategy, social interactions, display
resolution, reachability, and visibility). We then describe a user study followed by its
results. We conclude by outlining a set of issues still to be examined with regard to the
impact of group size and tabletop size on table UI usability and directions for future
work.
Some highlights of the findings were that, with the two table sizes tested, the
size of the interactive tabletop does not affect the speed of task completion while the
group size does. With different group sizes, people develop different work strategies
in achieving the same collaborative goal. More interestingly, this work shows how the
distribution of resources strongly influences how people work together for different
group sizes, and that the work strategies used by the groups differed depending on the
resource distribution. This has strong implications for the design of digital tabletops to
enhance co-located group cohesion and collaboration. In addition, our experiments
revealed that for larger groups, designers might need to add additional vertical
displays for shared information. This finding opens the door for extending single-
display groupware to shared-display groupware settings with multiple shared displays,
such as iRooms [63].

116
4.6.2 Observations of Tabletop Use “In the Wild”
The collective experiences of researchers at MERL and Stanford from observing users
of interactive tabletop systems in four distinct contexts over the past two years have
revealed several interesting recurring themes and issues in interactive tabletop
computing. In our IEEE TableTop 2006 paper [127], we present the practical insights
gleaned from our hands-on experiences. We have organized our observations and
insights according to three key aspects of tabletop systems: (1) direct-touch
interaction, (2) the content and layout of information, and (3) the physical setup of the
interactive furniture. This collection of observations is intended to serve as a
complement to the growing body of controlled experimental studies of the use of
horizontal computing systems.
4.6.3 iDwidgets: Identity-Differentiating Widgets
iDwidgets (identity-differentiating widgets) are GUI building blocks for user-aware
environments; the iDwidget’s novelty is that its function, contents and/or appearance
are parameterized by the identity of its current user amongst a group of co-present
(local or remote) users. Thus an iDwidget may look or behave differently for different
user identities. By identity we mean a person with particular preferences and
privileges, or a tool associated with such a person (e.g., the stylus the person is using).
A person may have multiple identities (e.g., Dad and Senior Engineer).
Our papers on iDwidgets, from Interact 2005 [126] and IEEE Computer
Graphics and Applications [128], explore four different classes of these GUI elements:
widgets that customize function (e.g., via personalized semantic interpretations,
differentiated behavior, or privileged access), widgets that customize content (e.g.,
custom lists and menus), widgets that customize appearance (e.g., aesthetics, language
preferences, orientation), and widgets that customize group input (e.g., via cumulative
effect, simultaneous input, modal input sequences, or auditing). The power of a widget
lies in encapsulating a set of behaviors and packaging them up along with graphical
attributes so that it can easily be used and reused. The iDwidget concept, adding user
identity as a parameter in order to customize a widget in a multi-user setting, enables

117
interactions with widgets to be dynamically adapted on a per-user basis in a group
usage setting. iDwidgets support widget reuse (or sharing), thus reducing clutter on
shared tabletop displays.
4.6.4 DiamondSpin Tabletop Interface Toolkit
DiamondSpin is a toolkit for the efficient prototyping of and experimentation with
multi-person, concurrent interfaces for interactive shared displays. In our CHI 2004
paper [136], we identify the fundamental functionality that tabletop user interfaces
should embody, then present the toolkit’s architecture and API. DiamondSpin
provides a novel real-time polar to Cartesian transformation engine that has enabled
new, around-the-table interaction metaphors to be implemented. DiamondSpin enables
arbitrary document positioning and orientation on a tabletop surface. Polygonal
tabletop layouts such as rectangular, octagonal, and circular tabletops can easily be
constructed. DiamondSpin also supports multiple work areas within the same digital
tabletop. Multi-user operations are offered through multi-threaded input event streams,
multiple active objects, and multiple concurrent menus. We also discuss insights on
tabletop interaction issues we have observed from a set of applications built with
DiamondSpin.
DiamondSpin has proven to be a versatile toolkit to study, build, and
experiment with interactive tabletop applications, and to explore open research
questions.

118
5 Mediating Group Dynamics
Designers of tabletop interfaces face a dual challenge: in addition to considering how
interface designs impact human-computer interactions, the collaboration-centric nature
of tabletop UIs makes the impact of interface design on human-human interactions an
interesting topic in its own right. Consequently, we have explored how variations in
tabletop interfaces can impact group dynamics to promote effective teamwork. We
hypothesize that groupware that facilitates social processes will increase productivity
and subjective satisfaction. Good software design can help coordinate group actions,
encourage equitable participation in group activities, and increase awareness of
important events. We address these issues through our work on coordination policies,
the free rider problem, and cooperative gestures.
Section 5.1 presents multi-user coordination policies, interaction techniques
for allowing tabletop systems to respond to breakdowns in social protocols in a
sensible and predictable manner intended to minimize workflow disruptions. These
policies also provide mechanisms for preventing and avoiding specific breakdown
behaviors.
Section 5.2, describes a series of systems and experiments related to the design
of tabletop software for educational activities. In particular, we examine how tabletop
interface design can impact the “Free Rider” problem [65] by encouraging more
equitable participation among group members. We explore several interface design
variations (feedback modality, feedback privacy, spatial configuration, and interaction
visualizations) to assess their impact on promoting participation.
119
Section 5.3 examines cooperative gesturing, a multi-user gestural interaction
technique intended to increase participation and socialization, and to increase group
awareness of important application events. Section 5.4 explores a cooperative
interaction technique, in the vein of cooperative gesturing, intended to promote
increased social skills development for adolescents with Asperger’s Syndrome. This
latter work was joint work with Anne Marie Piper.
5.1 Multi-User Coordination Policies
This section motivates the use of software-based coordination policies for Single
Display Groupware. We describe the design and implementation of a set of
coordination policies that illustrate interesting aspects of the design space. Note that
formal experimental evaluations were only conducted for a subset of these policies
that permit fluid alteration of document access permissions, as described earlier in this
dissertation (Section 3.1).
3.1.1 Survey of User Expectations
While observing multiple, co-located users interacting with a DiamondTouch table
[31], we noticed several conflicts between users, such as one user taking a digital
document (such as a text file, image, or web page) away from another user who was
actively using it, as described in section 5.1. These observations motivated us to
propose coordination policies – software-level support to provide deterministic
outcomes to multi-user conflicts in co-located groupware [91] [118]. To aid us in
designing coordination policies that were “natural” to users, we administered two
surveys to gather data on user expectations regarding the outcome of conflicts between
users over documents. The first survey assessed current coordination practices with
paper, and the second ascertained user expectations regarding coordination when using
a multi-user interactive table. Twenty people from our lab completed the first survey,
and twenty-seven completed the second.

120
3.1.1.1 Survey 1 – Paper Documents
The first survey presented people with two generic, open-ended scenarios familiar
from the world of paper documents. Both scenarios concerned two users, A and B,
who were sitting across from each other at a table. One was a “take” scenario: A is
holding a paper document, and B grabs hold of it. The other was a “give” scenario: A
and B are sitting at a table, and A wants to share a paper document with B.
Respondents were asked to describe all the potential ways they could think of for how
A and B could resolve each situation.
Despite the free-form nature of the responses, there was a large overlap among the
answers. The following were the most popular proposed methods for A and B to
coordinate shared access to the single paper document:
• Giving the document to the other person/allowing the other person to take it. (16 of
20 surveys)
• Moving the document across the table in order to indicate willingness to share it.
(15 of 20 surveys)
• Choosing not to share the document/not to allow others to take it away. (13 of 20
surveys)
• Resolving the issue verbally (e.g., arguing, formal negotiation, use of phrases such
as “please”). (13 of 20 surveys)
• Reading the document out loud to the other person. (11 of 20 surveys)
• Rearranging the chairs in order to sit next to the other person. (11 of 20 surveys)
• Turning the document so that it is properly oriented for the other person. (10 of 20
surveys)
• Using a photocopy machine to duplicate the document. (9 of 20 surveys)
• Tearing the document in half (purposely or accidentally). (8 of 20 surveys)

121
3.1.1.2 Survey 2 - Digital Documents
The second survey presented questions analogous to those in the first survey, but
rather than the world of paper documents, these questions involved contention over a
digital document (text, image, html, etc.) on a touch-sensitive interactive table. A
photo of two people touching the same digital document on a DiamondTouch table
was shown at the top of the survey so that respondents could better envision the
scenario in case they were unfamiliar with the concept of a computationally-enhanced
table.
Again, despite the open format for responses, there was a large amount of overlap
in people’s answers, with some choices that were particularly popular:
• The system ignores the touches of someone trying to “steal” a document, and the
original owner would keep it. (24 of 27 surveys)
• A copy of the document is automatically created so that both users can interact
with it. (20 of 27 surveys)
• The system allows the person trying to “steal” the document to successfully take it
away from its original owner. (17 of 27 surveys)
• Levels of privilege exist – if the computer detects that the “stealer” is more
privileged than the owner, then the stealer gets the document. (12 of 27 surveys)
• If the owner of the document “lets go” of it (by lifting her hand from the table)
then the system will allow the other user to take it. (11 of 27 surveys)
• A popup dialog box appears, asking the owner to explicitly grant or deny
permission for the other user to take the document. (10 of 27 surveys)
3.1.1.3 Discussion
The emergence of several popular outcomes to the paper and digital scenarios suggests
that emulating these proposed behaviors in response to document-level conflicts in an
actual multi-user tabletop system would be perceived as “natural” by most users. The
popular response of reorienting the paper was also identified as an intuitive method of

122
brokering document access in the work of Kruger et al. [72], who found that people
use the orientation of paper documents to indicate their willingness to share them. The
popularity of the proposed strategy of moving the document across the table to be
closer to another user is supported by the work of Scott et al. [132], who found that
people working with traditional materials on tables often treat items near the edges as
“personal” regions and in the center as a “group” region.
The responses to our two surveys informed the design of multi-user
coordination policies, described in Sections 5.1.4 and 5.1.5 (and in [91]), and
techniques for document-sharing on interactive tables, described in Section 3.1 (and in
[118]). For example, allowing another person to take a document is supported by our
software’s “public” policy, while not allowing this is supported by our “private”
policy. Moving a document across the table to share it is supported by our “sharing”
policy using the “relocate” technique, turning a document so that it is properly
oriented for another person is supported with our “reorient” method for sharing, and
indicating a willingness to share by “letting go” of a document is supported by our
“release” technique. Privilege levels are reflected in our “rank” policy, document
copying is possible with our “duplicate” policy, and our “dialog” policy allows users
to explicitly grant or deny permission for other users to take their documents. We also
included a policy that allows users to tear digital documents in half, as suggested in
response to the paper survey. Our multi-user coordination policies also facilitate
conflict outcomes that were not among the popular responses to these surveys – it
remains to be seen whether these latter policies will be regarded as being as intuitive
to use as the survey-inspired ones.
It is interesting to note that some answers were essentially the same in response
to both the paper and digital scenarios, while other responses were elicited only by one
or the other. The concept of duplication, for instance, appeared frequently in response
to both surveys, although the paper survey responses used traditional means (a
photocopier) to achieve this result while the digital ones relied on electronic file-
copying. Also, several of the responses concerning duplication in the digital scenario
further specified the semantics of the copying (the presence or absence of “write
123
permission”). As a result, our implementation of the “duplicate” policy for resolving
conflicts over a single document offers three different semantics for duplication –
creating either a read-only copy, a read-write copy, or a copy linked to the original
(changes to either will be reflected in both).
Particularly noteworthy is the fact that the paper scenario elicited far more
“social” responses than the digital one – rearranging the seats around the table, reading
the document out loud to a partner, and explicit social negotiation were all common
responses to the paper scenarios, while the concept of moving the chairs or reading out
loud were not mentioned by any of the digital survey respondents, and only five of the
twenty-seven digital survey responses (18.5%) mentioned some form of social
negotiation (in contrast to thirteen of the twenty “paper” surveys – 65%). This might
suggest that, perhaps because of the “newness” of co-located, collaborative digital
media such as interactive tables, social solutions that would readily apply when
interacting with traditional paper media may not come to mind in this novel
technological setting. This is a possible explanation for the reason we observed
conflicts (such as “stealing” documents from other people) among users of our digital
tabletop system, which would have been considered rude had they occurred with
traditional media (nobody would dare snatch a piece of paper out of their co-worker’s
hand!). Further investigation of this issue is warranted.
Administering surveys to learn about users’ expectations regarding the
outcome of conflicts between two people over a single document proved to be an
effective technique for identifying several potential solutions to this problem, which
we could implement in our interactive tabletop software. By asking about both paper-
based and digital scenarios, we received more proposed solutions than we would have
had we only administered one of our surveys. The next step is to investigate how users
react to actual implementations of coordination policies inspired by these survey
responses – we hypothesize that solutions that were mentioned by the majority of
survey respondents will be perceived as more “natural” than those that were only
mentioned by a few individuals.

124
5.1.2 Coordination Policies: Motivation
Along with the benefits of enabling and enhancing group productivity, co-located
CSCW applications also introduce new challenges. In particular, allowing multiple co-
located people to simultaneously access a shared display gives rise to several types of
conflicts. For instance, one user may change an application setting that impacts the
activities of other users. The ease of “reach out and touch” on direct-manipulation
devices such as shared multi-user tabletops makes reaching into another user’s space
or manipulating another user’s documents tempting, further motivating software-level
coordination mechanisms.
We propose a variety of coordination policies that aim to provide applications
with more structure and predictability than social protocols, yet also allow for more
flexibility than rigid access permissions. The ideas we present regarding coordination
policies focus on policies applicable to direct manipulation on shared tabletops,
although many of the concepts are also relevant for shared vertical displays.
Previous work on conflict resolution and avoidance in multi-user applications,
such as work by Greenberg and Marwood [44], has focused on remote collaboration,
and is concerned chiefly with preventing inconsistent states that can arise due to
network latencies. In contrast, our work does not focus on conflicts caused by network
latencies, but rather on the conflicts that arise in a co-located, single-display, direct-
manipulation environment. Scott et al. [131] cite policies for accessing shared digital
objects as a major design issue facing the emerging field of tabletop CSCW systems.
Furthermore, Stewart et al.’s landmark paper on Single Display Groupware [150]
warns that a potential SDG drawback is that “new conflicts and frustrations may arise
between users when they attempt simultaneous incompatible actions.”
Relying solely on social protocols to prevent or resolve conflicts is not
sufficient in many situations. Greenberg and Marwood [44] observed that although in
some cases social protocols provide sufficient mediation in groupware, they cannot
prevent many classes of conflicts including those caused by accident or confusion,
those caused by unanticipated side effects of a user’s action, and those caused by
interruptions or power struggles. In the Kansas system [144], Smith et al. originally

125
felt that social protocols were sufficient for access control, but then observed that
problems arose from unintentional actions. When conducting user studies of the
Dynamo system [62], which relies largely on social protocols for handling conflicts,
Izadi et al. observed that users had problems with “overlaps” – situations where one
user’s interactions interfered with another’s. They noted several “overlaps,” such as
one user closing a document that belonged to someone else in order to make room for
his own document. Users testing the Dynamo software also expressed concern that
other users might steal copies of their work without permission.
Our own observations of groups of people using shared tabletop applications
offer further support for the potential benefit of software-level coordination policies.
Over the course of our work developing Table-for-N [136], the Magnetic Poetry Table
[136], and other software designed for use on a DiamondTouch [31], we have seen
both accidental and intentional conflicts arise.
Table-for-N (TFN) is an application for up to four people sitting around a table
collaboratively annotating, manipulating, and browsing various types of documents.
We have observed a variety of coordination difficulties among TFN users. For
example, TFN offers multiple “views,” analogous to the different screens provided by
a “virtual desktop” application. We have seen one user switch to a new view while
others were in the midst of manipulating items in the current view, thereby disrupting
their work. Another example relates to TFN’s “magnet” feature. When a user presses
her magnet, all of the open documents on the table reorient to face that user. We have
seen that people often magnetize all documents to face themselves even though
another user may have been examining one of them.
We observed additional conflicts among users of a tabletop version of
“magnetic poetry.” This software allows up to four users to simultaneously rearrange a
variety of word tiles to create poems, using either an English or a Japanese tile set. We
saw one person switch the tile set while other people were in the midst of creating
poems. We also observed people “stealing” words from one another for use in their
own creations.

126
Another table-based poetry application we have made allows people to
collaboratively reproduce a target poem by finding the correct words from a group of
word tiles and arranging them on a piece of virtual “paper.” One common conflict that
we have noticed occurs when one user is in the midst of adding words to the paper and
another user takes the paper away from him. Social norms suggest it is rude to infringe
on other people’s personal space, but while testing both our poetry application and
another application that allowed four users to browse music, we found people
violating this social protocol by reaching into other users’ areas of the table rather than
asking them to pass something.
All of our observations took place with groups of two to four people sitting
around an 80 or 107 cm diagonal table. Intuition told us that small groups working in a
small, easy-to-monitor area should be able to use social negotiation to coordinate their
actions, but even in these circumstances we observed frequent mishaps! We
hypothesize that as the size of the group grows, social negotiation will become even
more challenging since it will become more difficult to monitor everyone else’s
actions, although a corresponding increase in table size might mitigate this by making
it physically difficult to reach other users’ documents.
5.1.3 Design Considerations
Through our experiences with multi-user tabletop applications, we have observed two
key conflict dimensions. The first is conflict type, which refers to the level at which
the conflict occurs – whether it affects the state of the entire application or only a
single document. The second is initiative, which refers to whose actions determine the
outcome of the conflict.
The three conflict types we observed are global, whole-element, and sub-
element. Global conflicts involve changes that affect the application as a whole.
Examples include changing the current “virtual table” being viewed, or issuing a
command that changes the layout of all documents on the table. These actions are
potentially disruptive to other group members. The notion of introducing policies to
mediate global conflicts is supported by Shen and Dewan’s suggestion that multi-user
applications ought to define collaboration rights not only for traditional editing

127
operations, but for any operation that might affect multiple users [138]. Whole-
element conflicts involve access to a single object. Examples include multiple users
trying to handle the same document, or multiple users trying to select from the same
menu. Sub-element conflicts occur when several users are editing the same item
simultaneously and issue conflicting changes. Because many issues in this category
have already been explored in the context of group document-editing software such as
MMM [14], we do not address them here.
An important subset of whole-element conflicts are manipulation conflicts.
Recent advances in sensing hardware, such as DiamondTouch technology [31],
SmartSkin [114], and DViT [145] have enabled a level of parallelism in face-to-face
collaborative software that was not possible with previous single display groupware.
These touch-sensitive technologies support multiple, simultaneous touches, leading to
the potential for conflict between multiple users trying to manipulate a document.
Several of our policies attempt to control a document’s manipulation access rights as a
means of preventing conflict – manipulation access refers to the ability of a user to
interact with an element by moving it around the display.
There are also three initiative strategies for resolving these conflicts: proactive,
reactive, or mixed-initiative. Proactive policies allow an element’s owner or the
initiator of a global change to control the outcome of the conflict. Reactive policies
produce an effect based only on the actions of the other users (e.g., the person who
tries to take a document away from its owner, or the users who are affected by a
proposed global change). Mixed-initiative policies factor in information from all
parties involved in the conflict to determine the outcome.
This categorization is useful for designers considering which coordination
policies would work well in their application. Our design suggestion is to include at
least one proactive and one reactive policy so that users have a mechanism for
choosing to share an object (via the proactive policy), and there is also a deterministic
outcome when users try to take an object (via the reactive policy). Designers can
provide coverage for a variety of conflicts by selecting one global policy and one or
more whole-element policies for use in their application. Whole-element policies
128
could be mixed and matched in several ways – a single policy could apply to all
elements, each user could have a different policy applying to all the documents they
own, different types of documents could be associated with different policies, or each
individual item could have its own distinct policy.
Table 6 illustrates this design space, showing where our proposed coordination
policies fit. In the following section, we describe each policy in detail. Because they
are meant to be relevant to a variety of applications, we discuss them in terms of
abstract “documents,” which include text and images, or “elements,” which include
things like menus. In Section 5.1.6 we will describe applications that make use of
these mechanisms. We anticipate that continued experimentation with and evaluation
of novel coordination strategies will allow us to further articulate this design space.
The following two sections list and define global and whole-element coordination
policies that we have prototyped. The specific policies were motivated by several
factors, including experiences with traditional paper documents, as well as the results
of the survey described in Section 3.1.1.

129
Table 6: The proposed coordination policies, grouped along the dimensions of conflict
type (rows) and initiative (columns).
Proactive
Mixed-
Initiative Reactive
Global
privileged objects
anytime
rank no selections
no touches
no holding documents voting
Whole-
Element
sharing
explicit
dialog
rank
speed
force
public
private
duplicate
personalized views
stalemate
tear
5.1.4 Global Coordination Policies
No Selections, No Touches, No Holding Documents: These three policies dictate
conditions under which a change to global state will succeed – if none of the users
have an “active” selection on the table, if none of the users are currently touching
anywhere on the table, or if none of the users are “holding” documents (touching an
active document with their hand).
Voting: This policy makes group coordination more explicit by soliciting feedback
from all users in response to a proposed global change. Each user is presented with a
voting widget that allows him to vote in favor of or against the change (see Figure 33).
Several policies (majority rules, unanimous, etc.) could determine the outcome.

130
Figure 33: The red, green, and blue users are asked to vote whether to accept the yellow
user’s global state change (i.e., to quit the application).
Rank: This policy factors in differences in privilege among users and can be used in
conjunction with other policies, such as “no holding documents,” thus changing the
policy to mean that a global change will succeed if the user who initiated the change
outranks other users who are currently holding documents.
Privileged Objects: Under this policy the determining factor is the way a change is
initiated, rather than the circumstances of other users at the time of the proposal. For
instance, there might be a special menu that must be used to make global changes,
rather than including these options in each user’s individual menubars. This might
encourage more discussion among users by necessitating that they ask someone to
pass them this privileged object. Also, requiring the use of a special interface

131
mechanism might make people more aware of the effect their interaction is going to
have on other users.
Anytime: This policy allows global changes to proceed regardless of circumstance –
we included it for completeness and to provide an option for designers who want to
rely on social protocols.
5.1.5 Whole-Element Coordination Policies
Public: This policy places no limits on who can access an element, instead relying on
social protocols.
Private: With the “private” policy, any attempt by a user to manipulate a document he
does not own or to select from a menu invoked by another user will be unsuccessful.
Duplicate: With this policy, the contested item duplicates itself (see Figure 34). Three
variants of this policy use different semantics for duplication: (1) creating a view
linked to the original (changes made to either copy are reflected in both), (2) creating a
read-only copy, or (3) creating a fully independent, read-write copy.
Figure 34: The “duplicate” policy automatically creates a second copy of a document
that is simultaneously accessed by two people.
Personalized Views: This policy allows a user to obtain a document from another
user or to select from another user’s menu, but it first transforms that document or
menu to display content customized for the user who takes it. For instance, if user A’s

132
menu has a list of bookmarks made by user A, and user B tries to use the menu, the
menu would change to show user B’s bookmarks (see Figure 35). Or, if user A had
annotated a document and user B took it, the document would hide user A’s
annotations and display only annotations made by B.
(a)
(b)
Figure 35: Under the “personalized views” policy, a list of bookmarks changes its
contents when two different users interact with it.
Stalemate: This is a “nobody wins” strategy for resolving conflicts. If a user attempts
to take a document from someone else, the document becomes temporarily inactive to
both users. This could encourage collaborative conversation.
Tear: Inspired by paper, this strategy handles a conflict by two users over a single
document by breaking the document into two pieces (see Figure 36). This might
encourage the pair to negotiate before reassembling the document so that work can
continue.
Figure 36: The “tear” policy draws attention to social breakdowns by mimicking paper
interactions.

133
Rank: A higher-ranking user can always take documents from or select from the
menus of lower ranking users.
Speed, Force: These two policies are examples of policies that use a physical
measurement (the speed with which each user pulls on the document, or the pressure
each user applies to the document) to determine who is the “winner” of a contested
item.
Sharing: “Sharing” allows users to dynamically transition an element between the
“public” and “private” policies. To support sharing, we have explored four interaction
techniques – release, relocate, reorient, and resize, which are described in section 3.1
and [118].
Explicit: When using this policy, a document’s owner retains explicit control over
which other users can access that document. For example, the owner can grant and
revoke manipulation or write permissions on the fly by interacting with tabs on the
edge of the document that toggle the permissions for individual users (see Figure 37).

134
(a) (b)
Figure 37: Under the “explicit” policy, a document’s owner (e.g., the green user [bottom
tab] in (a)) can touch colored tabs on the side of a document to toggle other users’
permissions (e.g., granting access to the yellow [second tab from bottom] and red [second
tab from top] users in (b)).
Dialog: This policy offers standard WIMP semantics, responding to an attempt to
“steal” a document by prompting the document’s owner to allow or forbid the action
via a popup dialog box.
5.1.6 Application Scenarios
The policies we have presented could be used individually or in combination
depending on the context of the application. The following scenarios illustrate table
applications that would be well-served by each of our proposed coordination policies.
A photo-browsing application which provides options such as clearing all
open photos off the table, or re-orienting all open photos to face a certain user:
Policies such as “no holding documents” or “no selected documents” would be
suitable here, because it is probably not appropriate to remove or reorient a photo that
is actively being inspected by another user.

135
An educational application that lets a group of students explore a topic and
then answer questions on it: “Voting” might be desirable here to ensure that all the
students are finished with the current topic and are ready to move on to the next part of
the assignment. This policy is especially useful with larger tables and/or larger groups
of people where it is harder to explicitly coordinate such actions.
A business productivity application used for interactive presentations: Here,
the “rank” setting might be useful – the presenter would have a higher rank than the
participants so that the participants would be able to interact with appropriate parts of
the presented material but would not be able to alter any key settings or accidentally
terminate the presentation.
A competitive tabletop game: A policy such as “privileged objects,” which
requires possession of a special object in order to make a global change, might be
appropriate for a competitive game in which players earn use of the special object
through gameplay. The “anytime” policy might also be suitable for a game since
disrupting the other players with surprising state changes might be advantageous in
competitive situations.
A walk-up-and-use table in a museum exhibit: Since none of the table
elements belong to any of the users, controlling access may not be desirable. The
“public” policy would be sufficient here.
A large public table in a library, where several strangers work on individual
projects in parallel: The “private” policy might be appropriate, since the individuals
are not working collaboratively, but are simply sharing the resource of the electronic
table. Moreover, they are each working on their own information, and may not trust
users they do not know with permission to access it.
A brainstorming session where several people want to illustrate their own
ideas for the best way to modify a design diagram: The “duplicate” policy would
facilitate this situation by allowing each person who grabs the diagram to receive their
own copy of it, which they could use to illustrate their idea without taking the diagram
away from a colleague. Or, they could use the “personalized views” policy – instead

136
of overwriting a colleague’s work, each user’s individual annotations would be
displayed on the diagram only when that user is touching it.
Several children playing an educational game meant to emphasize cooperative
skills: This application might benefit from the “stalemate” conflict-resolution policy,
to emphasize that when users fight over an object, nobody wins. Similarly, the “tear”
policy might force cooperation in this scenario.
A table used in a classroom by a teacher and her students: The “rank” policy
might be useful, so that a student cannot manipulate the teacher’s documents, but the
reverse is permitted.
A group of teenagers playing a competitive tabletop video game: Policies like
“speed” and “force” would test the users’ skills and reaction time, and add an
interesting dimension to gameplay.
A group working on a joint project – there is some collective discussion and
work, as well as periods where group members individually edit items: “Sharing” is
appropriate in this situation, as this policy would allow group members to transition
their documents between public and private modes for times of group work and times
of individual modifications. The “explicit” policy is a viable alternative – a user could
choose which collaborators to grant access to during the times of group work, and
could revoke those permissions when they are no longer applicable.
A group working around a very large table: When an event, such as one user
manipulating a document owned by somebody else, occurs outside of the document
owner’s field of view, the “dialog” policy might be appropriate, since it creates the
permission-granting dialogue box near the user’s focus of attention, thus increasing
their awareness of relevant events occurring at the other end of the table.
5.1.7 Multi-User Coordination Policies: Conclusion
Coordination mechanisms beyond social protocols can play an active role in co-
located groupware – besides preventing conflicts that may arise due to confusion or
malicious intent, such policies help ensure that software has deterministic, predictable
responses to multi-user interactions. We have observed that social protocols do not
always suffice in relatively simple situations, and we suspect that the need for

137
coordination may increase as the number of users, the number of documents, or the
size of the surface increases (although an increase in table size could reduce the
number of whole-element conflicts by making it more difficult to reach other users’
documents, it could potentially increase the number of global conflicts by making it
more difficult to monitor and coordinate the activities of other users).
We have introduced a framework for discussing multi-user coordination in
terms of conflict type (global, whole-element, or sub-element) and initiative
(proactive, reactive, or mixed-initiative). We have also proposed a set of coordination
policies, and presented motivating scenarios for their use. This work addresses the
issue of mediating group dynamics by proposing interaction techniques for mitigating
the impact of social protocol violations on tabletop workflows.
An interesting avenue for future work would be to examine the applicability of
this framework beyond tabletops, to other SDG form-factors. We have presented an
initial set of policies to address the multi-user coordination difficulties introduced by
shared display groupware; however, the potential space of coordination policies is
large – we also hope to someday expand our taxonomy of coordination strategies to
reflect new insights we gain as we continue our exploration of multi-user coordination
and the challenges it presents.

138
5.2 Supporting Cooperative Language Learning
Figure 38: Four students sit around a touch-sensitive DiamondTouch table, working
together to match pictures with words in a foreign language, using the MatchingTable
software.
The importance of collaboration in small-group work and methods for
facilitating effective group work, specifically through group problem-solving tasks, is
a prominent research topic in the field of education, as described by Webb [172].
Small group work is also particularly valuable in the domain of foreign language
learning, where peer-to-peer interaction provides important opportunities to practice
conversational skills, as noted by Johnson and Arenas [64]. Educational activities may
benefit significantly from interactive table technology because it combines the face-to-
face interaction style of traditional small-group work with the enhancements of digital
media. Digital technology offers many benefits for educational activities – in
particular, digital technology can help address the problem of having one teacher for
many students. When students are working on a small group activity, the teacher can

139
only assist one group at a time. With digital technology, however, groups can still
receive feedback regarding their progress even when the teacher is busy helping other
students. Allowing students to immediately know they have found the correct answer
has pedagogical benefits and increases group efficiency, as shown in a study on
immediate and delayed feedback in the context of a LISP tutor [26]. The reciprocal
benefit applies to the instructor – even though she cannot monitor the behavior of all
students simultaneously, the digital technology can keep interaction records that can
be reviewed after class, so that she can discover which students need extra help or
which topics need more explanation. Interactive tables combine the benefits of face-
to-face small group work with the ability of digital technology to provide feedback to
students and interaction records to teachers, making them an excellent platform for
educational groupware.
5.2.1 Related Work
The benefits of facilitating effective small-group work with problem-solving tasks are
widely researched in the educational community. Small-group work presents
opportunities for learners to share insights [18], explain their thinking [68], observe
the strategies of others [5], and listen to explanations [25].
Most prior work on tabletop user interfaces focuses on applications of
interactive tables for entertainment, such as playing games, including card games [84]
and Magnetic Poetry ([125] and [136]) and viewing digital photographs, such as
Rogers et al.’s calendar-making application [120] and the PDH [134]. A few projects,
such as the InteracTable [151], UbiTable [135], and RoomPlanner [181] have explored
the use of tables for productivity-based tasks such as document annotation, document
sharing, and furniture layout, respectively. Our work on educational tabletop interfaces
explores the potential utility of this new technology platform for computer-supported
collaborative learning (CSCL) tasks. Recent work on the StoryTable [24] and Read-It
[142] describe educational tabletop applications for very young (kindergarten-aged)
children. Our work focuses on designing tabletop applications for teenage through
college-aged students learning a foreign language.

140
5.2.2 System Description
These applications run on the standard DiamondTouch setup, as described in Section
2.3.1. Some of our applications deliver private audio messages to members of the
group based on items they are interacting with on the display. Users receive this audio
through one-eared headsets, using a system similar to that described Section 3.2.
We have created three language-learning applications with flexible structures
that can be adapted to fit varying content. The three applications are the
ClassificationTable, the MatchingTable, and the PoetryTable.
The ClassificationTable (see Figure 39 and Figure 40) presents users with a set
of virtual “clues.” A clue can vary in length from a single word to several sentences,
based on the current lesson. The four corners of the table are labeled according to four
different categories (e.g., countries, characters from a novel, authors, vocabulary
themes, number of syllables, etc.), and the task for the group is to classify each of the
clues into one of these four categories. Users can touch clues with their fingers and
drag them around the table. Clues re-orient themselves to face the nearest table edge in
order to facilitate legibility. Users can drag a clue into one of the corner regions, and
receive feedback from the system regarding the correctness of their classification (the
form of this feedback is described in the “design variations” section). Users work
together with their teammates to decide on the correct classifications.

141
Figure 39: This screenshot shows the ClassificationTable at the beginning of a task for
students learning Spanish. Clues are piled in the center of the table. Each clue is a
Spanish-language fact pertaining to one of the four countries depicted in the table’s
corner areas. Students drag clues around the table with their fingertips and drop them
onto the appropriate corner, then receive feedback about the correctness of the
classification.

142
Figure 40: The ClassificationTable allows students to sort individual vocabulary words
or longer sentences into one of four corners of the table, based on various properties. In
this example, students learning English work together to classify the English words
according to the number of syllables they contain. Double-tapping a word allows a
student to hear it pronounced through a private headset. The words turn green when
they have been properly classified, and red when they are placed incorrectly.
The MatchingTable (see Figure 41) allows students to match words and
phrases with images. Students can move words and photos around the table by
touching them with a finger and dragging them. Words can be associated with a photo
by dragging them on top of the photo and letting go. The words are then attached to
that photo, and if the photo is subsequently moved, the words will stick to it. Words
can be removed from a photo by touching the words and dragging them away. The
words turn green when they have been correctly matched and red when they have been
incorrectly matched.

143
Figure 41: The MatchingTable application allows students to match words and phrases
with images. In this example, students learning English wrote descriptions of themselves
during class, and then a few days later tried to match their classmates’ photos to the
phrases they had used to describe themselves.
The PoetryTable (see Figure 42) allows students to create free-form sentences
and phrases by moving word tiles around the table with their fingers. Words can be
conjugated by the addition of prefixes and suffixes, which are available as choices
from a menu invoked by double-tapping a word tile. The activity is made more
challenging by presenting both correct and incorrect options for students to choose
from in the conjugation menus. This application is a descendant of the entertainment-
oriented tabletop poetry application mentioned in [136].

144
Figure 42: The PoetryTable application allows students to create free-form sentences
using current vocabulary words. Double-tapping a word tile invokes a menu that allows
the student to alter the word by adding prefixes and suffixes.
The design of our software was influenced by previous findings regarding
design guidelines for tabletop applications. Research on the SoundTracker system [90]
found that private feedback helped encourage shy group members to interact more
with the tabletop. Since one of our goals is to encourage all students, including
underperformers, to be engaged with the learning activity, we have experimented with
the use of private feedback in our applications’ design. We have also taken into
account Scott et al.’s findings on territorial tendencies [132] – we placed the
ClassificationTable’s “category areas” in the corners of the table, rather than along the
sides directly in front of each seat, in order to reduce each individual user’s sense of
“ownership” over each area, so that all group members would feel comfortable placing

145
clues in any region. Finally, we used the DiamondSpin tabletop toolkit [136] to design
an interface that gracefully handles issues of orientation on the tabletop: to facilitate
readability, items on the table turn to face the closest table edge.
This system differs from other language-learning technologies, as the majority
of those technologies are tools for rote memorization, conjugation, and translation
(e.g., “Study Spanish,” an online tutorial that emphasizes vocabulary and verb
conjugation drills14). These applications emphasize memorization of language
mechanics but lack focus on the conversational skills that are central to developing
fluency. Based on interviews we conducted with two professors of beginner- and
intermediate-level foreign language courses at our university, fluency, the willingness
to engage in conversation, is the main educational goal for beginner and intermediate
foreign language students,
Our three tabletop applications provide foreign language learners with an
opportunity to engage with peers in conversation while completing activities related to
vocabulary, pronunciation, literature, or cultural knowledge. Our software gives
learners immediate feedback on the accuracy of answers, thus heading off any
misconceptions that may arise with delayed feedback. Our applications give students
an opportunity to explain, justify, and debate answers with other group members. The
content of each activity serves as a conversational prompt, thus encouraging learners
to develop fluency through engaging in conversation with one another. Our emphasis
on fluency and language acquisition aligns with the pedagogical approach for foreign
language within our university’s foreign language program.
5.2.3 Design Variations
Two factors of particular interest for educational applications is how they impact
students’ levels of participation in the activity and how they facilitate awareness of
one’s own and others’ contributions. Participation can measure either direct
interactions with the software itself or the amount of foreign-language conversation
produced by each group member, since both of these actions align with desired 14 http://www.studyspanish.com

146
learning outcomes. Increasing the amount of and equitability of participation among
group members is a concern for educators, since one drawback of group work is the
tendency for the strongest students to complete work while underperforming group
members hardly participate. This problem is known as the “free rider” problem [65].
Increased awareness of one’s own and others’ contributions to an activity can impact
participation, and result in more accurate self assessment. Accurate self-assessment
has valuable implications for second-language learning, as described in Ross’s
research [123].
We are interested in how the pedagogical value of educational tabletop
groupware can be improved by subtly altering the user interface to impact
participation and awareness. To explore this issue, we created several variants of our
tabletop activities. We then conducted preliminary evaluations with students at our
university in order to determine whether our design variations had a perceptible
impact on participation equity and self-assessment accuracy in order to identify which
design variants showed promise for more extensive exploration and evaluation. These
variants fall into four main groups: feedback modality, feedback privacy, spatial
configuration, and interaction visualizations.
Feedback Modality: One variation we explored was the modality through which we
provided feedback regarding the correctness of clue classifications in the
ClassificationTable application. We explored two alternatives – visual feedback (the
clues’ text turned either green or red to indicate correct or incorrect placement), and
audio feedback (either an upbeat or discordant tone was played to indicate correct or
incorrect placement). We hypothesized that audio feedback would increase the amount
of conversation among group members (important for rehearsing a foreign language)
by “breaking the ice” and inserting noise into the environment, thereby making it less
awkward for students to generate their own “noise” by talking. Audio feedback should
also increase awareness since it “pushes” information to users.

147
Feedback Privacy: Another interface variation we explored was whether feedback
regarding the correctness of clue placement in the ClassificationTable activity was
conveyed publicly (to the entire group) or privately (only to the group member who
moved a particular clue). To explore private feedback in the context of the shared
environment, we used individually-targeted audio feedback via one-eared headsets (a
setup similar to that described in Section 3.2). We hypothesized that private feedback
would increase participation equity by reducing the potential for embarrassment over
incorrect answers, and thereby encouraging shy and underperforming students to
contribute more to the activity. We also hypothesized that private feedback would
increase the accuracy of students’ self-assessments of performance by drawing more
attention to their individual contributions.
Spatial Configuration: We altered the initial configuration of clues and photos in our
three tabletop activities in order to explore the impact of initial layout on participation.
In the “four piles” design, all objects (clues, word tiles, photos, etc.) were initially
placed into four random, equally-sized virtual “piles” near the four users’ seats around
the borders of the table. In the “central pile” design, all objects were initially placed
into a single virtual pile in the center of the table. We hypothesized that the four piles
design would increase participation equity as compared to the centralized design by
making under-contributors feel more responsibility for the items that started out
nearest them, and by making over-participators hesitant to reach out and take
responsibility for objects that originated near others. This hypothesis is in accordance
with Scott et al.’s studies of tabletop group work [132] that have found that the central
area of a table is considered a group-owned, public space, while the areas directly in
front of each user are considered personal or private zones.
Interaction Visualizations: DiMicco et al. [33] explored the impact of a real-time
visualization on group participation in a planning task (where participation referred to
the amount each person contributed to a conversation). For the planning task, they
found that over-contributors spoke less in the presence of the visualization, but that

148
under-contributors did not increase their participation because they did not believe the
display was accurate. Inspired by this study, we have integrated real-time histograms
into some versions of our tabletop activities (see Figure 43). The histograms appear on
the table in the region directly in front of each user, and reflect the number of answers
contributed by each group member based on tracking touch interactions with the table.
We hypothesize that the histograms in our application will increase participation
equity and awareness, and will have greater impact than in the setting in [33], because
they should have more credibility to users in the context of a computer-mediated
activity, since they track the number of answers each group member has contributed.
We have also altered the design of the visualizations described in [33] to make them
more appropriate for a collaborative educational activity by having a customized
visualization for each group member (instead of a single visualization for viewing by
the entire group); we highlighted the current user’s bar in color and grayed out the bars
representing the other three users, so that students would feel they were comparing
themselves more to a group average than competing directly against other group
members.

149
Figure 43: Interaction Visualizations in front of each user reflect his contribution to the
activity (the number of attempted answers) relative to the rest of the team.
5.2.4 Evaluation
To evaluate the utility of tabletop groupware for foreign-language learning activities,
and to explore the impact of our design variations on participation and awareness, we
observed the use of our system in two distinct contexts. The first context was a
controlled laboratory setting where subjects who were learning a foreign language (but
were not all members of the same class, or at the same level of proficiency) used the
table for a single, one-hour session. The second use context was as part of a language
course at our university. This latter set of students used the table during two sessions
over the course of two weeks, completing activities that tied in to the current lessons
in their class.

150
5.2.4.1 Context 1 – Controlled Lab Setting
In the lab setting, we used the ClassificationTable software with four variations of an
activity where clues contained Spanish-language descriptions of geographical and
cultural facts about Spanish-speaking countries, which had to be grouped according to
the country they described. This study explored our first two design variants –
feedback modality and feedback privacy.
We recruited thirty-two paid subjects from within our university, who
performed the experiment in groups of four (for a total of eight groups). Subjects’ ages
ranged from 18 - 28; 17 were men and 15 were women. Subjects spoke English as
their primary language and had formally studied Spanish by taking at least one year of
classes, and in some cases had completed several years of study.
The study employed a within-groups design, with each group using the table in
each of four feedback conditions (no feedback, visual feedback, public audio
feedback, and private audio feedback). In each condition, groups sorted different sets
of clues (about 32 clues per set) about distinct collections of Spanish-speaking
countries. To avoid ordering and learning effects, the presentation order of clue sets
and feedback types were balanced among groups using a Latin Square design.
Users were instructed to converse in Spanish during the activity to simulate use
in a real language-learning environment. After each of the four activities, participants
individually completed a questionnaire asking them to rate several aspects of their
interaction in the current condition. After the final condition, each participant
completed an additional questionnaire that asked them to make comparisons among
the four feedback design alternatives they experienced.
Each session was directly observed by two of the authors (who took notes) as
well as videotaped for post-hoc analysis. All user interactions with the DiamondTouch
table (i.e., who moved clues and where they were placed) were logged by our
software.
5.2.4.2 Context 2 – Authentic Classroom Use
One drawback of the laboratory session was participants’ lack of investment in the
activity – in particular, many concerns that would be present in a real classroom (such

151
as concerns about peers’ opinions of performance) were not present in the lab setting.
Additionally, we wanted to observe repeated use of the tabletop and be able to discuss
with teachers the impact of the activities on student performance in the classroom.
Accordingly, we integrated our technology into the curriculum of an “English as a
Second Language” course at our university. We met with the course’s instructors, who
provided us with curriculum-related content to use in the ClassificationTable,
MatchingTable, and PoetryTable activities. The students in this course were from a
variety of backgrounds, speaking several different languages natively (Japanese,
Chinese, Korean, or Italian), and were all learning to speak, read, and write English.
The course had twenty students, most of whom completed a total of five tabletop
activities over a two-week period. During these sessions, some of the activities
employed the spatial layout variants and interaction visualizations in order to allow us
to observe the impact of these designs on participation and awareness. Due to
scheduling difficulties, illness, and other absences, not all students completed all
activities – four groups of four students each completed the three activities contrasting
the “four piles” and center layouts, and three groups of four students each completed
the two activities exploring the impact of interaction visualizations. Because of the
small size of the class, we cannot report statistically significant analyses from this
context, but instead report trends that we observed, which would be interesting to
study further with larger groups in a more formal context.
5.2.5 Findings
The following sections summarize our findings. We divide our analyses along four
dimensions: feedback modality, feedback privacy, data object layout, and the presence
or absence of explicit awareness visualizations.
5.2.5.1 Visual vs. Audio Feedback
Overall, audio feedback promoted increased awareness of contributions to and
performance in the classification activity. Audio feedback increased the accuracy of
individuals’ self-assessments of their own contribution to the activity – on the
questionnaires given after each task, each subject was asked to estimate what percent
152
of items he had sorted correctly on his first try. By comparing these estimates to logs
of actual activity, we can see that the estimates were significantly more accurate with
private and public audio feedback as compared to no feedback at all, while the visual
feedback did not provide any improvement over the baseline (no feedback) case. Mean
deviation from true values for estimates of the percent of clues a user sorted correctly
on her first try: No feedback = 24.46%, Private audio = 13.42%, Public audio =
14.44%, Visual = 16.27%. Repeated Measures ANOVA: (F(1,3)=2.91,p<.05). Paired-
sample T-tests: no feedback/private audio (t(24)=2.49, p<.03), no feedback/public
audio (t(24)=2.15, p<.05).
Measuring the amount of time each group spent conversing by automated
audio analysis of the videotapes revealed that groups spent significantly more time
conversing with each other when they received public audio feedback (74.32%) as
compared to with visual feedback (60.83%). Mean percent of time spent talking in
each session: Public audio feedback = 74.32%, Visual feedback = 60.83%. Paired-
sample T-test: (t(7)=2.80, p<.03).
Visual feedback resulted in skewed participation in terms of total sorting
actions as compared to private audio, which resulted in more equitable participation
within groups. Participation equity can be measured by comparing the standard
deviation of the number of answers contributed by each member within a group; lower
standard deviations reflect a more equitable distribution of interactions. Mean standard
deviation among groups’ total sorting actions: private audio = 4.13, visual feedback =
6.16. Repeated Measures ANOVA: (F(1,3)=3.19, p<.05). Paired-sample T-tests:
private audio/visual feedback (t(7)=2.37, p<.05).
5.2.5.2 Public vs. Private Feedback
When using the private audio played over individual users’ earpieces, users
communicated to the group the feedback that they were receiving privately, through
both vocalizations and gestures. Positive feedback was typically clearly emphasized to
the group via thumbs-up gestures or exclamations of “Sí,” “Bueno,” and “Yeah!”
Negative feedback was typically acknowledged more subtly, by a slight head-nodding
“no” or the user moving the incorrect clue back into the central region without
153
commenting. This lack of drawing attention to the negative feedback supports our
design motivation for providing such feedback privately – to reduce potential
embarrassment over incorrect answers by not pointing them out to the entire group.
Likert-scale responses to the statement “I felt self-conscious when other people
at the table knew whether or not my answer was correct” indicated that users felt less
self-conscious about their performance with the private audio feedback as compared to
either visual feedback or even a lack of any feedback at all. The responses also
indicated that private audio made people feel less self-conscious about their answers
than the public audio feedback, but with marginal statistical significance. Mean 7-
point Likert scale scores (7 = strongly agree, 1 = strongly disagree): No feedback =
2.86, Private audio = 2.25, Public audio = 2.78, Visual feedback = 2.71. Repeated
Measures ANOVA: (F(1,3)=3.63 p<.02). Paired-sample T-tests: private audio/no
feedback (t(27)=1.97, p≤.05), private audio/public audio (t(21)=1.81, p=.08), private
audio/visual feedback (t(30)=2.89, p<.01).
The increased comfort with private audio was also reflected in users’
comments on the questionnaires, such as “Private audio gave me instant feedback
without everyone knowing I got it wrong,” and “I prefer private audio, so I can know
what I got correct or incorrect with a sense of confidentiality,” and “I would guess
more [with private feedback] since others couldn’t observe me.” In contrast,
comments like “Public Audio: guessing [was] embarrassing” indicate reduced comfort
for underperformers in the public audio feedback condition.
Typically, subjects first selected clues from the central pile and read them
(sometimes silently and sometimes out loud). If a user was confident that he knew the
answer, he immediately classified the clue into one of the corner areas. Otherwise, he
read the clue out loud and polled other group members for advice regarding its
placement. Work tended to be more parallel near the beginning of each session, when
users had many clues to explore, and reverted to a more serial strategy as the “easier”
clues were sorted and groups were forced to discuss and debate the placement of more
difficult items. The public audio feedback engendered a more serial strategy than other
feedback styles, because when more than one clue was sorted simultaneously it

154
became difficult for users to disambiguate which feedback sounds were associated
with which clues. As a result, users sometimes needed to re-sort the same clue in order
to replay the sound. Because of this difficulty, groups consciously attempted to work
more serially with the public audio design.
5.2.5.3 Piles vs. Centered
Trends in the data collected during classroom use of the ClassificationTable,
MatchingTable, and PoetryTable applications support our hypotheses that laying out
information in four piles, one near each group member, rather than in the center of the
table, seemed to encourage more equitable participation. We measured participation
along two dimensions – the number of touch interactions on the DiamondTouch
surface and the percent of foreign-language conversation contributed by each group
member. Both of these measures were gathered automatically, based on touch data
recorded by the DiamondTouch and voice data recorded by the microphone headsets
worn by each participant. For each group, we calculated the standard deviation of the
percent of touch events contributed by each group member, and of the percent of
talking time contributed by each group member. Lower standard deviations reflect
more equitable contributions among group members. For each of the three activities
completed, groups had lower standard deviations for both the percent of touch
interactions contributed and the percent of conversation contributed under the “four
piles” condition. (ClassificationTable: mean stdev touches (center) = .096, mean stdev
touches (piles) = .060, mean stdev talking (center) = .169, mean stdev talking (piles) =
.161; MatchingTable: mean stdev touches (center) = .137, mean stdev touches (piles)
= .122, mean stdev talking (center) = .195, mean stdev talking (piles) = .141;
PoetryTable: mean stdev touches (center) = .138, mean stdev touches (piles) = .076).
Students’ comments on questionnaires distributed after the activity reflected a
potential drawback of the “four piles” layout, however, suggesting that it detracted
from the collaborative feel of the activity. Some students indicated in their comments
that the piles were “more dependent of yourself [sic],” while the center layout made
them think more of “teamwork.” Another student wrote about the centered layout,
“We can discuss together and work together. I think it's more interesting than four

155
piles.” These statements indicate that the center layout may have been more
successful in achieving the goal of a cooperative educational activity, by allowing the
students to reach a shared understanding through conversation and collaboration.
5.2.5.4 Interaction Visualizations
No consistent impact of the presence or absence of the interaction visualizations on the
equitability of touch or speaking interactions was found. However, due to the limited
number of students in the class, it is premature to draw conclusions from this data.
Student reactions to the presence of the visualizations were mixed. Some
students enjoyed the competitive feel that the visualizations lent to the activity,
commenting “make me be competitive – encourage [sic],” while others found this
intimidating, as indicated by comments like “I become too self-conscious. Concerned
too much about the graph [sic].”
We carried out a follow-up evaluation of the impact of interaction
visualizations in a separate study, completed by 40 subjects divided into three- and
four-person groups. Subjects used three variants of the ClassificationTable; before the
experiment, they read articles about past Presidents, First Ladies, and Supreme Court
justices. Facts from these articles were then presented as part of the
ClassificationTable exercises, to simulate a classroom experience. In one variant,
interaction visualizations showed each user how many clues they had classified
relative to other group members; in another, visualizations showed the amount each
user spoke during the activity relative to everyone else in the group; and another had
no visualizations at all. We hypothesized that the presence of visualizations showing
speaking contributions would result in more participation equity in terms of amount of
conversation contributed by each user, while the presence of visualizations showing
the amount of clues classified would increase participation equity in that domain.
We found that the visualizations reflecting speech contributions did increase
participation equity among group members in terms of amount of conversation
contribution by each person (F(1,2)=3.93, p<.05). The classification visualizations, on
the other hand, did not produce a change in classification participation equity relative
to the other two conditions. Our observations during the sessions offer a possible

156
explanation for this difference in impact: during the sessions with speech
visualizations, we noticed that many users would engage in “filler” speech – speech
that was related to the activity (e.g., reading the clues aloud, or asking other group
members for their opinions), but which did not offer a concrete contribution to the
activity by suggesting an answer or offering information. However, these types of
“filler” actions were not possible for the clue classification, where any action would
involve a concrete attempt to make a statement about the answers. Further work in this
area is warranted to determine whether awareness visualizations can impact
contribution in an educationally beneficial way, rather than only motivating the
production of filler behaviors.
5.2.5.5 General Observations
Overall, the ClassificationTable, MatchingTable, and PoeteryTable were easy for
subjects to learn and use. Groups spent an average of only 1.06 minutes learning to use
the applications in the tutorials (they were allowed to remain in the tutorials as long as
they felt necessary), despite the fact that 41 of the 48 (85.4%) had never used a
DiamondTouch table before. Subjects were also very engaged in the educational
activity, speaking in the foreign language throughout. Many commented to each other
during the task that they found the activity fun and entertaining. No major usability
problems were observed, other than the difficulty of disambiguating the target of the
public audio feedback for near-simultaneous sorting actions in context 1.
5.3.6 Discussion
The results of our evaluations supported several of our initial hypotheses regarding the
impact of our four design variants on participation equity and self-assessment
accuracy. Private feedback reduced embarrassment over contributing incorrect
answers to the group activity, and resulted in modest increases in participation equity.
Audio feedback increased conversation levels, and promoted more accurate self-
assessment as compared with visual feedback. Laying out clues in piles near each of
the four users, rather than in the center of the table, seemed to increase participation
equity, although it had the unanticipated drawback of reducing the collaborative feel
157
of the application. It would be beneficial to explore these designs through more
extensive laboratory and classroom use to confirm these effects with greater statistical
confidence.
Overall, we found that the table was an engaging platform for foreign-language
education activities, promoting face-to-face discussion and providing students with
feedback regarding their progress without necessitating the presence of an instructor.
Participants found the table easy to use, and both students and teachers were excited
about the new technology.
5.3.6.1 Methodological Limitations
A few of our initial design questions remain unanswered, due to methodological
limitations of our evaluation strategy. There were drawbacks of both the laboratory-
style evaluation approach of context 1 and of the naturalistic-setting evaluation of
context 2. Groups in the laboratory context, since they did not know each other
beforehand and were not completing the activities as part of an actual class, were not
motivated by the same concerns as students in an authentic context – in particular,
they may have been less concerned with how their peers perceived them, and so were
not affected by embarrassment over producing incorrect answers, which we suspect
would play more of a role in an authentic learning environment. The nature of the
second observational context, as part of the curriculum of an actual foreign-language
course at our university, made it difficult to gather statistically significant data
regarding the impact of our design variations, since there were only a small number of
students in the class, and the students’ inexperience with English (they spoke several
different native languages) made the gathering of subjective data from questionnaires
unreliable. Regulations regarding educational fairness and privacy at our institution
made assessing the impact of the use of our systems on students’ grades in the course
infeasible.
In context 2, we attempted to assess the impact of both the piles/center variant
and the interaction visualizations on students’ awareness of the amount they had
contributed to the activity. On questionnaires following the tabletop activities, we
asked students to rank their level of contribution relative to other group members; we

158
planned to compare these assessments to the records of contributions kept by our
software. However, for both of these design variants, all students who responded to
the question ranked themselves as “average,” and many didn’t respond at all. We
suspect that this phenomenon is due to the difficulty many of our participants had in
understanding English and therefore in completing our questionnaire. As a result, we
were unable to assess our designs’ impact on self-assessment accuracy in this
particular use context.
5.3.6.2 Feedback from Foreign Language Instructors
The three instructors who co-taught the English-as-a-Second-Language course that
utilized our technology were generally positive about the potential for tabletop
technology in their classroom after their students used our applications. They
described the benefits of the technology for their students as, “...a chance to work in
groups: share ideas, collaborate, communicate, problem solve, look for clues.” They
also noted, “the students said they learned from it.” Also, they mentioned that digital
technology enabling co-located group work helps to “extend the learning period
without the pressure of having the instructor,” thus creating a comfortable learning
environment for students.
Regarding free-rider issues, the instructors informed us that they were “very
much” concerned about under-participation in group activities. However, they felt that
real-time interaction visualizations might not be appropriate during a group activity,
noting that “...at least for our program, the information may be a little too sensitive to
share.” However, they suggested that, rather than potentially adding a competitive feel
to a within-group activity by showing interaction visualizations, adding a competitive
feel to between-group activities, by showing groups how well they performed
compared to other groups, might increase engagement and participation without the
potential of stigmatizing individual members of the class. The instructors expressed
interest in using the DiamondTouch table and our ClassificationTable, MatchingTable,
and PoetryTable software again in future iterations of their course.

159
5.3.7 Supporting Cooperative Language Learning: Conclusion
We have presented a discussion of design issues for tabletop interfaces that support
cooperative language learning. The affordances of interactive tables for supporting
face-to-face group work, providing immediate feedback to students regarding their
progress, and recording interaction histories for instructors to review, make tabletop
technology an exciting new platform for educational software. We developed three
tabletop CSCL applications targeted at foreign-language education: the
ClassificationTable, MatchingTable, and PoetryTable.
We explored how the properties of software for interactive tables can be tuned
to achieve specific pedagogical goals, such as increasing participation equity among
group members and improving the accuracy of students’ self-assessments. The four
design variants (feedback modality, feedback privacy, spatial configuration, and
interaction visualizations) were evaluated in two contexts – a laboratory evaluation,
and an authentic classroom setting. The results of these evaluations cast light on the
impact of these design choices, such as the participation-equalization effect of private
feedback and the self-assessment accuracy increase of audio feedback. Some results
(such as the potential equalization effect of a distributed rather than centralized
placement of materials) are preliminary, and highlight issues to be explored in future
work. This work addresses the issue of mediating group dynamics by exploring how
subtle variations in tabletop UI design might elicit positive group work styles.
Although interactive table technology isn’t yet available to most educators, the
match of the technology’s affordances with the educational goals of small-group work
suggest that understanding issues regarding the design of cooperative software for
interactive tables is a valuable investment in what may become an important
educational technology platform a few years down the road.
5.3 Cooperative Gestures
Our work on multi-user coordination policies, described in section 5.1, led us to
consider other interaction techniques that could potentially mitigate undesired aspects
of group behavior by increasing group awareness of important interactions and

160
encouraging a sense of involvement and togetherness. This line of inquiry led us to
design cooperative gestures: interactions where a tabletop system interprets the
gestures of more than one user as contributing to a single command.
In this section, we introduce cooperative gesturing, a multi-user interaction
technique for co-located single display groupware systems. Cooperative gestures are
interactions where the system interprets the gestures of more than one user as
contributing to a combined command. As an example, consider a system that uses a
gesture (a wiping motion) to indicate deletion. If all participants simultaneously make
the deletion gesture, the screen of their shared display clears entirely rather than
having the normal, more local effect of only deleting material in the gesture area. The
consensus and involvement of all group members is part of the definition of this
sample gesture.
Cooperative gesturing trades off some performance efficiency for the benefits
of enhanced collaboration, communication, awareness, and/or fun. These benefits may
indirectly improve efficiency by reducing errors or miscommunications, although this
possibility is not the focus of this paper. There are several motivating scenarios for the
use of cooperative gesturing techniques:
Increase Participation/Collaboration: Interactions that require explicit
coordination between two or more users can lead to an increased sense of group
cohesion and teamwork. For many CSCW applications requiring collaboration may
prove useful, with the caveat that it is important to design these systems well; naively
introducing requirements can yield an application that is tedious. Educational activities
are one of the most promising domains for collaborative gestures; students, especially
younger children, can benefit from requiring increased group participation as a means
of reducing “free rider” [65] issues. For special-needs groups, such as youngsters with
Asperger’s Syndrome (an autistic spectrum disorder defined by social and
communicative impairments), an application that explicitly coordinates actions with
others can be of therapeutic benefit (see Section 5.4).
Awareness of Important Events: Invocation of potentially destructive
application events (e.g., quitting an application, deleting a large amount of content,

161
etc.) can be problematic in groupware systems, as described in section 5.1. Requiring
the coordinated effort of all group members, via the use of cooperative gestures, to
invoke these important and potentially disruptive actions can help prevent accidental
invocation of these commands and can increase group awareness about irreversible
program actions.
Reach on Large Surfaces: In most single display groupware [150] systems, the
shared display is physically large in order to accommodate a group of users. As a
result, some objects on the display are beyond a user’s arm’s reach. Interactions with
distant objects might naturally be accomplished as cooperative gestures, with one user
specifying the target and another user specifying the action, so as to avoid the need to
reach into the personal territory [132] of another user. Previous work, such as the
“shuffle” and “throw” gestures on the DynaWall [41], or “drag-and-pop” [10], explore
single-user techniques for moving documents and icons across large displays; this
paper introduces interaction techniques involving cooperation between members of a
co-located group.
Implicit Access Control: Coordination and access control is a tricky issue for
shared display groupware systems [91]. Although all digital documents are on a
single, shared surface, some may belong to individual members of the group who may
wish to restrict certain types of access by their co-workers, such as the ability to edit,
copy, or even manipulate an item. Sensitive actions, such as editing a document, can
be defined so as to require a cooperative gesture involving both the document’s owner
and the person who wishes to modify the document; in this manner, access control is
implicit whenever the document’s owner chooses not to participate in the cooperative
gesture.
Entertainment: People engage in coordinated body movements for amusement
in many social situations, such as performing “the wave” at a sporting event, or
dancing in synchrony to the “YMCA” and “Macarena.” Although requiring multiple
people to coordinate their actions is not necessarily the most efficient interaction
technique, it can lend a sociable and entertaining feel to applications for fun and

162
creativity, such as the creation of unique forms of art that depend upon the collective
input of all group members, or other game-like activities.
5.3.1 Implementation: CollabDraw
In order to explore the properties of cooperative gesture interaction techniques, we
developed CollabDraw, which allows groups of two to four users to collaboratively
create diagrams, pictures, collages, and simple animations using free-form drawing
and photo collage techniques. A combination of single-user and cooperative gestural
interactions controls the CollabDraw workflow.
The CollabDraw software was developed using our standard hardware and
software setup (Section 2.3.1). However, the DiamondTouch does have limitations as
a gesture-recognition device, including the coarseness and ambiguity of the input (the
table has an array of 172 × 129 antennae spread over a 38’’ × 31’’ surface).
CollabDraw’s gesture recognition uses a combination of machine-learning
techniques and heuristic rules. We trained the system to recognize six basic hand
postures (a single finger, two fingers, three fingers, a flat palm, a single hand edge,
and two hand edges), using 500 examples of each posture from each of four
individuals, and regressing on this data using the SoftMax algorithm [86]. This
training was sufficient to allow use of the system by new individuals who had not
contributed to the training data. CollabDraw uses SoftMax’s classification to
recognize when one of the learned postures is performed by a user. The program then
uses contextual information to determine which gesture is being performed –
CollabDraw’s six basic postures are used to create sixteen distinct gestural
interactions. Examples of context used to further classify an identified posture are
whether the hand is moving along a trajectory, whether it is near a photo, or whether
another user is performing a gesture at the same time. State information about each
user’s past touches is maintained to increase the accuracy of these decisions. Some
context (such as whether subsets of users are touching one another) is determined by
exploiting special properties of the DiamondTouch – for instance, hand-holding by
users on different chairs results in the table assuming that the users who sit on all of
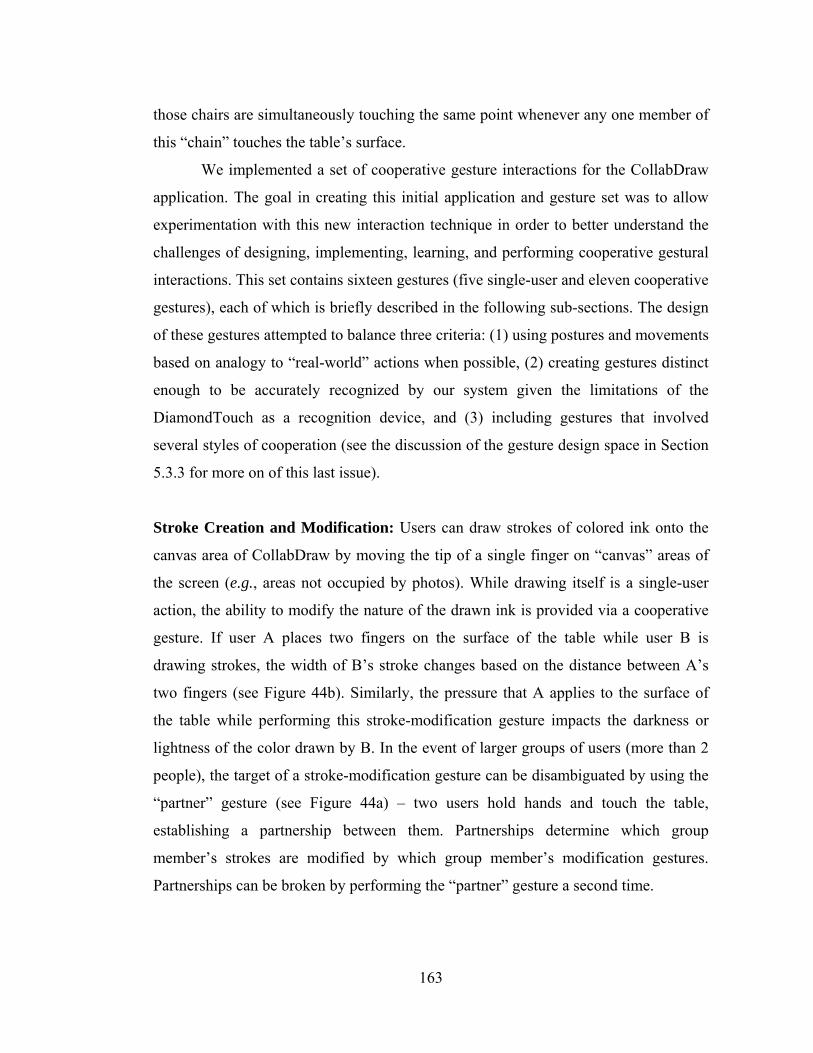
163
those chairs are simultaneously touching the same point whenever any one member of
this “chain” touches the table’s surface.
We implemented a set of cooperative gesture interactions for the CollabDraw
application. The goal in creating this initial application and gesture set was to allow
experimentation with this new interaction technique in order to better understand the
challenges of designing, implementing, learning, and performing cooperative gestural
interactions. This set contains sixteen gestures (five single-user and eleven cooperative
gestures), each of which is briefly described in the following sub-sections. The design
of these gestures attempted to balance three criteria: (1) using postures and movements
based on analogy to “real-world” actions when possible, (2) creating gestures distinct
enough to be accurately recognized by our system given the limitations of the
DiamondTouch as a recognition device, and (3) including gestures that involved
several styles of cooperation (see the discussion of the gesture design space in Section
5.3.3 for more on of this last issue).
Stroke Creation and Modification: Users can draw strokes of colored ink onto the
canvas area of CollabDraw by moving the tip of a single finger on “canvas” areas of
the screen (e.g., areas not occupied by photos). While drawing itself is a single-user
action, the ability to modify the nature of the drawn ink is provided via a cooperative
gesture. If user A places two fingers on the surface of the table while user B is
drawing strokes, the width of B’s stroke changes based on the distance between A’s
two fingers (see Figure 44b). Similarly, the pressure that A applies to the surface of
the table while performing this stroke-modification gesture impacts the darkness or
lightness of the color drawn by B. In the event of larger groups of users (more than 2
people), the target of a stroke-modification gesture can be disambiguated by using the
“partner” gesture (see Figure 44a) – two users hold hands and touch the table,
establishing a partnership between them. Partnerships determine which group
member’s strokes are modified by which group member’s modification gestures.
Partnerships can be broken by performing the “partner” gesture a second time.

164
(a)
(b)
Figure 44: (a) Two users form a partnership. (b) Now, when one partner performs the
“modify ink” gesture the ink drawn by her partner changes thickness.
Stroke Erasure: By placing the palm of one’s hand on the surface of the table and
rubbing it back and forth, a user can erase ink from the canvas. The ink
immediately underneath his hand disappears. This single-user gesture has a
cooperative form as well – the “clear screen” gesture. When all members of the group
simultaneously perform the “erase” motion, the effect is magnified and all ink on the
entire table is instantly cleared (see Figure 45).
Note that for a gesture such as “clear screen” that requires the participation of
all members of a group, the total number of group members could be determined using
a variety of techniques such as pressure sensors on chairs, computer vision, or
heuristics based on interaction histories during the current session. For our initial

165
implementation of CollabDraw, the total group size was manually entered upon
session start-up.
Figure 45: When all group members simultaneously “erase,” the “clear screen” action is
invoked.
Photo Passing: The ability to manipulate digital photos as part of an artistic creation
is part of the CollabDraw software. Individual users can move digital photos around
the table by touching them with a single finger and dragging them to a new
location. To pass photos over large distances, two cooperative gestures are available –
throwing and pulling.
To throw a photo across the table, user A touches the photo with 3 fingers and
makes a throwing motion while user B taps an empty location on the table with 3
fingers (see Figure 46a). So long as the trajectory specified by user A’s motion is
roughly aimed toward the location specified by user B, the photo will move across the
table with a velocity influenced by the speed of user A’s gesture, and will snap to the
endpoint specified by user B. Enhancements to this gesture could allow the receiving
partner’s action to specify additional parameters, such as the orientation the thrown
image should face when it arrives.
Alternatively, if user A wishes to move a photo from the far end of the table
toward himself, he can place the edge of his hand on the table, aimed in a line toward
the target image, and can move his hand toward himself, dragging it along the table’s
surface. This action causes candidate photos along this trajectory to blink, indicating

166
that they are potential targets of this “pull” gesture (see Figure 46b). User B, who is
seated near these target photos (and who may “own” them), can disambiguate A’s
choice (and/or grant permission for A to take a photo that B owns) by tapping one of
the blinking photos with a single finger. This image then slides across the table to user
A.
(a)
(b)
Figure 46: (a) The “throw-and-receive” gesture is one technique for passing photos long
distances. (b) The “pull” action (where a partner disambiguates the target) is another
option for moving photos long distances.
Combine Photos: Users may combine multiple photos to form a panorama or collage
(see Figure 47). To perform this action, two users each move digital photos towards
each other (by dragging them with a single finger) and collide their images. When the
images collide, they fuse together along the intersecting boundary, forming a single,
larger image.

167
Figure 47: Two users create a collage using the “combine” gesture.
Enlarge Photos: Users can cooperate to increase the size of a photo to make it occupy
the background of the table. To accomplish this, every member of the group must
participate by touching near the corner of the target image and moving their fingers
outward toward the edge of the corner (see Figure 48).
Figure 48: Four group members perform the “enlarge” gesture by simultaneously
touching the corners of a single photo.
Neaten Photos: Photos can be neatened into orderly piles by placing the edges of both
hands on the surface of the table, and sweeping them toward each other. This causes
all photos between the two hands to move into a single pile. This gesture can also be
performed cooperatively, with a magnified effect: when all users simultaneously
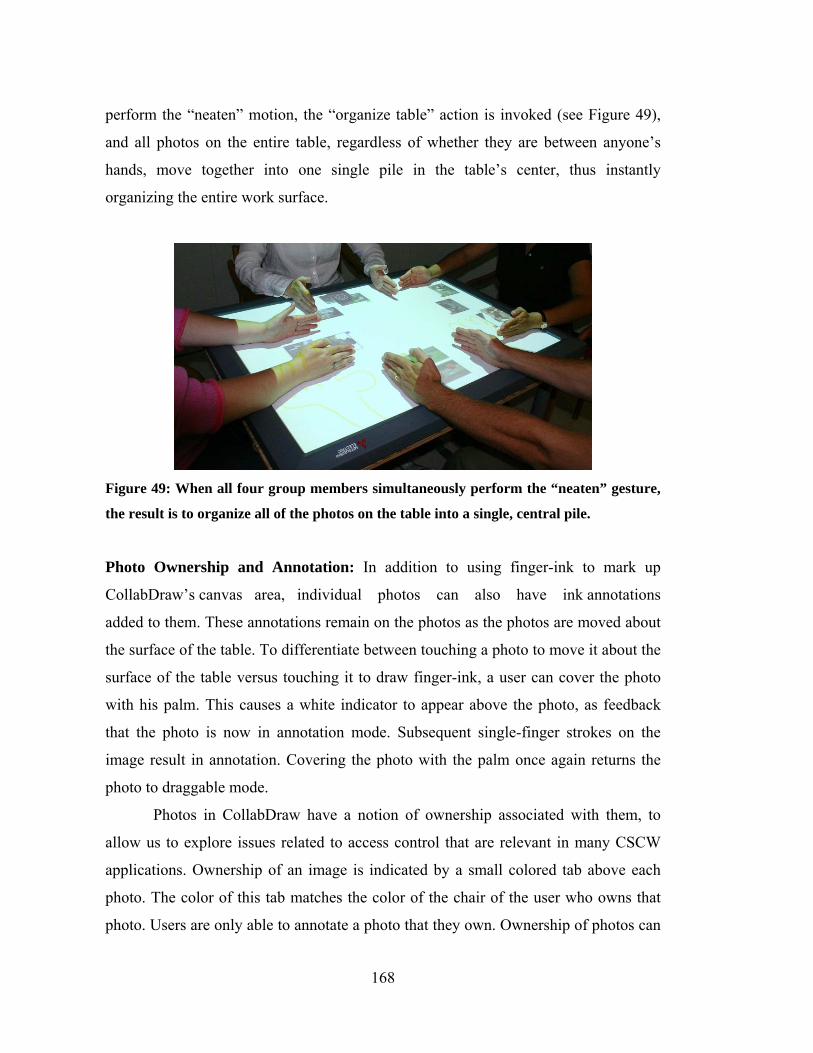
168
perform the “neaten” motion, the “organize table” action is invoked (see Figure 49),
and all photos on the entire table, regardless of whether they are between anyone’s
hands, move together into one single pile in the table’s center, thus instantly
organizing the entire work surface.
Figure 49: When all four group members simultaneously perform the “neaten” gesture,
the result is to organize all of the photos on the table into a single, central pile.
Photo Ownership and Annotation: In addition to using finger-ink to mark up
CollabDraw’s canvas area, individual photos can also have ink annotations
added to them. These annotations remain on the photos as the photos are moved about
the surface of the table. To differentiate between touching a photo to move it about the
surface of the table versus touching it to draw finger-ink, a user can cover the photo
with his palm. This causes a white indicator to appear above the photo, as feedback
that the photo is now in annotation mode. Subsequent single-finger strokes on the
image result in annotation. Covering the photo with the palm once again returns the
photo to draggable mode.
Photos in CollabDraw have a notion of ownership associated with them, to
allow us to explore issues related to access control that are relevant in many CSCW
applications. Ownership of an image is indicated by a small colored tab above each
photo. The color of this tab matches the color of the chair of the user who owns that
photo. Users are only able to annotate a photo that they own. Ownership of photos can

169
be transferred between users by performing the cooperative “exchange photo” gesture,
where the two participants must simultaneously touch the center of the photo in
question (and one of the participants must be the photo’s owner) (see Figure 50).
Figure 50: Two users simultaneously touch the center of a photo to transfer ownership.
Photo Animation: Users can enhance their drawings with simple animations. They
can cooperatively define a trajectory to be followed by target photographs. To
initiate trajectory definition, a user holds the edge of her hand over an image until it
begins to flash. Now, group members take turns tapping points on the table with a
single finger. Each point adds to the image’s trajectory, which is temporarily
illustrated with black lines (see Figure 51). To exit trajectory-definition mode, one
user again covers the target image with her hand’s edge. Now, to begin the animation,
a user can mimic the “throw” gesture, pushing the target image with 3 fingers, and it
will animate along the pre-defined path.

170
Figure 51: Group members take turns defining waypoints to animate a photo.
Exiting CollabDraw: Exiting CollabDraw requires the consent of all group members.
To accomplish this, they must all hold hands, and then one member of the “chain”
touches the table’s surface with a single finger (see Figure 52). This causes a menu to
appear that allows the group to confirm their choice to exit the application.
Figure 52: Group members form a chain by holding hands, and one user touches the
table in order to exit CollabDraw.

171
5.3.2 Evaluation
Fourteen paid subjects participated in a usability study to evaluate the use of
cooperative gestures in CollabDraw. Six of the subjects were female, and the mean
age was 25.5 years. Nine of the subjects had never used a DiamondTouch table before.
Subjects completed the study in pairs of two, although CollabDraw can accommodate
as many as four users. All subjects were acquainted with their partner before the study;
subjects had known their partners for 2.2 years on average. Three pairs were of
romantically-involved couples, while four pairs were same-gender pairs of co-workers
who were not romantically involved.
The goal of this evaluation was to gauge basic aspects of the usability of
cooperative gestures – would people find them intuitive or confusing? Fun or tedious?
Easy or difficult to learn? The evaluation had four parts, which were all completed
within a single one-hour session: (1) gesture training, (2) a gesture-performance quiz,
(3) recreating a target drawing, and (4) completing a questionnaire. First, the
experimenter introduced the CollabDraw application and taught each of the
gestures (both single-user and cooperative gestures) to the participants. Because
groups of size two were used, the “partner” gesture was superfluous, and was therefore
not part of the evaluation. Participants could practice each gesture as many times as
they wished, and could ask questions to and receive advice from the experimenter.
After participants had been taught all the gestures and practiced as much as they
wanted, the experimenter quizzed the subjects by naming a gesture and asking them to
perform that gesture without any advice.
After the performance quiz, the subjects were provided with printouts of a
target drawing (see Figure 53), and were asked to recreate the drawing using
CollabDraw without any assistance from the experimenter. The nature of the drawing
required the use of several gestures (draw, annotate photos, exchange photos, modify
ink, combine photos, enlarge, and animate). After completing the drawing, pairs were
asked to organize the table, clear the screen of ink, and exit the application. Subjects
then filled out a questionnaire asking them to rate each of the gestures along several
dimensions and soliciting free-form comments. All reported ratings use a 7-point

172
Likert scale, with a rating of 7 being positive and 1 being negative. The experimenter
took notes during the sessions, and the CollabDraw software logged all user
interactions with the DiamondTouch table.
Figure 53: Pairs of subjects had to recreate this drawing as part of our evaluation of
CollabDraw. Several cooperative gestures are required to accurately re-create this
image.
5.3.2.1 Results
Overall, subjects found CollabDraw easy to use and the gestures easy to learn.
Subjects took 28.8 minutes on average (stdev = 6.2 minutes) to learn all 15 gestures,
and all seven pairs were able to accurately re-create the target drawing with a mean
time of 8.2 minutes (stdev = 1.2 minutes). In addition, subjects made very few errors
during the “quiz” portion of the session – three subjects forgot the gesture for
“exchange photos,” but were reminded by their partners, one subject forgot how to
initiate animation and was also reminded by his partner, and one pair forgot how to

173
clear the screen and had to be reminded by the experimenter. These results indicate
that our gesture set was relatively easy for subjects to learn, remember, and use. Note
that we tested memorability only within a single, one-hour session. Long-term recall
of the gestures was not explored during our experiment.
Overall, users found neither the single-user nor cooperative gestures confusing,
as indicated by their Likert scale responses to the statements “I found the [single-
user/cooperative] gestures confusing to perform” (μ=2.5 and 3.2, respectively – these
ratings are not statistically different from each other, p=.20, t(13)=1.35). In the
following sub-sections, we describe results based on observations of use and users’
questionnaire ratings of the ten cooperative gestures in the CollabDraw repertoire.
Although the majority of user comments were positive, in the following we
particularly highlight some of the negative reactions since such comments are
informative for improving cooperative gesture interactions.
Modify Ink: The “modify ink” gesture received poor ratings on the intuitive
(μ=3.69) and fun (μ=3.21) scales, and was named by eight participants as one of their
least favorite gestures. Subjects indicated that they found it confusing to need
assistance to change the width of their stroke. They found the collaboration for that
task to be artificial, indicated by comments such as “There’s nothing inherently
cooperative about ink-width changing,” and “It would make more sense to modify
your own ink.” Users noted that the use of a cooperative gesture “seemed appropriate
when the result of the gesture affected both parties involved,” a rule that did not apply
to “modify ink.” Further, they also felt it was quite tedious and inefficient to need to
interrupt their partner to ask for an ink modification since this was a task they
performed frequently – as one user noted, “[my] partner had to stop what she was
doing so that I could change a property of my picture.” Performing this gesture
sometimes caused unanticipated mode errors, because one partner would interrupt
another to ask for an ink modification, causing his partner to forget what gesture she
had been in the midst of performing, which was particularly problematic if she had
been in the midst of performing a moded gesture such as photo annotation. To

174
minimize the need to modify ink, all seven groups approached the final drawing task
in a manner that required the minimum possible number of ink modifications.
Clear Screen: The “clear screen” gesture was rated as intuitive (μ=5.57), but
not quite as intuitive as the corresponding single-user gesture, “erase” (μ=6.69)
(p<.01, t(13)=4.76). “Clear screen” also received high ratings for being fun (μ=5.71).
The “clear screen” gesture received mixed reactions from participants – two subjects
listed it among their favorite gestures, while two subjects ranked it among their least
favorite. These latter two cited the risk of accidental invocation when two people
coincidentally simultaneously performed the “erase” motion. Users commented, “We
had to be careful not to unintentionally affect the whole canvas when we were
performing these actions.” Another noted that “clear screen” was, “...too easy! I had to
watch out for [my] partner erasing at the same time.” This accidental invocation
occurred during two of the seven test sessions.
Throw-and-Receive: The “throw-and-receive” gesture received a neutral rating
on the fun scale (μ=4.5), despite the fact that during training users frequently
commented that throwing photos was “cool.” Five of the seven groups spontaneously
used the throw gesture during unrelated portions of the training session, presumably
because they found it entertaining. However, subjects commented that the throw
gesture didn’t seem necessary, given the small size of the DiamondTouch table (all
subjects could reach the table’s far end). One user commented “I’m dubious about
why someone would need it [throw-and-receive] when they could just reach across the
table” This apparent lack of utility might account for the low ratings – it would be
interesting to see how reactions would change if larger table sizes were available.
Pull: The “pull” gesture was voted least favorite by ten users, and received
correspondingly low reviews for intuitiveness (μ=3.0), fun (μ=3.43), and comfort
(μ=3.31). In addition to pointing out that the small size of the table made the pull
gesture unnecessary, users also indicated that they found the specific posture involved
(the use of the side of the hand) to be awkward and unnatural, commenting “In
general, the edge-of-my-hand gesture is unintuitive.”

175
Combine Photos: The “combine” gesture received generally good ratings
(μintuitive=5.86, μfun=5.14, μcomfortable=5.69), and was the source of little
comment from or difficulty to users.
Exchange Photo: The “exchange photo” gesture received generally good
ratings (μintuitive=5.21, μfun=4.93, μcomfortable=5.69), although its similarity to the
“enlarge photo” gesture was slightly problematic. Three subjects had to be reminded
by their partners how to perform this action during the quiz. This confusion may be
particular to groups of only two users, since two users are required to exchange a
photo but the entire group is required to enlarge a photo. Nevertheless, users felt that
the cooperative nature of this action was well-justified, as indicated by comments like,
“exchange photo made sense [to make both people do the gesture].”
Organize Table: Reaction to the “organize table” gesture was similar to the
response to “clear screen,” the other gesture with both a single-user and whole-group
interpretation. Users rated the gesture highly as being intuitive (μ=6.0) and fun
(μ=6.14), but it also received a mixed response with two votes for favorite and two for
least favorite gesture, with the risk of accidental invocation again being noted by its
detractors.
Animate Photo: The animate gesture was named least favorite by seven users,
and received correspondingly low fun (μ=4.21), comfort (μ=3.71), and intuitiveness
(μ=3.86) ratings. While subjects commented that defining the actual trajectory of the
animation was intuitive, they found the use of the edge of the hand to initiate and
terminate this trajectory-definition phase to be unnatural. The cooperative nature of
the animate gesture caused unanticipated mode errors because sometimes one user
initiated it without informing their partner. Initiating this gesture put both partners in
trajectory-definition mode, so if one user was unaware of the mode-switch, confusion
occurred.
Enlarge Photo: Users rated this gesture as fun (μ=5.0), and had little comment
on it and little difficulty in its execution, other than the aforementioned similarity
between it and the “exchange” gesture.

176
Exit Application: The “exit” gesture received mixed reactions. Not
surprisingly, couples that were romantically involved showed no reaction to the
request to hold hands, but pairs of friendly co-workers found the request more
unusual. One female-female co-worker pair thought the gesture was cute, smiling and
saying “awwww...” when asked to hold hands, but all three male-male groups giggled
or made nervous jokes. One user commented about the “exit” gesture that it was
unpleasant because, “[my] partner has sweaty hands,” and another user noted
“touching was awkward.” One member of a dating couple noted, “I liked holding
hands because I knew my partner, but in a work environment I would find that much
more awkward,” indicating that not only how well one knew one’s partner, but also
the nature of the activity would impact the acceptability of intimate cooperative
gestures.
During the initial training, one male-male pair asked how the “exit” gesture
worked, and the experimenter explained that by holding hands the DiamondTouch
thought that both of their identities were touching the table at a single point, thereby
initiating the “exit” gesture. This pair then attempted to avoid the need to hold hands
during the quiz and drawing by touching their fingers very close together at one point
on the table.
5.3.3 Discussion
In this section, we discuss the lessons learned from our experiences designing,
implementing, and evaluating cooperative gestures. We further distill our experience
by presenting an initial taxonomy of the design space for this class of interactions.
5.3.3.1 Lessons Learned
User feedback and observations from our evaluation of CollabDraw provided useful
points to keep in mind for future iterations of cooperative gestures:
Clarity of Purpose: Users reacted most positively to cooperative gestures that
served a clear purpose, commenting that they understood why actions such as
exchanging photo ownership, clearing the screen, and exiting the table should require
multiple users, but complaining about “unnecessary” collaboration for more mundane

177
actions such as ink modification. We had originally envisioned this latter, “non-
necessary” cooperative gesture as a possible source of amusement and creativity, but it
was not viewed in this manner by users.
Accidental Invocation: Some of our cooperative gestures, such as “clear
screen” and “organize table,” were based on simultaneous performance by all group
members of an action that also had a valid single-user interpretation. While users
indicated that these gestures were fun and intuitive, there were occasional accidental
invocations of the cooperative actions when both members of a pair coincidentally
simultaneously tried to perform the corresponding single-user gesture. For larger
groups, accidental invocation is likely to be less frequent. Nonetheless, relying on the
very small probability of accidental simultaneous action is non-optimal; interactions
that avoid or mitigate this issue are desirable.
Tedium: Users complained that the “modify ink” gesture, in addition to not
having a clear purpose for collaboration, was also particularly tedious because it was
an action that they wanted to perform frequently, thus requiring frequent interruptions
of their partner to ask for assistance. Because of the coordination overhead,
cooperative gestures are probably not appropriate for frequently-used actions; rather, it
may be more appropriate to add only a few cooperative gesture actions to a system,
reserved for special commands that require high awareness or group consent.
Intimacy: Not surprisingly, highly intimate cooperative actions, such as the
“exit” gesture that required hand-holding, were not well-received by pairs of co-
workers. Even partners who were romantically involved pointed out that if the
application had a business, rather than entertainment, feel to it, they might have felt
awkward holding hands as well. However, gestures that required close proximity
without actual skin contact, such as the “exchange photo” gesture where two users
simultaneously touched near the center of a single photo, did not provoke any
objections. Gestures that require skin contact might be appropriate for certain types of
entertainment applications that are used among friends, but would clearly not be
acceptable for more formal environments and purposes.

178
Subversion: We were surprised to see one subject intentionally abuse the
cooperative nature of the modify ink gesture in order to ruin his partner’s drawing.
This same subject also attempted to steal ownership of his partner’s photo by
attempting to touch near the center of that photo at a moment when his partner
happened to also be touching it, thus performing the “exchange” gesture without his
partner’s conscious consent. Techniques to prevent this type of subversion are an
avenue worth exploring.
5.3.3.2 Design Space
Table 7: CollabDraw’s cooperative gestures, classified.
Symmetric Parallel Proxemic
Distance
Additive Identity-
Aware
# of Users
Partner Y Y Intimate N N 2
Modify ink N Y Social N N 2
Clear screen Y Y Social Y N All
Throw N Y Social N N 2
Pull N Y Social N N 2
Combine Y Y Personal N N 2
Enlarge Y Y Personal N N All
Organize table Y Y Social Y N All
Exchange Y Y Personal N Y 2
Animate Y N Social N N All
Exit Y Y Intimate N N All
Based on our experiences designing, implementing, and evaluating an initial set of
cooperative gestures, we have articulated some important axes of the design space for
these interactions. By articulating this taxonomy, we hope to better understand the
design possibilities for cooperative gestures, and to analyze the impact of these axes of

179
design on their learnability, memorability, usability, and naturalness. We have
excluded from our taxonomy design axes that are not unique to cooperative gestures –
issues such as “naturalness” (does the gesture mimic real-world activity, or is it
abstract), whether each user contributes a unimanual or bimanual action, etc. These
issues are relevant to single-user gestures as well, and, while they could certainly have
an impact on cooperative gesture performance, are not the focus of this research.
Based on our initial experiences with this interaction technique, we have identified
seven design axes relevant to cooperative gesture interaction: symmetry, parallelism,
proxemic distance, additivity, identity-awareness, number of users, and number of
devices. Table 7 classifies CollabDraw’s cooperative gestures along these dimensions.
Symmetry: The “symmetry” axis refers to whether participants in a cooperative
gesture perform identical actions (“symmetric”) or distinct actions (“asymmetric”). In
a gesture involving more than two users, it is also possibly to have a subset of users
performing identical actions and another subset performing distinct actions (“partially
symmetric”). Note that this differs from the use of the term “symmetry” as applied to
conventional, single-user gestures, where symmetry refers to whether the two hands in
a bimanual gesture perform identical actions, as described by Guiard [48].
Parallelism: “Parallelism” defines the relative timing of each contributor’s actions. If
all users perform their gesture simultaneously, then the collective gesture is “parallel,”
and if each user’s gesture immediately follows another’s (and yet the entire sequence
accomplishes nothing unless everyone finishes their action), then it is “serial.”
“Partially parallel” is also possible for gestures involving more than two users, where
some users perform their parts at the same time and some perform them in sequence.
The level of parallelism in a cooperative gesture may impact the ability of users to
conceptualize their combined actions as a single “phrase” [22] or unit, as described by
Buxton.
180
Proxemic Distance: Proxemics [52] is the study of the distances people prefer to
maintain between each other in various situations. The level of physical intimacy
required to perform a cooperative gesture could impact its acceptability for different
application scenarios (e.g., fun vs. business) or depending on the personal
relationships among group members. For that reason, we feel that proximity is an
important design consideration. We have adapted the definitions of the four canonical
proxemic distances for a co-located groupware situation. “Intimate” refers to
cooperative gestures in which participants must physically touch other participants.
“Personal” refers to gestures in which participants must touch the same digital object
(e.g., both users must touch the same image, window, text document, etc.) but their
hands do not touch each other. “Social” refers to gestures in which participants must
touch the same display device but can touch distant parts of the device (e.g., both users
must touch the table, but each touches in the space closest to where he is seated).
Lastly, “public” refers to gestures where users do not need to touch the same display
(e.g., the shared display is supplemented with PDAs, and users perform their
coordinated actions on these devices).
Additivity: “Additivity” refers to a special class of symmetric, parallel gestures. An
“additive” gesture is one which is meaningful when performed by a single user, but
whose meaning is amplified when simultaneously performed by all members of the
group. For example, in CollabDraw, rubbing one’s palm on the table in a back-and-
forth motion erases digital ink directly under the palm. The “clear screen” action is an
additive version of this gesture, invoked when all group members perform the “erase”
motion simultaneously. Symmetric, parallel gestures that do not have less-powerful
individual interpretations are “non-additive.”
Identity-Awareness: Cooperative gestures can be “identity-aware,” requiring that
certain components of the action be performed by specific group members. For
example, gestures whose impact is to transfer access privileges for an item from one
user to another would require that the user who performs the permission-giving part of
181
the gesture be the user who actually “owns” the object in question. Gestures with no
role- or identity-specificity are “non-identity-aware.”
Number of Users & Number of Devices: Cooperative gestures involve two or more
users whose coordinated actions are interpreted as contributing to a single gestural
interaction. The precise number of users involved is an important dimension to
consider, as it could impact the complexity involved in learning and executing the
gesture. The number of devices involved is also a consideration – whether users all
perform their gesture on a single, shared display, or whether personal devices are
involved as well. The use of a single, shared display might simplify gesture learning
by increasing the visibility of group members’ actions – we observed bootstrapping of
this type during our evaluation of CollabDraw.
5.3.3.3 Future Work
Our initial exploration of cooperative gestures was promising. Users learned the
gestures quickly, found many of them intuitive and entertaining, and provided
valuable feedback on how to further improve this interaction technique. There are
several interesting avenues for further research. Evaluation with larger group sizes
would be informative, in order to learn whether the complexity of coordinating actions
with more group members makes it more difficult to learn and execute cooperative
gestures. Evaluation with different age groups could also be informative. Several of
our test subjects commented that children might especially enjoy using a cooperative
gesture interface. Exploring the use of cooperative gestures in other application
contexts and with other gesture sets would also be informative, since one challenge in
evaluating these gestures is in determining whether our results are applicable to
cooperative gestures in general or are specific to peculiarities of our particular
implementation. It would be particularly interesting to explore a set of cooperative
gestures that covers combinations of axes in the design space that were not addressed
by CollabDraw in order to get a better understanding of how those axes impact the
usability of cooperative gestures.

182
5.3.4 Related Work
Conventional, single-user gestural interactions have been explored in a variety of
systems, including Charade [8], Buxton’s work on chunking and phrasing [22],
Grossman et al.’s work with volumetric displays [46], the Interactive Mural [49],
VIDEOPLACE [71], Malik et al.’s work on distant interaction with large displays
[79], Barehands [117], Vogel and Balakrishnan’s work on interactive public ambient
displays [169], and RoomPlanner [181]. Our work expands upon conventional gestural
interactions by exploring cooperative gestures, where the system interprets the input of
multiple users as contributing to a single gestural command. Cooperative gestures are
particularly relevant to co-located groupware systems, such as single display
groupware [150]. Tabletop interfaces, in particular, are a compelling platform for this
interaction technique because of the high degree of parallel activity they promote
compared to shared, vertical displays [121], and because of the availability of
hardware like the DiamondTouch [31], which can handle multiple simultaneous touch
inputs, and can associate each input with one of four distinct user identities. Several
systems, such as Modal Spaces [38], Oka et al.’s work [102], SmartSkin [114], the
Digital Desk [176] , and Wu’s work ([181] and [182]), explore gesture interactions
with tabletops, but none of these systems interpret the interactions of multiple users
together as a single, cooperative gesture.
Examples of cooperative gestures can be found in several prior systems. In this
prior work, however, cooperative gesturing was not the focus of study, and there is no
discussion of the phenomenon of cooperative gesturing per se, nor is there exploration
of the design of cooperative gestures. In contrast, the focus of this paper is to define,
analyze, and evaluate cooperative gesturing as an interaction technique. Nonetheless,
these prior systems provide interesting examples of the use of isolated cooperative
gestures:
• Several performance art and entertainment systems use a rough
interpretation of a large group’s motions to produce an entertaining effect, such as
techniques for interactive audience participation [85], multi-user musical stage

183
environments [116], and interactive dance clubs [167] (e.g., changing the tempo of
music, changing the direction of an object that moves on a large screen, etc.).
• SyncTap [115], Smart-Its Friends [59], Synchronous Gestures [57], and
Stitching [58] use coordinated motion patterns (as measured by accelerometers on
mobile devices) to establish ad-hoc network connections (e.g., shaking two devices at
the same time or tapping them together would create a connection).
• A few systems utilize a cooperative action for facilitating participation
and socialization for special user groups. The StoryTable [24] (a tabletop story-
creation system for very young children) requires two children to touch certain objects
to enable actions such as story playback, and the SIDES system (Section 5.4) (a
cooperative, therapeutic game for adolescents with Asperger’s Sydrome) requires all
players to “vote” on key game actions.
• Proposed interactions for voting and permission-giving in some
groupware systems include examples that demonstrate cooperative gesturing. “Multi-
user coordination policies” (Section 5.1) include interactions for group voting. The
“release” interaction for sharing digital documents on a tabletop display (Section 3.1)
demonstrates an access-control gesture involving two participants. iDwidgets (Section
4.6.3) proposes identity-aware widgets for co-located groupware, and describes some
potential identity-aware widgets (such as widgets requiring simultaneous input from
multiple users) that could be loosely construed as supporting cooperative gesture
input.
Philosophical literature on “collective intentionality” [20] [133] postulates that
collective intentional behavior is a separate phenomenon from the sum of individual
intentions. This philosophical underpinning provides an interesting perspective from
which to appreciate the role of cooperative gesturing in an interactive system.
5.3.5 Cooperative Gestures: Conclusion
We have formalized the concept of cooperative gestures for co-located groupware as
interactions where the system interprets the gestures of multiple group members
collectively in order to invoke a single command. We presented an initial
implementation of eleven cooperative gestures in the context of CollabDraw, a

184
tabletop art application for two to four users. Based on our evaluation of CollabDraw,
we identified several issues relating to the acceptability and usability of cooperative
gestures. This experience enabled us to articulate axes of a design space for this
interaction technique; these axes provide a framework for future study of cooperative
gesture interfaces. This work addresses the issue of mediating group dynamics by
introducing an interaction style that can facilitate socialization and participation, as
well as potentially avoiding social protocol breakdowns by adding emphasis to
particularly important application events.
5.4 SIDES
Continuing the theme of exploring the potential for tabletop interface design to
promote positive group dynamics, we worked with Anne Marie Piper and Eileen
O’Brien (from Stanford’s School of Education) to create a tabletop interface for a user
population for whom social interactions are a particularly relevant topic: youths
diagnosed with Asperger’s Syndrome.
Asperger's Syndrome (AS) is a Pervasive Developmental Disorder and is
considered an Autism Spectrum Disorder. Statistical data on the prevalence of AS is
unclear, as many cases go undiagnosed or are misdiagnosed. It is estimated that AS
occurs in 3.6 to 7.1 of 1000 children [34]. Individuals with AS often have normal IQs,
but have difficulty understanding accepted social conventions, reading facial
expressions, interpreting body language, and understanding social protocols. These
social deficits can lead to challenges in learning effective group work skills, including
negotiation, perspective taking, active listening, and use of pragmatic language.
Most computer programs for social skills development are designed for one
user working directly with the application and lack the face-to-face interaction found
in authentic social situations, such as Mind Reading [6] and Gaining Face [160].
Social skills therapy groups help adolescents with AS learn strategies to navigate
social situations. Mental health therapists who lead these groups often use card and
board games to help adolescents practice appropriate social interaction techniques
with peers. These traditional games, however, may not sustain interest or motivate

185
students enough to overcome challenges in social interaction. Traditional board games
can be inflexible and may not specifically support current classroom topics and
learning goals.
On the other hand, tabletop technology is a unique platform for multi-player
gaming that combines the benefits of computer games with the affordance of face-to-
face interaction. Tabletop computer games have recently been explored for general
audiences, such as STARS [80] and False Prophets [82], but have yet to be designed
for a special needs population who would especially benefit from social computer
games.
This section explores how interactive table technologies, specifically
cooperative tabletop computer games, can help mental health therapists facilitate
adolescent social skills development in a comfortable and motivating way. Tabletop
technology encourages face-to-face interaction around one computer in a way other
computer workstations and video gaming systems do not. Adolescents with AS often
describe the computer as a comfortable and motivating medium. Through our
approach we leverage the comfort of working with a computer to help these
individuals practice effective listening, negotiation, and group work skills.
5.4.1 Related Work
There are currently a number of single-user computer programs to help with social
skills development. These existing applications typically focus on rote memorization
of facial expressions and emotions (e.g., Mind Reading: The Interactive Guide to
Emotions [6] and Gaining Face [160]). Memorization of social cues may be helpful to
some adolescents, but this isolated activity lacks a supportive and authentic context for
application of these skills. Teaching appropriate social protocols with virtual reality
has also been explored as in Beardon et al.’s work [11]. Despite advances in facial
imaging, it is difficult for computers to completely replicate the nuances of human
social behavior. Though social cue memorization and virtual reality applications are
valuable, neither of these approaches provides a fully supportive and authentic means
of practicing effective group work skills.

186
The goal of our application is not to teach skills explicitly, but rather to provide
a motivating experience through which adolescents may practice social and group
work skills discussed in group therapy sessions. The pedagogical design of SIDES
stems from Piaget's constructivist learning theories; we wanted to create a tool where
learners could be active participants in the task and construct their own knowledge,
based on experiences with others in the world [106]. We also draw on Vygotsky's
theory that learning is a social process and has its roots in social interaction [170].
Collaborative activities and cooperative games have been shown to benefit individuals
with AS in Kerr et al.’s work [66]. SIDES leverages these educational theories to
provide an authentic and engaging activity to supplement current group therapy
techniques for teaching social and group work skills.
Researchers have explored the benefits of tabletop displays for educational
activities (Section 5.2) and games such as STARS [80] and False Prophets [82], but
have not explored how tabletop interfaces and games might be designed to maximize
educational benefits for populations with special needs.
5.4.2 Design Process
We conducted observations, interviews, and paper and digital prototype tests over a
period of six months with middle school students (12-14 years old) and therapists
from a social cognitive therapy group. Twelve students and their school-designated
mental health therapist were involved in this study. While the majority of students in
our study have a primary diagnosis of AS, other students from this class who
participated in the study have social skills challenges stemming from other disorders,
including diagnoses of High-Functioning Autism, Attention Deficit Hyperactivity
Disorder, Apraxia, and Klinefelter's Syndrome. Our methodology for understanding
the needs and learning goals of this population included participant observation as
well as group and individual interviews. We focused on participatory design,
involving students and adults with AS, mental health therapists, and parents of
children with AS in all aspects of design and evaluation. Details of the participatory
design process can be found in [109]; Anne Marie Piper and Eileen O’Brien, students
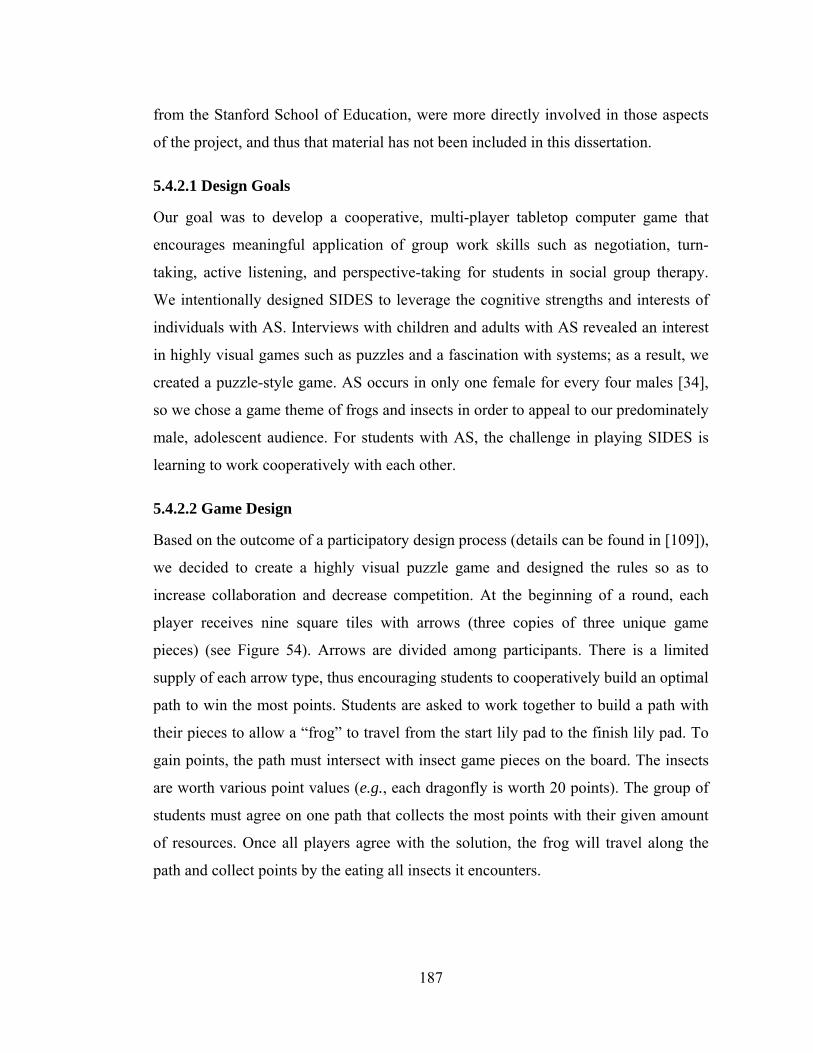
187
from the Stanford School of Education, were more directly involved in those aspects
of the project, and thus that material has not been included in this dissertation.
5.4.2.1 Design Goals
Our goal was to develop a cooperative, multi-player tabletop computer game that
encourages meaningful application of group work skills such as negotiation, turn-
taking, active listening, and perspective-taking for students in social group therapy.
We intentionally designed SIDES to leverage the cognitive strengths and interests of
individuals with AS. Interviews with children and adults with AS revealed an interest
in highly visual games such as puzzles and a fascination with systems; as a result, we
created a puzzle-style game. AS occurs in only one female for every four males [34],
so we chose a game theme of frogs and insects in order to appeal to our predominately
male, adolescent audience. For students with AS, the challenge in playing SIDES is
learning to work cooperatively with each other.
5.4.2.2 Game Design
Based on the outcome of a participatory design process (details can be found in [109]),
we decided to create a highly visual puzzle game and designed the rules so as to
increase collaboration and decrease competition. At the beginning of a round, each
player receives nine square tiles with arrows (three copies of three unique game
pieces) (see Figure 54). Arrows are divided among participants. There is a limited
supply of each arrow type, thus encouraging students to cooperatively build an optimal
path to win the most points. Students are asked to work together to build a path with
their pieces to allow a “frog” to travel from the start lily pad to the finish lily pad. To
gain points, the path must intersect with insect game pieces on the board. The insects
are worth various point values (e.g., each dragonfly is worth 20 points). The group of
students must agree on one path that collects the most points with their given amount
of resources. Once all players agree with the solution, the frog will travel along the
path and collect points by the eating all insects it encounters.

188
A B C
Figure 54: Interface components: A) Each player has a control panel with voting buttons
located along the border of the table nearest each user’s seat. B) Arrow pieces highlight
with the player’s color when touched. C) The frog “hops” along the path and eats insects
to win points.
5.4.2.3 DiamondTouch Implementation
After successful testing with the paper prototype, we implemented a computer version
of the game in Java for the DiamondTouch table [31], a multi-user touch sensitive
tabletop with a top-projected display. We wrote our application using the
DiamondSpin tabletop user interface toolkit [136]. As with the paper version, players
seated around the table receive game pieces to place on the board and create an
optimal path from the start to finish. Game pieces with different types of arrows (as in
Figure 54) are divided among players and are initially located in piles directly in front
of each of the four users. We chose this distributed initial configuration of game pieces
based on findings from Scott et al.’s work [132], where the center area of the table is
perceived as a group space and areas directly in front of each person are considered
spaces for personal items. We did not incorporate a timer or impose any time limits on
the game, to prevent students from feeling rushed and forgoing collaboration just to
reach a solution. The computer version gives each player a control panel in the region
of the interface closest to his or her chair (see Figure 54A). In each player’s control
panel are round and point indicators as well as voting buttons to test the path, reset, or
quit the game. The voting buttons allow the group to “vote” unanimously in order to
change the state of the game. For instance, players must vote unanimously to test their
path once a solution is reached by all simultaneously pressing the "Test Path" button.
This feature was implemented to ensure that no one player had more control over the
state of the game than another player, and to encourage social interaction by
necessitating communication and coordination with other members of the group. The

189
first version of the computer game did not enforce rules such as turn taking or piece
ownership. This design decision was made so that the game remained more open-
ended and we could investigate the minimal amount of structure necessary for
encouraging effective group work.
5.4.3 Evaluation
We conducted two separate testing sessions of SIDES; the second session involved a
modified version of the game, based on feedback received from the first evaluation
session. Both evaluation sessions, as well as the system refinements are described in
the remainder of this section.
5.4.3.1 Play Testing Session 1
The primary research questions that guided Session 1 include:
• Are tabletop computer games an appropriate and feasible tool for facilitating
social skills development for this audience?
• Do any sensory or motor issues specific to this audience affect interaction with
tabletop technology?
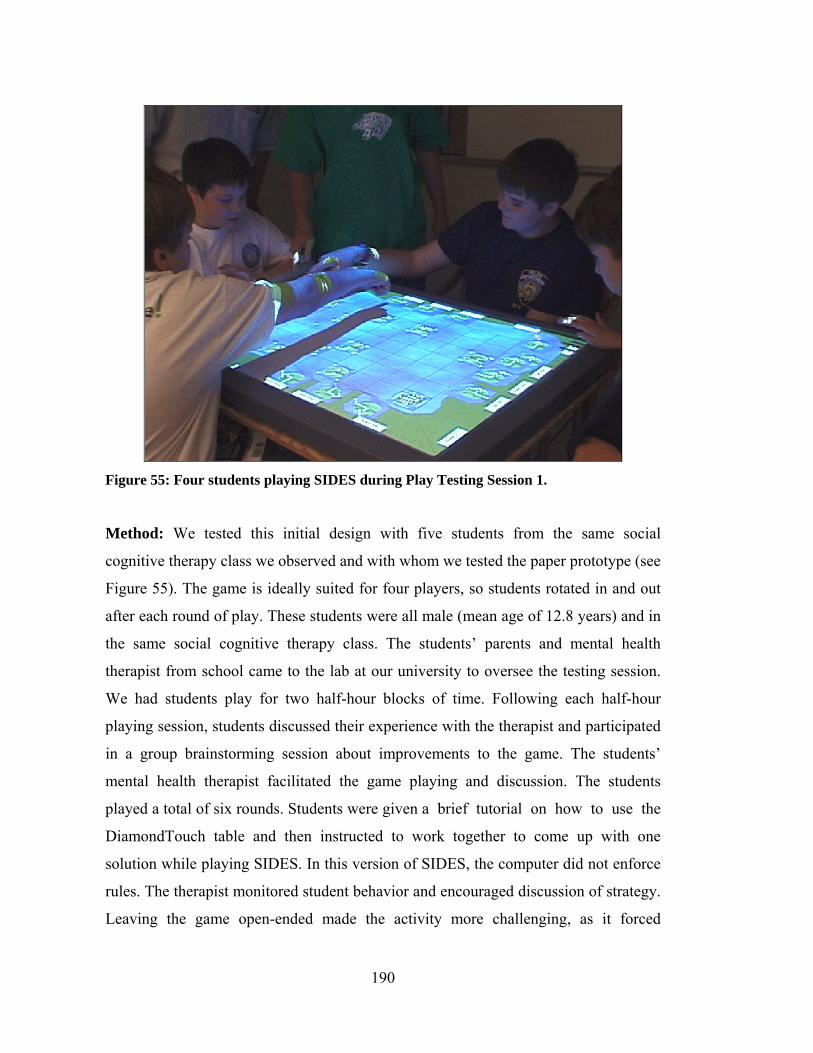
190
Figure 55: Four students playing SIDES during Play Testing Session 1.
Method: We tested this initial design with five students from the same social
cognitive therapy class we observed and with whom we tested the paper prototype (see
Figure 55). The game is ideally suited for four players, so students rotated in and out
after each round of play. These students were all male (mean age of 12.8 years) and in
the same social cognitive therapy class. The students’ parents and mental health
therapist from school came to the lab at our university to oversee the testing session.
We had students play for two half-hour blocks of time. Following each half-hour
playing session, students discussed their experience with the therapist and participated
in a group brainstorming session about improvements to the game. The students’
mental health therapist facilitated the game playing and discussion. The students
played a total of six rounds. Students were given a brief tutorial on how to use the
DiamondTouch table and then instructed to work together to come up with one
solution while playing SIDES. In this version of SIDES, the computer did not enforce
rules. The therapist monitored student behavior and encouraged discussion of strategy.
Leaving the game open-ended made the activity more challenging, as it forced

191
students to negotiate leadership and turn taking on their own. Game playing and
discussion was videotaped for later analysis. All interactions with the interface were
logged by the computer. Students individually completed a questionnaire after playing
SIDES.
5.4.3.2 Findings (Session 1)
We found that students remained engaged in the activity the entire time and were
excited by the novelty of the technology. However, the students’ excitement around
playing a computer game on new technology in a new environment provided
additional behavioral challenges. The students’ therapist commented, “Even though
their behavior was very positive, they were still talking over each other and not taking
turns like we discuss in group therapy… they were really enthusiastic and had
difficulty navigating back-and-forth conversation.”
Individual Behavior: Some students exhibited a high level of control over
their behavior and made positive contributions to the group without dominating the
activity. Drew, a seventh grader with AS, suggested several strategic moves to the
group but was repeatedly ignored. Later he commented on the group’s final solution,
“It’s not exactly like my planned route, but it’s close enough.” Drew’s comment
illustrates perspective taking, realizing that other people have different ideas, a topic
that is frequently discussed in group therapy. Drew’s mother also observed the testing
session and explained, "I've actually found it rather interesting watching my son
because he tends to be decisive about things and be more of a leader, but he's not
forcing his will on anyone else here at all. He's listening and seemingly much more
socially conscious than I think of him in terms of trying to be involved, but not trying
to take over or get angry. So I'm actually quite pleased to see that."
In contrast, some non-cooperative behaviors indicate that additional structure
could have helped other adolescents control their impulse to dominate the activity.
Several rounds of play were chaotic with kids pushing each other’s hands off the
interface and yelling loudly. One outspoken student often took control of the game,
reaching across the table to move other player’s pieces without asking and telling
others which piece to play next without eliciting input. This student’s father observed

192
the testing session and commented, "With [my son], tact and making other people feel
good about what they're doing doesn't even enter the equation… he'll try to get the
ideal result of whatever problem is in front of him and how that impacts other people
doesn't even occur to him. That's what he needs to learn more of. Games like this give
him more practice."
Need for Order: In the debrief immediately following the gaming session, the
students gave an overwhelming response regarding the need for order while playing.
One commented, “There always has to be a leader; otherwise it will be wild and
nobody will get anything from it.” In response to this comment, Brad, a seventh grade
student, stated, “We’re supposed to work together. We’re supposed to be equals.”
Brad was the quietest participant during the testing session and quickly became
agitated and covered his ears when his peers spoke loudly at each other. During a
follow-up conversation several weeks later, Brad explained, “Last time it was chaos.”
He looked at the ground and paced back and forth, “yeah, it was really chaotic until I
got to be the leader.” By “leader” Brad is referring to a point in the session where the
therapist closely monitored the students and gave each a chance to make decisions for
the group.
Sensory and Motor Issues: In this first round of testing, we also wanted to
assess the appropriateness of tabletop technology for this audience. Our primary
concern was whether these adolescents could learn sufficient control over the interface
given the tactile input required by most tabletop surfaces. Participants answered “How
hard was it to move the pieces around on the table?” with a mean of 2.2 (stdev = 0.45)
on a five point Likert scale (1 = “not at all difficult” and 5 = “extremely difficult”).
This response indicates that the participants found the mechanics of using the touch-
sensitive tabletop technology manageable.
Providing private audio through headphones during a tabletop computer
activity enhances the user’s experience and is an interesting way to provide
personalized feedback to users (as described in Sections 3.2 and 4.3). Some
individuals with an Autistic Spectrum Disorder, however, may experience extreme
discomfort when wearing headphones and/or be hypersensitive to noise. These

193
adolescents may become disengaged and unmotivated to participate in the group
activity if they become uncomfortable working with the technology. For the first half
of the testing session we played game sounds over a shared set of speakers. During the
second half of testing, we asked students to wear individual one-eared headphones so
they could hear game sounds that only pertained to their piece movement. We wanted
to determine if wearing headsets would be too intrusive for these students and if
hearing personalized game sounds when the player moves or plays a game piece
would add to the gaming experience. Brad is highly sensitive to noise. He only wore
his headphones for approximately five minutes before removing them. Another
student said he did not want to wear them and also took his off, followed minutes later
by the last two students. According to the students’ therapist and our observations, the
headphones and our choice of game sounds did not cause extreme discomfort to any
students in this session. The headphones, however, were intrusive enough for all
students to remove them prior to completing the activity.
Overall Impact: Overall, the students found SIDES to be a highly motivating
and challenging experience. After playing, one eighth grade student remarked, "Are
we going to play again? I want to play it in the classroom.” According to the students’
therapist, this excitement carried over into the classroom and spurred discussion about
the gaming experience, allowing him to tie the experience back into current classroom
social skills topics. Session 1 demonstrated the promise of tabletop computer games as
a tool for facilitating social skills learning, as these adolescents were highly engaged
with each other during the game and motivated by performance.
5.4.3.3 Prototype Iteration
Play Testing Session 1 revealed that SIDES was motivating for this audience. Session
1 also indicated that explicit game rules such as turn taking and piece ownership might
help reduce controlling behaviors of some students and encourage other less engaged
members to feel ownership over the activity. We revised the game to include
computer-enforced turn taking and restricted access to game pieces, as per our
observations and feedback from the students’ therapist. The therapist suggested,
“Whoever’s turn it is should be the only one who can manipulate the pieces. You can

194
see that the kids can’t keep their hands off. They will reach over and if some kid is too
slow or taking in more information, they might not be able to wait and will break the
rules by stealing another person’s piece.” The computer provides hard, fast, and
consistent rules in a way that the therapist as a human facilitator cannot. The rule
enforcement was enabled by the DiamondTouch table’s ability to distinguish between
four distinct users and to associate a user identity with each touch input.
We also redesigned the control panel in front of each player to include a “turn
taking” button (see Figure 56). Each player’s “turn taking” button indicates whether or
not it is that player’s turn. A player may make as many moves with their own pieces
during their turn as they like. The player whose turn it is has control over when
they end their turn by pressing their “turn taking” button. Play proceeds in a
clockwise fashion as each player moves a piece(s) and relinquishes his turn. Players
are allowed to “pass” if they do not want to play any pieces.
In the next phase of this project we examined how these adolescents practice
effective group work skills when playing a cooperative computer game when there are
no rules, when rules are enforced by a human facilitator, and when the computer
enforces rules. For Session 2, we decided to test the controlled access (players can
only move their own pieces) and turn-taking features in combination, as this requires
players to communicate more and to become more coordinated in their attempts to
create a solution.
5.4.3.4 Play Testing Session 2
Session 2 focused on how rules affect a group’s ability to work cooperatively and how
these adolescents respond to computer- versus human-enforced rules. The following
questions guided this testing session:
• Does training in highly structured conditions help these adolescents perform
better in later conditions when game play is unstructured?
• How do students respond to computer-enforced structure versus structure
provided by a human facilitator?
• What is the role of a therapist or teacher during a tabletop computer activity
with this special-needs population?

195
Figure 56: One “turn taking” button (bottom, center: labeled “Press When Finished”)
highlights at a time to indicate which player’s turn it is. In this image, the green player’s
button is highlighted (bottom, center: located on the interface directly in front of the
player seated in the green chair) and all other “turn taking” buttons are white and
inactive.
Method: To address these questions, we tested three variants of SIDES with two
groups of four students, all from the same social cognitive therapy class. Four of the
students who participated in Session 1 also participated in Session 2. These students
were all in Group 1 for Session 2. Seven of the eight students had played the paper
prototype in class before coming to the testing session at our university. All students
except one had prior knowledge of the game rules, objective, and mechanics.
The two groups were presented with conditions as follows: Group 1: N, H, C,
N and Group 2: N, C, H, N, where N = no rules, H = human-enforced rules, and C =
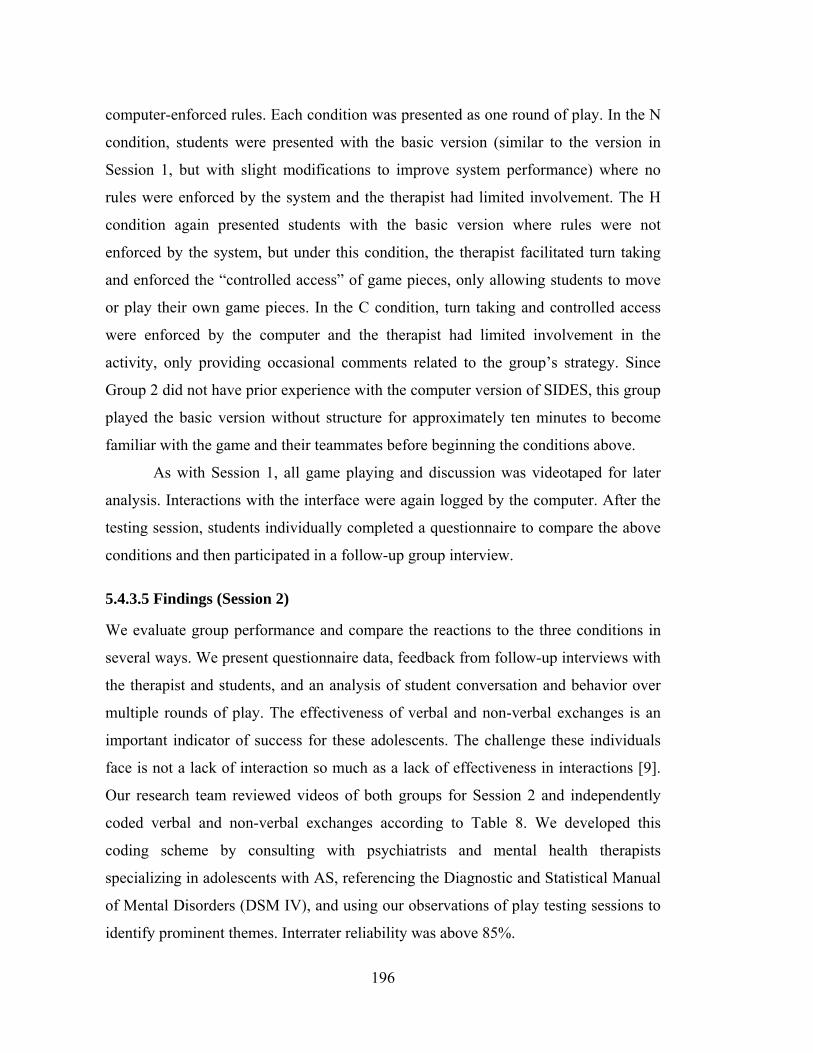
196
computer-enforced rules. Each condition was presented as one round of play. In the N
condition, students were presented with the basic version (similar to the version in
Session 1, but with slight modifications to improve system performance) where no
rules were enforced by the system and the therapist had limited involvement. The H
condition again presented students with the basic version where rules were not
enforced by the system, but under this condition, the therapist facilitated turn taking
and enforced the “controlled access” of game pieces, only allowing students to move
or play their own game pieces. In the C condition, turn taking and controlled access
were enforced by the computer and the therapist had limited involvement in the
activity, only providing occasional comments related to the group’s strategy. Since
Group 2 did not have prior experience with the computer version of SIDES, this group
played the basic version without structure for approximately ten minutes to become
familiar with the game and their teammates before beginning the conditions above.
As with Session 1, all game playing and discussion was videotaped for later
analysis. Interactions with the interface were again logged by the computer. After the
testing session, students individually completed a questionnaire to compare the above
conditions and then participated in a follow-up group interview.
5.4.3.5 Findings (Session 2)
We evaluate group performance and compare the reactions to the three conditions in
several ways. We present questionnaire data, feedback from follow-up interviews with
the therapist and students, and an analysis of student conversation and behavior over
multiple rounds of play. The effectiveness of verbal and non-verbal exchanges is an
important indicator of success for these adolescents. The challenge these individuals
face is not a lack of interaction so much as a lack of effectiveness in interactions [9].
Our research team reviewed videos of both groups for Session 2 and independently
coded verbal and non-verbal exchanges according to Table 8. We developed this
coding scheme by consulting with psychiatrists and mental health therapists
specializing in adolescents with AS, referencing the Diagnostic and Statistical Manual
of Mental Disorders (DSM IV), and using our observations of play testing sessions to
identify prominent themes. Interrater reliability was above 85%.

197
Table 8: Categories for Conversation/Behavior Analysis
Positive Aggressive Non-Responsive
• Verbal agreement • Agreement by
making suggested play
• Encouragement
• Verbal command • Pushing • Loud outburst,
screaming • Teasing
• Ignore or dismiss idea without discussion
• Ignore/disregard therapist
It is important to note that students in Group 1 had prior experience working
with each other while playing the earlier version of SIDES during Session 1. In
Session 1, these students experienced the “chaos” of playing without rules. This
experience gave them a benchmark to which they could compare their experience in
Session 2. Group 2 had limited exposure to the game and minimal experience working
with their set group of peers. For this reason and due to the limited scope of our data
set, we do not directly compare the two groups in Session 2. Instead, we treat the two
groups as separate cases and seek to understand design implications based on the
varying group dynamics and reactions to the activity.
Group 1: Students in Group 1 exhibited an increase in positive language use
as well as a decrease in the amount of aggressive behaviors over multiple rounds (see
Figure 57).
Based on conversational exchanges between group members, students in
Group 1 performed best in the computer-enforced rules condition. Group 1 also
demonstrated an improvement in conversation over the course of the trial and
sustained this improvement in the final round without rules, the condition described as
most difficult by students in Group 1. These students quickly adapted to the computer-
enforced rules condition, becoming highly coordinated by skipping turns to get to a
player who owned the piece necessary for the next move. Three out of four students in
Group 1 rated the game as easiest to play when rules were enforced by the computer.
Three out of four students in Group 1 also reported that they were most relaxed when
rules were enforced by the computer. No students in Group 1 rated the computer-
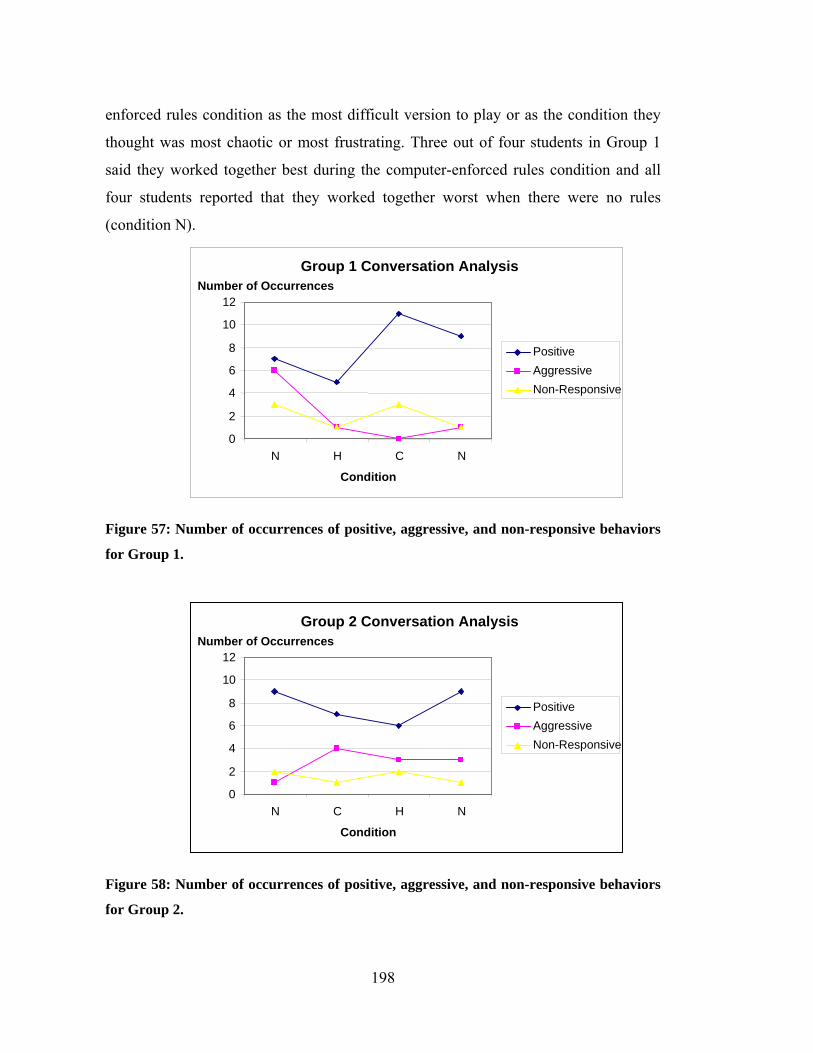
198
enforced rules condition as the most difficult version to play or as the condition they
thought was most chaotic or most frustrating. Three out of four students in Group 1
said they worked together best during the computer-enforced rules condition and all
four students reported that they worked together worst when there were no rules
(condition N).
Figure 57: Number of occurrences of positive, aggressive, and non-responsive behaviors
for Group 1.
Figure 58: Number of occurrences of positive, aggressive, and non-responsive behaviors
for Group 2.
Group 1 Conversation Analysis
0 2 4 6 8
10 12
N H C N
Condition
Number of Occurrences
Positive Aggressive Non-Responsive
Group 2 Conversation Analysis
0 2 4 6 8
10 12
N C H N
Condition
Number of Occurrences
Positive Aggressive Non-Responsive

199
Group 2: In contrast to Group 1, all students in Group 2 stated that the game
was easiest to play and that they worked together best when there were no rules. Three
of the four students also indicated that they were most relaxed when there were no
rules. The conversation analysis of Group 2 echoes the student questionnaire data.
Group 2 exhibited more positive conversational exchanges and fewer aggressive
behaviors in the no rules conditions (see Figure 58).
Students in Group 2 sustained the same level of positive conversational
exchanges and only slightly increased in aggressive behaviors over the four rounds.
Group 2 indicated that the no rules condition was easiest and demonstrated
conversation and behaviors that support their questionnaire responses. This group,
however, did not indicate a majority opinion for the questions asking which version
was most chaotic and most frustrating, but split their votes between the two conditions
with rules. Responses to the condition under which the group worked together worst
were also divided between the human- and computer-enforced rules conditions. The
difficulty for students in Group 2 to work effectively with rules is in part due to the
inflexibility of one player in this group, Brandon (age 11). Brandon consistently
expressed skepticism about the team’s solution and delayed the game by refusing to
give up his turn even if he did not have any pieces to play. After observing Session 2,
the therapist said, “I wish I could get the rest of my students to play this because it
really gives me an idea of what’s hard for each individual. Like with Brandon, I had
no idea he had such issues trusting other students until I saw him unwilling to give up
his turn when the computer was enforcing turn taking.”
Since our evaluation only involves two groups using SIDES for approximately
one hour each, it is difficult to isolate exactly what influenced these behavioral
changes. The improvements and sustained positive behaviors demonstrated by the
groups could have resulted from learning the game and becoming more efficient at the
activity. The therapist’s intervention between rounds, giving students feedback on
their behavior after each round, is another factor that likely contributed to both groups’
improved performance. Nonetheless, adolescents within this population have a strong
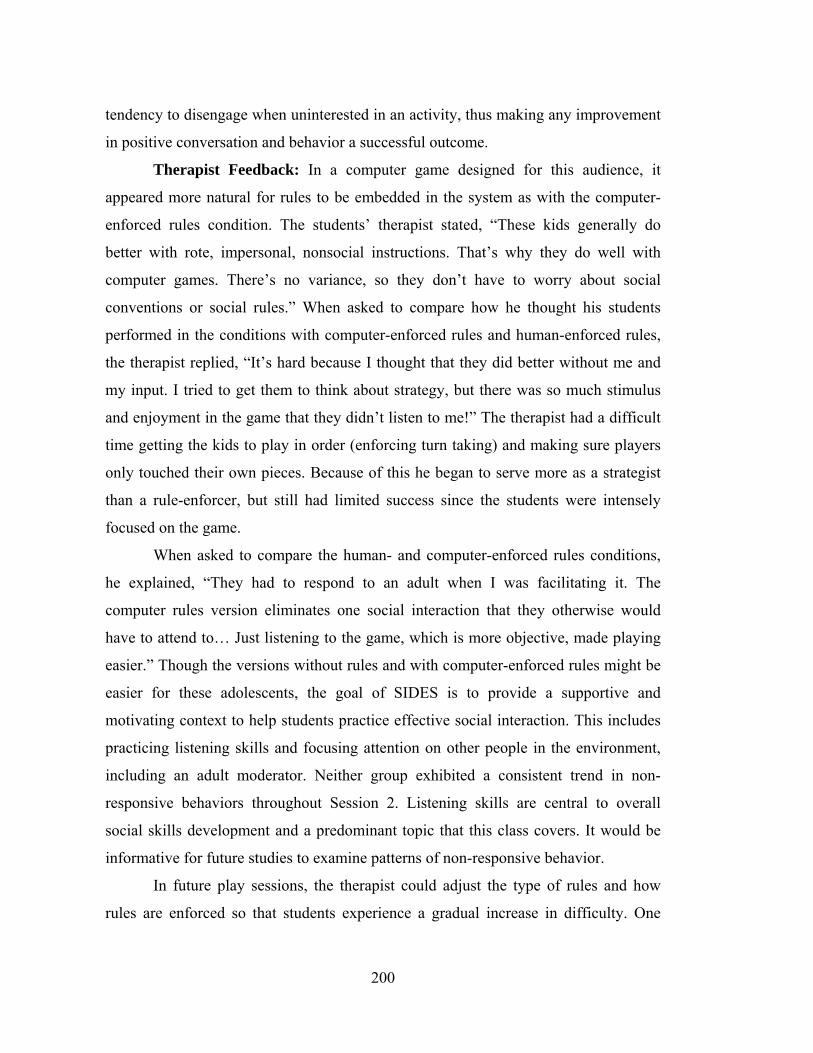
200
tendency to disengage when uninterested in an activity, thus making any improvement
in positive conversation and behavior a successful outcome.
Therapist Feedback: In a computer game designed for this audience, it
appeared more natural for rules to be embedded in the system as with the computer-
enforced rules condition. The students’ therapist stated, “These kids generally do
better with rote, impersonal, nonsocial instructions. That’s why they do well with
computer games. There’s no variance, so they don’t have to worry about social
conventions or social rules.” When asked to compare how he thought his students
performed in the conditions with computer-enforced rules and human-enforced rules,
the therapist replied, “It’s hard because I thought that they did better without me and
my input. I tried to get them to think about strategy, but there was so much stimulus
and enjoyment in the game that they didn’t listen to me!” The therapist had a difficult
time getting the kids to play in order (enforcing turn taking) and making sure players
only touched their own pieces. Because of this he began to serve more as a strategist
than a rule-enforcer, but still had limited success since the students were intensely
focused on the game.
When asked to compare the human- and computer-enforced rules conditions,
he explained, “They had to respond to an adult when I was facilitating it. The
computer rules version eliminates one social interaction that they otherwise would
have to attend to… Just listening to the game, which is more objective, made playing
easier.” Though the versions without rules and with computer-enforced rules might be
easier for these adolescents, the goal of SIDES is to provide a supportive and
motivating context to help students practice effective social interaction. This includes
practicing listening skills and focusing attention on other people in the environment,
including an adult moderator. Neither group exhibited a consistent trend in non-
responsive behaviors throughout Session 2. Listening skills are central to overall
social skills development and a predominant topic that this class covers. It would be
informative for future studies to examine patterns of non-responsive behavior.
In future play sessions, the therapist could adjust the type of rules and how
rules are enforced so that students experience a gradual increase in difficulty. One
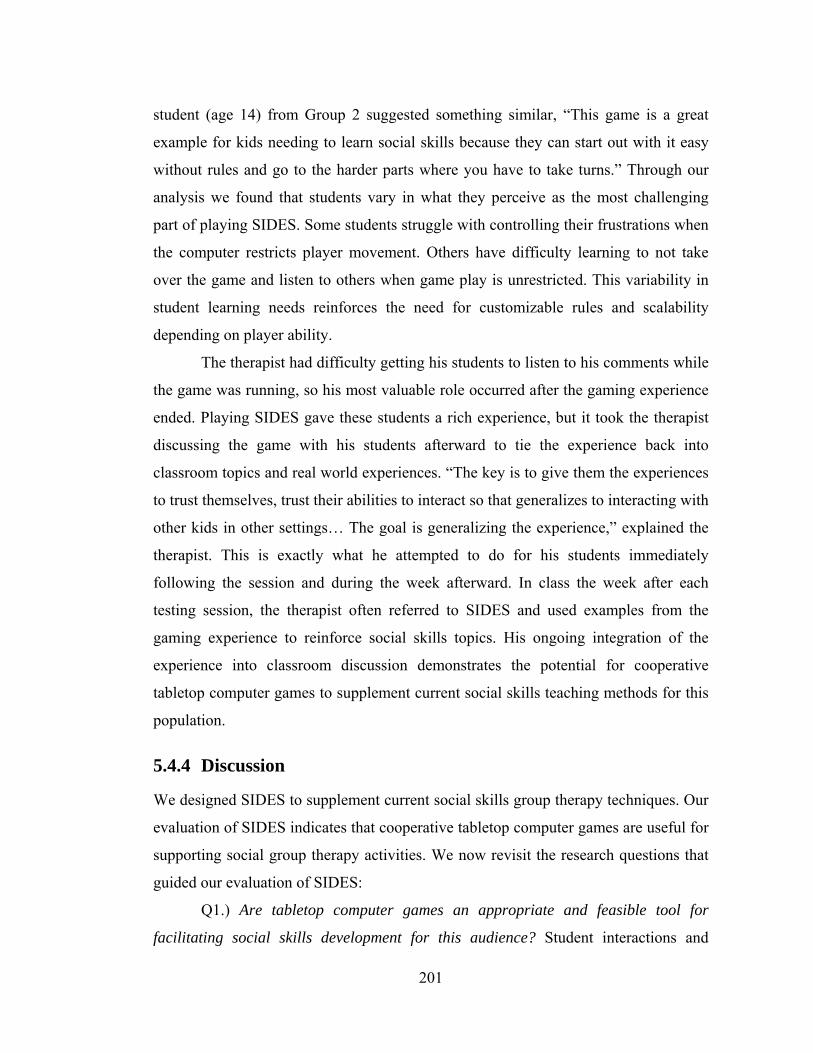
201
student (age 14) from Group 2 suggested something similar, “This game is a great
example for kids needing to learn social skills because they can start out with it easy
without rules and go to the harder parts where you have to take turns.” Through our
analysis we found that students vary in what they perceive as the most challenging
part of playing SIDES. Some students struggle with controlling their frustrations when
the computer restricts player movement. Others have difficulty learning to not take
over the game and listen to others when game play is unrestricted. This variability in
student learning needs reinforces the need for customizable rules and scalability
depending on player ability.
The therapist had difficulty getting his students to listen to his comments while
the game was running, so his most valuable role occurred after the gaming experience
ended. Playing SIDES gave these students a rich experience, but it took the therapist
discussing the game with his students afterward to tie the experience back into
classroom topics and real world experiences. “The key is to give them the experiences
to trust themselves, trust their abilities to interact so that generalizes to interacting with
other kids in other settings… The goal is generalizing the experience,” explained the
therapist. This is exactly what he attempted to do for his students immediately
following the session and during the week afterward. In class the week after each
testing session, the therapist often referred to SIDES and used examples from the
gaming experience to reinforce social skills topics. His ongoing integration of the
experience into classroom discussion demonstrates the potential for cooperative
tabletop computer games to supplement current social skills teaching methods for this
population.
5.4.4 Discussion
We designed SIDES to supplement current social skills group therapy techniques. Our
evaluation of SIDES indicates that cooperative tabletop computer games are useful for
supporting social group therapy activities. We now revisit the research questions that
guided our evaluation of SIDES:
Q1.) Are tabletop computer games an appropriate and feasible tool for
facilitating social skills development for this audience? Student interactions and

202
feedback during the play testing sessions validated that tabletop computer games are
both appropriate and motivating for this audience, middle school students with
Asperger’s Syndrome or related developmental disorders. Feedback from the therapist
and parents revealed that a cooperative tabletop computer game for practicing social
skills is a feasible and useful application of tabletop technology.
Q2.) Do any sensory or motor issues specific to this audience affect interaction
with tabletop technology? We did not uncover any sensory or motor issues with the
participants involved in this study. However, all participants were high-functioning
and none had motor coordination difficulties that would impact use of a traditional
computer workstation with a keyboard and mouse. Adolescents with an Autism
Spectrum Disorder have varying levels of noise tolerance and motor abilities, so an
adolescent’s ability to use SIDES or other tabletop software should be evaluated on an
individual basis.
Q3.) Does training in highly structured conditions help these adolescents
perform better in later conditions when game play is unstructured? In Session 2, we
observed an upward trend in positive verbal exchanges and a decrease or sustained
number of aggressive exchanges over the course of the activity. Given the scope of our
testing sessions and data, we cannot conclude that experiencing the structured
conditions was the key factor that led to a positive behavioral change. This result is
likely also influenced by an increase in experience working with SIDES and with a set
group of peers.
Though our current findings are inconclusive, we suspect that experiencing the
structured conditions was a large contributor to Group 1’s success in Session 2, as this
group demonstrated the most effective group work in the structured conditions (H and
C) and only showed a slight decrease in the final round where no rules were enforced.
During the debrief after Session 2, the therapist said to his students in Group 1, “You
guys didn’t even notice that in the last round you could touch each others pieces and
play in any order. You didn’t reach across and take people’s pieces like before, you
kept working together.” Students in Group 1 reported working together best under the
conditions with rules, where as students in Group 2 explicitly stated that they did not
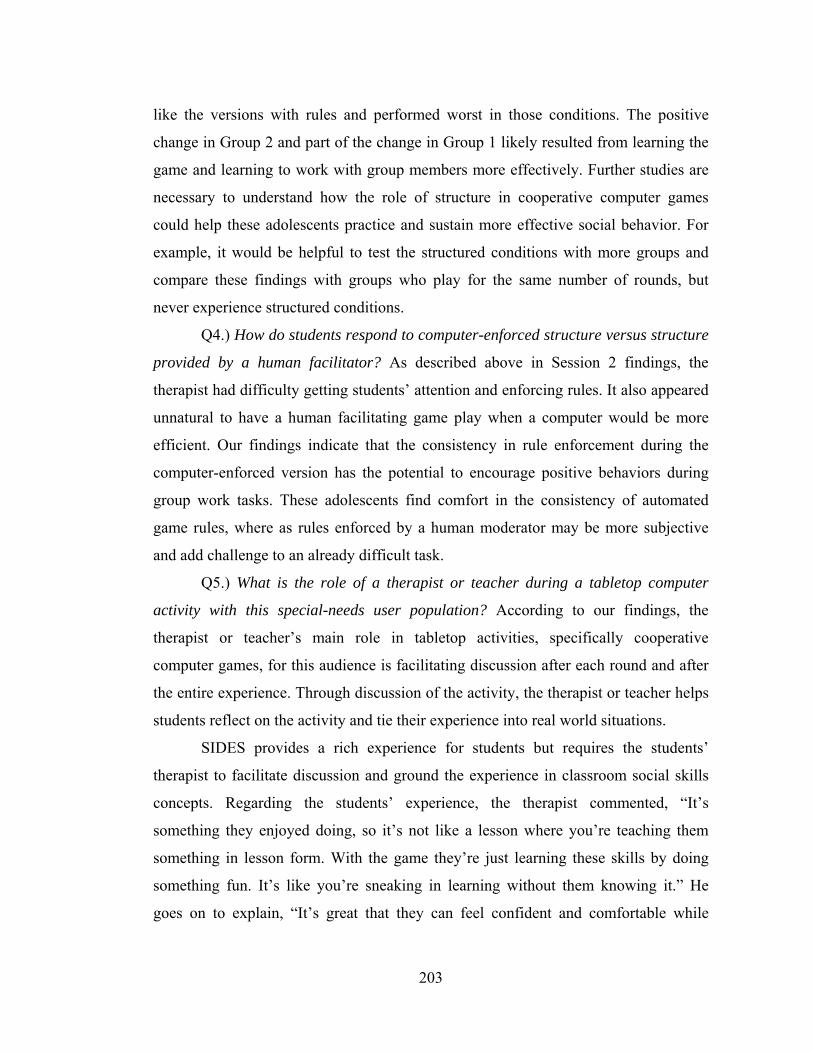
203
like the versions with rules and performed worst in those conditions. The positive
change in Group 2 and part of the change in Group 1 likely resulted from learning the
game and learning to work with group members more effectively. Further studies are
necessary to understand how the role of structure in cooperative computer games
could help these adolescents practice and sustain more effective social behavior. For
example, it would be helpful to test the structured conditions with more groups and
compare these findings with groups who play for the same number of rounds, but
never experience structured conditions.
Q4.) How do students respond to computer-enforced structure versus structure
provided by a human facilitator? As described above in Session 2 findings, the
therapist had difficulty getting students’ attention and enforcing rules. It also appeared
unnatural to have a human facilitating game play when a computer would be more
efficient. Our findings indicate that the consistency in rule enforcement during the
computer-enforced version has the potential to encourage positive behaviors during
group work tasks. These adolescents find comfort in the consistency of automated
game rules, where as rules enforced by a human moderator may be more subjective
and add challenge to an already difficult task.
Q5.) What is the role of a therapist or teacher during a tabletop computer
activity with this special-needs user population? According to our findings, the
therapist or teacher’s main role in tabletop activities, specifically cooperative
computer games, for this audience is facilitating discussion after each round and after
the entire experience. Through discussion of the activity, the therapist or teacher helps
students reflect on the activity and tie their experience into real world situations.
SIDES provides a rich experience for students but requires the students’
therapist to facilitate discussion and ground the experience in classroom social skills
concepts. Regarding the students’ experience, the therapist commented, “It’s
something they enjoyed doing, so it’s not like a lesson where you’re teaching them
something in lesson form. With the game they’re just learning these skills by doing
something fun. It’s like you’re sneaking in learning without them knowing it.” He
goes on to explain, “It’s great that they can feel confident and comfortable while

204
working with each other because it’s not torturous. These students didn’t even see the
activity as learning to work in a group.” Helping students build confidence in their
social abilities is another benefit we hope students receive by playing SIDES. For
Brad, participating in the testing sessions was an experience far beyond just learning
social skills. “[Brad] is a kid who has been tormented and terrorized by other kids in
his class. For him to be able to participate and feel like he’s part of the group and
accepted was great. He probably enjoyed it more than anyone because his existence
was validated through the shared activity,” commented the therapist.
On both an individual and class-wide level, we observed the positive effects of
situating an educational topic that is traditionally difficult for this group of students,
social skills development, in an exciting and comfortable context, playing a
cooperative tabletop computer game.
5.4.5 SIDES: Conclusion
We have presented a design case study of a cooperative tabletop computer game for a
special needs population. The goal of SIDES is to provide adolescents with Asperger’s
Syndrome with a positive experience through which they can develop effective group
work skills and build confidence in social interaction. We consider sustained
engagement in the activity and an increased ability to communicate with peers after
multiple rounds of play as successful outcomes for this group of adolescents.
Cooperative computer games are a new paradigm for teaching effective group work
skills in a meaningful way. Tabletop technology is a promising tool for facilitating
cooperative gaming experiences geared for this special needs population as well as the
general public.
SIDES addresses the issue of mediating group dynamics by exploring how
tabletop interfaces can be designed to promote positive social interactions among a
special-needs populations. SIDES also demonstrates examples of interaction
techniques described earlier in this dissertation, including multi-user coordination
policies (e.g., the use of a “private” policy to enforce piece ownership) and
cooperative gesturing (e.g., the voting interface for path-testing and quitting the
game).

205
6 Conclusions and Future Work
This thesis has explored the properties of group interaction with interactive tables, and
introduced novel interaction techniques and evaluations of user interface designs that
can inform the design of software for this emerging form-factor.
Traditional table work practices include periods of both tightly-coupled and
loosely-coupled collaboration, and include supplementary sources of private
information, such as notebooks, that are consulted in combination with the information
spread on the tabletop. Consequently, one focus of this thesis was exploring
techniques for integrating sources of private information with an interactive tabletop
display. This dissertation introduced gestures for transitioning digital documents
between states of public and private accessibility, the impact of supplementing a
shared tabletop display with sources of individually-targeted audio information, and a
technique for “teleporting” information between personal PDAs and a table.
The shared nature of tables results in the need to display large quantities of
information in a limited space (i.e., enough information to be of interest to several
group members, plus possibly controls for each user). The horizontal nature of
tabletop displays also introduces challenges, such as odd orientations for text and
images. Hence, a second area of focus for this thesis was the management of graphical
display elements. Along these lines, we compared the impact of centralized versus
replicated control layouts, and of parallel versus collective interpretations of user
inputs. We also presented prototypes demonstrating the utility of multi-modality for
reducing clutter and orientation-dependence on tabletop displays, and creating an
analogy with physical “drawers” as a means for storing some information off-screen.
We also described design considerations for displaying ambient information on

206
tabletops as well as several cooperative research efforts with MERL, most notably the
development and refinement of the DiamondSpin tabletop interface toolkit.
Because tables are used primarily for group meetings and activities, taking into
account the impact of social interactions on tabletop use styles as well as the potential
impact of tabletop interface design on interpersonal interactions is a relevant issue.
Our final area of focus, therefore, is taking into account group dynamics in tabletop UI
design. Multi-user coordination policies are intended to mitigate workflow disruptions
resulting from social protocol breakdowns, and cooperative gestures are meant to
increase socialization among group members. We also explored the impact of several
design variations of educational software on participation equity, as well as
investigating how a tabletop activity could be designed to increase socialization and
communication for children with Asperger’s Syndrome.
The preceding chapters introduced prototypes and evaluations of tabletop
systems that demonstrate novel interaction techniques and/or comparisons of interface
designs for co-located group work using interactive tables. In the remainder of this
chapter, we distill design guidelines from these experiences, and suggest areas for
further investigation.
6.1 Design Guidelines for Interactive Tables
Based on our experiences building and evaluating the systems described in Chapters 3
to 5, we articulate design guidelines and considerations for the development of
interactive table systems. These considerations involve the amount of information on
the tabletop, the accessibility of that information, the composition of the user group,
workflow styles, and the overall performance goals of the tabletop system.
6.1.1 Table Regions
• Keeping the center region of the table open for user content, rather than filling
it with fixed UI controls such as buttons or menus, supports users’ preferences
to use that space for focused group attention on items under discussion.
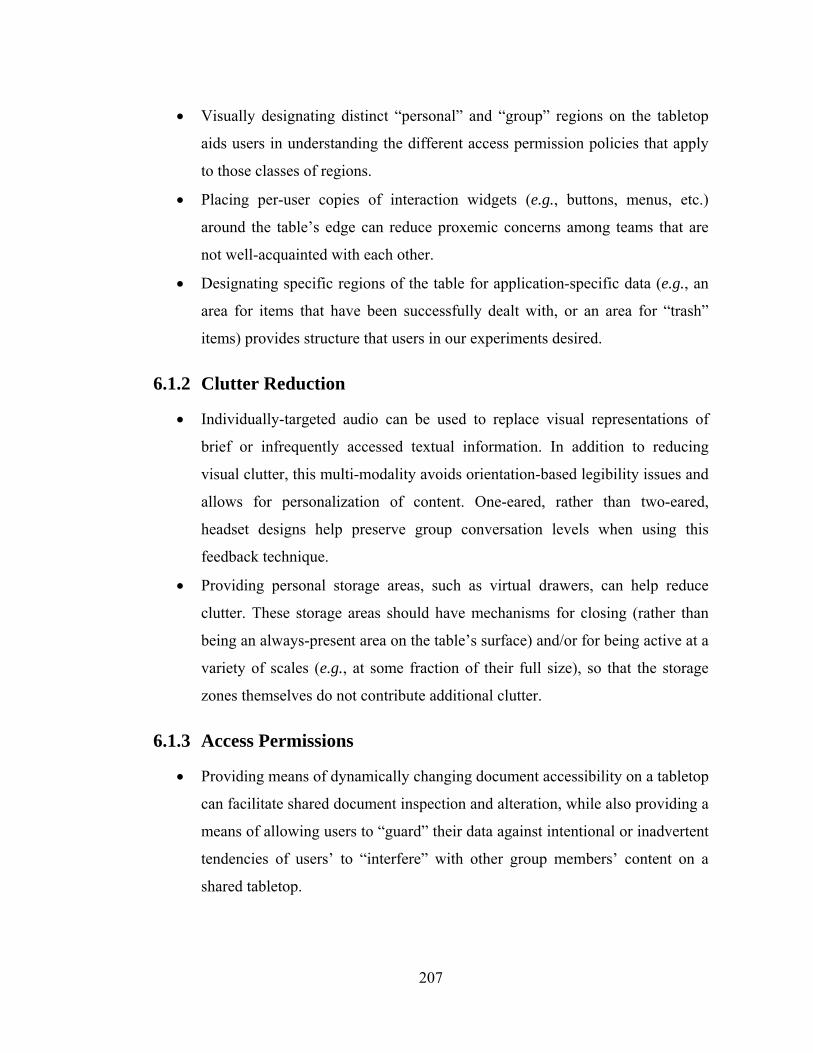
207
• Visually designating distinct “personal” and “group” regions on the tabletop
aids users in understanding the different access permission policies that apply
to those classes of regions.
• Placing per-user copies of interaction widgets (e.g., buttons, menus, etc.)
around the table’s edge can reduce proxemic concerns among teams that are
not well-acquainted with each other.
• Designating specific regions of the table for application-specific data (e.g., an
area for items that have been successfully dealt with, or an area for “trash”
items) provides structure that users in our experiments desired.
6.1.2 Clutter Reduction
• Individually-targeted audio can be used to replace visual representations of
brief or infrequently accessed textual information. In addition to reducing
visual clutter, this multi-modality avoids orientation-based legibility issues and
allows for personalization of content. One-eared, rather than two-eared,
headset designs help preserve group conversation levels when using this
feedback technique.
• Providing personal storage areas, such as virtual drawers, can help reduce
clutter. These storage areas should have mechanisms for closing (rather than
being an always-present area on the table’s surface) and/or for being active at a
variety of scales (e.g., at some fraction of their full size), so that the storage
zones themselves do not contribute additional clutter.
6.1.3 Access Permissions
• Providing means of dynamically changing document accessibility on a tabletop
can facilitate shared document inspection and alteration, while also providing a
means of allowing users to “guard” their data against intentional or inadvertent
tendencies of users’ to “interfere” with other group members’ content on a
shared tabletop.
208
• Making documents’ current accessibility status visible is important for
preventing confusion regarding accessibility. This status information can be
reflected explicitly (e.g., with icons, colors, or text that augments the object) or
through the natural state of the object itself (e.g., its location on the table,
orientation, size, etc.).
6.1.4 Group Dynamics
• Explicit awareness information provided by a tabletop system helps users
regulate their participation levels. This information can be subtle (e.g., the use
of audio feedback attached to particular interactions can keep users aware of
group members’ activity levels) or more explicit (e.g., individually-targeted
interaction visualizations can convince users to change their levels of activity).
• The location of key interaction items on a tabletop display can impact
participation patterns. Placing data objects near particular users’ seats, for
instance, encourages them to take responsibility for those items.
• Providing private sources of feedback during group tasks that have a
“competitive” edge to them (such as some educational activities), makes users
feel less hesitant to contribute to the activity.
• Providing built-in structure for an activity (e.g., computer enforced access
control, turn-taking, etc.) can make tabletop software more accessible to
special-needs groups, such as adolescents with Asperger’s Syndrome.
• Preventing one user from (accidentally or intentionally) negatively impacting
the group experience by dramatically altering the state of the tabletop without
group consent can avoid potential workflow breakdowns. Mechanisms such as
multi-user coordination policies or cooperative gesturing can ensure group
consent for application events that impact all stakeholders.
6.1.5 Work Styles
• Providing a source of private data (such as individually-targeted audio) in
combination with a shared tabletop display is a successful way to facilitate

209
traditional workflows that allow for smooth transitions between closely- and
loosely-coupled group work.
• Including team-centric interaction techniques such as cooperative gestures can
add a fun or team-centric feel to a tabletop application. However, these
interactions should be reserved for specialized actions (such as facilitating
reach, access control, or awareness of key application events) or for specialized
audiences, since overuse can result in a burdensome interface that does not
provide enough opportunity for parallel activity.
6.1.6 Usability Metrics
• Because tabletops’ strength lies in their support for co-located group work, the
impact of the interface on group processes might, for instance, be more
important than speed. Facilitating teamwork, socialization, participation,
peripheral learning, or other collaborative processes may result in an interface
design that would not be considered optimal by efficiency standards.
6.2 Limitations
This dissertation explored three design challenges posed by interactive tables:
integrating public and private information, managing display elements, and mediating
group dynamics. There are several other interesting aspects of tabletop groupware
design and use that remain beyond the scope of our inquiry. Additionally, there are
several factors that may impact tabletop usability that we did not explore in our studies
and prototypes, including the impact of different interactive table technologies, table
form-factor issues, group composition, specialized user populations, and long-term
table use.
All of the work described in this thesis uses Mitsubishi’s DiamondTouch
technology. As mentioned in Chapter 2, other interactive table platforms are
increasingly becoming available, although DiamondTouch remains the most used “off
the shelf” table technology at the time of writing. It is reasonable to hypothesize that
the high-level results described in this thesis are applicable to other technology

210
platforms, but we have not actually tested using a non-DiamondTouch setup. Most of
the prototypes described rely on the user-identification capabilities of the
DiamondTouch, and the ability to accept simultaneous input from up to four users,
features which are not yet available in any other table technologies, but which could
be simulated (with varying degrees of success) by augmenting other technologies with
cameras or other sensors.
Issues related to the composition of user groups were also not addressed in this
work. The interplay of group members’ personalities, as well as the type and extent of
the relationships among group members, were not studied for their impact on tabletop
usability. However, as results from some of our studies (e.g., the evaluations of
TeamTag, in section 4.1, and of CollabDraw, in section 5.3) showed, group
relationships impacted the acceptability of some aspects of interface design (e.g., those
related to proxemics). A more systematic comparison of the impact of different group
compositions on tabletop interface issues is beyond the scope of this thesis.
Similarly, specialized user populations (e.g., children, the elderly, the disabled)
may have distinct skills or needs that could be addressed through specific UI designs.
Our work on the SIDES system (in section 5.4) begins to address this issue by
exploring how table UIs can be adapted to meet the needs of youths with Asperger’s
Syndrome. However, the majority of the work described in this thesis was tested on
undergraduate and graduate students from the Stanford University community. As
educated adults who use technology on a regular basis and have information-finding
and information-organizing needs, this population is a reasonable proxy for likely
users of tabletop systems in the business world. However, exploring how our tabletop
designs apply to additional user populations is important for understanding how
technology can be made more accessible to less traditional user groups.
Finally, because tabletop technology is still relatively novel (and therefore
uncommon and expensive), all interactions we have observed with the devices have
been in the course of brief (30 minute – 3 hour) sessions. We have not had the
opportunity to observe “expert” or long-term users of these devices, because currently
such users do not exist. Understanding how the needs and abilities of tabletop users

211
may change with long-term use and the acquisition of expertise is another important
usability question not addressed within the context of this dissertation.
6.3 Future Work
Throughout the individual sections of this dissertation, we have noted specific avenues
of future research activities that are logical follow-ups to the work we have described.
More broadly, there are several interesting paths of tabletop groupware research not
touched on by this thesis, such as the integration of tables with ubiquitous computing
resources and the exploration of additional tabletop form-factors.
Because the hardware necessary to create multi-user interactive tables has only
recently become available (e.g., the introduction of Mitsubishi’s DiamondTouch
device in 2001), current research on tabletop interfaces (including the work described
in this dissertation) has focused mainly on exploring tabletops in isolation, in order to
better understand the unique affordances and design constraints of this new class of
devices. A promising area for further research is the integration of these devices into
multi-device and ubiquitous computing environments.
Meeting rooms, classrooms, and homes of the future are likely to contain a
large number of augmented walls and horizontal surfaces, as well as a wide array of
mobile computing devices including phones, cameras, and PDAs. Exploring
architectures and interactions for seamlessly transferring and transforming information
among the disparate devices in ubicomp settings, and creating software development
paradigms that simplify developing applications and prototyping interaction
techniques for these heterogeneous, multi-display environments is a key challenge for
future study.
Because a strength of traditional tables is their support for face-to-face
interaction, current tabletop research has focused on supporting co-located group
work. Exploring the type of interface support needed to enable successful remote
collaboration with multiple augmented tables is a related design challenge left for
future work. In addition to exploring software development models, interfaces, and
interaction techniques for combinations of co-located and remote horizontal surfaces,

212
exploring the physical form-factors most appropriate for these devices is also an
interesting research horizon. Current tabletop research has been limited by available
hardware form-factors: for instance, the DiamondTouch table is available in only an
80 cm or 107 cm diagonal size. Developing table displays with larger form-factors
opens up additional research questions. For example, an interactive conference table
might promote more social interaction and awareness than a traditional piece of
furniture, perhaps by replicating information from distant parts of the table, or
showing peripheral awareness visualizations to people at the far end. While some of
our work (e.g., section 4.6.1) begins to explore the impact of table size on interaction,
the lack of significantly larger table sizes may have masked potential usability
differences that could arise. For example, larger tables might eliminate the need for
coordination policies, by making it difficult for people to accidentally interfere with
other people’s digital documents because they cannot reach them; or, larger sizes
might increase the need for coordination policies because the large size will make it
harder for people to keep track of what is going on, thus increasing the number of
“conflicts” that arise.
6.4 Closing Remarks
Group work and collaboration are important aspects of business, education, and
entertainment that remain inadequately supported by existing computer technologies.
This dissertation explored one type of computing system for supporting co-located
cooperative activities: group work using computer-augmented tables. It introduced
several user interaction techniques and user interface designs appropriate for this
emerging form-factor, and framed our discussion according to three key design
challenges for tabletop UIs: integrating public and private information, managing
display elements, and mediating group dynamics. This dissertation represents a step
towards supporting effective interaction with tabletop groupware and, more broadly,
towards understanding the design requirements for systems that support co-located
cooperative activities.

213
Bibliography
[1] ACM CSCW (Computer Supported Cooperative Work) 2002 Workshop on
Co-located Tabletop Collaboration: Technologies and Directions. 2002.
[2] Agrawala, M. et al., The Two-User Responsive Workbench: Support for
Collaboration through Individual Views of a Shared Space. Proceedings of
SIGGRAPH 1997, 327-332.
[3] Aoki, P., Grinter, R., Hurst, A., Szymanski, M., Thornton, J., and Woodruff,
A. Sotto Voce: Exploring the Interplay of Conversation and Mobile Audio
Spaces. Proceedings of CHI (Human Factors in Computing Systems) 2002,
431-438.
[4] Arias, E. et al., Enhancing Communications, Facilitating Shared
Understanding, and Creating Better Artifacts by Integrating Physical and
Computational Media for Design. Proceedings of DIS (Designing Interactive
Systems) 1997, 1-12.
[5] Azmitia, M. (1988). Peer interaction and problem solving: When are two heads
better than one? Child Development, 59, 87–96.
[6] Baron-Cohen, S. (2004). Mind Reading: The Interactive Guide to Emotions
(CD-ROM). Jessica Kingsley Publishers.
[7] Barron, B. Achieving Coordination in Collaborative Problem-Solving Groups.
The Journal of the Learning Sciences, 9, 403-436.

214
[8] Baudel, T. and Beaudoin-Lafon, M. Charade: Remote Control of Objects
Using Free-Hand Gestures. Communications of the ACM. 36(7), 28-35.
[9] Bauer, S. (1996). Asperger Syndrome. http://www.udel.edu/bkirby/asperger/
[10] Baudisch, P., Cutrell, E., Robbins, D., Czerwinski, M., Tandler, P., Bederson,
B., and Zierlinger, A. Drag-and-Pop and Drag-and-Pick: Techniques for
Accessing Remote Screen Content on Touch- and Pen-operated Systems.
Proceedings of Interact 2003.
[11] Beardon, L., Parsons, S. & Neale, H. (2001). An inter-disciplinary approach to
investigating the use of virtual reality environments for people with Asperger
Syndrome. Educational and Child Psychology, Vol. 18, No. 2, 53-62.
[12] Bederson, B., Hollan, J., Druin, A., Stewart, J., Rogers, D., and Proft, D. Local
Tools: An Alternative to Tool Palettes. Proceedings of UIST (User Interface
Software and Technology) 1996, 169-170.
[13] Biehl, J. et al. Improving Interfaces for Collaborative Work in Multiple-Device
Environments. Submitted to CHI (Human Factors in Computing Systems)
2006, in review.
[14] Bier, E. and Freeman, S. MMM: A User Interface Architecture for Shared
Editors on a Single Screen. Proceedings of UIST (User Interface Software and
Technology) 1991, 79-86.
[15] Blaine, T. and Forlines, C. JAM-O-WORLD: Evolution of the Jam-O-Drum
Multi-player Musical Controller into the Jam-O-Whirl Gaming Interface.
Proceedings of the 2002 Conference on New Instruments for Musical
Expression, Dublin, Ireland, May 2002.
[16] Blaine, T. and Perkis, T. The Jam-O-Drum Interactive Music System: A Study
in Interaction Design. Proceedings of DIS (Designing Interactive Systems)
2000, 165-173.

215
[17] Bly, S.A., A Use of Drawing Surfaces in Different Collaborative Settings.
Proceedings of CSCW (Computer Supported Cooperative Work) 1988, 250-
256.
[18] Bos, M. C. (1937). Experimental study of productive collaboration. Acta
Psychologica, 3, 315–426.
[19] Bowman, D., and Hodges, L. An Evaluation of Techniques for Grabbing and
Manipulating Remote Objects in Immersive Virtual Environments. 1997
Symposium on Interactive 3D Graphics, pages 35-38.
[20] Bratman, M. 1999. Faces of Intention. Cambridge, MA: Cambridge University
Press.
[21] Bullock, A. and Benford, S. An Access Control Framework for Multi-User
Collaborative Environments. Proceedings of GROUP 1999, 140-149.
[22] Buxton, W. Chunking and Phrasing and the Design of Human-Computer
Dialogues. IFIP Conference, 1986, 475-480.
[23] Callahan, J., Hopkins, D., Weiser, M., and Shneiderman, B. An Empirical
Comparison of Pie vs Linear Menus. Proceedings of CHI (Human Factors in
Computing Systems) 1988, 95-100.
[24] Cappelletti, A., Gelmini, G., Pianesi, F., Rossi, F., and Zancanaro, M.
Enforcing Cooperative Storytelling: First Studies. Proceedings of ICALT 2004
(4th IEEE International Conference on Advanced Learning Technologies).
[25] Coleman, E. (1998). Using explanatory knowledge during collaborative
problem solving in science. Journal of Learning Sciences, 7, 387-427.
[26] Corbett, A. T., Anderson, J. R. Locus of feedback control in computer-based
tutoring: impact on learning rate, achievement and attitudes. Proceedings of
CHI (Human Factors in Computing Systems) 2001, 245-252.

216
[27] Crabtree, A., Rodden, T., and Mariani, J. Collaborating Around Collections:
Informing the Continued Development of Photoware. Proceedings of CSCW
(Computer Supported Cooperative Work) 2004, 396-405.
[28] Darley, J.M., and Latane, B., Bystander intervention in emergencies: Diffusion
of responsibility. Journal of Personality and Social Psychology, 8, 377-383.
1968.
[29] de Bruijn, O. and Spence, R. Serendipity within a Ubiquitous Computing
Environment: A Case for Opportunistic Browsing. Proceedings of Ubicomp
2001, 362-369.
[30] Diaz-Marino, R., Tse, E., and Greenberg, S. Programming for Multiple
Touches and Multiple Users: A Toolkit for the DiamondTouch Hardware.
UIST (User Interface Software and Technology) 2003 Conference Companion.
[31] Dietz, P. and Leigh, D. DiamondTouch: A Mutli-User Touch Technology.
Proceedings of UIST (User Interface Software and Technology) 2001, 219-
226.
[32] Dietz, P., Harsham, B., Forlines, C., Leigh, D., Yerazunis, W., Shipman, S.,
Schmidt-Nielson, B., and Ryall, K. DT Controls: Adding Identity to Physical
Interfaces. Proceedings of UIST (User Interface Software and Technology)
2005, 245-252.
[33] DiMicco, J., Pandolfo, A., and Bender, W. Influencing Group Participation
with a Shared Display. Proceedings of CSCW (Computer Supported
Cooperative Work) 2004, 614-623.
[34] Ehlers, S. and Gillberg, C. The Epidemiology of Asperger’s Syndrome: A
Total Population Study. Journal of Child Psychology and Psychiatry and
Allied Disciplines. 34 (8), November 1993, 1327 – 1350.

217
[35] Elliott, A., and Hearst, M. A Comparison of the affordances of a digital desk
and tablet for architectural image tasks. International Journal of Human-
Computer Studies, 56(2), 173-197.
[36] Elwart-Keys, M., Halonen, D., Horton, M., Kass, R., and Scott, P. User
Interface Requirements for Face to Face Groupware. Proceedings of CHI
(Human Factors in Computing Systems) 1990, 295-301.
[37] Ericson, M. and McKinley, R. The Intelligibility of Multiple Talkers Separated
Spatially in Noise. In Binaural and Spatial Hearing in Real and Virtual
Environments, R.H. Gilkey and T.A. Anderson (eds.), L. Erlbaum Associates,
Mahwah, NJ, 1997, 701-724.
[38] Everitt, K., Shen, C., Ryall, K., and Forlines, F. Modal Spaces: Spatial
Multiplexing to Mediate Direct-Touch Input on Large Displays. CHI (Human
Factors in Computing Systems) 2005 Extended Abstracts, 1359-1362.
[39] Fitzmaurice, G.W., Balakrishnan, R., Kurtenbach, G., Buxton, B., “An
Exploration into Supporting Artwork Orientation in the User Interface”,
Proceedings of CHI (Human Factors in Computing Systems) 1999, 167-174.
[40] Forlines, C. and Shen, C. DTLens: Multi-user Tabletop Spatial Data
Exploration. Proceedings of UIST (User Interface Software and Technology)
2005, 119-122.
[41] GeiBler, J. Shuffle, throw, or take it! Working Efficiently with an Interactive
Wall. CHI (Human Factors in Computing Systems) 1998 Extended Abstracts,
265 -266.
[42] Green, S.L., Devlin, S.J., Cannata, P.E., and Gomez, L.M. No IFs, ANDs, or
ORs: A Study of Database Querying. International Journal of Man-Machine
Studies, 32, 3 (1990), 303-326.

218
[43] Greenberg, S., Boyle, M., and Laberge, J. PDAs and Shared Public Displays:
Making Personal Information Public, and Public Information Personal.
Personal Technologies, 3(1), 1999, 54-64.
[44] Greenberg, S. and Marwood, D. Real Time Groupware as a Distributed
System: Concurrency Control and its Effect on the Interface. Proceedings of
CSCW (Computer Supported Cooperative Work) 1994, 207-217.
[45] Grinter, R. and Woodruff, A. Ears and Hair: What Headsets Will People
Wear? Proceedings of CHI (Human Factors in Computing Systems) 2002
Extended Abstracts, 680-681.
[46] Grossman, T., Wigdor, D., and Balakrishnan, R. Multi-Finger Gestural
Interaction with 3D Volumetric Displays. Proceedings of UIST (User Interface
Software and Technology) 2004.
[47] Grudin, J. Partitioning Digital Worlds: Focal and Peripheral Awareness in
Multiple Monitor Use. Proceedings of CHI (Human Factors in Computing
Systems) 2001, 458-465.
[48] Guiard, Y. Asymmetric division of labor in human skilled bimanual action: the
kinematic chain as a model. Journal of Motor Behaviour. 19 (4), 1987, 486-
517.
[49] Guimbretiere, F., Stone, M., and Winograd, T. Fluid Interaction with High-
Resolution Wall-Size Displays. Proceedings of UIST (User Interface Software
and Technology) 2001, 21-30.
[50] Gutwin, C. and Greenberg, S. Design for Individuals, Design for Groups:
Tradeoffs Between Power and Workspace Awareness. Proceedings of CSCW
(Computer Supported Cooperative Work) 1998, 207 – 216.
[51] Gutwin, C. and Greenberg, S. Effects of Awareness Support on Groupware
Usability. Proceedings of CHI (Human Factors in Computing Systems) 1998,
511-518.

219
[52] Hall, E.T. The Hidden Dimension. New York: Anchor Books, 1966.
[53] Han, J. Low-Cost Multi-Touch Sensing through Frustrated Total Internal
Reflection. Proceedings of UIST (User Interface Software and Technology)
2005, 115-118.
[54] Hartmann, B., Klemmer, S. R., Bernstein, M., and Mehta, N. d.tools: Visually
Prototyping Physical UIs through Statecharts. UIST (User Interface Software
and Technology) 2005 Conference Supplement.
[55] Heiner, J., Hudson, S., and Tanaka, K. The Information Percolator: Ambient
Information Display in a Decorative Object. Proceedings of UIST (User
Interface Software and Technology) 1999, 141-148.
[56] Hill, J. and Gutwin, C. Awareness Support in a Groupware Widget Toolkit.
Proceedings of GROUP 2003, 258-267.
[57] Hinckley, K. Synchronous Gestures for Multiple Persons and Computers.
Proceedings of UIST (User Interface Software and Technology) 2003, 149-
158.
[58] Hinckley, K., Ramos, G., Guimbretiere, F., Baudisch, P., and Smith, M.
Stitching: Pen Gestures that Span Multiple Displays. Proceedings of AVI
(Advanced Visual Interfaces) 2004, 23-31.
[59] Holmquist, L., Mattern, F., Schiele, B., Alahuhta, P., Beigl, M., and Gellersen,
H. Smart-Its Friends: A Technique for Users to Easily Establish Connections
between Smart Artefacts. Proceedings of UbiComp 2001, 116-122.
[60] Hourcade, H.P., Bederson, B.B., “Architecture and Implementation of a Java
Package for Multiple Input Devices (MID),” HCIL Tech Report No. 99-08,
1999.
[61] Hsieh, T., Wang, Q., and Paepcke, A. Piles Across Space: Breaking The Real-
Estate Barrier on PDAs. Stanford University Technical Report, 2006.

220
[62] Izadi, S. Brignull, H. Rodden, T. Rogers, Y. Underwood, M. Dynamo: A
public interactive surface supporting the cooperative sharing and exchange of
media. Proceedings of UIST (User Interface Software and Technology) 2003,
159-168.
[63] Johanson, B., Fox, A., and Winograd, T. The Interactive Workspaces Project:
Experience with Ubiquitous Computing Rooms. IEEE Pervasive Computing
1:2 (April – June 2002), 67-75.
[64] Johnson, P. and Arenas, J. Students’ Perceptions of Foreign Language
Communicative Teaching and Class Size. Education Resources Information
Center (ERIC) #ED396560 (http://www.eric.ed.gov)
[65] Joyce, W.B. On the Free-Rider Problem in Cooperative Learning. Journal of
Educational Business. 74(5), 271-274, May-June 1999.
[66] Kerr, Neale and Cobb. (2002). Virtual Environments for Social Skills Training:
The importance of scaffolding in practice. Proceedings of the ACM
SIGACCESS Conference on Assistive Technologies 2002.
[67] Kerr, N., Group Performance and Decision Making, Annual Review of
Psychology, January 2004, Vol. 55, 623-655.
[68] King, A. (1990). Facilitating elaborative learning in the classroom through
reciprocal questioning. American Educational Research Journal, 27, 664–687.
[69] Klemmer, S., Newman, M., Farrell, R., Bilezikjian, M., and Landay, J. The
Designer’s Outpost: A Tangible Interface for Collaborative Web Site Design.
Proceedings of UIST (User Interface Software and Technology) 2001, 1-10.
[70] Klemmer, S., Hartmann, B., and Takayama, L. How Bodies Matter: Five
Themes for Interaction Design. Proceedings of DIS (Designing Interactive
Systems) 2006, to appear.

221
[71] Krueger, M.W., Gionfriddo, T., and Hinrichsen, K. VIDEOPLACE - An
Artificial Reality. Proceedings of CHI (Human Factors in Computing Systems)
1985, 35-40.
[72] Kruger, R., Carpendale, M.S.T., Scott, S.D., and Greenberg, S. How People
User Orientation on Tables: Comprehension, Coordination and
Communication. Proceedings of GROUP 2003, 369-378.
[73] Kruger, R., Carpendale, M.S.T., Scott, S.D., Tang, A. Fluid Integration of
Rotation and Translation. Proceedings of CHI (Human Factors in Computing
Systems) 2005, 601-610.
[74] Kuchinsky, A., Pering, C., Creech, M.L., Freeze, D., Serra, B., and Gwizdka, J.
Fotofile: A Consumer Multimedia Organization and Retrieval System.
Proceedings of CHI (Human Factors in Computing Systems) 1999, 496-503.
[75] Kyffin, S. The LiME Project. Phillips brochure.
http://www.design.philips.com/lime/download/brochure.pdf.
[76] Lave, J. and Wenger, E. Situated Learning: Legitimate Peripheral
Participation. Cambridge University Press, Cambridge, UK, 1991.
[77] Liston, Kathleen, Martin Fischer, and Terry Winograd, Focused Sharing of
Information for Multi-disciplinary Decision Making by Project Teams,
Electronic Journal of Information Technology in Construction, Vol. 6, 69-81,
2001.
[78] MacIntyre, B., Mynatt, E., Voida, S., Hansen, K., Tullio, J., and Corso, G.
Support for Multitasking and Background Awareness Using Interactive
Peripheral Displays. Proceedings of UIST (User Interface Software and
Technology) 2001, 41-50.
[79] Malik, S., Ranjan, A., Balakrishnan, R. Interacting with Large Displays from a
Distance with Vision-Tracked Multi-Finger Gestural Input. Proceedings of
UIST (User Interface Software and Technology) 2005, 43-52.

222
[80] Magerkurth, C., Memisoglu, M., Engelke, T., and Streitz, N. Towards the Next
Generation of Tabletop Gaming Experiences. Proceedings of Graphics
Interface 2004, 73-80.
[81] Mander, R., Salomon, G., and Wong, Y. A ‘Pile’ Metaphor for Supporting
Casual Organization of Information. Proceedings of CHI (Human Factors in
Computing Systems) 1992, 627-634.
[82] Mandryk, R. L., Maranan, D. S., AND Inkpen, K. M. 2002. False Prophets:
Exploring Hybrid Board/Video Games. Proceedings of CHI (Human Factors
in Computing Systems) 2002, 640-641.
[83] Mandviwalla, M. and Olfman, L. What Do Groups Need? A Proposed Set of
Generic Groupware Requirements. Transactions on Computer-Human
Interaction, 1(3), 1994, 245-268.
[84] Matsushita, M., Iida, M., Ohguro, T., Shirai, Y., Kakehi, Y., and Naemura, T.
Lumisight Table: A Face-to-Face Collaboration Support System that
Optimizes Direction of Projected Information to Each Stakeholder.
Proceedings of CSCW (Computer Supported Cooperative Work) 2004, 274-
283.
[85] Maynes-Aminzade, D., Pausch, R., and Seitz, S. Techniques for Interactive
Audience Participation. Proceedings of ICMI 2002 (4th IEEE International
Conference on Multimodal Interfaces), 15 - 20.
[86] McCullagh, P. and Nelder, J.A. Generalized Linear Models. Chapman and
Hall, 2nd edition, 1989.
[87] Morris, M.R. Benefits and Challenges of Tabletop Peripheral Displays.
Proceedings of UbiComp 2004 Extended Abstracts.
[88] Morris, M.R. Visualization for Casual Debugging and System Awareness in a
Ubiquitous Computing Environment. Adjunct Proceedings of UbiComp 2004.

223
[89] Morris, M.R., Forlines, C., Ryall, K., and Shen, C. Conflict Resolution in
Paper and Digital Worlds: Two Surveys of User Expectations. CSCW
(Computer Supported Cooperative Work) 2004 Conference Supplement.
[90] Morris, M.R., Morris, D., and Winograd, T. Individual Audio Channels with
Single Display Groupware: Effects on Communication and Task Strategy.
Proceedings of CSCW (Computer Supported Cooperative Work) 2004, 242-
251.
[91] Morris, M.R., Ryall, K., Shen, C., Forlines, C., and Vernier, F. Beyond "Social
Protocols": Multi-User Coordination Policies for Co-located Groupware.
Proceedings of CSCW (Computer Supported Cooperative Work) 2004, 262-
265.
[92] Morris, M.R. and Winograd, T. Quantifying Collaboration on
Computationally-Enhanced Tables. CSCW (Computer Supported Cooperative
Work) 2004 Workshop on Methodologies for Evaluating Collaboration
Behaviour in Co-Located Environments.
[93] Morris, M.R., Paepcke, A., Winograd, T., and Stamberger, J. TeamTag:
Exploring Centralized versus Replicated Controls for Co-located Tabletop
Groupware. Proceedings of CHI (Human Factors in Computing Systems)
2006.
[94] Morris, M.R., Paepcke, A., and Winograd, T. TeamSearch: Comparing
Techniques for Co-Present Collaborative Search of Digital Media. Proceedings
of the First IEEE International Workshop on Horizontal Interactive Human-
Computer Systems, January 2006, 97 - 104.
[95] Morris, M.R., Piper, A.M., Cassanego, T., and Winograd, T. Supporting
Cooperative Language Learning: Issues in Interface Design for an Interactive
Table. Stanford University Technical Report, 2005.

224
[96] Morris, M.R., Huang, A., Paepcke, A., and Winograd T. Cooperative Gestures:
Multi-User Gestural Interactions for Co-located Groupware. Proceedings of
CHI (Human Factors in Computing Systems) 2006.
[97] Morris, M.R., Piper, A.M., Cassanego, A., Huang, A., Paepcke, A., and
Winograd, T. Mediating Group Dynamics through Tabletop Design. IEEE
Computer Graphics and Applications, to appear.
[98] Müller-Tomfelde, C. and Steiner, S. Audio-Enhanced Collaboration at an
Interactive Electronic Whiteboard. Proceedings of the 2001 International
Conference on Auditory Display, 267-271.
[99] Murray, N., Paton, N., and Goble, C. Kaleidoquery: A Visual Query Language
for Object Databases. Proceedings of AVI (Advanced Visual Interfaces) 1998,
247-257.
[100] Myers, B., Stiel, H., Gargiulo, R. Collaboration Using Multiple PDAs
Connected to a PC. Proceedings of CSCW (Computer Supported Cooperative
Work) 1998, 285-294.
[101] Naaman, M., Harada, S., Wang, Q., Garcia-Molina, H., and Paepcke, A.
Context Data in Geo-Referenced Digital Photo Collections. Proceedings of
ACM Multimedia 2004, 196-203.
[102] Oka, K., Sato, Y., and Koike, H. Real-time tracking of multiple fingertips and
gesture recognition for augmented desk interface systems. IEEE International
Conference on Automatic Face and Gesture Recognition, 2002, 429-434.
[103] Pane, J. and Myers, B. Improving User Performance on Boolean Queries. CHI
(Human Factors in Computing Systems) 2000 Extended Abstracts, 269-270.
[104] Pangaro, G., Maynes-Aminzade, D., and Ishii, H. The Actuated Workbench:
Computer-Controlled Actuation in Tabletop Tangible Interfaces. Proceedings
of UIST (User Interface Software and Technology) 2002, 181-190.

225
[105] Parker, K., Mandryk, R., and Inkpen, K. TractorBeam: Seamless Integration of
Remote and Local Pointing for Tabletop Displays. Proceedings of Graphics
Interface 2005, 33-40.
[106] Piaget, J. (1972). The psychology of the child. New York: Basic Books.
[107] Pierce, J., Stearns, B., and Pausch, R. Voodoo Dolls: Seamless Interaction at
Multiple Scales in Virtual Environments. Proceedings of the 1999 Symposium
on Interactive 3D Graphics, pages 141-145.
[108] Pinelle, D., Gutwin, C., and Greenberg, S. Task Analysis for Groupware
Usability Evaluation: Modeling Shared-Workspace Tasks with the Mechanics
of Collaboration. ACM Transactions on Human Computer Interaction, 10(4),
December 2003, 281-311.
[109] Piper, A.M., O’Brien, E., Morris, M.R., and Winograd, T. SIDES: A
Collaborative Tabletop Computer Game for Social Skills Development.
Stanford University Technical Report, 2005.
[110] Pompei, F.J. The Use of Airborne Ultrasonics for Generating Audible Sound
Beams. Proceedings of the 105th Audio Engineering Society Convention, San
Francisco, CA, 1998.
[111] Poupyrev, I., Billinghurst, M., Weghorst, S., and Ichikawa, T. Go-Go
Interaction Technique: Non-Linear Mapping for Direct Manipulation in VR.
Proceedings of UIST (User Interface Software and Technology) 1996, pages
79-80.
[112] Rekimoto, J. A Multiple Device Approach for Supporting Whiteboard-Based
Interactions. Proceedings of CHI (Human Factors in Computing Systems)
1998, 344-351.
[113] Rekimoto, J. and Saitoh, M. Augmented Surfaces: A Spatially Continuous
Work Space for Hybrid Computing Environments. Proceedings of CHI
(Human Factors in Computing Systems) 1999, 378-385.

226
[114] Rekimoto, J. SmartSkin: An Infrastructure for Freehand Manipulation on
Interactive Surfaces. Proceedings of CHI (Human Factors in Computing
Systems) 2002, 113-120.
[115] Rekimoto, J. SyncTap: Synchronous User Operation for Spontaneous Network
Connection. Personal and Ubiquitous Computing, 8(2), May 2004, 126-134.
[116] Reynolds, M., Schoner, B., Richards, J., Dobson, K., and Gershenfeld, N. An
Immersive, Multi-User, Musical Stage Environment. Proceedings of
SIGGRAPH 2001, 553-560.
[117] Ringel, M., Berg, H., Jin, Y. and Winograd, T. Barehands: Implement-Free
Interaction with a Wall-Mounted Display. CHI (Human Factors in Computing
Systems) 2001 Extended Abstracts, 367-368.
[118] Ringel, M., Ryall, K., Shen, C., Forlines, C., and Vernier, F. Release, Relocate,
Reorient, Resize: Fluid Techniques for Document Sharing on Multi-User
Interactive Tables. Proceedings of CHI (Human Factors in Computing
Systems) 2004 Extended Abstracts, 1441-1444.
[119] Ringel, M. Representing Document Access Permissions on Single Display
Groupware. Unpublished draft (cs448b final proect). 2004.
[120] Rogers, Y., Hazlewood, W., Blevis, E., and Lim, Y. Finger Talk: Collaborative
Decision-Making Using Talk and Fingertip Interaction Around a Tabletop
Display. Proceedings of CHI (Human Factors in Computing Systems) 2004
Extended Abstracts, 1271-1274.
[121] Rogers, Y. and Lindley, S. Collaborating Around Large Interactive Displays:
Which Way is Best to Meet? Interacting with Computers, 2004.
[122] Rogers, Y. and Rodden, T. Configuring Spaces and Surfaces to Support
Collaborative Interactions. In O’Hara, K., Perry, M., Churchill, E., and Russell,
D. (eds.) Public and Situated Displays. Kluwer Publishers (2004), 45-79.
227
[123] Ross, S. Self-Assessment in Second Language Testing: A Meta-Analysis of
Experiential Factors. Language Testing. 15(1), 1-20, March 1998.
[124] Russell, D.M., Drew, C., and Sue, A. Social Aspects of Using Large Public
Interactive Displays for Collaboration. Proceedings of UbiComp 2002. LNCS
2498. 229-236.
[125] Ryall, K., Forlines, C., Shen, C., and Morris, M.R. Exploring the Effects of
Group Size and Table Size on Interactions with Tabletop Shared-Display
Groupware. Proceedings of CSCW (Computer Supported Cooperative Work)
2004, 284-293.
[126] Ryall, K., Esenther, A., Everitt, K., Forlines, C., Morris, M.R., Shen, C.,
Shipman, S. and Vernier, F. iDwidgets: Parameterizing Widgets by User
Identity. Proceedings of Interact 2005, 1124 - 1128.
[127] Ryall, K., Morris, M.R., Everitt, K., Forlines, C., and Shen, C. Experiences
with and Observations of Direct-Touch Tabletops. Proceedings of the First
IEEE Workshop on Horizontal Interactive Human-Computer Systems, January
2006, 89 - 96.
[128] Ryall, K., Morris, M.R., Everitt, K., Esenther, A., Forlines, C., Shen, C.,
Shipman, S., and Vernier, F. Identity-Differentiating Widgets for Multi-User
Interactive Surfaces. IEEE Computer Graphics and Applications, to appear.
[129] Scott, S., Carpendale, S., and Habelski, S. Storage Bins: Mobile Storage for
Collaborative Tabletop Displays. Computer Graphics and Applications,
July/August 2005, 58-65.
[130] Scott, S.D., Mandryk, R., and Inkpen, K. (2003) Understanding Children’s
Collaborative Interactions in Shared Environments. Journal of Computer-
Aided Learning, 19(2), 220-228.

228
[131] Scott, S.D., Grant, K., and Mandryk, R. System Guidelines for Co-located
Collaborative Work on a Tabletop Display. Proceedings of ECSCW 2003, 159-
178.
[132] Scott, S.D., Carpendale, M.S.T., and Inkpen, K. Territoriality in Collaborative
Tabletop Workspaces. Proceedings of CSCW (Computer Supported
Cooperative Work) 2004, 294-303.
[133] Searle, J.R. Collective intentions and actions. In P. R. Cohen, J. Morgan, and
M. E. Pollack, editors, Intentions in Communication, chapter 19, pages 401-
416. MIT Press, Camridge, MA, 1990.
[134] Shen, C., Lesh, N., Forlines, C., and Vernier, F. Sharing and Building Digital
Group Histories. Proceedings of CSCW (Computer Supported Cooperative
Work) 2002, 324-333.
[135] Shen, C., Everitt, K.M., Ryall, K. UbiTable: Impromptu Face-to-Face
Collaboration on Horizontal Interactive Surfaces. Proceedings of UbiComp
2003, 281-288.
[136] Shen, C., Vernier, F., Forlines, C., and Ringel, M. DiamondSpin: An
Extensible Toolkit for Around-the-Table Interaction. Proceedings of CHI
(Human Factors in Computing Systems) 2004, 167-174.
[137] Shen, C., Hancock, M., and Vernier, F. CoR²Ds: Context-Rooted Rotatable
Draggables. Proceedings of CHI (Human Factors in Computing Systems) 2005
Extended Abstracts, 1781-1784.
[138] Shen, H. and Dewan, P. Access Control for Collaborative Environments.
Proceedings of CSCW (Computer Supported Cooperative Work) 1992, 51-58.
[139] Shin, D., and Nori, R. CBM: A Visual Query Interface Model Based on
Annotated Cartoon Diagrams. Proceedings of AVI (Advanced Visual
Interfaces) 2000, 242-245.
229
[140] Shneiderman, B. and Kang, H. Direct Annotation: A Drag-and-Drop Strategy
for Labeling Photos. International Conference on Information Visualization,
May 2000.
[141] Shoemaker, G. and Inkpen, K. Single Display Privacyware: Augmenting
Public Displays with Private Information. Proceedings of CHI (Human
Factors in Computing Systems) 2001, 522-529.
[142] Sluis, R., Weevers, I., van Schijndel, C., Kolos-Mazuryk, L., Fitrianie, S., and
Martens, J. Read-It: Five-to-Seven-Year-Old Children Learn to Read in a
Tabletop Environment. Proceedings of Interaction Design and Children 2004,
73-80.
[143] Smith, I. and Hudson, S. Low Disturbance Audio for Awareness and Privacy
in Media Space Applications. Proceedings of ACM Multimedia 1995, 91-97.
[144] Smith, R., Hixon, R., and Horan, B. Supporting Flexible Roles in a Shared
Space. Proceedings of CSCW (Computer Supported Cooperative Work) 1998,
197-206.
[145] SMMARTTech, “Digital Vision Touch Technology,” White Paper,
http://www.smarttech.com/dvit/. 2003.
[146] Sommer, R. Personal Space: The Behaviour Basis of Design. Prentice-Hall,
Englewood Cliffs, N.J. 1969.
[147] Stefik, M., Bobrow, D.G., Foster, G., Lanning, S., and Tatar, D. WYSIWIS
Revised: Early Experiences with Multiuser Interfaces. ACM Transactions on
Office Information Systems, 5(2), April 1987, 147-167.
[148] Stefik, M., Foster, G., Bobrow, D.G., Kahn, K., Lanning, S., Suchman, L.
“Beyond the Chalkboard: Computer Support for Collaboration and Problem
Solving in Meetings”, Communications of the ACM, 30(1), 32-47.
230
[149] Steiner, I. (1972). Group Process and Productivity, New York, NY: Academic
Press.
[150] Stewart, J., Bederson, B., and Druin, A. Single Display Groupware: A Model
for Co-present Collaboration. Proceedings of CHI (Human Factors in
Computing Systems) 1999, 286-293.
[151] Streitz, N.A. et al. i-Land: An Interactive Landscape for Creativity and
Innovation. Proceedings of CHI (Human Factors in Computing Systems) 1999,
120-127.
[152] Streitz, N.A., Tandler, P., Müller-Tomfelde, C., and Konomi, S. Roomware.
Towards the Next Generation of Human-Computer Interaction based on an
Integrated Design of Real and Virtual Worlds. In: J. A. Carroll (Ed.): Human-
Computer Interaction in the New Millennium, Addison Wesley (2001), 553-
578.
[153] Sugimoto, M. and Hosoi, K. Caretta: A System for Supporting Face-to-Face
Collaboration by Integrating Personal and Shared Spaces. Proceedings of CHI
(Human Factors in Computing Systems) 2004, 41-48.
[154] Tan, D. and Czerwinski, M. Information Voyeurism: Social Impact of
Physically Large Displays on Information Privacy. Proceedings of CHI
(Human Factors in Computing Systems) 2003 Extended Abstracts, 748-749.
[155] Tan, D., Gergle, D., Scupelli, P., and Pausch, R. With Similar Visual Angles,
Larger Displays Improve Spatial Performance. Proceedings of CHI (Human
Factors in Computing Systems) 2003, 217-224.
[156] Tan, D., Stefanucci, J., Proffitt, D., and Pausch, R. The Infocockpit: Providing
Location and Place to Aid Human Memory. Workshop on Perceptive User
Interfaces 2001, Orlando, FL.
[157] Tanaka, J. The Perfect Search. Newsweek, 134(13), September 27, 1999, p. 71.

231
[158] Tandler, P. et al. ConnecTables: Dynamic Coupling of Displays for the
Flexible Creation of Shared Workspaces. Proceedings of UIST (User Interface
Software and Technology) 2001, 11-19.
[159] Tang, J.C. Findings from Observational Studies of Collaborative Work.
International Journal of Man-Machine Studies, 34, 143-160.
[160] Team Asperger. (2004). Gaining Face: Facial recognition software.
http://ccoder.com/GainingFace/
[161] Thompson, J.J. Beyond Words: nonverbal communication in the classroom.
New York: Citation Press, 1973.
[162] Tse, E. and Greenberg, S. “SDGToolkit: A Toolkit for Rapidly Prototyping
Single Display Groupware.” Poster session. CSCW (Computer Supported
Cooperative Work) 2002.
[163] Twidale, M. and Nichols, D. Designing Interfaces to Support Collaboration in
Information Retrieval. Interacting with Computers, 10(2), 1998, 177-93.
[164] UbiComp 2002 Workshop on Collaboration with Interactive Walls and Tables.
2002.
[165] Ullmer, B. and Ishii, H. The metaDESK: Models and Prototypes for Tangible
User Interfaces. Proceedings of UIST (User Interface Software and
Technology) 1997, 223-232.
[166] Ullmer, B., Ishii, H., and Jacob, R. Tangible Query Interfaces: Physically
Constrained Tokens for Manipulating Database Queries. Proceedings of
Interact 2003, 279-286.
[167] Ulyate, R. and Bianciardi, D. The Interactive Dance Club: Avoiding Chaos in a
Multi Participant Environment. CHI (Human Factors in Computing Systems)
2001 Workshop on New Interfaces for Musical Expression.
232
[168] Vernier, F. et al. Visualization Techniques for Circular Tabletop Interfaces.
Proceedings of AVI (Advanced Visual Interfaces) 2002, 257-266.
[169] Vogel, D. and Balakrishnan, R. Interactive Public Ambient Displays:
Transitioning from Implicit to Explicit, Public to Personal, Interaction with
Multiple Users. Proceedings of UIST (User Interface Software and
Technology) 2004.
[170] Vygotsky, L.S. (1978). Mind in Society: The development of higher
psychological processes. Cambridge, MA: Harvard University Press.
[171] Wang, Q., Hsieh, T., Morris, M.R., and Paepcke, A. Multi-User Piles Across
Space. CHI (Human Factors in Computing Systems) 2006 alt.chi presentation.
[172] Webb, N.M. Peer Interaction and Learning in Peer-Directed Groups. Theory
Into Practice, 24, 32-39.
[173] Weiser, M. The Computer for the 21st Century. Scientific American,
265(30):94-104, September, 1991.
[174] Weiser, M. and Brown, J.S. The Coming of Age of Calm Technology, October
1996. http://nano.xerox.com/hypertext/weiser/acmfuture2endnote.htm.
[175] Wellner, P. The DigitalDesk Calculator: Tangible Manipulation on a Desk Top
Display. Proceedings of UIST (User Interface Software and Technology) 1991,
27-34.
[176] Wellner, P. Interacting with Paper on the Digitaldesk. Communications of the
ACM, July 1993, 36(7).
[177] Whalen, Tara. Playing Well with Others: Applying Board Game Design to
Tabletop Display Interfaces. UIST (User Interface Software and Technology)
2003 supplement, Poster Abstract.

233
[178] Wigdor, D. and Balakrishnan, R. Empirical Investigation into the Effect of
Orientation on Text Readability in Tabletop Displays. Proceedings of ECSCW
2005, 205-224.
[179] Wilson, A. PlayAnywhere: A Compact Interactive Tabletop Projection-Vision
System. Proceedings of UIST (User Interface Software and Technology) 2005,
83-92.
[180] Wolf, C. and Rhyne, J. Gesturing with Shared Drawing Tools. CHI (Human
Factors in Computing Systems) 1993 Extended Abstracts, 137-138.
[181] Wu, Michael and Balakrishnan, Ravin. Multi-Finger and Whole Hand Gestural
Interaction Techniques for Multi-User Tabletop Displays. Proceedings of UIST
(User Interface Software and Technology) 2003, 193-202.
[182] Wu, M., Shen, C., Ryall, K., Forlines, C., and Balakrishnan, R. Gesture
Registration, Relaxation, and Reuse for Multi-Point Direct-Touch Surfaces.
Proceedings of IEEE TableTop 2006, 183-190.
[183] Zanella, A. and Greenberg, S. A Single Display Groupware Widget Set.
Western Computer Graphics Symposium 2000.