supported transition metal catalysts for para- …hho4free.com/documents/nasa_ortho-to...
TRANSCRIPT
NASA-CR-197907
NASA GRANT FINAL REPORTf-
SUPPORTED TRANSITION METALCATALYSTS FOR PARA- TO ORTHO-
HYDROGEN CONVERSION
Christopher J. Brooks, Wei Wang and Darrell P. Eyman
University of Iowa
Department of ChemistryIowa City, Iowa 52242
May 1994
Prepared forLewis Research CenterUnder Grant NAG 3-893
(NASA-CR-197907) SUPPORTED
TRANSITION METAL CATALYSTS FOR
PARA- T_ ORTHO-HYDROGEN CONVERSION
Fina! Report (Iowa Univ.) 106 p
N95-23252
Unclas
G3/25 0043495
TABLE OF CONTENTS
2
I°
II°
III.
Introduction .................................................. 6
A. Ortho- and Para-Hydrogen Theory ............................... 6
B. Theory of Ortho- and Para- Hydrogen Catalysis ..................... 8
C. History of Ortho- to Para-Hydrogen Catalysts ...................... 11
1. Rare Earth Oxide Catalysts .................................. 11
2. Transition Metal Catalysts .................................. 12
D. Reactor Systems ............................................ 141. Reactor Tube Evolution .................................... 17
a. Reactor Assembly 1; Without Thermocouple ................... 17
b. Reactor Assembly 2; Bent Thermocouple ..................... 18
c. Reactor Assembly 3; Straight Thermocouple ................... 19
d. Reactor Assembly 4; 2 Thermocouples ....................... 19
E. Description of Testing Procedure and Definition of Reactivity ............ 20
Metal Silicates ............................................... 23
A. Preparation ............................................... 231. Iron Silicates ........................................... 23
2. Chromium Silicates ....................................... 23
3. Manganese Silicates ....................................... 244. Nickel Silicates .......................................... 24
5. Metal/Metal Silicates ...................................... 25
B. Catalytic Testing ........................................... 25
1. Activity of Air Products Nickel Silicate ......................... 25
a. Activation Time and Temperature .......................... 25
b. Activating Gas or Vacuum ............................... 26
c. Effect of H 2 Flowrate ................................... 27
d. Activity of Enhanced Air Products Nickel Silicate ............... 28
2. Synthesized Metal Silicates ................................. 28
a. Iron, Manganese, and Chromium Silicate ..................... 28
b. Synthesized Nickel Silicates .............................. 29
c. Impregnated Metal Silicates ............................. 30
C. Characterization by N2 Condensation/Adsorption ..................... 30D. Conclusions for Metal Silicates ................................. 32
Ruthenium Catalysts ........................................... 34
A. Preparation ............................................... 34
1. Traditional Ruthenium Catalysts .............................. 34
2. Ruthenium Ammine Precursor Catalysts .......... , ............... 35

III.
IV.
3
3. (lq4--cyclohexa-l,3--diene)(rl6-benzene)Ruthenium (0) Precursor Catalysts 36
B. Catalytic Testing ........................................... 36
1. Activity of Traditional Ruthenium Catalysts ...................... 36
a. Activation Conditions: Time, Temperature, Gas, and Pressure ....... 36b. Effect of Percent Metal Content ............................ 38
c. Effect of Metal Precursor ................................ 39
d. Effect of Platinum Metal Addition .......................... 40
e. Effect of Catalyst Preparation Method ....................... 40
2. Ruthenium Ammine Precursor Catalysts ......................... 41a. Activation Conditions ................................... 41
b. General Procedures ..................................... 42
c. Effect of Metal Content ................................. 42
d. Effects of Precursor Metal and Preparation Method .............. 43
3. (rl4--cyclohexa-l,3--diene)(rl6-benzene) Ruthenium (0) Precursor Catalysts 44
C. Characterization of Ruthenium and Ruthenium Ammine Precursor Catalysts .. 45
1. H 2 Adsorption ........................................... 45
2. Low Temperature Susceptibility .............................. 48
3. X-ray Diffraction ........................................ 50
D. Discussion and Conclusions of Ruthenium Catalysts .................. 52
1. Hypothesis for Activity > -196 °C ............................. 52
2. Hypothesis for He Effect Activity ............................. 53
3. Conclusions for Ruthenium Catalysts ........................... 55
4. Conclusion for Physical Characterization ........................ 57
Conclusion .................................................. 59
References .................................................. 104

LIST OF TABLES
4
Table
Table
Table
Table
Table
Table
Table
Table
Table
Table
Table
Table
Table
Table
Table
Table
Table
Table
Table
Table
Table
Table
1. Impregnation of Air Products by Fe(NO3) 3 ......................... 65
2. Impregnation of FefNO3)3 on CB-I-9M ........................... 65
3. Activity of Air Products Nickel Silicate ........................... 66
4. Activity of Enhanced Air Products ............................... 66
5. Iron, Chromium and Manganese Silicates .......................... 66
6. Activity of Nickel Silicates .................................... 67
7. Activity for Fe (Cr) Impregnated on Air Products .................... 67
8. Activity of Fe Impregnated on CB-I-10M ......................... 68
9. Surface Area and Pore Volume Measurements for Selected Metal Silicate
Catalysts ................................................. 68
10. Activity of CB-II-20; 8.04% Ru/SiO2 RuC13 Precursor ................ 69
11. Activity of CB-II-72 ........................................ 70
12. Activity of Catalyst prepared with RuC13 Precursor ................... 71
13. Activity of Ru/SiO2; Ru(NO)CI 3 Precursor .......................... 72
14. Activity of Ru/SiO2; Ru(NO)(NO3)3 Precursor ....................... 73
15. Activity of 8% Ru/SiO2 with Pt Co-catalyst ......................... 73
16. Activity of Catalysts Prepared by Alternative Methods ................. 74
17 Activity of Ru Ammine Catalysts; Ru(NO)(NO3)3 Precursor ............. 74
18. Activity of Chloride Containing Ruthenium Precursor-Activity of
Alternative Catalyst Preparations ................................ 75
19. Results of (ri4-cyclohexa-l,3-diene)(rlt-benzene) Ruthenium Precursor
Catalysts .............................................. 75
20. Dispersion of Ruthenium Ammine Precursor Catalysts Prepared with
Ru(NO)(NO3) 3 ............................................. 76
21. Dispersion of Ammine Precursor Catalyst Prepared by AlternativeProcedures ................................................ 76
22. Dispersions of Selected Traditional Ruthenium Catalysts ................ 76
Figure 1.Figure 2.
Figure 3.Figure 4.
Figure 5.Figure 6.Figure 7.Figure 8.Figure 9.Figure 10.Figure 11.
Figure 12.Figure 13.
Figure 14.Figure 15.Figure 16.Figure 17.Figure 18.
Figure 19.
Figure 20.
Figure 21.
Figure 22.
Figure 23.
Figure 24.
Figure 25.
Figure 26.
Figure 27.
Figure 28.
5
LIST OF FIGURES
Schematic of the Degeneracy of the Two Forms of Hydrogen ......... 77
Equilibrium Composition of ortho- and para-Hydrogen vs.
Temperature ........................................... 78
Thermal Conductivity of 1-12vs. Temperature. (,, = ortho- • = para-) .. 79
Simplified Schematic for Detection of ortho- and para- H 2
Compositions ............................................ 79
Reactor Schematic for Catalytic Conversion of ortho- to para-H 2 ...... 80
Reactor Tube Assembly 1; Without Thermocouple ................. 81
Reactor Assembly 2; Bent Thermocouple ........................ 82
Reactor Tube Assembly 3; Straight Thermocouple ................. 83
Reactor Tube Assembly 4; 2 Thermocouples ..................... 84
Activity of Air Products vs. Temperature ........................ 85
Activity of Ruthenium Catalysts at -158 °C as a Function of RuPrecursor .............................................. 86
Effect of Ruthenium Precursor on "He Effect" Activity at -196 °C ...... 87
Activity of Ruthenium Ammine Catalysts; Ru(NO)(NO3)3 Precursor as a
Function of % Ru Loading .................................. 88
"He Effect" I_ values vs. Surface Ru Atoms/Gram Catalyst ............ 89
Magnetic Susceptibility of Activated Air Products vs. Temperature ...... 90
Inverse Susceptibility vs. Temperature .......................... 91
Magnetic Susceptibility of CB-II-24 vs. Temperature; No Activation .... 92
Magnetic Susceptibility of CB-II-24 vs. Temperature; Reduced in H2 at350 °C ................................................ 93
Magnetic Susceptibility of BF-40C1 vs. Temperature; Reduced in H 2 at350 °C ................................................ 94
Magnetic Susceptibility of WW-17 vs. Temperature; No Activation ..... 95XRD of Ruthenium Metal .................................. 96
XRD of RuO2 ........................................... 97
XRD of RuCla .......................................... 98
XRD of CB-II-46; 16% Ruthenium on Silica .................... 99
XRD of CB-II-48; 8% Ruthenium on Silica ..................... 100
XRD of CB-II-48W; Hot Water Wash ......................... 101
Physical Process for ortho- to para-I-l_ Conversion ................ 102
Schematic of Proposed Surface Following H 2 Activation and He Purge ... 103

I. INTRODUCTION
6
A. Ortho-and Para-Hydrogen Theory
Molecular hydrogen can exist in two distinct forms; ortho-H2 and para-H 2. The
difference between these two forms is that they possess different nuclear spins. Ortho-I-I 2
has the nuclear spins of the two hydrogen atom protons aligned in the same direction, or spin
unpaired. This results in total spin having values of +1, 0, and -1. However, for para-H 2,
the nuclear spins of the two protons are in the opposite direction, or spin paired) and the total
spin equals zero.
The composition of the two forms of hydrogen is dependent upon temperature. At
high temperature, > -50 °C, the composition is approximately 75% ortho-H 2 and 25%
para-H 2. At high temperatures, the distribution is determined by the spin degeneracy and
can be calculated by the formula 2S +1. For ortho-H 2, (S = 1 ), there is a three-fold
degeneracy, while para-H 2 (S = 0) has only a one-fold degeneracy. This degeneracy is
portrayed in Figure 1, with _ indicating spin = 1/'2 and [3 indicating spin = -1/2. There are
three degenerate forms of ortho-H 2 which lead to a total spin of one, while there is only one
degenerate form of para-H2 with a total spin of zero.
composition which is referred to as normal hydrogen.
This three to one ratio leads to the
However, if hydrogen gas at room
temperature is cooled to the normal boiling point of hydrogen, there is a conversion of the
ortho-H 2 to para-H 2 as the temperature is decreased. In fact, the equilibrium composition of
liquid hydrogen is made up almost entirely of the para-H 2 form (99.79%). The equilibrium
composition of hydrogen between the two above described extremes is a function of
temperature.This is shownin Figure 2.1' 2 This total distribution can be calculated by the
summation of the partition function of the nuclear spin rotational energy levels as shown in
the equation below. Summation of all even J values refers to distribution of para-H 2, while
the summation of the odd J values refers to the distribution of ortho-H2 .3
7
Z_r = _evemJ (2J + 1)e -JO+l)sS"3rr+ 3 EoddJ(2J + 1)e -lO+l)sS'3rr
The range of this catalytic study was from approximately -125°C to the liquid nitrogen
temperature composition of 50% ortho- 50% para-H 2 at -196 °C. This range is displayed
in the box in Figure 2.
Although the conversion of ortho- to para-H 2 is a thermodynamically favored
process, it is also a very slow one. In fact, if normal hydrogen is liquefied, the resulting
liquid has practically the room temperature composition. Over time, this mixture will convert
to the thermodynamically favored product, para-H 2. Therefore, to interconvert between the
two forms of hydrogen with any appreciable rate, a catalyst must be employed.
The question may be asked why there is a need to study the catalytic conversion of
ortho- to para-I-I_. To answer this, one must f'u'st understand a little more about the
reactions involved. The conversion of ortho- to para-H z is exothermic. In fact, the heat of
conversion (0.338 kcal/mol) is over 1.5 times greater than the latent heat of vaporization
(0.213 kcal/mol). 1 As stated before, following the liquefaction of hydrogen, the liquid
hydrogen would have a composition of nearly 75% ortho-H 2. Since the heat of conversion is
greater than the heat of vaporization, there would be considerable loss of H2 due to boil-off

8
asthe ortho-I-I 2 slowly converts to para-H2 in the storage vessel. This occurrence can be
reduced if a catalyst is used to convert the ortho- to para-H 2 while cooling in the gas phase.
This will help to dissipate the heat of conversion before the ortho-I-I 2 converts to para-H 2 in
the liquid phase.
Liquid H 2, which is almost entirely para-H 2 at equilibrium, is considered by many as
fuel for hypersonic flight, mainly because of its high energy density. Since the conversion of
ortho-H 2 to para-H 2 is reversible, the corresponding reverse reaction, para- to ortho-H2 is
endothermic. This endothermic reaction can provide a heat sink, which can be utilized to
cool the various parts of the aircraft. However, this endothermic conversion proceeds far too
slowly for practical use. The use of a catalyst speeds up the rate of this endothermic reaction.
Therefore, it is a combination of both the slow inherent rate of the reaction along with the
high heat of conversion that make the interconversion of ortho- and para- H 2 an interesting
process to study.
B. Theory of Ortho- and Para- Hydrogen Catalysis
It was reported in 1933 by Farkus and Sachsse that para-hydrogen was converted
rapidly at room temperature to normal hydrogen (75 % ortho-H 2 and 25 % para-Hz) in the
presence of paramagnetic molecules in the gas phase or paramagnetic ions in solution. The
conversion was also reported to be second order in nature. 4 In that same year, Wigner
derived an equation to explain the relationship between the rate of ortho- and para-H 2
interconversion and the magnetic moments of pararnagnetic species and the magnetic moment
of the proton, along with the distance from the paramagnetic center to the proton. 5 This
relationship is shown in the following equation:

Rate ]LI2(M) ]LI2(H2)
r 8
9
where _ (M) and p (1-12) are the magnetic moments for the paramagnetic species and the
proton, respectively. The distance between the paramagnetic center and the hydrogen is
defined by r.
A further analysis was done in 1973 by Petzinger and Scalapino 6 and more recently by
Coffman. 7 Their studies once again derived the equations which explain the rate in which
ortho- and para-H 2 interconvert. The results were very similar to the initial study by
Wigner. It was concluded that the rate was proportional to the magnetic moments of the
hydrogen and the paramagnetic center divided by the distance of the hydrogen to the
paramagnetic center. However, the distance was to the sixth power as opposed to distance
being to the eighth power as proposed by Wigner. This relationship is presented in the
following equation:
Rate _.I2(M) _12(H9
r 6
This equation is of importance in understanding the studies reported here. It helps to
describe ways in which the properties of a catalyst can be altered in the hopes of improving
the rate of ortho- to para-H2 catalysis. It states that increasing the magnetic moment of the
10
catalyst active metal will increase the rate exponentially. Also, and more importantly, by
decreasing the distance between the reactant H 2 and the surface, an increase in activity should
be seen that grows exponentially by a power of six. These are the two areas in which the
efforts were directed during the synthesizing of catalysts.
Another theory was presented in 1983 by Stevenson on the mechanism of ortho- and
para-H 2 interconversion by diamagnetic substances. 8 It was stated that any local magnetic or
electrical field would enhance ortho- to para-H 2 conversion. Work by Van Cauwelaert and
Hall support this theory as they studied the conversion of para-H 2 over alumina. 9 Their
study completely eliminated the possibility of the reaction being caused by paramagnetic
centers. They felt the magnetic moment of the exposed 27A1 nuclei was partially responsible
for the conversion. The authors also noted that the addition of transition metals with
paramagnetic properties will cause more intense magnetic centers and increased rates.
It was stated earlier by Farkus that the conversion of para-H 2 to normal H 2 by gas or
solution phase paramagnetic species at room temperature was second-order in nature. It has
been further shown that the order of the reaction is dependent upon the reaction conditions.
In the absence of a catalyst, the ortho- to para-H 2 conversion is a second-order reaction. _°
However, in the presence of a catalyst, the reaction approaches first-order for a gas phase
reaction, n This reaction is the one that is presently under investigation. However, if a
catalyst is added to liquid phase hydrogen, the reaction is considered to be zero-order in
nature, m
C. History of Ortho- to Para-Hydrogen Catalysts
11
1. Rare Earth Oxide Catalysts
The history of ortho- and para-hydrogen catalysts date back to the initial studies by
Farkus in 1933. However, the majority of the work to date has been attempts to understand
the theory and/or the mechanism of ortho- and para- hydrogen interconversion as opposed
to developing catalysts with high activities which could be scaled up for industrial use.
Selwood did extensive research into the conversion rate of ortho- and para-hydrogen
over the rare earth oxides europia (EuO) and lutetia (Lu203), and ytterbia (Yb203) along with
the other oxides ytlria (Y203) and chromia (Cr203). In the case of yttfia and lutetia, the rate
of reaction was reported to be dependent upon the temperature of pretreatment of the oxide. _2
As the temperature of pretreatment in H 2 gas increased, so did the liberation of water
molecules and the activity. This was believed to be caused by reduction of the metal oxide to
form a pararnagnetic site. This process then liberated the water. In the work with europia
and chromia, conversion was determined at temperatures between 65 K and 187 K. It was of
interest to determine whether the rate of conversion changes as the temperature of conversion
is passed through the Curie temperatures. These are the temperatures where the transition of
ferromagnetic EuO or antiferromagnetic o_-Cr203 to the paramagnetic version of both species
was expected. What was found was little change in the rates at those temperature.
Further study on para-H 2 conversion over neodymium and dysposium oxides was
conducted by Eley. _3 Their results were similar to those of Selwood as activity increased with
the increased temperature of outgassing. The increase in activity was believed to be caused
by loss of oxygen during outgassing. Electron transfer would affect the surface paramagnetic

12
moments by generating cations with valence less than three.
Selwood also studied the effect of an extrinsic magnetic field on the para-H 2
conversion rate on rare earth oxides, t4 His studies concluded that the rate of para-H 2
conversion could be increased or decreased by an extrinsic field, and was dependent upon the
metal and the corresponding intrinsic paramagnetic field. His conclusions were that one
could perturb an intrinsic field with an extrinsic magnetic field.
When comparing the rates of the above mentioned catalysts with those presented in
our work, comparisons are difficult as the rate constants for different catalysts were often
calculated differently by each researcher. However, an estimate of the differences among
some selected catalysts will be made. For the Yb203 catalyst prepared by Selwood, the best
rate constant for this catalyst was reported to be 14.2 lamol s-1 m -_. This was calculated for
the conversion of para-H 2 to ortho-I-I 2 at room temperature. Selwood also tested a Gd203
catalyst during his study of the effects of an extrinsic magnetic field. He measured a rate
constant between 170 and 350 lamol s-1 rn -2 when converting para-H 2 to ortho-H 2 as above.
This activity was without the external magnetic field. However, when calculating a rate
constant for CB-U-88, a ruthenium catalyst having excellent activity, the rate constant was
estimated to be approximately 106,000 lamol s-_ m -2. This value was calculated using a
measured activity and the ruthenium surface area using measured active gas adsorption. From
this it is easy to see that catalysts prepared in this work have greater activity then catalysts
prepared by Selwood.
2. Transition Metal Catalysts
Transition metals were evaluated as catalysts for the interconversion of ortho- and

13
para-hydrogen. In 1975, Rudham reported para-hydrogen conversion using catalysts
prepared by exchanging low concentrations of Mn, Co, Ni, Cu, Zn, and Pd onto an X-zeolite
support. _5 It was observed that the rate increased relative to that of the support itself for all
metals studied except Zn. However for Pd, the activity was not as great as that of the other
active metals.
In 1968, Singleton and coworkers at Air Products and Chemicals, Inc. completed a
study in which they developed a rate model for the ortho- and para-H 2 interconversion. _6
Their study reported the effects of temperature and concentration gradients within a catalyst
particle as well as the effects of other process parameters. This study was done using a
highly active catalyst reported to be a nickel silicate supplied by Air Products.
Barrick and coworkers studied the conversion of ortho- to para- at -196 °C over
iron oxide gel catalysts. Their study was to find improvements for both preparation and
activation of the catalysts. _7 They reported several results which were of interest for our
study. The preparation techniques and the purity of reagents were highly important.
Catalytic activity varied due to how rigorously a catalyst was washed following preparation,
and how pure the FeC13 precursor was prior to catalyst preparation. It was also reported that
activity was dependent upon the activation conditions. Catalysts had better activities when
activated at higher temperatures and for shorter times. Also, it was reported that the purity of
reactant hydrogen was important to obtain consistent results.
The most comprehensive study to date was by Haley and Hinden for Englehard
Industries in 1965. t8 Their study consisted of testing the Groups Villa and IB metals in
various forms for ortho- to para- conversion at -196 °C. They tested a variety of different

14
catalystswhich showeda wide rangeof activities. When testinga finely divided metal or
finely divided metal alloy asa catalyst,it wasfound thatrutheniumor alloys containing
rutheniumdisplayedthe bestactivity. When the GroupVIIIA and IB metalswere supported
on alumina,the rutheniumandnickel supportedcatalystswere the only oneswith at least
moderateactivity. When the supportwaschangedto activatedcarbonor silica, ruthenium
wasagainfound to be the bestmetalcomparedto the othersmentioned. It wasalsofound
that 10%rutheniumsupportedon silica wasmoreactive than thecorresponding30%
rutheniumon silica catalyst.
From the abovereferencedliterature,the metalsiron, nickel andrutheniumaswell as
the lanthanidesshowedpromiseascatalystsfor ortho- to para-H 2 conversion. However,
any metal which has paramagnetic properties should be considered as a candidate if a catalyst
with suitable surface properties can be prepared.
D. Reactor System
The reactor designed to test the conversion of ortho- to para-I-I 2 is a standard
plug-flow reactor operating under integral conditions. 19 A reactor of similar design is
discussed by Haley and Hindin in the Engelhard Technical ReportJ 7 The following is a
discussion of the theory behind ortho- and para-H 2 detection as well as modifications made
to the previously referenced reactor design.
The method of analyzing gas mixtures dependent upon thermal conductivities is a
highly developed technique. 2° Since, as shown in Figure 3, the thermal conductivities of
ortho- and para-I-I2 differ to about 400 °C, one can take advantage of this using a thermal
conductivity detector (TCD). 2_ The TCD filaments are aligned to form the four arms of a

15
Wheatstonebridge. Thesef'damentsaredivided into two pairs, with each pair having
matched resistance. Each filament is in a cavity for separate gas flow. Reference normal H a
(75% ortho, 25% para ) is passed across one pair at 150 mL/min and the test H_ is passed at
a matched flow rate across the other pair. At a total bridge current of 175 milliamp the
bridge imbalance is measured as a miUivolt (mV) potential across a 10K t2 resistor. If the
test flow is Normal H 2, there is no bridge imbalance. If the test flow contains excess
para-H 2, one gets a positive mV response. Any other contaminant (N2, He, H20, etc.) will
give a negative mV response. Figure 3 also shows that since the thermal conductivity
difference decreases with increasing temperature, the measurement should be at the lowest
stable temperature allowed by the bridge. Following a 1/2 hour (h) warm-up period in
which the bridge is energized, this temperature was determined to be approximately 40 °C. A
simplified detector schematic is shown in Figure 4.
The bridge was calibrated quantitatively using the following procedure. Air Products
nickel silicate was placed in two separate reactors that were in series with each other. Each
reactor contained approximately a ten fold excess of the amount of catalyst needed to convert
to the equilibrium composition at -196 °C. At that temperature, the 25% excess of para-I-I 2
in the test stream leads to a bridge imbalance measured as 2.48 mV. Assuming the response
is linear, one can conclude that for each percent of excess para-H2, a 0.099 mV response is
measured. For example, a measured response of 1.23 mV would lead to the calculation of an
ortho- and para- composition of 62.6% and 37.4%, respectively.
A more detailed reactor schematic is illustrated in Figure 5. It consists of 2 separate
reactor tube assemblies which are described in more detail later. These reactor assemblies
16
can be heated up to 600 °C using column mantles (Glass-Col), or cooled in a Dewar flask of
liquid nitrogen or other low temperature slurries for catalytic testing. Temperature is
controlled to ±1 °C in the heating cycle by a Type K thermocouple temperature controller
(Omega).
All components are constructed of 303 or 316 stainless steel (Valves and tube fittings;
Swagelok Co.; Tubing; Alltech Inc.). Pressure gauges arc constructed of 316 stainless steel
inner components, (Ashcroft) while flowmeters are 130 mm Pyrex glass tubes with stainless
steel or glass floats (Cole-Parmer).
For activation of a catalyst, one can chose either He (Air Products High Pressure;
99.995% pure) or H 2 (Air Products UPC grade; 99.999% pure) gases, along with the choice
of compressed air or vacuum. During activation, these gases are passed across the catalyst
bed at a flow rate of 50-100 mL/min and vented to a hood.
For testing of a catalyst, UPC 1-I2was split into two streams. A portion is used as the
TCD reference flow as described earlier and the remainder is measured by a mass flow
controller (Brooks Instrument Co.) calibrated at 0-30 L/min at 250 psig. Following the mass
flow controller, the H 2 is passed across the catalyst bed. The pressure gauges are positioned
to allow measurement of the inlet and outlet pressure. These values can be used to calculate
a corresponding pressure drop across the catalyst bed. Following the catalyst bed, the total
pressure of the catalyzed H 2 was regulated down to 60 psig. This allows easier control of the
total flow rate by the two regulating valves. A portion of this test stream (134 mI./min) is
matched with the reference flow across the TCD, while the remainder is vented through a
flowmeter to the hood. It should be noted that the combined flows of the vent and TCD
17
should equal the flow rate measured by the mass flow controller.
1. Reactor Tube Evolution
a. Reactor Assembly 1; No Thermocouple
The initial reactor tube assembly can be seen in Figure 6. This reactor assembly
consists of a 3 foot length of 1/8" stainless steel tubing which has been wound into a coil
with a 4 inch diameter. This serves as a pre--cooler to ensure the 1-I2 is cooled to the reaction
temperature before contact with the catalyst. Following the pre--cooler, the catalyst bed is a
1/4" outer diameter (OD) straight stainless steel tube, 4 inches long. The catalyst was held in
place by stainless steel screens (80 mesh; Alltech) between 2 Swagelok unions. Following
the second screen, the H_ flows directly to the detector. This reactor tube assembly is
attached to the system through the use of Swagelok Quik-Connects, which allow easy
removal and installation of the reactor, without contact with the air.
The reactor tube was later changed from the 1/4" OD tube as described above to a
1/8" OD tube. This dropped the inner diameter from 0.21" to 0.0821" or less than half the
original diameter. This was needed for the following reasons. First, with the flow rates
obtainable on this reactor, it was necessary to have catalyst samples of 100 mg or less. With
this small amount of sample, it was felt that the catalyst bed was too shallow and there was a
greater chance that a portion of the H 2 would not come in contact with the catalyst at all.
This condition is known as reactant blow-by. With a 1/8" tube, the effective catalyst bed
was doubled in length, increasing the chance that every I-I2 molecule would come in contact
with the catalyst. With the 1/4" tube, activity decreased with increasing flow rates, indicating
blow-by. After changingto the 1/8" tube, the calculated activity remained constant with
increasing flow rates, indicating blow-by was eliminated. The second concern was of heat
transfer to the center of the tube. Since, as explained earlier, the conversion of ortho- to
para-H 2 is exothermic, there exists the possibility of a temperature gradient developing
between the center of the catalyst bed and the outer wall. This could cause the activity
measurement made to be at a temperature warmer than the isothermal bath temperature.
Reducing the distance between the bed center and the bath should reduce the possibility of a
temperature gradient and ensure accuracy in the activity measurements made. An accurate
temperature must be known in order to calculate accurate catalytic activity.
18
b. Reactor Assembly 2; Bent Thermocouple
Reactor Tube Assembly 2 can be seen in Figure 7. The following modifications were
made as improvements to the fhst tube. A VCR fitting (1-3) (Cajon) was placed on a
Swagelok tee (4) leading into the catalyst bed. This is to allow easy loading and removal of
each catalyst sample. The second improvement was the addition of a thermocouple assembly
(7-9) to the base of the catalyst bed. The manifold, a 3/8" OD stainless steel rod with a 1/4"
ID internal cavity, was attached to the rest of the assembly by using Swagelok reducers silver
soldered into place. The thermocouple itself was a 1/16" OD Type K stainless steel probe
(Omega), with the temperature measurement at the tip directly in the gas flow.
The major disadvantage of this assembly was the sharp bend in the thermocouple
probe. With the constant removal and insertion of this assembly from a cold dewar or
heating mantle, the physical stress on the probe caused electrical shorts to develop in the
probe, rendering it useless. Note that contact between the stainless steel manifold and the
probeis severalinchesfrom the tip.
19
c. ReactorTube Assembly3; StraightThermocouple
Furthermodificationsweremadeto relieve the stresson the thermocouple.These
changesareshownin Figure 8. This involved replacingthepreviousmanifold with a larger
one,which was 1" in diameterwith the same1/4" internalcavity. The 1/16" OD
thermocoupleprobewasreplacedby a 1/8" OD probewith a 1/16" OD reducedtip. This
workedmuchbetterin termsof physical stability, but the largemassof the manifold and the
shortdistancebetweenthe thermocouple tip and the connection point caused a problem. The
temperature measured was that of the stainless steel instead of the outlet gas. In fact, the
measured temperature on Reactor 3 dropped as much as 30 °C for the same catalyst relative
to Reactor 2. Therefore, an accurate temperature measurement could not be made.
d. Reactor Assembly 4; 2 Thermocouples
The final modifications to the reactor tube assembly are shown in Figure 9. To avoid
the problems of assembly 3, the manifold was made of 1/2" square stainless steel stock, 6
inches in length with a 1/4" cavity drilled out of the center. This allowed nearly 6 inches
between the thermocouple's attachment to the manifold and the tip. To allow added
ensurance, a second thermocouple was added at the gas inlet. This was to compare inlet and
outlet gas temperatures and ensure that the whole system was at thermal equilibrium. It was
concluded through blank cooling and warming runs, as well as the actual testing of a catalyst,
that the temperature of peak activity can be measured to +5 °C.
20
E. Description of Testing Procedure and Definition of Activity
The following is a discussion of the testing procedure and determination of activity for
a catalyst at -196 °C. Approximately 100 mg of catalyst was weighed, placed in a reactor
assembly, and inserted into the system. It was then heated for a given time using one of the
activation gases as described earlier. The reactor was then cooled in a 2 liter stainless steel
Dewar flask filled with liquid Nz. When the vigorous boiling had subsided, the detector
response and 1-12flow rate were recorded. The catalyst was removed from the reactor and
weighed to determine weight loss due to activation.
Since the present study was not interested in the kinetics of ortho- to para-H 2
conversion, but rather in developing a highly active catalyst, we were not measuring absolute
rate constants, but different catalyst activities were compared using specific reactivity. This
value is a measure of how much catalyst is needed to convert a specific amount of H 2 a
specific extent at a given temperature. When the specific temperature is -196 °C and the
extent of conversion is 70% of maximum, this is defined as 13._7 13can be defined
mathematically in the following equation.
Mass Catalyst x Max % H 2 Convertible (o to p) at -196 °C x 70%
Mass H 2 / s x % H 2 Converted (o to p)
The mass of the catalyst is measured following reaction, while the mass flow of H 2 is
measured by the mass flow controller. This value was kept constant at 22.2 mg/s. The
percentage of the hydrogen sample converted from ortho- to para-H 2 was calculated as
described earlier. Since the room temperature composition is 75% o-, 25% p- and at -196°C
21
the composition is 50% o- and 50% p-, the Max % Hz Converted (o to p) at -196 °C is
25%. When comparing catalysts, a lower 13value indicates a better catalyst, meaning it takes
a smaller amount of the catalyst to get the same extent of conversion.
As discussed in the introduction, the kinetics of the catalytic conversion of ortho- to
para-H2 is first order in nature. It should follow that plotting the -In[concentration] vs. time,
generates a straight line. In this case, a straight line is obtained when plotting
-In[l-conversion] vs. mass catalyst/mass H2/s. It also follows that a 13value can be
determined from this plot by finding the value of mg cat/mg H 2 s at -ln[1-70%], which has a
value of 1.2. Furthermore, it has been shown that the slope of the line is the sum of the
forward (k _ ) and reverse (k-1) rate constants. _ Becaause at equilibrium at -196 °C, the
forward and reverse rates are equal, a first order rate constant is equal to 1/2 the slope of the
line of this relationship. The values obtained from these two methods are similar with the
second method usually giving a slightly higher value. This difference converges as the
catalyst improves. From this point on, lY will indicate a value determined by the first
method, while 13m will indicate a value determined by extrapolation of the kinetic plot.
While the intent of this study was to test catalysts at -196 °C, it was discovered that
some catalysts show a distinct maximum activity at a temperature wanner than -196 °C. It
was shown that while cooling some catalysts to -196 °C, the detector showed a large
response before the system reached thermal equilibrium in the liquid N 2. Upon removal of
the Dewar flask, the mV response rose as the system warmed. To compare these results, the
term 13' was coined. It is similar to 13' with a minor change, as shown in the following
equation.

p
Mass Catalyst x Max % H 2 Convertible (o to p) at Temp x 70%
Mass _ / s x % H 2 Converted (o to p)
22
Since the measurement is no longer at -196 °C, the possible conversion will decrease with
respect to temperature. For example, if the temperature of maximum response is -158 °C,
the thermodynamic composition would be 34% para and 66% ortho leaving the Maximum %
of H 2 convertible to be 9% instead of the 25% at -196 °C.
Determination of the temperature of maximum response was done in the following
manner. The reactor assembly was cooled to -196 °C. The liquid N2 Dewar flask was then
exchanged for a liquid N2, 2-methyl butane slurry (m.p. -160 °C), allowing the temperature
to rise slowly, at approximately 10 °C per min. When the response reached a maximum, the
temperature was recorded. Following determination of that temperature, subsequent trials
with the same catalyst were recorded while warming in air instead of the slurry, as the slurry
was time consuming and expensive to make repeatedly. The temperatures in air were
unreliable due to problems explained in the evolution of the reactor assembly. For those
catalysts where the temperature for maximum activity was above -160 °C it was difficult to
assign a temperature and the attempts were inconsistent.
lI. Metal Silicates
23
A. Preparation
All catalysts discussed in this section have a specific label which refers to its location
in the appropriate table.
1. Iron Silicates
CB-I-1 was prepared using the following general procedure, known as
coprecipitation. Into separate burets was placed 15 mL of M Fe(NO3)3 and 15 mL of 1M
Na_SiO 3. Simultaneously, the solutions were dripped at a rate of 2 drops per second into a
stirred solution of 20 mL of 20% w/w NaNO3. This mixture was stirred for 45 rain, filtered,
and dried at 130 °C overnight.
CB-I-2 used the same coprecipitation procedure except that the NaNOa solution was
replaced with 1-120. Both CB-I-1 and 2 were light gold in color.
2. Chromium Silicates
CB-I-3 was prepared using the following procedure, known as the Sol-Gel method.
To a beaker, 100 mL of 1M Na2SiO 3 was added. To this was added 68 mL of 3M HNO3,
which lowered the pH to 1.7 and caused a gel to form. To this gel was added 100 mL of 1M
CrfNO3)3 and the mixture was stirred for 1 h. One molar Na2CO3 (67 mL) was added to
raise the pH to 6.9. This metal gel was suction filtered, washed with H20 (2 x 100 mL) and
MeOH (2 x 100 mL). The catalyst was dried at 23 °C for 2 h followed by 150 °C for 4 h in
a vacuum oven.
CB-I-4 was prepared by the coprecipitation method described in the iron silicate
section with the following changes. 100 mL of 1M solutions of Cr(NO3) 3 and Na2SiO 3 were
injected into 80 mL of NaNO3. The resulting gel was stirred for 1 h, and was then washed
and stirred in MeOH overnight. The catalyst was dried at 110 °C overnight. These catalysts
werelight blue in color.
24
3. Manganese Silicates
CB-I-13 was prepared using the coprecipitation method as described for CB-I-4.
Changes include substituting Mn(NOa)2 for Cr(NOa)3. All other parameters remained
constant. CB-I-29S and 29L were prepared in the same manner as 13 except 29S was aged
in the mother liqueur for 5 h, while 29L was aged for 12 h. Both catalysts were treated with
MeOH and dried as above. The above gels were initially pink but turned light brown with
time, and dried as a light brown solid. CB-I-30 was prepared using the same general
procedure, except the synthesis was done anaerobically to prevent the air oxidation of Mn _ to
Mn _. The Mn and SiO3 solutions were degassed with N2. The solutions were injected using
addition funnels into a three-neck round-bottom flask which was previously evacuated. The
gel was kept from air, filtered using a frit, and dried in the vacuum oven at 110 °C. The gel
remained pink longer than previous Mn samples, but eventually turned brown. This catalyst
preparation was attempted several times to keep the Mn in the +2 oxidation state, but failed.
4. Nickel Silicates
Initial work with nickel silicates involved chemical activation on Air Products HSC
197 Nickel Silicate. A catalyst (AP-DMP) was prepared by refluxing 2 g of AP in 100 mL
of 2,2--dimethoxypropane for 2 h. The sample was initially dried at 23 °C, then at 110 °C,
all while in a vacuum oven. A similar catalyst (AP-REF) was prepared as AP-DMP except
the catalyst was refluxed in MeOH instead of 2,2 DMP. Both of these samples were prepared
with the intent of determining the effect of chemical drying on the activity of the catalyst.
CB-I-7 was prepared using coprecipitation as described in CB-I-1 with the following
changes. A solution of Ni(NO3)2 replaced the iron solution. 100 mL volumes of the 1M
Ni(NO3)2 and Na2SiO3 were injected into 80 mL of NaNO3; and the catalyst was stirred for 4

25
h in water, filtered, and driedat 150 °C as above. CB-I-9 and 9M were prepared as above
except following filtering, 9M was washed with MeOH overnight, refiltered and dried.
CB-I-9MR was prepared by drying and crushing half of 9M, refluxing it in MeOH for 1 h,
followed by redrying.
5. Metal/Metal Silicate
The following is a discussion of the impregnation of metal salt solutions on metal
silicate supports. Table 1 illustrates the impregnation of Fe(NOa)a solutions on Air Products
nickel silicate. Approximately 1 g of AP was placed into a 250 mL round-bottom flask and
evacuated for 2 h. To this, 5 mL of the iron solution was added via a funnel and allowed to
sit for the time indicated in the table. The solvent was then removed by vacuum at room
temperature and the catalyst was fully dried at 110 °C. The final row in the table, CB-I-22,
indicates the substitution of Cr(NO3) 3 for Fe(NO3)3. Table 2 indicates the impregnation of
Fe(NO3)3 on a previously prepared CB-I-9M silicate. The procedure remained identical to
the one described earlier.
B. Catalytic Testing
1. Activity Testing of Air Products Nickel Silicate
a. Activation Time and Temperature
The conditions suggested by the manufacturer for the activation of Air Products
catalyst involved heating the catalyst at 150 °C for 4 h under a 20 mL/min He flow. Under
these conditions, a 13value of 20 was expected, and confirmed experimentally. However, we
found that if the catalyst was heated at the same temperature for 12 h instead of 4, the
value increased to 24.0. The catalyst demonstrated deactivation under prolonged heating. On
the other hand, it was found that the 13value was lowered to 15.7 by heating at 275 °C for
26
only 2 h. Although this was a commercially prepared catalyst, this result supports the
previous claims by Barrick. 23 A distinct color change of the catalyst was noticed as well.
Prior to use, the catalyst is bright green in color, it changes to a dull green following
activation at 150 °C. The color activation at 275 °C was tan-green, a much duller color than
observed at 150 °C. It is felt that the increase in activity can be attributed to the combination
of two related factors. First, it is felt that the catalyst becomes more dehydrated by activating
at 275 °C vs. 150 °C. This should lower the catalyst weight and make the numerator of the 13
equation smaller, hence lowering 13. This was confirmed by an increase in the percent weight
lost during activation at the higher temperature. Second, with the increased dehydration, it
should make available more active sites which were occupied by water, also lowering the
radius of closest approach for a H 2 molecule to an active site. We feel the various changes in
color with respect to the activating temperature give evidence for increased dehydration.
b. Activating Gas or Vacuum
The effect of activating gas was also studied. By activating under 1-I2flow at both 150
°C and 300 °C for 2 h, the catalyst lost most activity, giving 13 values greater than 100. It
was believed that the nickel was reduced to Ni °, as the catalyst turned black in color, was
pyrophoric when exposed to the air, and became ferromagnetic. This leads to the belief that
Ni x is the active component, rather than nickel metal.
Since it has been shown that activation occurs through dehydration and desorption of
the catalyst surface and not reduction, one should be able to activate using a vacuum instead
of inert gas flow. By heating Air Products catalyst at 300 °C for 2 h in a vacuum, the
catalyst showed a 13value of 16.0, which is fairly close to the result achieved with a He flow.
The color of the catalyst following vacuum activation was similar to that observed following
the He studies. Results of both the time and temperature studies along with the activating gas
study are shown in Table 3.

27
The activity of Air Productscatalystvs. the temperature of conversion is displayed in
Figure 10. As shown, there is only modest variation in the 13value with respect to the
temperature of conversion. The tail for the warmer temperatures is due to inaccuracies for
both the measuring of an exact temperature along with the smaller detector response
associated with a smaller possible para-H2 conversion. This figure does show that the
activity is fairly temperature independent down to -196 °C. This catalyst was tested
following He activation for 1 h at 275 °C.
c. Effect of 1-12Flowrate
Initial studies for calibration of the reactor system used Reactor Tube Assembly 1 with
a 1/4" OD tube. At low flow rates (less than 5 L/min), 13was 27.0 following a 4 h
activation at 150 °C in He. As the flow increased, the 13decreased to a minimum value of
20.0 at a flow of 15.7 L/min. At higher flows, the 13increased with flow until the maximum
flow of the reactor was achieved. This can be explained by the following argument. At low
flow rates, the pressure drop across a shallow reactor bed is close to zero. With low reactant
back pressure, it is felt that the residence time of the reactant on the catalyst surface is
lowered, thereby decreasing the possibility of an ortho- to para-I-I2 conversion occurring,
increasing 13. As the flowrate increases, the back pressure increases accordingly, allowing the
H 2 molecule sufficient time on the surface to react, decreasing 13. Increasing the flowrate
further continued to increase backpressure, but reactant blow-by caused 13to increase as well.
The H 2 molecules which had time to get to the surface stayed there long enough to react, but
some H 2 was blown through the bed without contact with the catalyst.
By switching to a 1/8" OD reactor tube, there was sufficient back pressure at low
flowrates. This was caused by the length of the catalyst bed being more than doubled,
increasing restriction. The increased bed length also ended the problem of blow-by at the
maximum flow of the reactor. By activating Air Products catalyst at 150 °C in He for 4 h, a
value of 20 was calculated throughout the entire flowrate range of the reactor.
28
d. Activity of Enhanced Air Products Nickel Silicate Catalyst
Earlier discussion has demonstrated that the activity of AP was increased by an
increase in the dehydration of the catalyst. Due to this, an effort was made to chemically
remove water. It is known that 2,2-dimethoxypropane should react with water to give
methanol and acetone. _ The resulting organic solvents are much more volatile and easier to
remove than water. The 13for AP-DMP, the AP sample dehydrated using
2,2--dimethoxypropane, was 16.1 but at the activation conditions of 275 °C in He for only 40
min. In fact, AP-DMP had a I_ of 40 without activation while unactivated AP showed little
activity ([_ > 100), indicating that the methanol and acetone which replaced water can be
partially removed by a room temperature vacuum. AP-M and AP-R were prepared by the
washing or refluxing of Air Products catalyst in methanol in the hope for a simple exchange
with water. While both gave activities similar to unenhanced AP (l_ = 16.2; 2 h in He at 275
°C), neither showed activity enhancement. Results of this study are shown in Table 4.
Conclusions from this study is that chemical activation helped to shorten the activation time,
but did not increase activity.
2. Synthesized Metal Silicates
a. Iron, Manganese, and Chromium Silicates
This is a discussion of the activity of all metal silicates prepared, except nickel. With
regard to iron silicates prepared, CB-I-1 had a 13of 49.2, while an activity for CB-I-2 was
observed to be greater than 100 following activation at 150 °C for 4 h in He. While neither
showed exceptional activity, the need for NaNO3 was clearly demonstrated. The Na ÷ and
NO3- ions act as a filler during gel formation, helping to create a porous structure.
The importance of a porous silicate can be seen in CB-I-3 and 4 as well. Both of the
29
chromium silicates had very low activity (_ > 100) after 150 °C activation. It was felt these
catalysts were non-porous, giving a low relative metal surface area for reaction.
More promise was demonstrated with respect to the manganese catalysts. CB-I-13
was nearly as active as AP, with a 13 of 20.7 (150 °C for 4 h in He). Catalysts CB-I-29S
and 29L were never tested, however similar samples prepared by Song _ and Gloer _ showed
13values between 20 and 40 when activated between 150 °C and 300 °C in He and it was felt
there would be no improvement. CB-I-30 was never tested because a silicate with the Mn n
oxidation state was never obtained and it was felt the catalytic activity would not differ
greatly from other Mn m catalysts. Results from all metal silicates prepared (except Ni) are
presented in Table 5.
b. Synthesized Nickel Silicates
With the work done on preparing metal silicates other than nickel, it became obvious
that there was difficulty in finding a catalyst with greater activity than Air Products nickel
silicate. We therefore shifted our efforts to prepare nickel silicates by various methods. The
activities for these synthesized nickel silicates are displayed in Table 6.
CB-I-7 and 9 were prepared using the same procedure and yielded very similar
activity (1_ = 55 and 60, respectively at 150 °C for 4 h in He). However, if the activation
temperature was increased to 275 °C, the 13value for CB-I-9 dropped to 17.1 It was felt
that there was water trapped inside the silicate structure following preparation which was not
liberated at 150 °C. By substituting the water used as a solvent in the coprecipitation step for
methanol in CB-I-9M, _ was lowered to 14.4, even at an activation temperature of 150 °C.
Activation at 275 °C lowered 13even further to 13.3. We feel this is caused by water having
a higher surface binding to the silicate than MeOH. Upon drying, the water clings in the
silicate pores, causing them to collapse. MeOH helps to reduce this effect. Also, MeOH is
more volatile than water, making it easier to remove.

30
By refluxing CB-I-9M in MeOH following drying andcrushing,CB-I-9MR had a
valueof 12.1 following activation at 300 °C. We feel that this can be attributed to catalyst
dust trapped in the small pores following crushing. During reflux, air trapped behind these
dust particles explodes outward, clearing the pore and increasing the total pore volume.
Further evidence of the importance of a large total pore volume was demonstrated by
LaBrushY He prepared a nickel silicate (DML-EG) in which ethylene glycol, a larger
molecule, was substituted for NaNO3 in solution. This increased the total pore volume, and
activity increased to _ = 11.0 following activation at 300 °C.
c. Impregnated Metal Silicates
A study was conducted to determine if the addition of an additional metal to a
previously prepared metal silicate would enhance catalytic activity. In this case, the effect of
iron impregnation on nickel silicate was studied. As shown in Table 7, the addition of iron to
Air Product decreases the catalytic activity. It is felt that this is due to either the loss of
equal amounts of more active Ni sites for a less active Fe sites. Similarly, the loss of more
Ni sites for less Fe sites, both of equal activity would have the same effect.. The more iron
that is added, either by a greater iron concentration of the impregnating solution, or a longer
impregnation time, the worse the activity became. However, the addition of iron to
CB-I-9M shows a definite increase in catalytic activity, as shown in Table 8. One possible
explanation for this is that there are void spaces on the silicate where no nickel was
incorporated. Iron would fill those spaces, helping to increase activity. The increase in
activity decreases with the amount of iron added. It is felt that the addition of more iron than
needed to fill the void spaces would have the same effect as earlier described. In fact, it was
further shown by LaBrush 26 that the activity of AP decreased with the addition of Mn a while
the activity of a coprecipitated nickel silicate increased with the addition of Ni a.

31
C. Characterization by N, Condensation/Adsorption
Initial characterization of the metal silicates involved measuring total surface area and
total pore volume. This was done before catalytic testing could be performed and catalysts
were synthesized under the assumption that increased surface area and total pore volume
would increase activity. The results presented are for a select group of catalysts, because not
all metal silicate catalysts prepared were tested for a total surface area or total pore volume.
Table 9 shows the surface area and pore volume measurements collected during this
study. No measurements were collected for iron silicates, as the activity was poor and this
class of catalysts was not pursued. Chromium silicates were among the fn'st catalysts
prepared. To help determine their quality, surface areas were determined before they were
tested for catalytic activity. As one can see, the surface area is only about 1/4 of that of AP.
This would agree with the catalytic testing of these catalysts which performed very poorly.
The only manganese catalyst tested was CB-I-13. This catalyst showed a very good
pore volume (0.55 cc/g) but an intermediate total surface area (225 m2/g). It was felt that this
catalyst had a larger average pore diameter than AP. Generally speaking, a high population
of smaller micropores yields higher total surface areas than a catalyst with the same total pore
volume and larger pores. It was hard to conclude anything from these results because the
activity of this catalyst was similar to AP.
A more extensive study of nickel silicates was completed. The results obtained were
as expected. CB-I-9 had an intermediate surface area and a relatively low pore volume.
The activity reflected these trends as it was not as active as AP. However, by washing in
MeOH (CB-I-9M) the surface area and pore volume rose dramatically, as did the catalytic
activity. This observation would support the previous assumption that a catalyst with a higher
surface area and pore volume would be more active. It was proposed that refluxing
CB-I-9M in MeOH, would remove small dust particles trapped inside the micropores. The
data supports this proposal in that the total surface area increased greatly, while the total pore

32
volume increased only slightly. This would be expected by decreasing the average pore
diameter which would be accomplished by removal of dust from the micropores. DML-EG,
a nickel silicate prepared using the MeOH wash technique as well as the substitution of
ethylene glycol for sodium nitrate showed an increase in total pore volume as well. This was
predicted as ethylene glycol, a larger molecule than sodium nitrate, serves as a larger
formation site for the silicate. The surface area for DML-EG was not determined. It was
predicted to be less than CB-I-9MR because it should have a larger average pore diameter.
The only impregnated silicate tested was CB-I-12. The surface area was much lower
then the original AP. This may be explained by the filling in of a highly complex silicate
structure by a metal salt. The complex silicate would have many nooks and crannies which
would increase the total surface area. Filling them with the metal salt would lower that
surface area. It is unknown whether the number of active sites varies from AP and if they
do, by how much.
The main conclusion made from this study was that activity was dependent upon the
catalyst having a large total surface area and large total pore volume. With a large total
surface area, there is a greater number of metal atoms on the surface. This will yield more
active metal sites for catalysis. A large total pore volume helps the mass transport of reactant
H 2 through the body of the catalyst particle to the surface. This increases the probability that
an H 2 molecule finding the surface will be converted from ortho- to para-H2.
First, as displayed with chromium, a very low total surface area generally means poor
activity. But as displayed in the nickel catalysts, as the total surface area and pore volume
was increased by various modifications in the preparation technique, the activity increased as
well. This supports the previous claim that the modifications in preparation (MeOH wash,
reflux) did indeed increase pore volume which in turn increased the total surface area of the
catalyst, thus increasing catalytic activity.

33
D. Conclusions for Metal Silicates
When looking at the work done with metal silicates, including enhancing AP,
preparing various metal silicates, and impregnating nickel silicates, some conclusions can be
made. First, the silicate can only be activated by He, not I-I2. This most likely suggests that
the activation process is a desorption of water and other adsorbates from the surface, not a
reduction of the metal ion to metal. This is further supported by work with AP in which
increased activity was observed by increasing the activation temperature. It is felt that the
increased activation temperature from the suggested 150 °C to 300 °C reduces the hydration
of the catalyst. Water is thought to both increase the catalyst weight and block the distance
of a reactant 1-12to the surface, both of which reduce activity.
Second, nickel was the best choice over iron, manganese, and chromium for the
preparation of metal silicates. It is unknown whether this is because nickel inherently is a
better metal for ortho- to para-H a conversion or if nickel causes the formation of a better
metal silicate, which yields a better catalyst surface.
Third, an increase in total pore volume will increase activity. This was displayed with
the prepared nickel silicates. Each time an improvement was made to increase the total pore
volume, activity increased as well. It is felt that this can be attributed to better mass transport
of H e through the catalyst. If Ha has an easier opportunity to get to an active site, it is more
likely to be converted. Also, by increasing the pore volume, the total active surface area
should increase. Both factors should increase activity. A limit to this effect is most likely
the physical stability of the catalyst, as the catalyst become more fragile to crushing.
Finally, additional metal added to a preexisting metal silicate increases activity only if
the surface is not already saturated with metal sites. If the surface is saturated, the additional
metal will not only add weight, but cover existing sites. Both of these factors will decrease
activity.

Ill. Ruthenium Catalysts
34
A. Preparation
1. Traditional Ruthenium Catalysts
To a 250 mL round-bottom flask was a weighed amount of pretreated silica support
(PQ 1022G; 35-50 mesh) and the mixture was held in vacuo for 2 h. To this, the calculated
amount of ruthenium salt [RuC13, Ru(NO)CI3, or Ru(NO)(NO3)3] for a desired metal loading
was added via a separatory funnel. The funnel was then rinsed with 2 mL of 1-120. The
resulting mixture was allowed to sit for 5 hours. The solvent was then removed using a
rotary evaporator with a bath temperature of 50 °C. The catalyst was dried in a laboratory
oven at 130 °C overnight. Ru metal content was determined by weight gain of the support
and conf'trrned spectroscopically. Metal content was determined by spectrophotometric
methods described by Beamish. _ Excess Ru, which had crystallized on the sides of the flask
following impregnation and remained following catalyst removal, was washed out and diluted
to a concentration of approximately 10 ppm. A 10-mL aliquot of this dilute Ru solution was
added to 10 mL of 20% NaC1, 5 mL of 5% NH3OH.HCI and 15 mL of 1,10-Phenanthroline.
This solution was adjusted to a pH of 6 with NaOH, diluted to 100 mL, and heated to a boil
for 1 h. The absorbance of the resulting yellow solution was measured at 448 nm using a
Bauch and Lomb spectrometer. The absorbance was then compared to a standard Ru curve
and the Ru metal concentration was extrapolated. Using the dilution factor, the amount of Ru
metal remaining in the flask was calculated. RuCn_,_) was then subtracted from Ruc_t) to
calculate Ru_c,t ), which was used to calculate a percent metal loading. This method was used
for calculation of all traditional ruthenium catalysts preparations.
35
2. RutheniumAmmine PrecursorCatalysts
Catalystswerepreparedby thefollowing generalproceduredescribedby Gayz9 and
modified by Wu 3°. To a 50 mL beaker, was added a weighed amount of pretreated silica
support (PQ 1022G; 35-50 mesh). To this, enough concentrated ammonium hydroxide was
added to saturate the support and partially ionize the silanol groups. In a separate 100 mL
beaker, the desired amount of ruthenium salt, Ru(NO)(NO3)3 or RuCI a, was dissolved in 20
mL water, and 2 mL of hydrazine hydrate was added dropwise under constant swirling.
When N 2 evolution had slowed, an additional 5 mL of hydrazine was added to ensure
completion of the reduction of Ru from 3+ to 2+ and formation of a stable ammine complex.
This solution was allowed to sit for 1 hour to permit all N 2 to escape. The Ru n solution and
the above mentioned support were mixed and allowed to sit for 16 hours. The catalyst was
dried under vacuum for 2 hours and in the air for 16 hours at 115 ° C.
Ruthenium metal content was determined by a spectroscopic determination of K2RuO 4
concentration as described by Marezenko 3_ and Beamish 27. This involved the oxidation of
Ru ° to Ru w in a eutectic melt of KNO3 and KOH at 350 °C.32 The catalyst was reduced in
flowing I-h at 350 °C overnight in a tube furnace. Approximately 20 mg of the reduced
material was weighed and crushed to a fine powder and added to a porcelain crucible. To
this was added -- 0.5 g of KNO3 and -- 1 g KOH. The mixture was then heated at 350 °C in
a muffle furnace overnight. The resulting K2RuO4 was dissolved in water, and diluted to 50
mL in a volumetric flask with 2 M NaOH. A sample of the resulting orange solution was
centrifuged to remove any remaining silica particulate, and the absorbance of the supernatant
was measured at 465 nm using a spectrometer. This value was compared to a standard
calibration curve and Ru v1 concentration was extrapolated. From this, Ru content of the
catalyst was calculated.

36
3. (_4--cyclohexa-l,3--diene)(rlt-benzene)Ruthenium(0) PrecursorCatalysts
Zinc dustwasactivatedaccordingto Perrin andArmarego33. Cyclohexa-l,3-diene
was distilled and stored under nitrogen.
Cyclohexa-l,3-diene (4.2 g, 52 mmol) and activated zinc dust were added to a 250
mL round-bottom Schlenk flask. To this was added 8 mL of a RuCI 3 (320 mg, 1.23 mmol)
solution in ethanol. The resulting blue mixture was stirred at room temperature for 3 h. The
final solution, which had turned yellow-brown was purified on alumina, washed with hexane
(2 x 30 mL), and the solvent was removed under vacuum. To this yellow solid was added 40
mL of hexane and filtered through a 20 cm alumina column. The resulting solution was
reduced to 5 mL and upon cooling to -78 °C, yellow crystals formed. The mother liquor was
syringed out and the remaining solvent was dried in vacuo to give 0.22 g of
(rl4-cyclohexa-l,3-diene)(rlt-benzene) Ruthenium (0) (68 % yield).
The catalyst were prepared using the following general procedure. To a 250 mL
round-bottom flask was a weighed amount of pretreated silica support (PQ 1022G; 35-50
mesh) and the mixture was held in vacuo for 2 h. To this, the calculated amount of
(rl4--cyclohexa-l,3--diene)(TIt-benzene) ruthenium (0) for a desired metal loading was added
in 10 mL of anhydrous hexane via a cannula. The resulting slurry was allowed to sit
overnight and the solvent was removed under vacuum. The catalyst was then stored under
nitrogen.
B. Catalytic Testing
1. Activity of Traditional Ruthenium Catalysts
a. Activation Conditions: Time, Temperature, Gas, and Pressure
Results for the catalytic testing of CB-II-20 are shown in Table 10. The number
following the result in the text refers to the trial number in the appropriate table. This

37
catalyst showed little activity at -196 °C, but had good activity at a higher temperature. The
temperature of maximum activity was determined using slurry baths to be -158 °C, and this
temperature was used to calculate all 13' values. Hydrogen was determined to be the best
choice for the activation of a ruthenium catalyst. By heating at 335 °C for 4 h in 1-12,a 13' of
3.8 was calculated (1). This is compared to a value of 6.7 for the same conditions in He (2).
However, by increasing the temperature to 450 °C in H2, the ff dropped to 3.3 (3). Further
increase of temperature to 550 °C was counterproductive as 13' increased to 3.9 (4). Further
increase of the time to 8 h had little effect on activity (12). All of these trials were done with
the same activation and reactant gas pressure. From this it was postulated that Ru ° was the
active catalytic species, not Ru m. Increasing the activation gas pressure from 20 to 200 psi
had little effect on activity (5,6). The same was true for increasing the reactant 1-12pressure.
Activity did not change as the pressure was increased from 200 through 500 psi (1,8-10).
Since pressure was not a factor, the value of 200-250 psi was used, with 200 psi being the
minimum pressure needed to get the reactant H2 through the catalyst bed.
The effects of using two gases during activation was also studied. It was postulated
that by heating in He prior to reduction, water would be completely removed from the system
before reduction. The results of these tests are shown in trials 7 and 11, and seem to have
little effect on activity (13"= 3.5 and 3.2, respectfully). However, if one reduces in H_ at
450 °C, switches to He for 12 h at high temperature, and cools the catalyst to -196 °C in He
flow, a 13 of 8.5 was measured. Exposure of the catalyst at room temperature to 1-12not only
increased I_, but 13"as well. Reheating in He to 450 °C followed by cooling to -196 °C,
nearly reestablished the original activity indicating the overall process was somewhat
reversible. Reversibility means that following exposure of the activated catalyst to room
temperature 1-12the last activity can be regenerated by simply reheating to 450 °C and
cooling to -196°C in He as before. This procedure will be referred as "H2/He activation" the
remainder of the report.

38
CB-II-72 wasan 8%Ru/SiO2 catalyst prepared with the same technique as
CB-II-20. The activity test results are shown in Table 11. The results are similar with one
exception; the 13value following H2/l-Ie activation was greater than CB-II-20 (6). It is
unknown why the value went up, although it was important to note that there was an
enhancement. It was also discovered that if the catalyst was cooled directly from reduction
temperature to -196 °C in flowing H 2 using a liquid N 2 bath, there was some 13 improvement
as well. The rational behind this discovery, known as "Flash Cooling" and the "He Effect"
following H2/I-Ie activation, will be discussed in more detail later.
b. Effect of Percent Metal Content
From the previous study, it was determined that the best conditions for activation were
to reduce at 450 °C for 4 h in H 2, followed by a 12 h He purge at 450 °C, followed by
cooling to -196 °C in He prior to testing. It was shown that the 13 and 13"measurements
displayed only slight variation when the activation temperature ranged from 300 to 500 °C.
Therefore, the initial comparison of most catalysts will be reported using 13"while activating
at 450 °C, with H2/I-le activation results reported as well.
Activities for all RuC13 precursor catalysts and their varying Ru weight percents are
shown in Table 12. CB-II-15, with only 0.1% Ru, showed little activity at any
temperature (1-2). But, by adding just 1% Ru, a 13' of 5.0 (4) was achieved. Further
increases of Ru gave further increases in activity (6, 8, 10), until the 13' of 3.3 was
observed for 8% Ru in CB-II-20 as described above. However in CB-II-46 with 14% Ru,
there was a decrease in activity (13).
The use of He as the sole activating gas gave negative results for all catalysts tested
(1, 3, 7, 9). However, following I-12reduction, there was a "He Effect" as before. CB-II-19,
with 4.4% Ru, had activity at -196 °C, but was not as active as CB-II-20. The 13' was 36.0,
compared to 8.5. Increasing Ru content to greater than 8% had a negative effect on the
39
"He Effect" 13 as well. For CB-II--46, 13 increased to 15.2 (15). Catalysts were also prepared
to study the effects of the Ru precursor metal on activity, and an entire range of metal
loadings were prepared. However, the majority of this effort was spent testing the = 8% Ru
catalysts.
c. Effect of Metal Precursor
Tables 13 and 14 show the activity of a range of Ru catalysts prepared with
Ru(NO)C13 and Ru(NO)(NO3)a, respectfully. For the Ru(NO)CI 3 catalysts, 13' activity
increased with increasing metal content, but had a definite maximum associated with
ruthenium content (1-4). While testing CB-II-24 (9.2% metal loading), it was demonstrated
that following reduction, heating in He followed by cooling to -196 °C in He had an effect
similar to other catalysts (5). 13' was 13.5 compared to over 75 when reduced and cooled in
H 2. Further heating in He had an adverse effect, as 13increased slightly (6, 7). Although the
majority of activity was regained following exposure to room temperature 1-12,it is felt that
the activity lost due to repeated heating is due to sintering.
Similar results for ff are found for the catalysts prepared with Ru(NO)(NO3)3.
The same trend of 13'decreasing with increasing Ru loading followed by a subsequent
increase in 13' for high metal loading is evident (1, 3, 7). The main difference is in the -196
°C activity following H 2/He activation (5, 9). While enhancement is observed, (13 = 33.7 for
CB-II-27; 30.0 for CB-II-29), it not nearly as great as observed for ruthenium catalysts
prepared with chloride containing precursors. Figure 11 illustrates the 13' activity at -158 °C
vs. metal content for all Ru catalysts, while Figure 12 illustrates the enhancement activity at
-196 °C following H 2/He activation.
Conclusions that can be made from the study of these ruthenium catalyst are as
follows. First, Ru catalysts show low activity at -196 °C following reduction in H2. Second,
Ru catalysts all show activity at temperatures wanner than -196 °C; the temperature of

40
maximumactivity is = -158 °C. Third, the 13"is more dependent upon metal content and less
dependent upon metal precursor. Fourth, activity is observed at -196 °C if the catalyst is
heated and cooled to -196 °C in He following reduction and prior to exposure to the reactant
H 2. Finally, the amount of this enhancement is dependent upon the metal precursor used.
d. Effect of Platinum Metal Addition
In an attempt to perturb the electronic effects of the ruthenium catalysts, platinum was
added as a second metal, since platinum is known to adsorb and activate H2. 34 In CB-II-44
and 45, the ruthenium loading was 8% with 1% and 3.25% loadings of platinum, respectfully.
As before, the maximum activity was observed at -158 °C with much less activity at -196
°C. In fact, 13"actually increased with respect to CB-II-20. However, there was 13 activity
after reducing conditions and cooling in H 2. These results are shown in Table 15. This is
thought to occur by a process similar to that described in the silicate section. Platinum
particles partially cover some ruthenium sites; the Pt sites have less activity at -158 °C than
Ru, causing 13'to increase. On the other hand, at -196 °C the Pt sites are more active
following reduction without the He treatment, thereby causing 13to decrease. Since neither 13
nor 13' showed dramatic improvements relative to previously established catalysts, the addition
of platinum was not investigated further.
e. Effect of Catalyst Preparation Method
The Ru/SiO2 catalysts discussed earlier were all prepared with the same general
technique: Impregnation with ruthenium, removal of solvent with a rotovap at 50 °C, and
drying overnight at 130 °C. This section will discuss modifications of that technique. Their
effects on the subsequent activity are shown in Table 16.
CB-II-37 was prepared as CB-II-20 except the final drying was done under a room
temperature vacuum instead of in an oven. Results remained consistent with what had been
observed before. There was little activity at -196 °C following reduction and a 13' of 3.2 at

41
-158 °C (2). The "He Effect" was also observed, yielding a _s of 15.8 (4). This value was
closer to the 13reported for CB-II-72 (16.6) which was prepared just like CB-II-20 and
CB-II-24 (13.9) than that of CB-II-20 (8.5). To this date we were unable to determine the
cause of this difference and are unable to prove or disprove any hypothesis as CB-II-20 was
completely consumed during earlier testing.
As shown in Figure 12, there is a definite advantage to starting with a chloride
containing ruthenium precursor. It was reported by Miura 35 along with Lu and Tatarchul_ 6
that following reduction there was still residual chloride on the metallic Ru particles on the
silica surface. Miura further reported that by washing the reduced catalyst in hot water and
redrying, the chlorine is removed. 37 By washing CB-II-48, a catalyst prepared using RuCI a,
we expected a catalyst with properties similar to CB-II-29, which was prepared with
Ru(NO)(NO3)3. This was confirmed by the observed "He Effect" 13value of 34.7 (6), higher
than the 13= 15 values reported earlier for catalysts prepared with chloride containing
precursors. Arguments about why residual chloride has an effect on the activity at -196 °C
following "He Effect" activation will be presented later.
2. Ruthenium Ammine Precursor Catalysts
a. Activation Conditions
Catalysts were prepared by the general procedure described by Gay _ and modified by
Wu 29 with the preparation being reported elsewhere in this text. Gay described general
activation conditions for reduction of ruthenium and desorption of the surface. The catalysts
were reduced in flowing H 2 at 350 °C for 4 h. For desorption of the surface, the catalyst was
heated at the same temperature for 12 h under a high vacuum In our case, the flowing He
was used rather than a vacuum for simplicity.
42
b. GeneralProcedures
Catalystswerepreparedwith Ru(NO)(NO3)3asthe precursorto the amminewith metal
contentsof 2%, 4%, 8%, 10%,and 12%by weight. However,due to the robustnatureof the
hydrazinereductionduring the catalystpreparation,thehigher rutheniumcontentcatalysts
were isolatedwith lower thanexpectedmetal contents. This wasdue to the splatteringof the
rutheniumsolutionon the sidesof the beaker. Usingthe KOH-KNO3 melt, an accurate metal
content was obtained. The actual metal content was compared to the planned metal content
and the difference was taken into consideration for future preps.
The catalysts were tested only for activity at -196 °C. While 13' activity does exist for
all catalysts, it occurred at a temperature greater than -160 °C, and an accurate temperature
was not obtained. In most cases, the 1_' maximum activity was a much smaller increase over
the 13maximum, probably less than 20%. Due to these two factors, no _l' values were
reported.
c. Effect of Metal Content
The activities for catalysts prepared with RuCNO)(NO3)3 are shown in Table 17. The
values in the third column, _S[H2], indicate activity following reduction and cooling in H 2,
while those in the fourth column, [Y[H2-He], indicate reduction followed by desorption and
cooling to -196 °C in He. As one can see, there is always an increase in activity upon
heating and cooling in He over cooling in H2, in other words, a "He Effect." The effect
chlorine has on the "He Effect" will be discussed shortly. Table 17 also shows what effect
metal content has on activity. With this preparation method, as little as 2% Ru can give a [3
value of 14. By increasing metal content, a 13of 4 was obtained following H 2/He activation.
Additional ruthenium proved to be disadvantageous as the 13value started to increase after a
maximum metal content had been reached. This decrease in activity is shown in Figure 13,
which displays the activity of all Ru catalysts prepared in this study. High activity can also
43
bemeasuredif the catalystis cooled in 1-I2from the reduction temperature directly to -196
°C. "Flash Cooling" was done while testing CB-II-92,and a 13of 3.3 was measured, which
was even lower than that following He desorption. This technique was not attempted on
other catalysts; it was done only to confirm if the "Flash Cooling" would work on this class
of catalysts.
d. Effects of Precursor Metal and Preparation Method
Catalysts were also prepared using RuC13 and Ru(NO)C13, respectfully. The metal
content was intended to be 8% by weight, but varied due to the splattering problem described
earlier. Activities for these catalysts are shown in the top two lines of Table 18. As one can
see, catalysts prepared with a ruthenium chloride precursor had very low activity, even
following He desorption of the surface. This would indicate that having chloride present
while working up the catalyst modifies the surface in such a way as to deactivate the catalyst.
CB-II-89W was prepared by washing with hot water to remove residual chlorine. If
the surface of CB-II-89 is similar to 88 and the only difference is the presence of chlorine;
then by removal of chlorine, the activities should become similar. This is clearly not the
case. As shown at the bottom of Table 18, activity decreases even more following this
treatment. It would appear that the chlorine has to be either not present entirely or removed
before the catalyst is dried/reduced.
CB-II-125 was prepared by the procedure described by Gay, without the modification
described by Wu. The modification was to soak the support in ammonium hydroxide before
introducing the reduced ruthenium solution. In the case of CB-II-125, the ruthenium was
added to the support before reduction by hydrazine without soaking in ammonium hydroxide.
It was stated by Gay that having the metal and support in contact during reduction would
increase the metallic dispersion. The only exception to his procedure was that Ru(NO)(NO3) 3
was used instead of RuC13. This eliminated the need to wash the wet catalyst with aqueous
44
ammoniato removechloride.
CB-II-130 waspreparedusingthe sametechniqueas CB-II-125, exceptRuC13
wasused. Becauseof this thecatalystwaswashedin cold 1M aqueousammoniato remove
chlorine. This experimentwasperformedto seeif high activity at -196 °C existedif the
chloride wasremovedprior to catalystdrying or final reduction.
As Table 18 illustrates,thereis extremelyhigh activity for CB-II-130 at -196 °C.
Becausethis catalysthasa lower metal contentrelative to the catalystspreparedusing
Ru(NO)(NO3)3,it is felt that catalystspreparedtaking advantageof this techniquewould have
comparableactivities to thosepreparedwithout chlorine beingpresentaltogether. This is an
importantfact shouldthesecatalystsbepreparedcommerciallyasthecost of Ru(NO)(NO3) 3
is over twice that of RuC13.
3. (rl4-cyclohexa-l,3-diene)(rl6-benzene) Ruthenium (0) Precursor Catalysts
Results of the catalytic testing of catalysts prepared by the impregnation of
(rl4-cyclohexa-l,3--diene)(rl6-benzene) Ruthenium (0) to a silica support is presented in
Table 19. It is felt the following generalizations can be made about this class of catalysts.
First, the ff activity changed very little with the percent metal loading or with the choice of
activating gas. The temperature of maximum activity seemed to decrease slightly with
increasing metal content. However, due to the inaccuracy of the measurement of that
temperature, a strong conclusion cannot be made. Second, the 13value at -196°C did show a
definite decrease with increasing metal loading. It was also observed that the activity at -196
°C was generally greater when He instead of H 2 was used as the gas of activation. This is an
expected result since the organometallic ruthenium precursor is already in a zero valent state
and is deposited on the support following the thermal decomposition of the organic ligands.
Helium is used to simply sweep these fragments along with any solvent away from the
catalyst. The use of H 2 would achieve the same thermal decomposition of the precursor, but

45
the presenceof H 2 may facilitate slight sintering of the catalyst, thus reducing the active
surface area and activity. Another possible explanation is that of the H 2 poisoning of the
catalyst as described in the previous sections. No attempts were made to activate the catalyst
with H 2 followed by He as the organometallic ruthenium precursor work was completed
before the 1-12poisoning was observed in the other catalysts.
C. Characterization of Ruthenium and Ruthenium Ammine Precursor Catalysts
1. H_ Adsorption
When comparing the activity of traditionally prepared ruthenium catalysts with the
ammine precursor catalysts, it was found that the latter catalysts had higher activity
throughout the temperature range tested, but especially at -196 °C. It is felt that the major
difference between these catalysts is the metallic dispersion. It has been previously stated
that the ruthenium ammine precursor catalysts have high dispersions. 2s We wished to confirm
this fact and see if any correlation existed between the dispersion and the catalytic activity,
especially at -196 °C.
Table 20 displays the ruthenium metal dispersion for catalysts prepared with
Ru(NO)(NO3)3 as a precursor to the ammine complex. As one can see, the dispersion is quite
high for ruthenium supported on silica, generally over 20% regardless of metal content. The
catalysts do show higher metallic dispersions at lower metal content, which is expected. The
final column in Table 20 indicates the number of ruthenium atoms on the catalyst surface per
gram of catalyst. This value is felt to be highly indicative of how active a catalyst is. The
catalyst with the highest number of active metal sites on the surface should be able to convert
the most H 2. However, since activity is measured by determining the weight of a catalyst
needed to convert a known amount of H 2, the catalyst with the highest number of surface
atoms per gram should be the most active.
Figure 14 is a plot of the activities of the catalysts in Table 20 vs. the total number of

46
rutheniumatomspergram of catalyst; the triangles indicate catalysts prepared by ion
exchange using Ru(NO)(NO3) 3. As one can see, there is a definite correlation between the
activity at -196 °C and the ruthenium surface atoms per gram catalyst. As expected, an
increase in surface atoms generally means an increase in the catalytic activity. However,
there does seem to be a slight decrease in activity with a large number of surface ruthenium
atoms as well. One possible explanation for this is that a large number of surface ruthenium
atoms also indicates a smaller ruthenium particle size. With the smaller particle size, there
may be some geometric considerations with the adsorption and desorption of the reactant H 2
since the active sites will tend to be closer together. Another possible explanation is that
smaller ruthenium particle will have a weaker interaction with an incoming H 2 molecule. 35
This may shorten the residence time of the H 2 on the surface, thereby decreasing activity. At
this time, the cause of this observation is still undetermined.
The square marker in Figure 14 indicates CB-II-125, a catalyst prepared without
using the ion-exchange method. As one can see, when the activity is plotted vs. the number
of surface ruthenium atoms per gram, the catalyst fits in very nicely with the others,
indicating there is little dependence upon the actual ammine precursor preparation technique.
Table 21 shows the dispersion of ammine precursor catalysts prepared using a chloride
precursor. As shown in the first two entries, the use of a chlorine precursor definitely
decreases the dispersion available through this technique. Since the activities of these two
catalysts were also poor, _ values of 42 and 61 for CB-II-89 and 93, respectfully, following
HjI-Ie activation, it is felt that using a chloride precursor reduces dispersion greatly, hence
decreasing activity. In other words, chlorine precursors make poor catalysts, especially with
RuC13. However, since the dispersion of CB-II-93 is somewhat respectable, it is felt that
residual chlorine may also decrease activity by an electronic effect as discussed earlier. The
chlorine may weaken the Ru-H2 interaction such that the mean lifetime of the adsorbed
species is shortened so there is not adequate time for an o-p hydrogen interconversion to take

47
place.
The second two entries in Table 21 demonstrate attempts to remove chlorine from the
catalyst. In CB-II-89W, in which chlorine was washed following drying and reduction, the
dispersion and activity (_ = 45) changed little. However, if chlorine was removed prior to
drying as in CB-II-130, the dispersion and activity was as if a non--chlorine precursor was
used. Activity vs. surface ruthenium atoms per gram for CB-II-130, plotted in Figure 14, is
represented by a circle. As one can see, this catalyst fits in nicely with other catalysts
prepared by different methods without chlorine. This result would support the earlier
hypothesis that the presence of chlorine during the catalyst drying process causes the
formation of a catalyst with poor dispersion.
For comparison, the metallic surface areas of selected traditionally prepared ruthenium
catalysts were measured. These results are presented in Table 22. It is quite obvious that the
metallic dispersions are much lower. This would indicate large particles and a smaller
number of surface ruthenium atoms per gram of catalyst. This further supports the hypothesis
that higher dispersions will yield higher activities.
An interesting observation is made when one compares the ruthenium atoms per gram
of catalyst and the activity of the chlorine containing traditional catalysts to those of the
chlorine containing ammine precursor catalysts. With the traditional chlorine catalysts, a H 2
/He activation _ value of approximately 15 was obtained. However, with the ammine
precursor chlorine catalysts, the H2/He activation [3 values were greater than 40. The
ammine precursor chlorine catalysts were less active, even though there were a larger number
of surface atoms per gram. This is a complete opposite to what was observed with the
non-chlorine containing catalysts, both traditional and ammine precursor.
It is felt that this can be explained with the following argument. As discussed in
earlier, the "He Effect" is caused by activated adsorption of H 2 followed by desorption with
He. This is caused by the addition of electropositive chlorine on a large ruthenium particle.

48
Sincetherutheniumparticle is large,thechlorine is not felt to bea geometrichinderanceto
incoming H2,yet it canstill causean electroniceffect.
However,in thecaseof theammineprecursorcatalysts,it is a different story. Even
thoughthe catalystshavea greaternumberof surfacerutheniumatoms,the "He Effect"
activity is lessthan for a traditionalcatalyst. Reasoningbehindthis is two-fold. First, for
theammineprecursor catalysts, a higher dispersion means smaller ruthenium particle size.
This means the residual chlorine is sitting on a much smaller ruthenium particle. In this case
it is more likely to be deactivating the catalyst through a geometric pathway. The chlorine
simply blocks the path of the incoming H 2 to the surface. Second, with a smaller metal
particle, Lu and Tatarchuk stated that the chlorine electronic effects with the metal would be
greater. Knowing this, it is possible that the interaction between the incoming 1-12and the
activated Ru would be lessened, especially at low temperature. This would cause the H 2
residence time to decrease, decreasing activity. At the present time it is not known if one, or
both, of the above hypothesis are responsible for the above observations.
2. Low Temperature Susceptibility
Low temperature magnetic susceptibilities of selected catalysts were valuable in
explaining the behavior of different ruthenium catalysts. Without these data, the previous
assumptions with respect to I]' could not have been made. A much simpler hypothesis to
explain why ruthenium catalysts show a maximum activity would be that the magnetic
susceptibility of the catalyst varies with temperature. It reaches a maximum value at a
temperature corresponding to the temperature of maximum catalytic activity. This maximum
susceptibility would then decline to -196 °C. It was therefore necessary to measure the
magnetic susceptibilities vs. temperature of various catalysts to see if any maxima exist,
which would support the above hypothesis.
The first catalyst tested was AP. It was tested following activation at 200 °C for 2 h
49
in a He flow. The magnetic susceptibility was plotted vs. temperature in Figure 15. This
experiment displays that the magnetic susceptibility of the catalyst increases with decreasing
temperature. This is what is expected for a paramagnetic metal. Further evidence for the
paramagnetic character of this catalyst is shown in Figure 16. For a paramagnetic species, the
plot of the inverse susceptibility vs. temperature should be linear.
As shown in Figure 15, the magnetic susceptibility nearly doubles over the
temperature range studied. However, if one looks at the plot of activity vs. temperature over
the same range, there is little change in activity. In fact, any difference displayed in activity
would be opposite of what would be predicted solely by using susceptibility. This implies
that there are other factors which outweigh the effects of the magnetic susceptibility.
Ruthenium catalysts were the next to be tested. The magnetic susceptibility of
CB-II-24 without activation is shown in Figure 17. As one can see, the magnetic
susceptibility is completely different. First, the catalyst showed a diamagnetic behavior,
meaning the catalyst was repelled by the applied magnetic field. Also, the calculated
magnetic effect was approximately two orders of magnitude smaller than that calculated for
AP. Finally, there is little variation of the magnetic susceptibility with change of temperature.
The small variation found occurred at temperatures closer to -196 °C, where the catalyst
appeared to be less diamagnetic.
The temperature dependence of the magnetic susceptibility of CB-H-24 following
reduction at 350 °C in H 2 is shown in Figure 18. This experiment was done to determine if
magnetic susceptibility would change by changing the oxidation state from Ru m to Ru °. As
shown, the curve of Figure 18 is very similar to Figure 17. The only difference is that the
reduced catalyst had a smaller diamagnetic effect. It is felt that this is simply caused by the
catalyst having a higher weight percent of Ru following reduction.
For comparison, other ruthenium catalysts prepared by Fubara _ and Wang 39 were
tested. These catalysts were all Ru ° catalysts, but prepared by different methods. In Figure
5O
18, the magneticsusceptibility of BF-40CI is shown. This was a ruthenium catalyst with a
24% Ru metal loading, supported on alumina. Catalytic properties of this catalyst were very
similar to the traditionally prepared ruthenium catalysts, with a 13value of 5.7 following
reduction at 400 °C and a 13"of about 1 at -154 °C. It is interesting that this catalyst showed
a positive paramagnetic response at temperatures lower than -160 °C, but was slightly
diamagnetic at temperatures greater than -160 °C. Once again, the order of magnitude of the
measured magnetic susceptibility is over a hundred times less than that of AP.
The magnetic susceptibility of WW-17 (5.7% Ru/SiO2 ) is shown in Figure 20. This
catalyst was prepared by the impregnation of the organometallic compound
(rl4--cyclohexa-l,3--diene)(rl6-benzene)ruthenium(0) onto a silica support. The aim of this
work was to impregnate a Ru ° source and achieve an active metal by pyrolyzing the catalyst
in N 2. The activity of this catalyst was very similar to traditional catalysts with a 13value of
43.4 and 13' of 2.85 at -154 °C. This was following H2 activation at 400 °C for 4 h. The
major differences between this catalyst and other Ru catalysts tested is that a paramagnetic
response is shown. This response varied little throughout the entire temperature range
measured.
3. X-ray Diffraction
In an attempt to further characterize the ruthenium catalysts, X-ray diffraction powder
patterns were collected. The reasoning behind this was two fold. First, we wanted to
establish chemical purity of the samples. X-ray diffraction can be used as an analytical tool
to fingerprint various components of a catalyst. Second, one can use the line broadening of
selected peaks to determine the metallic particle size. This information was helpful to
determine if there was good dispersion of the ruthenium, as smaller particles lead to higher
dispersions. These experiments were especially important before the capability to do active
gas chemisorption was obtained. With regard to catalyst purity, we wished to look at a
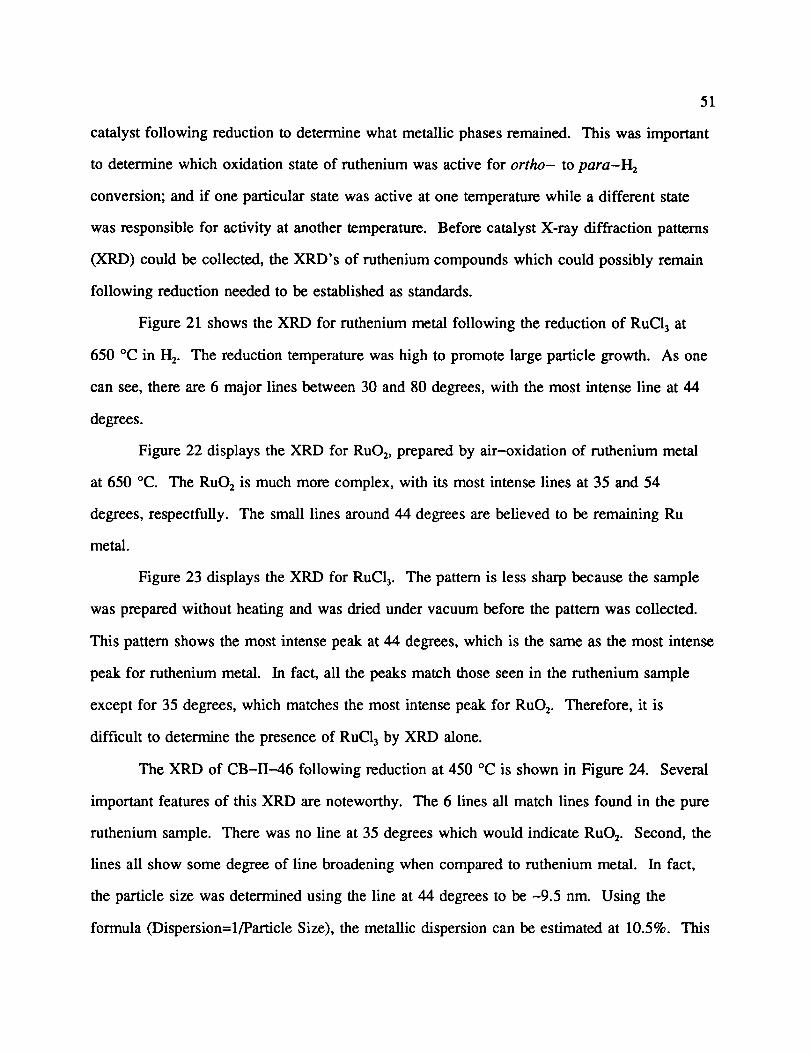
51
catalyst following reduction to determine what metallic phases remained. This was important
to determine which oxidation state of ruthenium was active for ortho- to para-I-I 2
conversion; and if one particular state was active at one temperature while a different state
was responsible for activity at another temperature. Before catalyst X-ray diffraction patterns
(XRD) could be collected, the XRD's of ruthenium compounds which could possibly remain
following reduction needed to be established as standards.
Figure 21 shows the XRD for ruthenium metal following the reduction of RuC13 at
650 °C in H 2. The reduction temperature was high to promote large particle growth. As one
can see, there are 6 major lines between 30 and 80 degrees, with the most intense line at 44
degrees.
Figure 22 displays the XRD for RuO2, prepared by air-oxidation of ruthenium metal
at 650 °C. The RuO2 is much more complex, with its most intense lines at 35 and 54
degrees, respectfully. The small lines around 44 degrees are believed to be remaining Ru
metal.
Figure 23 displays the XRD for RuC13. The pattern is less sharp because the sample
was prepared without heating and was dried under vacuum before the pattern was collected.
This pattern shows the most intense peak at 44 degrees, which is the same as the most intense
peak for ruthenium metal. In fact, all the peaks match those seen in the ruthenium sample
except for 35 degrees, which matches the most intense peak for RuO2. Therefore, it is
difficult to determine the presence of RuC1 a by XRD alone.
The XRD of CB-II-46 following reduction at 450 °C is shown in Figure 24. Several
important features of this XRD are noteworthy. The 6 lines all match lines found in the pure
ruthenium sample. There was no line at 35 degrees which would indicate RuO2. Second, the
lines all show some degree of line broadening when compared to ruthenium metal. In fact,
the particle size was determined using the line at 44 degrees to be -9.5 nm. Using the
formula (Dispersion=l/Particle Size), the metallic dispersion can be estimated at 10.5%. This
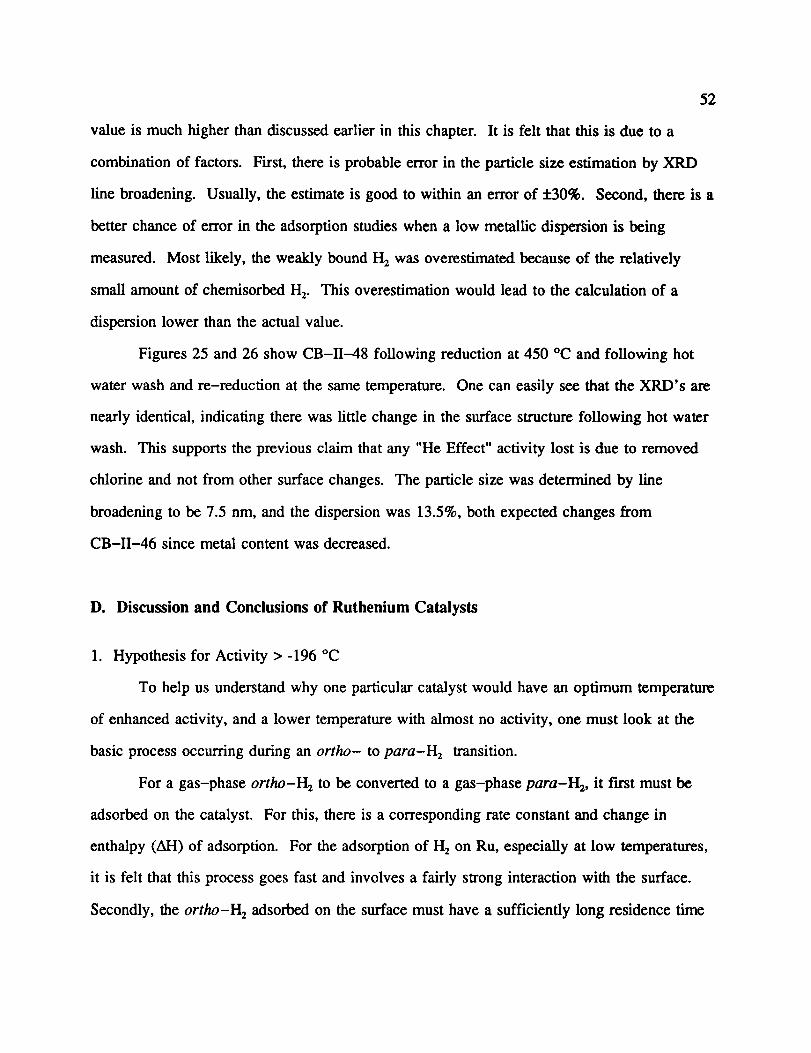
52
valueis much higher than discussed earlier in this chapter. It is felt that this is due to a
combination of factors. First, there is probable error in the particle size estimation by XRD
line broadening. Usually, the estimate is good to within an error of +30%. Second, there is a
better chance of error in the adsorption studies when a low metallic dispersion is being
measured. Most likely, the weakly bound H 2 was overestimated because of the relatively
small amount of chemisorbed lq2. This overestimation would lead to the calculation of a
dispersion lower than the actual value.
Figures 25 and 26 show CB-II-48 following reduction at 450 °C and following hot
water wash and re-reduction at the same temperature. One can easily see that the XRD's are
nearly identical, indicating there was little change in the surface structure following hot water
wash. This supports the previous claim that any "He Effect" activity lost is due to removed
chlorine and not from other surface changes. The particle size was determined by line
broadening to be 7.5 nm, and the dispersion was 13.5%, both expected changes from
CB-II-46 since metal content was decreased.
D. Discussion and Conclusions of Ruthenium Catalysts
1. Hypothesis for Activity > -196 °C
To help us understand why one particular catalyst would have an optimum temperature
of enhanced activity, and a lower temperature with almost no activity, one must look at the
basic process occurring during an ortho- to para-H 2 transition.
For a gas-phase ortho-H 2 to be converted to a gas-phase para-H 2, it first must be
adsorbed on the catalyst. For this, there is a corresponding rate constant and change in
enthalpy (AH) of adsorption. For the adsorption of H 2 on Ru, especially at low temperatures,
it is felt that this process goes fast and involves a fairly strong interaction with the surface.
Secondly, the ortho-H 2 adsorbed on the surface must have a sufficiently long residence time

53
to undergonuclearspin flip required for conversion to para-H 2 adsorbed on the surface.
Finally, this adsorbed para-H_ must desorb from the surface to a gas-phase para-H 2. The
desorption process has a rate constant associated with it as well. This complete process is
shown schematically in Figure 27. Since the adsorption of H 2 at low temperatures on a Ru
surface is fast, one can eliminate the first step as a factor. The second step, however is of
particular interest. It is known that as the temperature is lowered, the residence time of an
adsorbate on the surface increases. *° At a certain temperature, the H 2 will remain on the
surface for an optimal conversion time, followed by its desorption. But at lower
temperatures, the H_ will remain adsorbed on the surface even longer following conversion
from ortho- to para-H 2. This blocks the path for other gas-phase reactant o-H 2 to get to
the surface. It is felt that these molecules will adsorb as a subsequent layer atop the
pre-existing first layer. But as shown previously in the theoretical calculations for this
reaction, an increase in the radius of reactant H 2 molecules to the active metal by the
adsorbed layers, will cause an exponential decrease in the conversion for the upper layers.
It is felt that this same hypothesis applies for the silicate chemistry as well. However,
since the AH of adsorption is less for the metals in which silicates were prepared (Ni, Fe,
Mn), the residence time will be shorter than those associated with Ru at the same
temperature. In fact, it is quite possible that at a temperature lower than -196 °C, there will
be a maximum activity, as displayed for the Ru catalysts. However, since this study does not
allow for testing at temperatures colder than -196 °C, data which might support this
hypothesis were not available.
2. Hypothesis for "He Effect" Activity
The above explanation rationalizes why a traditional ruthenium catalyst will show a
maximum activity at a given temperature and how it is related to the rate of
desorption of the converted H 2 along with the AH of adsorption. A similar phenomenon can
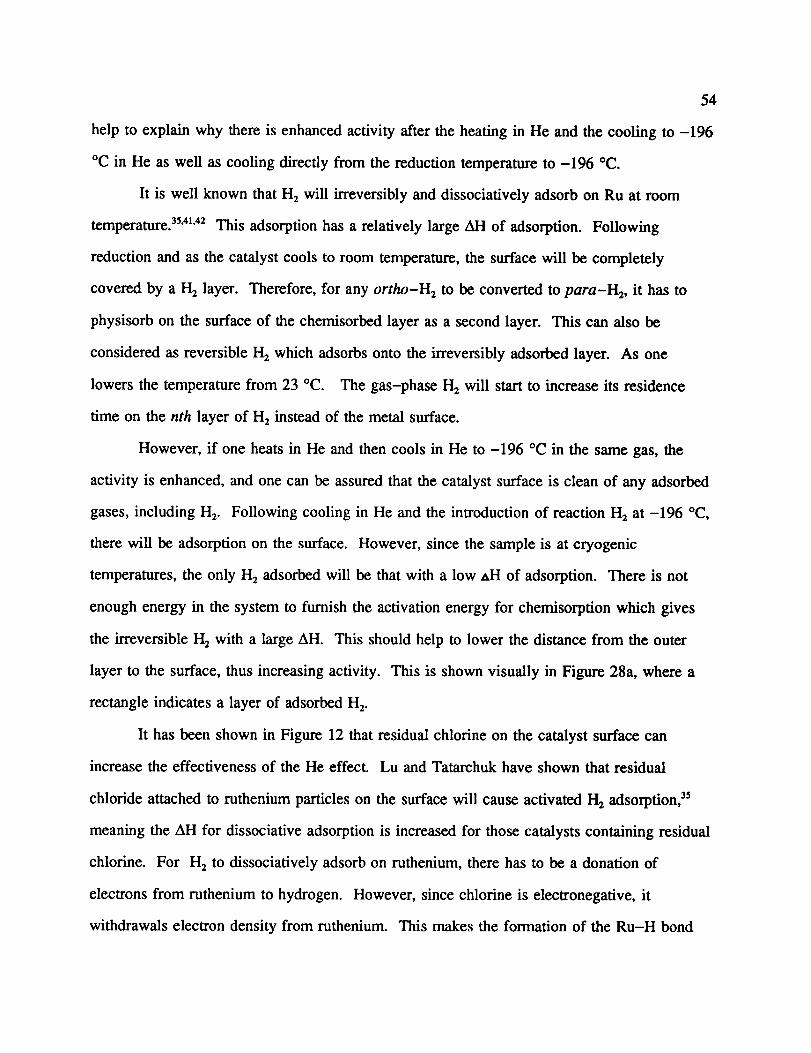
54
help to explain why thereis enhancedactivity after the heating in He and the cooling to -196
°C in He as well as cooling directly from the reduction temperature to -196 °C.
It is well known that H 2 will irreversibly and dissociatively adsorb on Ru at room
temperature. 35'41'42 This adsorption has a relatively large All of adsorption. Following
reduction and as the catalyst cools to room temperature, the surface will be completely
covered by a H 2 layer. Therefore, for any ortho-H 2 to be converted to para-H 2, it has to
physisorb on the surface of the chemisorbed layer as a second layer. This can also be
considered as reversible 1-12which adsorbs onto the irreversibly adsorbed layer. As one
lowers the temperature from 23 °C. The gas-phase H 2 will start to increase its residence
time on the nth layer of H 2 instead of the metal surface.
However, if one heats in He and then cools in He to -196 °C in the same gas, the
activity is enhanced, and one can be assured that the catalyst surface is clean of any adsorbed
gases, including H 2. Following cooling in He and the introduction of reaction H2 at -196 °C,
there will be adsorption on the surface. However, since the sample is at cryogenic
temperatures, the only H 2 adsorbed will be that with a low M-I of adsorption. There is not
enough energy in the system to furnish the activation energy for chemisorption which gives
the irreversible 1-I2 with a large AH. This should help to lower the distance from the outer
layer to the surface, thus increasing activity. This is shown visually in Figure 28a, where a
rectangle indicates a layer of adsorbed H2.
It has been shown in Figure 12 that residual chlorine on the catalyst surface can
increase the effectiveness of the He effect Lu and Tatarchuk have shown that residual
chloride attached to ruthenium particles on the surface will cause activated 1-12adsorption, a5
meaning the AH for dissociative adsorption is increased for those catalysts containing residual
chlorine. For H 2 to dissociatively adsorb on ruthenium, there has to be a donation of
electrons from ruthenium to hydrogen. However, since chlorine is electronegative, it
withdrawals electron density from ruthenium. This makes the formation of the Ru-H bond
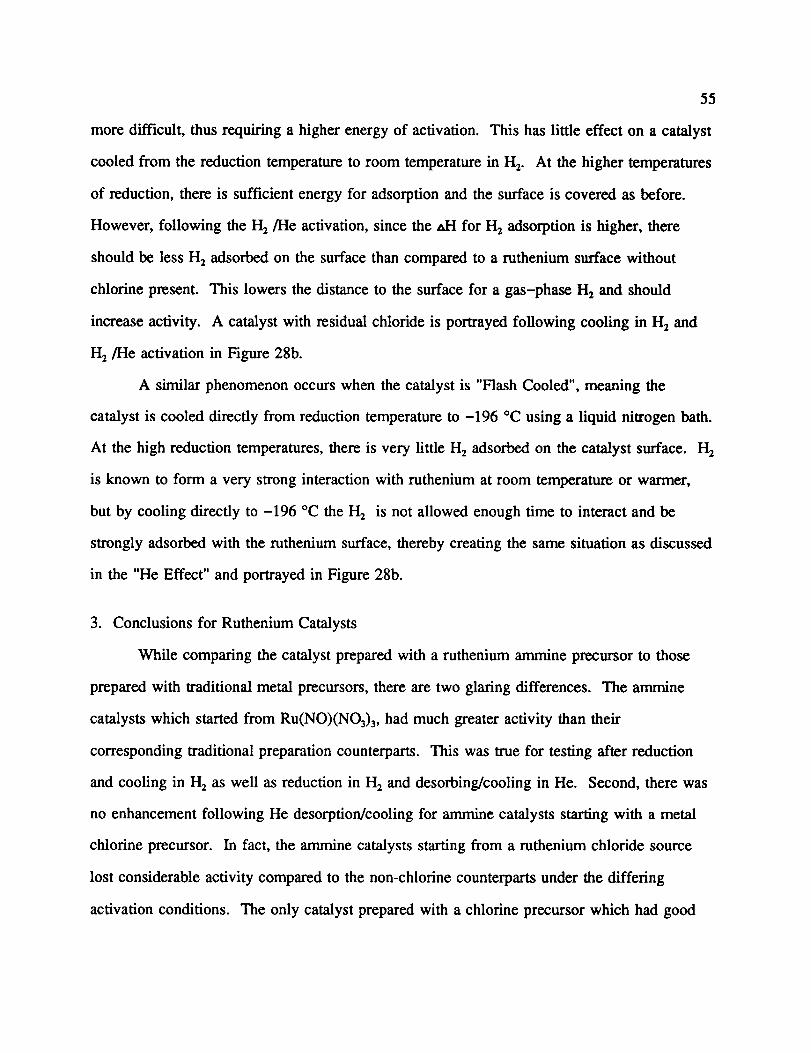
55
moredifficult, thusrequiring a higherenergyof activation. This haslittle effect on a catalyst
cooled from the reduction temperature to room temperature in H 2. At the higher temperatures
of reduction, there is sufficient energy for adsorption and the surface is covered as before.
However, following the 1-12/He activation, since the n/-I for H e adsorption is higher, there
should be less H 2 adsorbed on the surface than compared to a ruthenium surface without
chlorine present. This lowers the distance to the surface for a gas-phase H 2 and should
increase activity. A catalyst with residual chloride is portrayed following cooling in H 2 and
H 2/He activation in Figure 28b.
A similar phenomenon occurs when the catalyst is "Flash Cooled", meaning the
catalyst is cooled directly from reduction temperature to -196 °C using a liquid nitrogen bath.
At the high reduction temperatures, there is very little H 2 adsorbed on the catalyst surface. 1-12
is known to form a very strong interaction with ruthenium at room temperature or warmer,
but by cooling directly to -196 °C the H 2 is not allowed enough time to interact and be
strongly adsorbed with the ruthenium surface, thereby creating the same situation as discussed
in the "He Effect" and portrayed in Figure 28b.
3. Conclusions for Ruthenium Catalysts
While comparing the catalyst prepared with a ruthenium ammine precursor to those
prepared with traditional metal precursors, there are two glaring differences. The ammine
catalysts which started from Ru0NO)(NO3)3, had much greater activity than their
corresponding traditional preparation counterparts. This was true for testing after reduction
and cooling in H 2 as well as reduction in H 2 and desorbing/cooling in He. Second, there was
no enhancement following He desorption/cooling for ammine catalysts starting with a metal
chlorine precursor. In fact, the ammine catalysts starting from a ruthenium chloride source
lost considerable activity compared to the non-chlorine counterparts under the differing
activation conditions. The only catalyst prepared with a chlorine precursor which had good
56
activity was CB-I-130 in which the chlorine was removed prior to drying of the catalyst.
When asking the question of why the two preparation methods yield such different
results, one must look at the basic differences between the two. It is known that traditional
Ru catalyst have relatively low surface areas, usually with a maximum dispersion of 0.2 at
low metal loadings? °'43 Dispersions for these ammine catalysts have exceeded 0.3 with
dispersions up to 0.6 to 0.8 reported for catalysts with lower metal loadings. It is felt that
with the higher dispersions possible using an ammine precursor, more active sites are
available per unit mass, to convert more ortho-H2 to para-H2. Even though there is a "He
Effect" on the ammine catalysts, which indicates that 1-12poisoning is occurring on the
surface, there are more active sites on the ammine catalyst's surface to get poisoned. If the
surface of an ammine catalyst is poisoned the same amount as a traditional catalyst, the
ammine catalyst should have a higher activity due just to more active sites. This discussion
of activity increasing with higher dispersion would suggest that ortho- to para-H 2
interconversion is a structure sensitive reaction, meaning the rate of the reaction is directly
related to the changes in particle size and dispersion.
The addition of chlorine via the use of a chloride containing precursor completely
deactivates the catalyst. Removal of chlorine using a hot water wash has little effect on this
deactivation. Alternatively, if the chloride is removed prior to the drying of the catalyst, the
activity is the same as if the chlorine was never present.
There are several possible arguments to explain the observation. Lu and Tatarchuk
state that there are two possible reasons that chlorine may act to cause activated adsorption. TM
Since the formation of a Ru-H bond requires donation of electrons from the Ru to the
gas-phase H 2, electronegative chlorine will cause a decrease in the local electron density of
the ruthenium, thereby increasing the activation energy to form that bond. Alternatively, the
chlorine may act as a geometric barrier in which it inhibits the surface movement of 1-12and
imposes a kinetic barrier on the adsorption process.

57
In the caseof the traditional preps, it was stated earlier that an electronic effect is
occurring. A small chlorine atom is sitting on a much larger Ru cluster that is perturbing the
electronics, but not blocking the path of a H 2 to an active sites. In the case of the more
highly dispersed ammine catalyst, the geometric explanation is more logical. A chlorine sits
on a much smaller Ru cluster, thereby blocking most of the ruthenium sites from the H 2.
Lu and Taterchuk also stated that the electronic effects were more pronounced for a
more highly dispersed surface. 3_' Another possible explanation is that the activation energy
becomes too great for an interaction between the surface and a reactant H 2. Without a surface
interaction, the distance between the surface and H2 would be large, decreasing activity.
A third possible alternative explaination would be that the presence of chlorine during
the drying process causes the formation of a very poor catalyst, one with a very low metallic
surface area. This will be discussed in more detail within the next section.
4. Conclusions of Physical Characterization
Conclusions made from the active gas adsorption study are: 1) The dispersion of the
ammine precursor catalysts without chlorine are greater than traditional catalysts, independent
of preparation technique; 2) The ammine chlorine precursor catalysts have decreased
dispersions and decreased activities, relative to all catalysts; 3) The traditional catalysts, both
with and without chlorine, have further decreased dispersions but activities greater than
ammine chlorine precursor catalysts; 4) For the ammine precursor catalysts, if chlorine is
removed prior to drying, the catalyst is as active as the non-chlorine catalysts.
Several conclusions can be made from the low temperature magnetic susceptibility
studies. First, there is little variation of magnetic susceptibility with temperature for
ruthenium catalysts. Second, bulk ruthenium catalysts can show diamagnetic behavior.
Third, for the most part ruthenium catalysts showed lower magnetic susceptibilities than
nickel silicate. Finally, there is little correlation between a high magnetic susceptibility and

58
high activity. Therefore,it wasconcludedthat magneticsusceptibilityis not a major factor in
determiningcatalyticactivity or helpingto explain 13.'
Severalconclusionscanbemadefrom the XRD study. The metal rutheniumwas
determinedto be the major, (if not the only) oxidation stateof rutheniumpresentin the
catalyststested. Therutheniumlines of a reducedcatalystwere broadened,indicating smaller
particlesizes. The amountof this broadeningwasdependentuponmetal loading.
Dispersionscalculatedfrom theseparticle sizeswerehigher thanby othermethods,most
likely due to interferencecausedby the silica support.

IV. CONCLUSION
59
The main goal of this study was to develop and improve on existing catalysts for the
conversion of ortho- to para-hydrogen. Starting with a commercially available Air Products
nickel silicate, which had a 1_value of 20, we were trying to synthesize catalysts that would
be an improvement to AP. This was accomplished by preparing silicates with various metals
as well as different preparation methods. We also prepared supported ruthenium catalysts by
various techniques using several metal precursors to improve present technology. What was
also found was that the activation conditions prior to catalytic testing was highly important
for both the silicates and the supported ruthenium catalysts.
While not the initial focus of the research, we made some interesting observations into
the adsorption of H 2 on ruthenium. This helped us to get a better understanding of how
ortho- to para-H 2 conversion takes place, and what features in a catalyst are important to
optimize activity.
Reactor design was the final area in which some interesting conclusions were drawn.
As discussed earlier, the reactor catalyst bed must be constructed using straight 1/8" OD
stainless steel tubing. It was determined that the use of 1/4" OD tubing caused two problems.
First, the radius from the center of the bed to the wall was too great for thermal equilibrium.
Since the reaction of ortho- to para-H 2 is exothermic, the catalyst bed center was warmer
than the edges. Second, the catalyst bed was too shallow using a 1/4" tube. This caused
reactant blow-by which was thought to decrease the measured activity when the flow rate
was increased. The 1/8" tube corrected both of these concerns.
While preparing and testing the transition metal silicates, some interesting conclusions
were drawn. It was first concluded that nickel was the best candidate for preparing metal
silicates. All other metal silicates had much lower activities relative to AP nickel. It was
also observed that by increasing the catalyst activation temperature in He from 150 °C to 300

60
°C, and by decreasing the activation time from 4 h to 2 h, the 13decreased from 20 to 15.7.
By refluxing in 2,2-DMP, a 13of 16 could be achieved in 40 min. It is felt that the increased
activity is the result of increased dehydration of the catalyst. This can increase activity in
two possible ways. First, increased dehydration causes decreased catalyst weight, which
would essentially mean there are more active sites per unit mass. Second, by removal of
adsorbed water, the _ would have a clearer path to an active site. The H2 molecule should
also have a shorter distance to an active site, which should increase activity.
It was also concluded that an increase in the total pore volume and total surface area
of a silicate correspond to an increase in activity. Subsequent modifications in the catalyst
prep, which included washing and refluxing the catalyst in MeOH, as well as preparing the
catalyst in an ethylene glycol solution, all increased total pore volume. The 13value
decreased from 17.1 to 11.0 following all modifications. The increase in pore volume is
thought to promote the mass transport of H2 through the catalyst particle, which should
increase the ease of a reactant H 2 molecule to reach the surface and be converted. An
increase in total surface area could increase the number of active sites which in turn, should
increase activity.
However, that ruthenium supported on silica was the most active catalyst for the
conversion of ortho- to para-H2. Following reduction for 4 h at 450 °C in H2, it was found
that a 13' of 3.3 at -158 °C was obtained. This activity varied slightly with metal precursors.
The catalysts prepared using a ruthenium precursor containing chlorine were slightly more
active than those prepared without chlorine. The activity also varied with metal content. The
activity increased with increasing metal content for all catalysts, until a maximum metal
content was achieved. It is believed that the maximum metal loading is between 8 and 10
percent by weight.
As stated before, the activity was dependent upon the activation conditions. By
heating the catalyst in He following reduction and by cooling the catalyst to -196 °C in He
61
prior to 1-12introduction, a 13value of between 8 and 15 was obtainable for traditional
ruthenium catalysts prepared using a metal precursor containing chlorine. For a catalyst
prepared with a non-chlorine containing precursor, or a catalyst in which the chlorine was
washed out, the "He Effect" 13increased by up to a factor of 4.
As stated earlier, there axe two hypotheses which explain why the traditional
ruthenium catalysts have an optimal temperature for maximum ortho-Hz conversion, and why
there is a "He Effect" and why chlorine containing precursors give increased H2/lie
activation activity. The maximum activity at an optimal temperature is believed to be
controlled by the rate of desorption of an H 2 molecule after it has been converted from the
ortho-H_ to para-H2 form. It is felt that the residence time of the adsorbed H2 molecule
increases as the temperature decreases. At a certain temperature, -158°C for the traditional
ruthenium catalysts, there is an optimal residence time for conversion from ortho- to para-
H 2. As the temperature decreases and the residence time increases, it is felt that the adsorbed
para-H_ blocks the path to the surface for incoming ortho-H 2 and subsequently lowers the
rate of conversion and activity of the catalyst.
The "He Effect" is believed to be simply caused by an adsorption/desorption
phenomenon of the reactant hydrogen. H2 is known to disassociatively chemisorb on
ruthenium at room temperature. The heating of the catalyst to 350 °C or greater in He will
desorb the surface of chemisorbed 1-I2; by cooling to -196 °C in He prior to reactant H2
exposure will help to keep the irreversible chemisorption of H2 to a minimum. This will
reduce the distance for an incoming H 2 molecule to the surface, which should increase the
rate of conversion.
The use of a chlorine containing ruthenium precursor increases the "He Effect" by the
presence of residual chlorine on the catalyst surface following reduction. Residual chlorine, an
electronegative element, is known to withdraw local electron density from the ruthenium
surface. Since the disassoeiative chemisorption of hydrogen requires the donation of electrons

62
from the surface ruthenium to the hydrogen to form a Ru-H bond, the presence of chlorine
should increase the activation energy and make that Ru-H bond harder to form. Therefore,
following the H 2 activation and after the catalyst has been cooled to -196 °C in He, it should
be even harder to form a Ru-H bond. This should lower the number of chemisorbed
hydrogens on the surface and increase the rate of ortho- to para-H 2 conversion at -196 °C.
This is caused by the decrease in the distance between a gas-phase H 2 molecule and the
surface, as well as open more active sites for physisorption.
Another class of ruthenium catalysts were prepared, this time through the impregnation
of a Ru r_ ammine complex, prepared by the hydrazine reduction of various previously used
ruthenium salts. This preparation technique is known to create a highly dispersed ruthenium
surface, something that is known to be hard to accomplish on silica support by standard
impregnation techniques and with common ruthenium precursor salts.
The activity at -196 °C of the ammine precursor catalyst class, in which the
ruthenium ammine was prepared using Ru(NO)(NO3)3, was greatly increased, as was the
metallic dispersion of the catalysts when compared to other traditional ruthenium catalysts
preps. This catalyst class was highly active following both the normal reduction and cooling
in H 2, as well as following the H 2/He activation. Since this class of catalyst is more highly
dispersed, there are more active sites available for ortho- to para-H 2 conversion, thus
causing an increased "He Effect". This increased dispersion will affect the activity of a
catalysts in which there was no _ desorption prior to testing. Since there is a higher
dispersion, there will be a greater number of "H 2 poisoned" ruthenium sites than a similar
catalyst prepared with traditional impregnation techniques. If the degree of poisoning is
consistent for both classes of catalysts, the ammine precursor catalysts should have higher
activity, and experimentally, this is the case.
The increased dispersion also affected the measurement of I_'. As noted earlier, the
difference between the maximum detector response and the detector response at -196 °C was

63
normally less than a 20% increase. It is also felt that the temperature at which this maximum
ortho-H 2 conversion occurs is at a temperature lower than the -158 °C measured for a
traditional catalyst. It would appear that the smaller ruthenium particle size that is associated
with a more highly dispersed surface, decreases the temperature at which there is an optimal
hydrogen residence time on the surface for ortho- to para-H_ conversion. However, since
this temperature is colder than -160 °C, an accurate temperature was not recorded.
With traditional ruthenium catalysts, it was found that the use of a chlorine containing
ruthenium precursor increased the catalytic activity at -196 °C. This was not the case,
however, for ruthenium catalysts prepared through the ruthenium ammine precursor
intermediate. It was found that the activity at -196 °C, as well as the activity at temperatures
warmer, dropped dramatically from the other ruthenium ammine precursor catalysts prepared
with a non-chlorine containing precursor. If the chlorine was remove prior to catalyst drying
and reduction, the catalyst was as active as if chlorine was never present. But if chlorine was
removed following the drying/reduction of the catalyst, the activity was poor. There are
several possible explanations for this. First, the chlorine can block the path of reactant H 2 to
the surface. This effect would be more pronounced for the smaller particles of a more highly
dispersed surface. Second, smaller ruthenium particles can increase the effect of chlorine on
the Ru-H interaction. It may weaken the interaction such that the residence time for a
reactant ortho-H 2 molecule is short so that the H 2 is not on the surface long enough for
conversion to take place. Finally, the presence of chlorine while preparing an ammine
precursor catalyst makes a poor catalyst.
In this study, we were able to understand some of the properties in catalyst preparation
as well as catalyst activation conditions that yield high rates of ortho- to para-I-I_
conversion. From the study of both metal silicates and impregnated ruthenium silica
catalysts, it was concluded that catalytic activity increased with the total number of active
sites. With the ruthenium catalysts, information about the properties of H 2 adsorption on a
64
rutheniumsurface,aswell as the effect of residual chlorine on this adsorption process were
ascertained by the study of catalytic activity. Further investigation into this topic may include
optimizing the preparation method of the ruthenium ammine precursor catalyst, as well as
further investigation into the ammine precursor catalysts by physical characterization.

Table 1. Impregnationof Air Productsby Fe(NOa)3
65
Sample Metal Conc.
CB-I-18 0.1 M
CB-I-19 0.2 M
CB-I-20 1.0 M
CB-I-21 1.0 M
CB-I-24 0.2 M
CB-I-25 0.5 M
CB-I-27 0.1 M (MeOH)
CB-I-28 1.0 M (MeOH)
CB-I-22 1.0 M Cr(NO3)3
ImpregnationTime
4h
4h
2h
12h
20 min
2h
2h
2h
2h
Table 2. Impregnation of Fe(NO3) 3 on CB-I-9M
S_ole Metal Conc.
CB-I-14 0.1 M
CB-I-15 0.2 M
CB-I-16 0.3 M
CB-I-17 0.4 M
Impregnation
Time
2h
2h
2h
2h
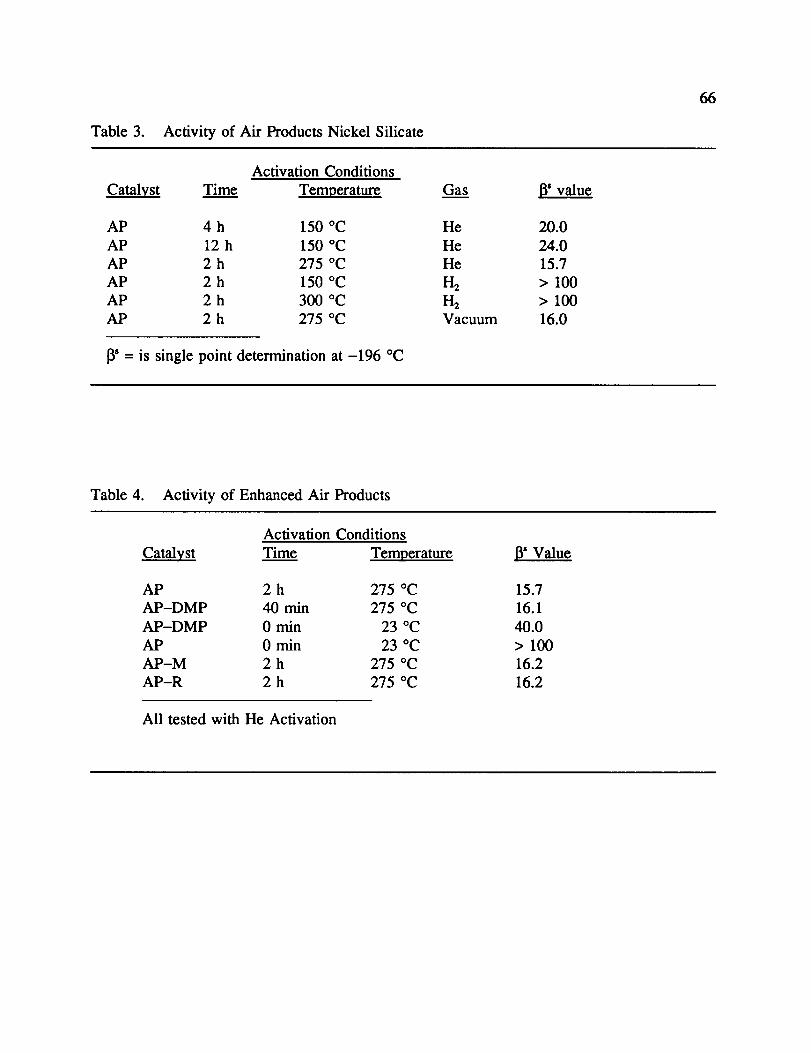
Table 3. Activity of Air Products Nickel Silicate
66
Activation Conditions
Catalyst Time Temperature
AP 4 h 150 °C
AP 12 h 150 °C
AP 2 h 275 °C
AP 2 h 150 °C
AP 2 h 300 °C
AP 2 h 275 °C
13s = is single point determination at -196 °C
Ga.._s
He
He
He
H2
H2Vacuum
_s value
20.0
24.0
15.7
> 100
> 100
16.0
Table 4. Activity of Enhanced Air Products
Activation Conditions
Catalyst Time Temperature lY Value
AP 2 h 275 °C 15.7
AP-DMP 40 min 275 °C 16.1
AP-DMP 0 min 23 °C 40.0
AP 0 min 23 °C > 100
AP-M 2 h 275 °C 16.2
AP-R 2 h 275 °C 16.2
All tested with He Activation
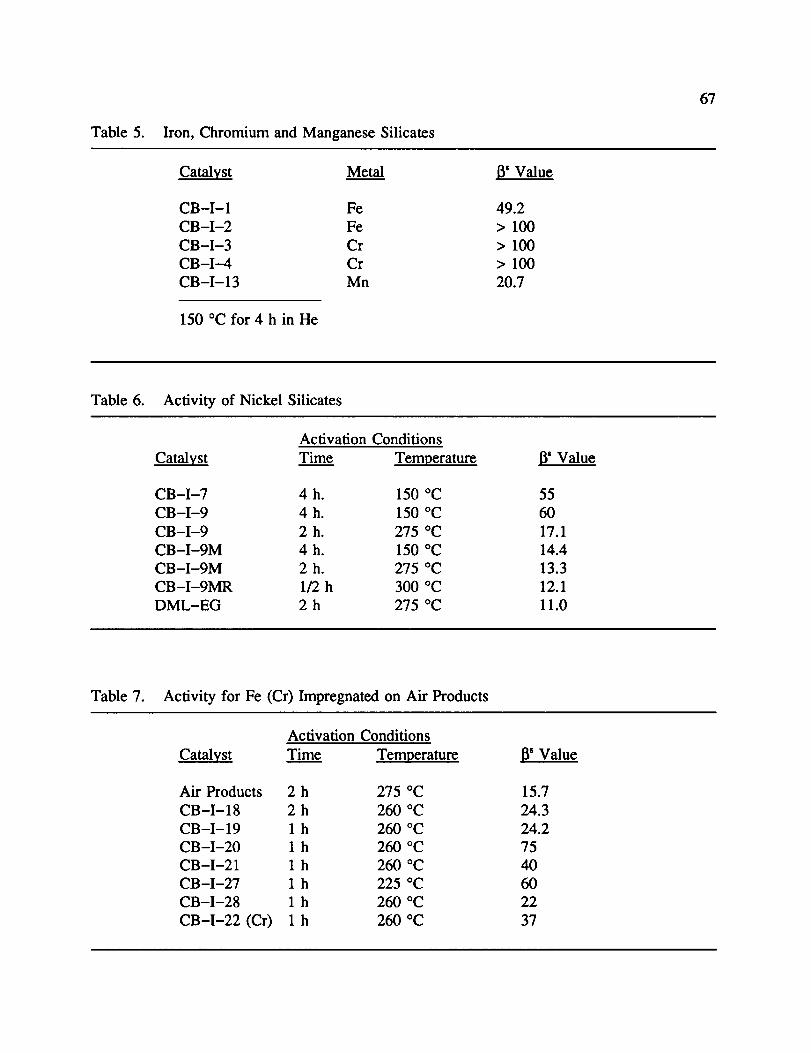
Table 5. Iron, ChromiumandManganeseSilicates
67
Catalyst Metal 13' Value
CB-I-1 Fe 49.2
CB-I-2 Fe > 100
CB-I-3 Cr > 100
CB-I-4 Cr > 100
CB-I-13 Mn 20.7
150 °C for 4 h in He
Table 6. Activity of Nickel Silicates
Activation Conditions
Catalyst Time Temperature
CB-I-7 4 h. 150 °C
CB-I-9 4 h. 150 °C
CB-I-9 2 h. 275 °C
CB-I-9M 4 h. 150 °C
CB-I-9M 2 h. 275 °C
CB-I-9MR 1/2 h 300 °C
DML-EG 2 h 275 °C
13' Value
55
60
17.1
14.4
13.3
12.1
11.0
Table 7. Activity for Fe (Cr) Impregnated on Air Products
Activation Conditions
Catalyst Time Temperature
Air Products 2 h 275 °C
CB-I-18 2 h 260 °C
CB-I-19 1 h 260 °C
CB-I-20 1 h 260 °C
CB-I-21 1 h 260 °C
CB-I-27 1 h 225 °C
CB-I-28 1 h 260 °C
CB-I-22 (Cr) 1 h 260 °C
13' Value
15.7
24.3
24.2
75
40
60
22
37
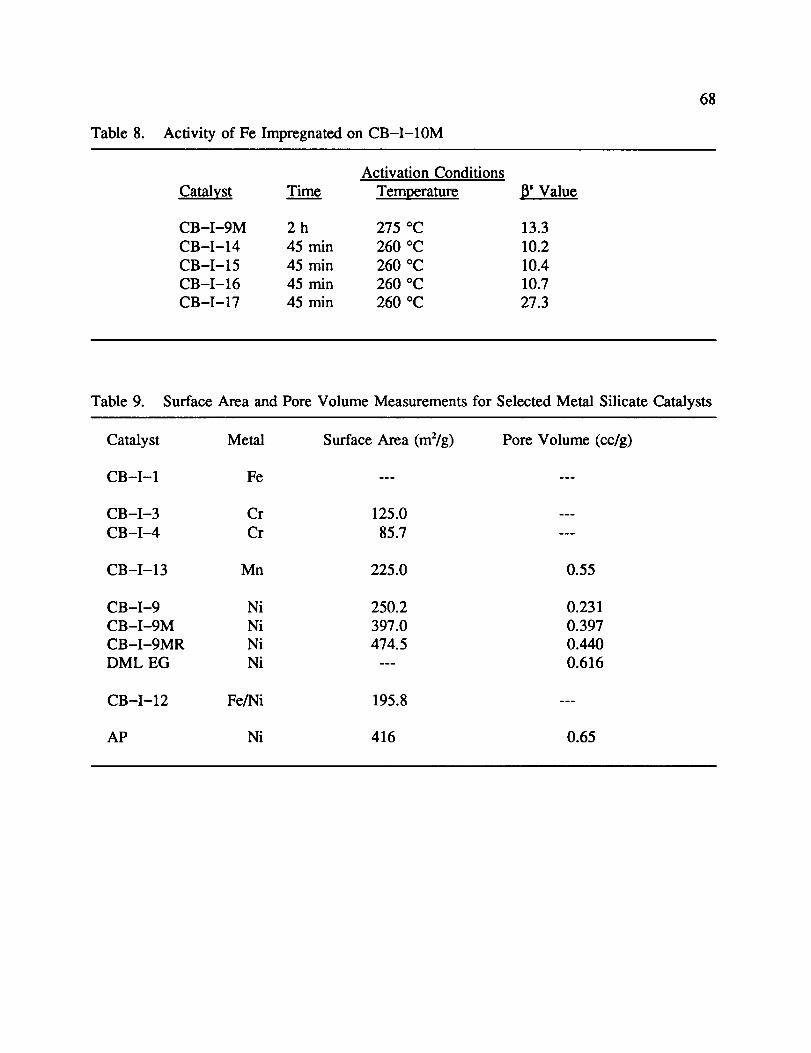
Table 8. Activity of Fe Impregnatedon CB-I-10M
68
Activation Conditions
Catalyst Time Temperature lY Value
CB-I-9M 2 h 275 °C 13.3
CB-I-14 45 min 260 °C 10.2
CB-I-15 45 rain 260 °C 10.4
CB-I-16 45 min 260 °C 10.7
CB-I-17 45 min 260 °C 27.3
Table 9. Surface Area and Pore Volume Measurements for Selected Metal Silicate Catalysts
Catalyst Metal Surface Area (m2/g)
CB-I-1 Fe ---
CB-I-3 Cr 125.0
CB-I-4 Cr 85.7
CB-I-13 Mn 225.0
CB-I-9 Ni 250.2
CB-I-9M Ni 397.0
CB-I-9MR Ni 474.5
DML EG Ni ---
CB-I-12 Fe/Ni 195.8
AP Ni 416
Pore Volume (cc/g)
0.55
0.231
0.397
0.440
0.616
0.65
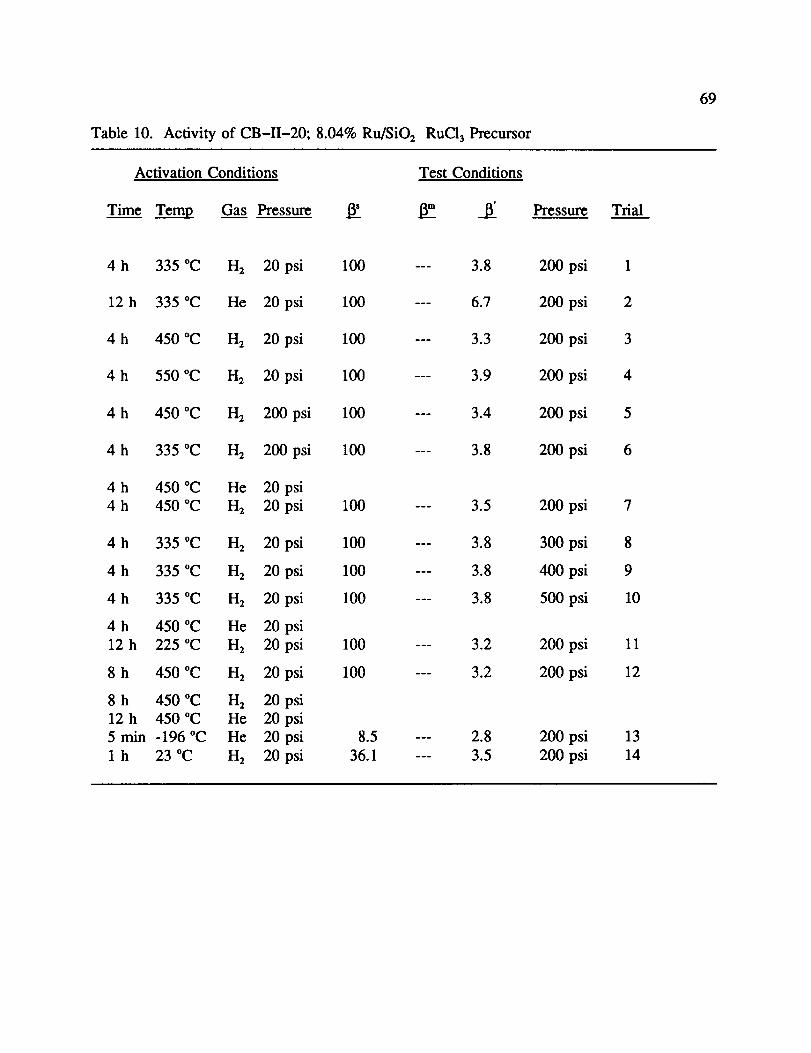
Table 10. Activity of CB-II-20; 8.04% Ru/SiOz RuC1 a Precursor
69
Activation Conditions
Time TemE Gas Pressure
Test Conditions
a- a Pressure Trial
4 h 335 °C H 2 20 psi 100 --- 3.8
12 h 335 °C He 20 psi 100 --- 6.7
4 h 450 °C H 2 20 psi 100 --- 3.3
4 h 550 °C H 2 20 psi 100 --- 3.9
4 h 450 °C H 2 200 psi 100 --- 3.4
4 h 335 °C H 2 200 psi 100 --- 3.8
4h 450°C He 20 psi
4 h 450 °C n 2 20 psi 100 --- 3.5
4 h 335 °C H 2 20 psi 100 --- 3.8
4 h 335 °C H 2 20 psi 100 --- 3.8
4 h 335 °C H 2 20 psi 100 --- 3.8
4h 450°C He 20 psi
12 h 225 °C H 2 20 psi 100 --- 3.2
8 h 450 °C H 2 20 psi 100 --- 3.2
8h 450°C H 2 20 psi
12h 450°C He 20 psi
5 min -196 °C He 20 psi 8.5 --- 2.8
1 h 23 °C n 2 20 psi 36.1 --- 3.5
200 psi
200 psi
200 psi
200 psi
200 psx
200 psi
200 psi
300 psi
400 psi
500 psi
200 psi
200 psi
200 psi
200 psi
1
2
3
4
5
6
7
8
9
10
11
12
13
14

Table 11. Activity of CB-II-72
70
Activation Conditions Test Conditions
Time TemR Gas Pressure 13' __ Pressure Trial
4h. 450°C H 2 20 psi
Iso-pentane slurry
45 5.9 250 psi
3.7 250 psi
1
2
4h. 4500C H 2 20 psi
Cooled at 100 °C in H 2
4h. 4500C H 2 20 psi
Cooled at 350 °C in H 2
43.4
30.8 44.0
6.9 250 psi
5.9 250 psi
3
4
20h. 450°C H2 20 psi
Cooled at 350 °C in H 2 40.6 55.3 5.2 250 psi 5
4h. 450°C H2 20 psi
1.5 h. 450 °C He 20 psi
5min.-1960C He 20 psi 16.6 26.0
_' indicates single point measurement at -196°C
_m indicates multi point measurement at -196°C
13' indicates single point measurement at -158°C
5.4 250 psi 6
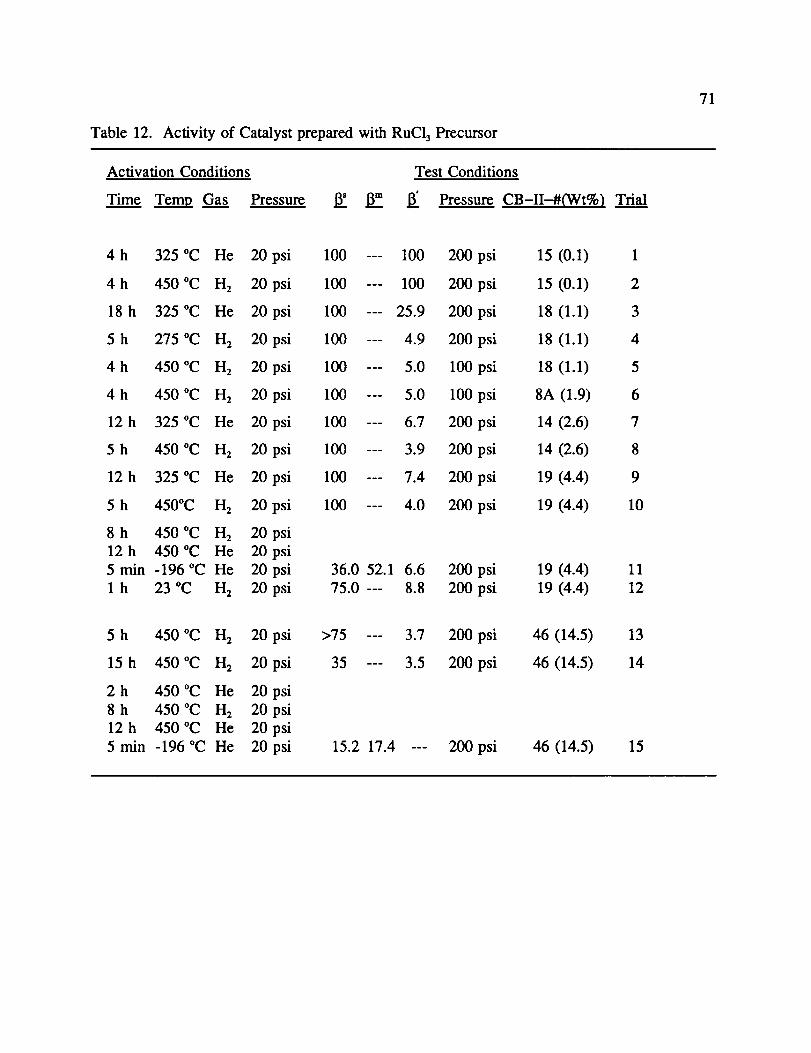
Table 12. Activity of Catalystpreparedwith RuC13Precursor
71
Activation Conditions
Time Tem R Gas Pressure
Test Conditions
___ _ ff Pressure CB-II-#(Wt%) Trial
4h 325°C He 20psi
4 h 450 °C H 2 20 psi
18h 325°C He 20psi
5h 275°C H 2 20psi
4 h 450 °C H 2 20 psi
4 h 450 °C H 2 20 psi
12 h 325 °C He 20 psi
5 h 450 °C H 2 20 psi
12 h 325 °C He 20 psi
5 h 450°C H 2 20 psi
8h 450°C H2 20psi
12h 450°C He 20 psi
5rain -196°C He 20 psi
1 h 23°C H 2 20 psi
5 h 450 °C H 2 20 psi
15 h 450 °C H 2 20 psi
2h 450°C He 20 psi
8h 450°C H 2 20 psi
12h 450°C He 20 psi
5min -196°C He 20 psi
100 --- 100
100 --- 100
100 --- 25.9
100 --- 4.9
100 --- 5.0
100 --- 5.0
100 --- 6.7
100 --- 3.9
100 --- 7.4
100 --- 4.0
200 psi
200 psi
200 psi
200 psi
100 psx
100 psi
200 psi
200 psi
200 psi
200 psi
36.0 52.1 6.6 200 psi
75.0 --- 8.8 200 psi
>75 --- 3.7
35 --- 3.5
15.2 17.4 ---
200 psi
200 psi
200 psi
15 (0.1) 1
15 (0.1) 2
18 (1.1) 3
18 (1.1) 4
18 (1.1) 5
8A (1.9) 6
14 (2.6) 7
14 (2.6) 8
19 (4.4) 9
19 (4.4) 10
19 (4.4) 11
19 (4.4) 12
46 (14.5) 13
46 (14.5) 14
46 (14.5) 15
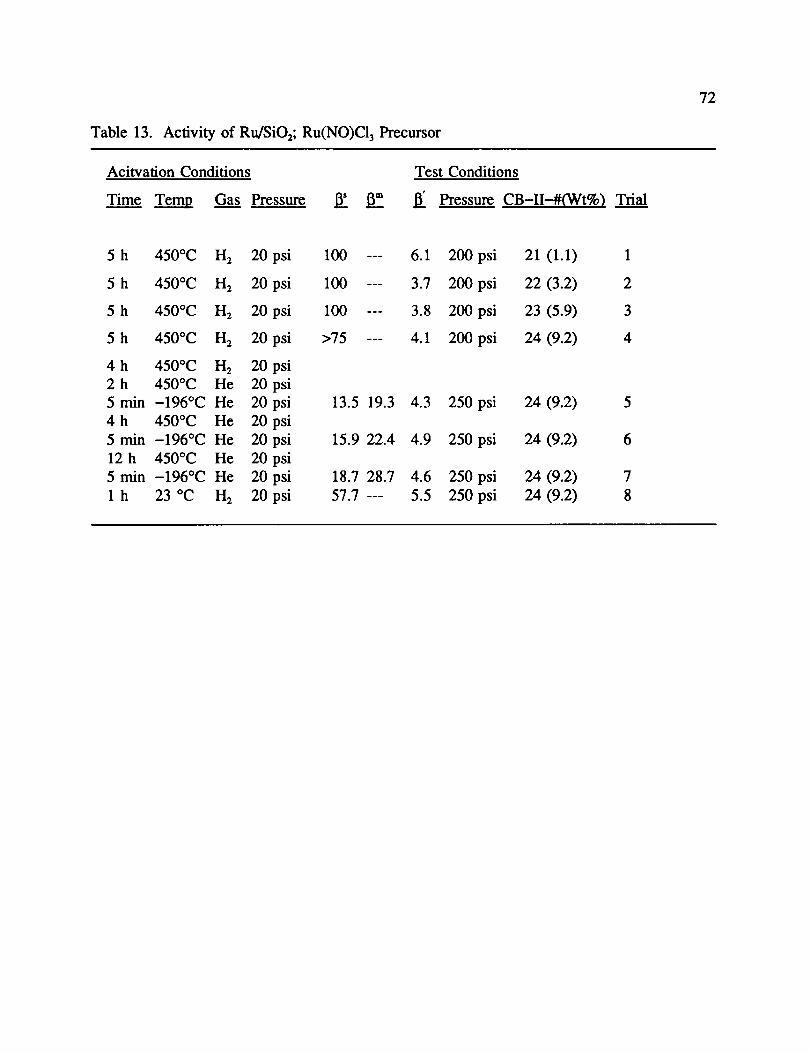
Table 13. Activity of Ru/SiO2; Ru(NO)C13 Precursor
72
Acitvation Conditions
Time Temo Gas Pressure
Test Conditions
ff Pressure CB-II-#(Wt%) Trial
5 h 450°C H 2 20
5 h 450°C H 2 20
5 h 450°C H 2 20
5 h 450°C H 2 20
4 h 450°C H2 20
2 h 450°C He 20
5 min -196°C He 20
4 h 450°C He 20
5 rain -196°C He 20
12h 450°C He 20
5 rain -196°C He 20
1 h 23 °C H 2 20
psi
psi
psi
psi
psi
psi
psl
psi
psl
pst
ps_
psi
100
100
100
>75
13.5 19.3 4.3
15.9 22.4 4.9
18.7 28.7 4.6
57.7 --- 5.5
6.1 200 psi 21 (1.1) 1
3.7 200 psi 22 (3.2) 2
3.8 200 psi 23 (5.9) 3
4.1 200 psi 24 (9.2) 4
250 psi 24 (9.2) 5
250 psi 24 (9.2) 6
250 psi 24 (9.2) 7
250 psi 24 (9.2) 8
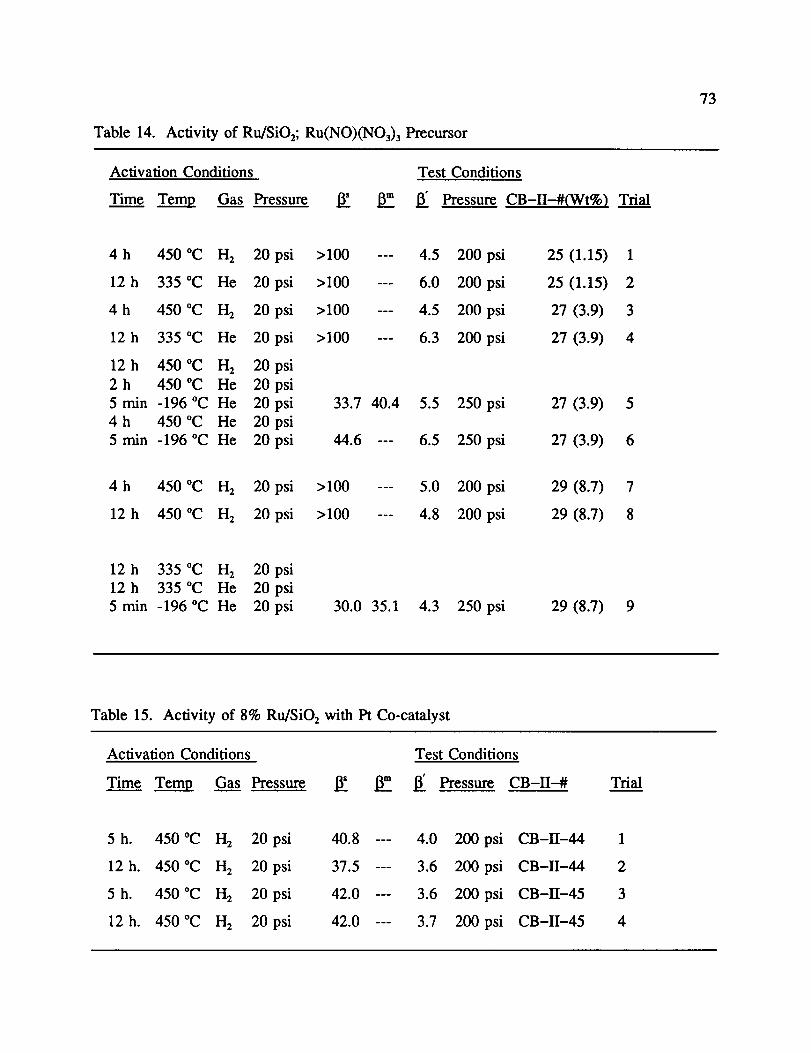
Table 14. Activity of Ru/SiO2; Ru(NO)(NO3) 3 Precursor
73
Activation Conditions
Time Temo Gas Pressure
Test Conditions
B' Pressure CB-II-#(Wt%) Trial
4h 450°C H 2 20 psi
12h 335°C He 20 psi
4 h 450 °C H 2 20 psi
12h 335°C He 20 psi
12h 450°C H 2 20 psi
2h 450°C He 20 psi
5min -196°C He 20 psi
4h 450°C He 20 psi
5min -196°C He 20 psi
4 h 450 °C H 2 20 psi
12 h 450 °C H 2 20 psi
>100
>100
>100
>100
33.7 40.4 5.5
44.6 --- 6.5
>100 --- 5.0
>100 --- 4.8
4.5 200 psi 25 (1.15) 1
6.0 200 psi 25 (1.15) 2
4.5 200 psi 27 (3.9) 3
6.3 200 psi 27 (3.9) 4
250 psi 27 (3.9) 5
250 psi 27 (3.9) 6
200 psi 29 (8.7) 7
200 psi 29 (8.7) 8
12 h 335 °C H 2 20 psi
12h 335°C He 20 psi
5min -196°C He 20 psi 30.0 35.1 4.3 250 psi 29 (8.7) 9
Table 15. Activity of 8% Ru/SiO 2 with Pt Co-catalyst
Activation Conditions
Time Temla Gas Pressure 15'
Test Conditions
ff Pressure CB-II-# Trial
5 h. 450 °C H 2 20 psi 40.8 ---
12h. 450°C H 2 20 psi 37.5 ---
5 h. 450 °C H 2 20 psi 42.0 ---
12h. 450°C H 2 20 psi 42.0 ---
4.0 200 psi CB-II-44 1
3.6 200 psi CB-II-44 2
3.6 200 psi CB-II-45 3
3.7 200 psi CB-II-45 4
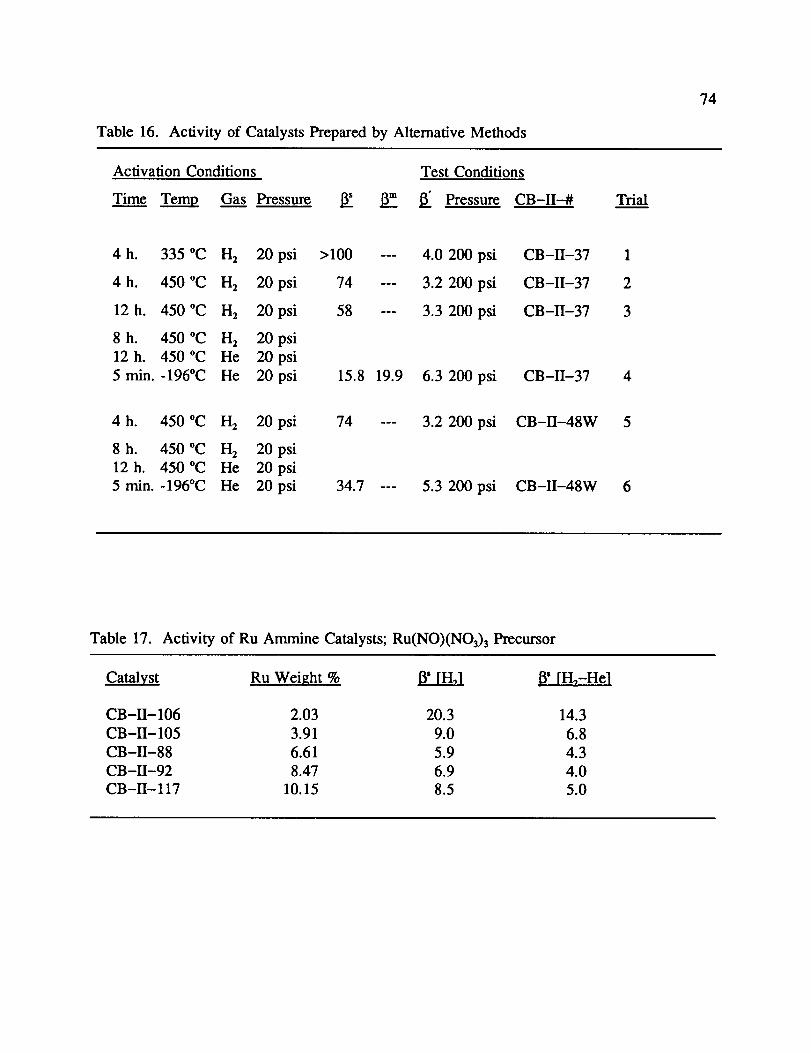
Table 16. Activity of Catalysts Prepared by Alternative Methods
74
Activation Conditions Test Conditions
Time Teml! Gas Pressure _ _ {3' Pressure CB-II-# Trial
4 h. 335 °C H 2 20 psi >100 --- 4.0 200 psi CB-II-37
4 h. 450 °C H 2 20 psi 74 --- 3.2 200 psi CB-II-37
12 h. 450 °C H 2 20 psi 58 --- 3.3 200 psi CB-II-37
8h. 450°C H 2 20 psi
12h. 450°C He 20 psi
5 min. -196°C He 20 psi 15.8 19.9 6.3 200 psi CB-II-37
1
2
3
4
4 h. 450 °C H 2 20 psi 74 --- 3.2 200 psi CB-II-48W
8h. 450°C H 2 20 psi
12h. 450°C He 20 psi
5 min. -196°C He 20 psi 34.7 --- 5.3 200 psi CB-II-48W
5
6
Table 17. Activity of Ru Ammine Catalysts; Ru(NO)(NO3) a Precursor
Catalyst Ru Weight % B' [H,-He]
CB-II-106 2.03 20.3 14.3
CB-II-105 3.91 9.0 6.8
CB-II-88 6.61 5.9 4.3
CB-II-92 8.47 6.9 4.0
CB-II- 117 10.15 8.5 5.0
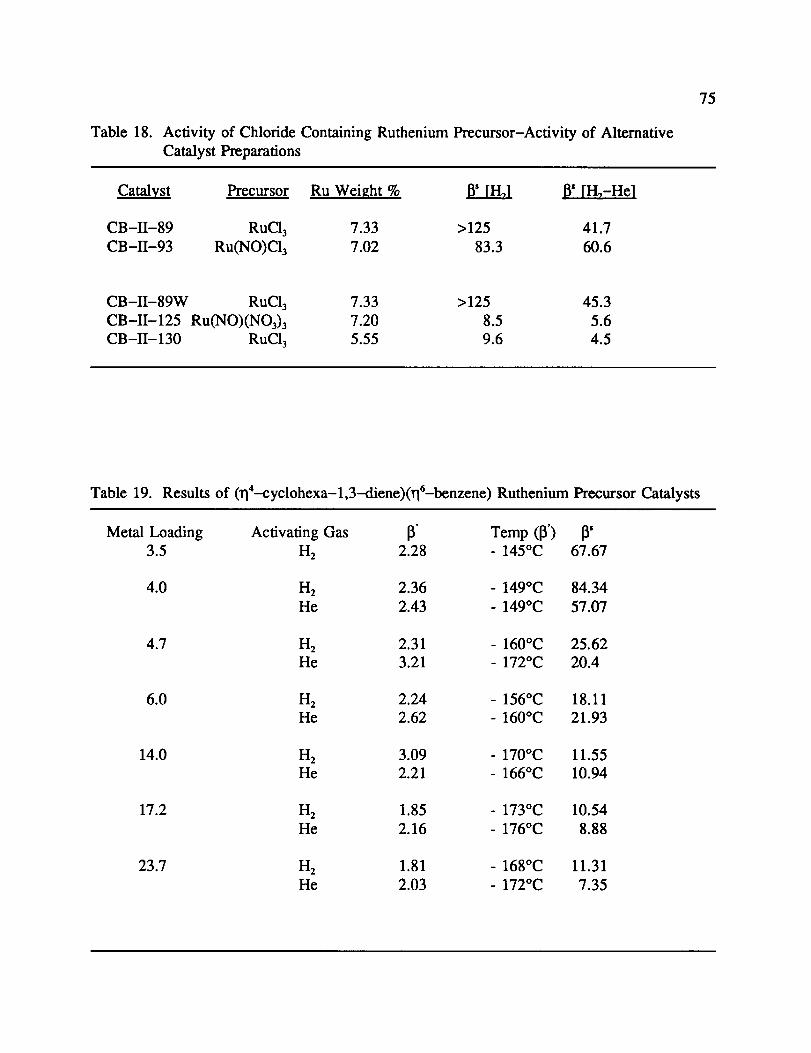
75
Table 18. Activity of Chloride Containing Ruthenium Precursor-Activity of Alternative
Catalyst Preparations
Catalyst Precursor Ru Weight % _ B* [H,-HeI
CB-II-89 RuC13 7.33 > 125 41.7
CB-II-93 Ru(NO)C13 7.02 83.3 60.6
CB-II-89W RuC13 7.33 > 125 45.3
CB-II-125 Ru(NO)(NO3)3 7.20 8.5 5.6
CB-II-130 RuC13 5.55 9.6 4.5
Table 19. Results of (_4--cyclohexa-l,3-diene)(rlt-benzene) Ruthenium Precursor Catalysts
Metal Loading Activating Gas lY Temp (if) _*
3.5 H 2 2.28 - 145°C 67.67
4.0 H 2 2.36 - 149°C 84.34
He 2.43 - 149°C 57.07
4.7 H2 2.31 - 160°C 25.62He 3.21 - 172°C 20.4
6.0 H2 2.24 - 156°C 18.11He 2.62 - 160°C 21.93
14.0 H 2 3.09 - 170°C 11.55He 2.21 - 166°C 10.94
17.2 H 2 1.85 - 173°C 10.54He 2.16 - 176°C 8.88
23.7 H 2 1.81 - 168°C 11.31He 2.03 - 172°C 7.35
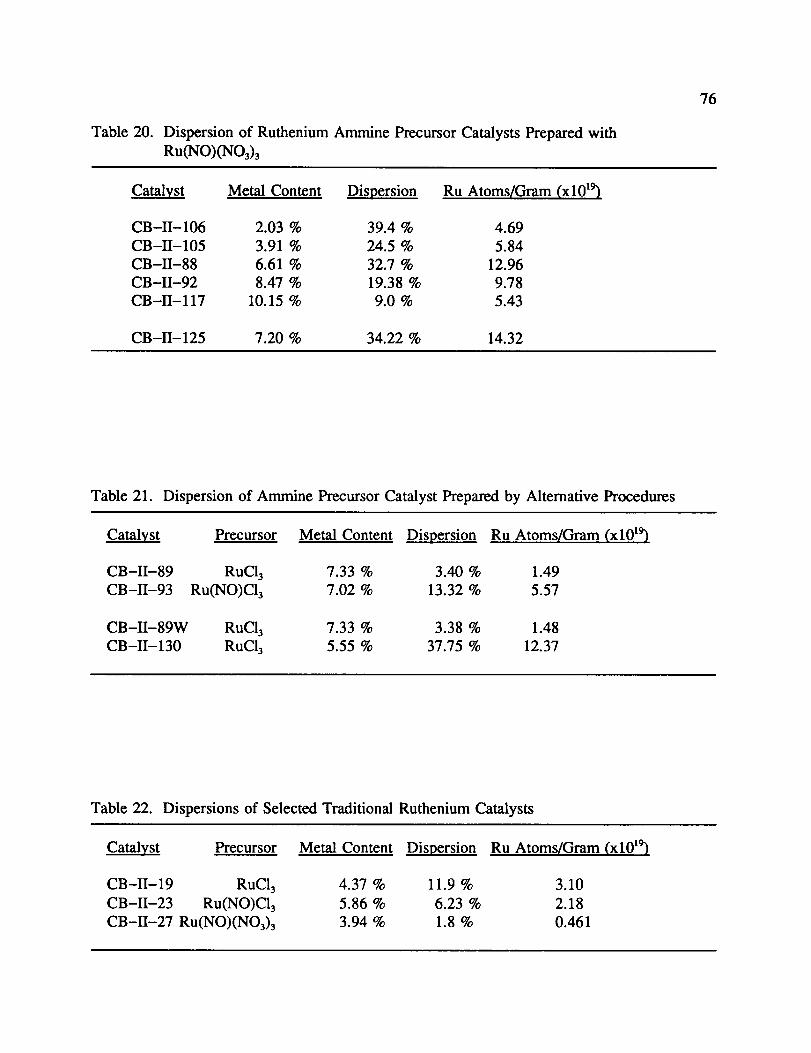
Table 20. Dispersion of Ruthenium Ammine Precursor Catalysts Prepared with
Ru(NO)(NO3)3
76
Catalyst Metal Content Dispersion Ru Atoms/Gram (xl019)
CB-II-106 2.03 % 39.4 % 4.69
CB-II-105 3.91% 24.5 % 5.84
CB-II-88 6.61% 32.7 % 12.96
CB-II-92 8.47 % 19.38 % 9.78
CB-II-117 10.15 % 9.0 % 5.43
CB-II-125 7.20 % 34.22 % 14.32
Table 21. Dispersion of Ammine Precursor Catalyst Prepared by Alternative Procedures
Catalyst Precursor Metal Content Dispersion Ru Atoms/Gram (xl019)
CB-II-89 RuC13 7.33 % 3.40 % 1.49
CB-II-93 Ru(NO)C13 7.02 % 13.32 % 5.57
CB-II-89W RuC1 a 7.33 % 3.38 % 1.48
CB-II-130 RuC13 5.55 % 37.75 % 12.37
Table 22. Dispersions of Selected Traditional Ruthenium Catalysts
Catalyst Precursor
CB-II-19 RuC13
CB-II-23 Ru(NO)C13
CB-II-27 Ru(NO)(NO3) 3
Metal Content Dispersion Ru Atoms/Gram (xl0 _9)
4.37 % 11.9 % 3.10
5.86 % 6.23 % 2.18
3.94 % 1.8 % 0.461

77
Ortho-H2
(S = 1)
_Para-_[ 2
c_c_
_[3+
(s = o) aO- _c_
Figure 1. Schematic of the Degeneracy of the Two Forms of Hydrogen

?8
0v--I
I I
_ OO_ oo
_0
I I I I I
O C_ Q Q 0 _
O
!
Qv,==l
!
0
v==l!
OO(',1
!
0
!
00
!
0
©
C_
_J
_JC_
_J
!
_S
"0c:
0
0° ,..=_
°,._c_0C_
E0
E
.,=._
°,.=_
r,i
LT.,

79
2.20
i 2.06
1.92
1.78
_ 1.64
1.50200 240 280 320 360 400
Temperature (K)
Figure 3. Thermal Conductivities of H2vs. Temperature (,, ortho- • para-
Reference H2;
75 % Ortho 25 % Para
TCD
Catalyzed H 2
(75% - C) Ortho; (25% + C) Para
Maximum: 50%-Ortho 50%-Para
Figure 4. Simplified Schematic for Detection of ortho- and para-H2Compositions.
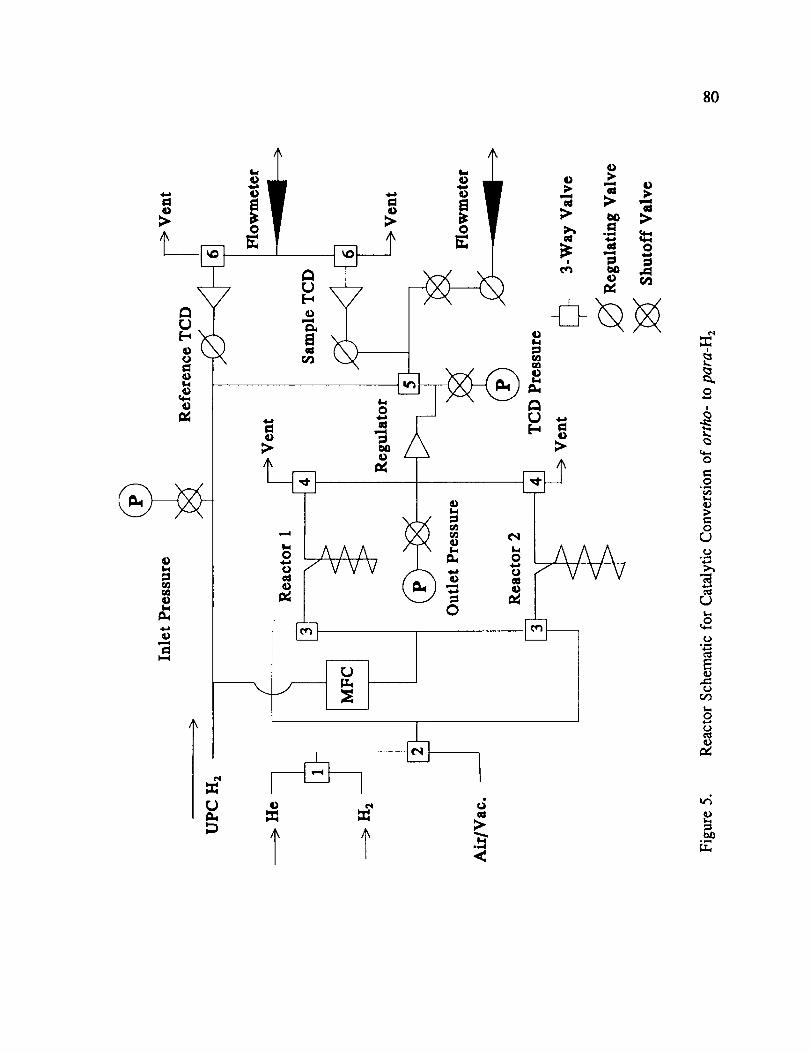
80
4.a
t--E
o
_)
_D
_DI-i
N
o
O
Ill4)
O
u_\7
I.I
hi
0
-Io AAA
VVV
r_
O
4,) e_
4..II:1
_1 AAA.o VV
i
0
o
oo
O
O
C2
o
oo_D
_4
°_,,_

81
r-
H 2 Out
<
H 2 In
J"-1
]Catalyst Bed
Figure 6. Reactor Tube Assembly 1; Without Thermocouple

82
5
/6
1) VCR Plug
2) VCR Nut
3) VCR Gland
4) 1/4" SwtgelokTee
5) 1/4" to 1/8" Swagelok Union
6) 1/4" to 1/8" Swagelok Reducer
7) Stainless Thermoeouple Manifold
8) Thermoeouple Assembly
9) 3/8" to 1/8" Swagelok Union
Catalyst Bed
< 8
Figure 7. Reactor Tube Assembly 2; Bent Thermocouple

83
Catalyst
Bed
1 I
r-- l °
3 --------__ H2 In I
8
I--!
!!
6
I) VCR Plug
2) VCR Nut
3) VCR Gland
4) I/4" Swtgelok Tee
5) I/4 ° to II8" Swallelok Union
6) 318" to I18" Swltgelok Reducer
7) Sta/nleu Thermoeouple Manifold
8) Thermocouple Assembly
H2 Out
Figure 8. Reactor Tube Assembly 3; Straight Thermocouple

\
5
\6
Figure 9.
Thermoeouple 1
Thermoeouple 2
I14" Swagelok Tee
I/4" to I/8" Swagelok Union
I/4" Swagelok Weld Elbow
Stainless Thermoeouple Manifold
Catalyst Bed
84

85
0
4
4
I I I I I
(_1o_) _{TAI.IOV
0
0
e-,•,,..,s
o
O ¢u
E{
0
0
H
1.-,
o
),,,.¢
o,,.,¢
o
z
o
0,...,
d
o
0,m,,q
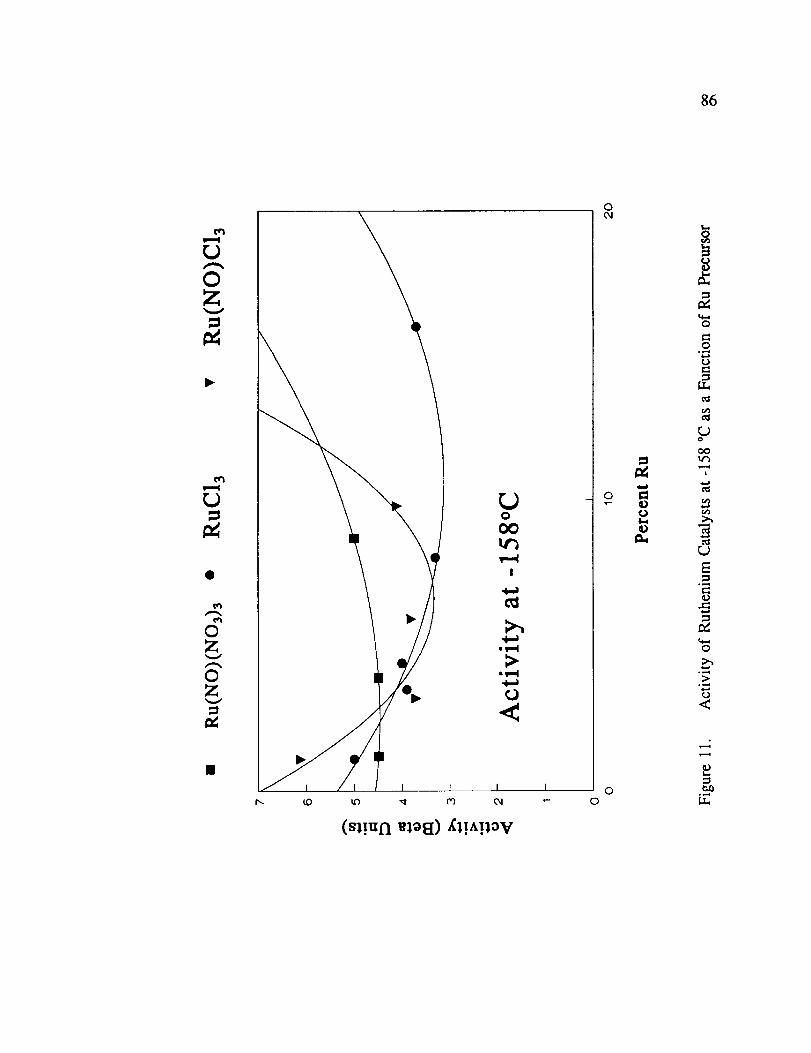
86
0Z
C_
OZ
0Z
t
0Od
_ ov-
OO
U
0
0
O
L_c_
0Qt_
i
O

87
)
_r
oZv
o
I i i I
Lo o _ o_o N 0
v-
(moO) Ll!^!_aV
t.O
0
,,t:t-
r_
i(D
mr_
m.!¢q
+
ct_
o
m
)
o'x
i
>
U
<
m
o
o
B
o
t.l-I
o,i
(O
em

88
0Z
O_
t_t
0X
0X
0_
_0
O 0 O0 O 0 Qt '_ _,0 _ _
I
O0ol
0
oo
v,,,.4
!
• _,,,4
I
Q
0
00
0
t-tot,tj
0x:,,._..t
oz
0_°_
Q,..J
<..,
=go _
•_ U.,•___ _
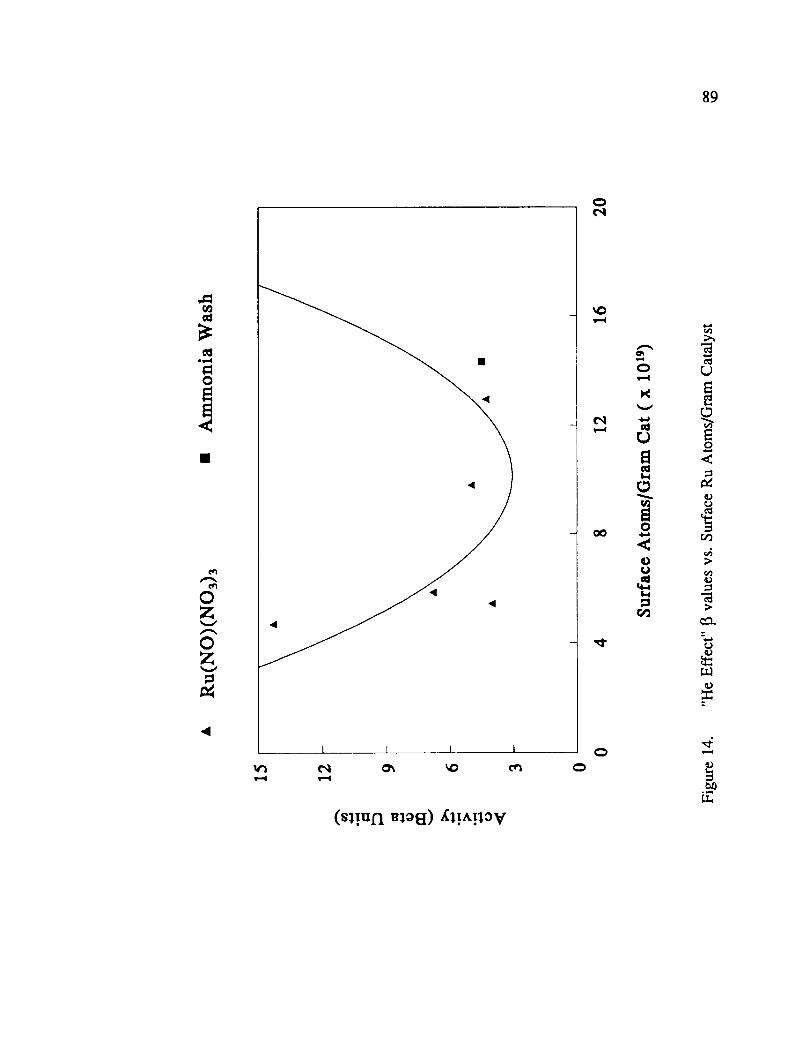
89
0Z
0X
4
I I I I
(sl!u.l'! _lolt) _(1)A!lOV
t_
E
c_o
oo ,,.i uo
0 >
r_

90
0
($/rtma f-OI x) L_!I!q!_da_srt S
0
0e_
Oo0
0
e,I0
ro
a
o
t_
t:a.
_6
o
<
t.#
<
o
o..._
°,.._
oq
e-
t_0°=-t

91
eel
I-(t,0l x) AC1!l!q!Ida_su S
C_C_
OC'4v-.¢
O_ 'gl"
i,,,-I
O
v...¢
C__ 00
C_c'4
O
LI
gl
II
If,
ElG
[..¢
I,.¢
g_
4,..l0..-¢
• !..._
o_..¢
t_
k..¢
j...¢
¢....¢
. ,...1
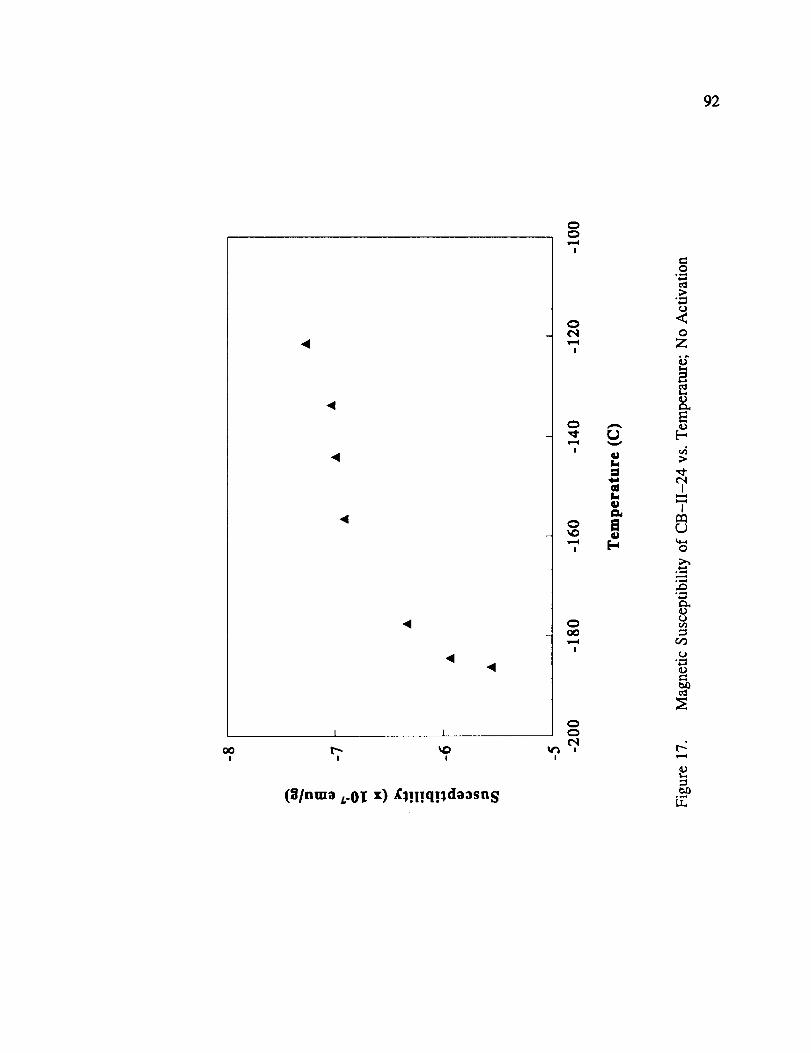
92
4
i I
oO t _ _D! ! I !
(_/nma L-OI x) £_!l!q!_da:_sn S
Q
0¢,4
0,q.
1==11
0o0
0¢'4
qgL.
alt__g
¢g
0
u<0
z
g
I
I
O
° ,..,.q
. .....q
e_° ,....q

93
!
4
4
I I I I
I I I I
(_/nma I:0I x) Ll.q!q!ldo:)sn S
0
0
0
0o
0
!
ro
0
t..t
0
0
0
ee-t
01,._
0_
t..¢
F-,
I
I
O
o,,.¢
°,.._
,.oo,"4
t_
t/J
z.)
t_0et:t
0_
tmo,,,,q
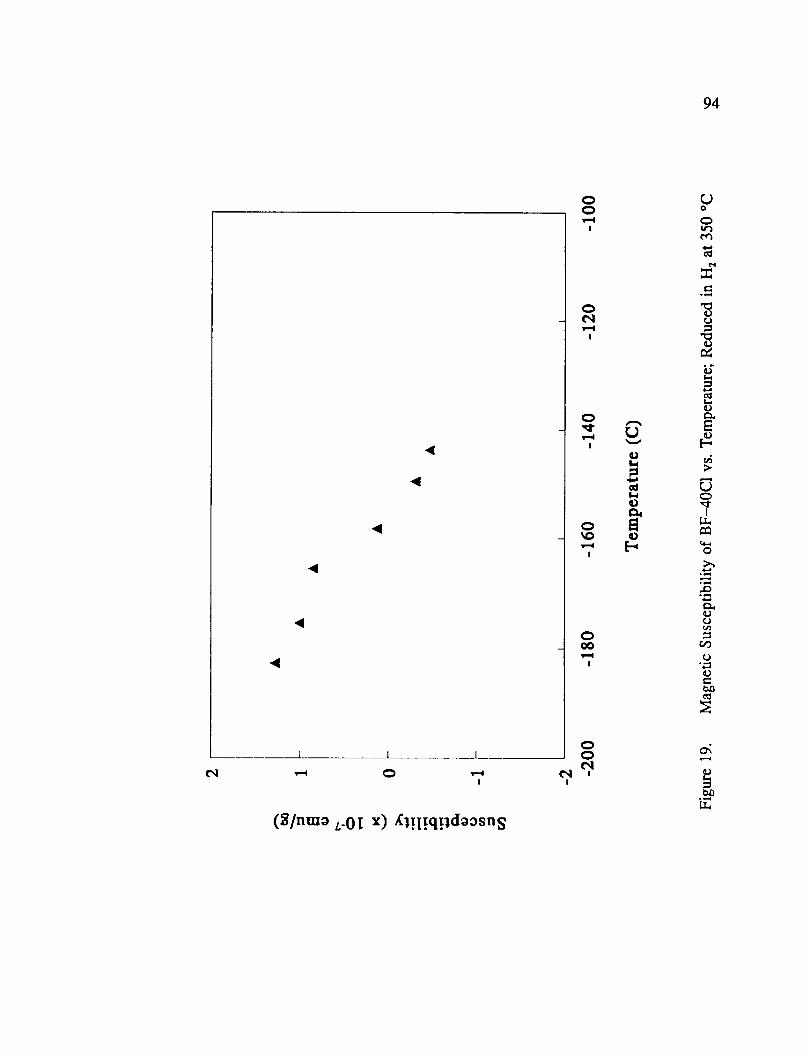
94
eq
4
I I I
!
(8/nma vOI x) gl!i!q!lda0sn S
eq!
O
s=,,4
eq
o
00o
oOeq
¢1
t)
o
tt_ee_
°g,,_
0(9
g
E
M
7
o
°f=,l,.Q
e_
°,,_

95
4
4
1 I
(2/nm0 _0[ x ),_ilIqi_d00sn S
0s,==4
0¢'4
0
s,-=4
O0
cqO
A
rov
$=1
n$1,4
F-,
o
ro
<oz
p..v=-4
I
o
°,=_
o
¢0
o
d¢,q
t:a3°_

96
,I,I,I,I,IAI,I,I,I,
0 0 0 0 0 0 0 0 0 0 00 _ _ _ _ 0 _ _ _
00,i..=
0O_
0GO
Olv
L_
0 (I)
0I¢)
C)
0¢0
¢)
E
¢)
c}
X
U_
(s]Jul3/_JeJJJqJv) _l!sue_ul

97
'I'I'I'I I'l'l |'I0
0
®C_v
Q_
lb.
C_
o r_
(s_un/_JeJi!qJv)_;!sueJ, Ul
o"
o
X
c,ic,I
L_
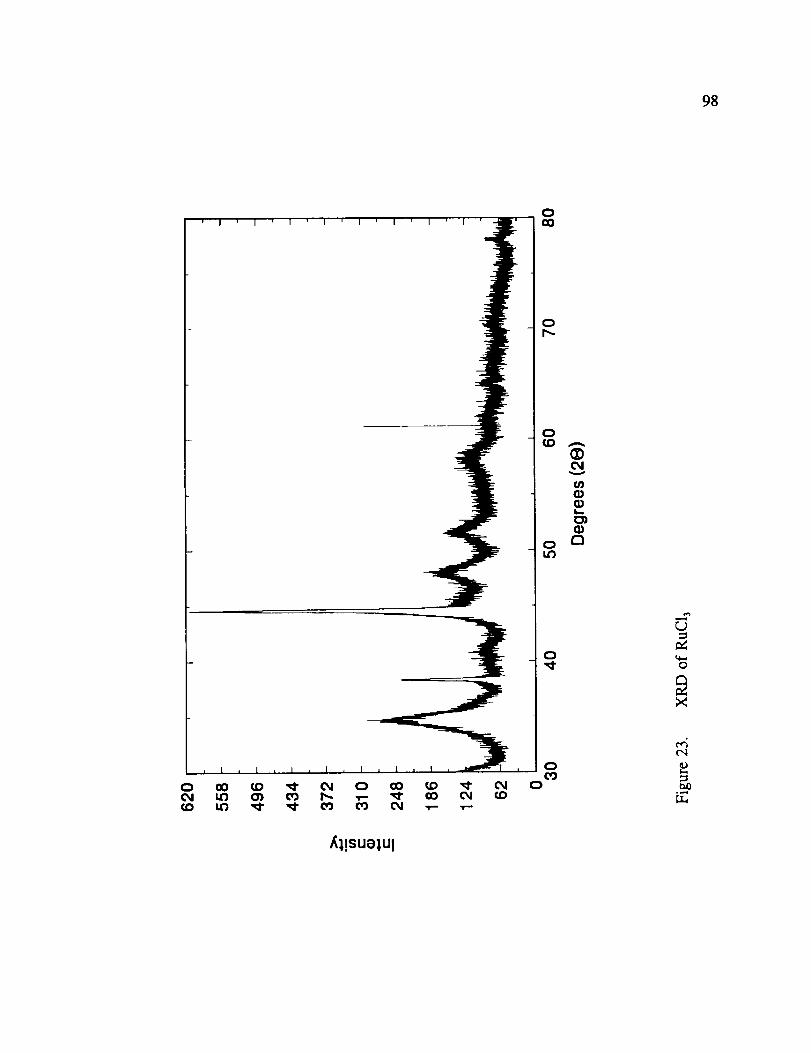
98
cO
0(JD
®O_
v
¢/)
(Pt=.=
o r'_M3
cJ
o
c'q
_0.=,4
LT_
,_l!sue)ul
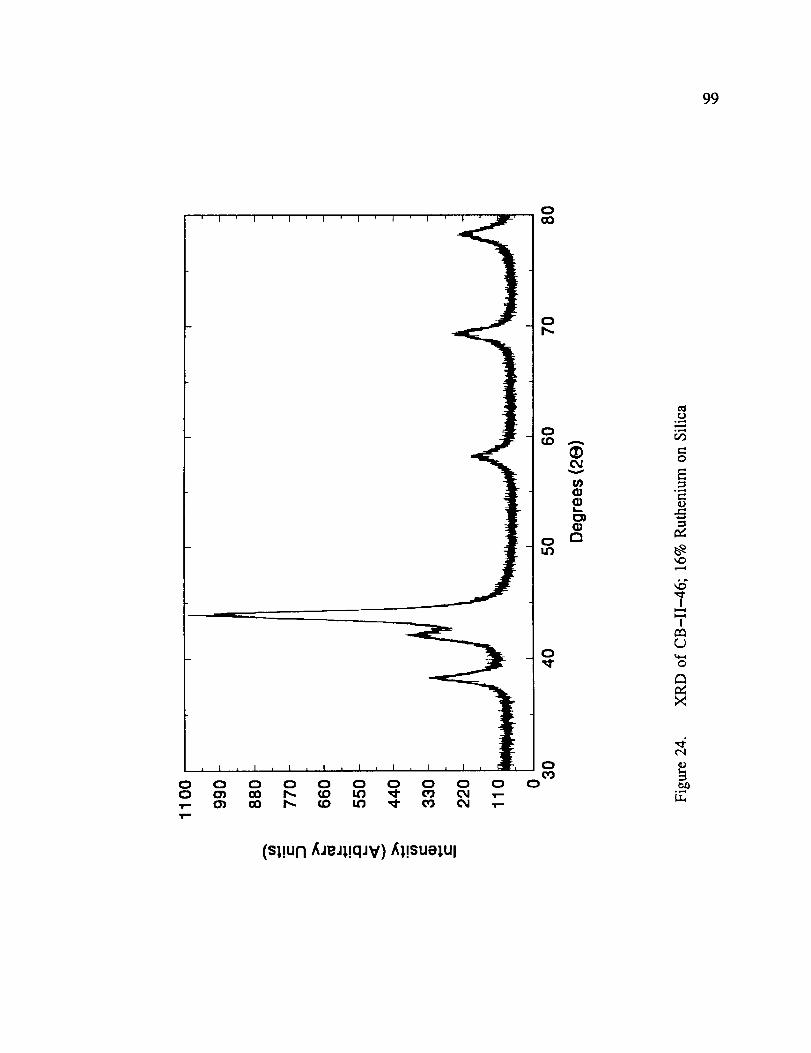
99
0cO
0 O 0 0 0 ¢D (:_ C) 0 0 0
c.)°,-G
o
r-¢)
I
L_
o
X
c_
L_
(s_!UN _JeJ_,!qJV) _l!suelul
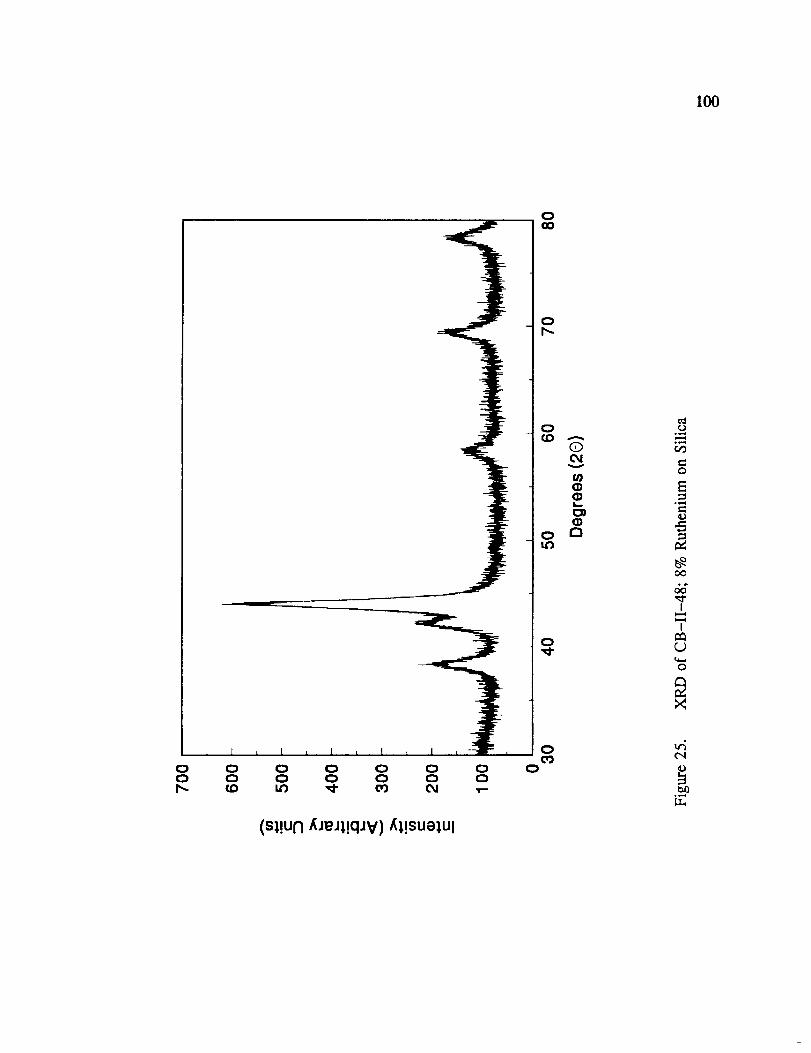
I00
0GO
0h-
0 0 0 0 0 0 00 0 0 0 0 C3 0I_- _D _ ,_" CO C_ _-
(s un ,_JeJl!qJv) _l!suej, Ul
0(D A
Qv
I,..
(I)o ElIZl
0
i 0CO
C_
o
°_._
oo
I
(J
o
X
v_c,I
b_LT_
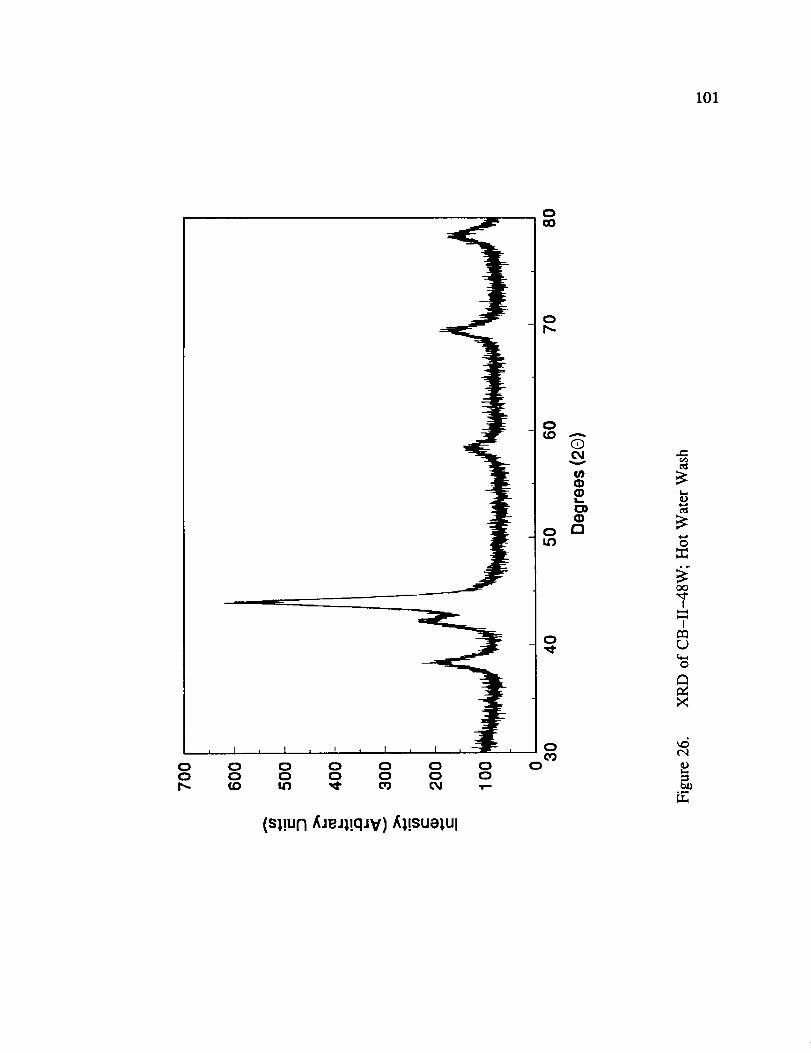
101
0cO
CD
0 0 0 0 0 0 00 0 0 0 0 0 0I'-- tO IZ_ _" 03 _ T-
(s un, JeJ !qJv)/b,!sue;ul
0t.O A
0O_
v
¢/)
o 0IZ3
0
, 0O3
0
0
°_
O0
I
I
o
_5cq
b_° _...i
LL
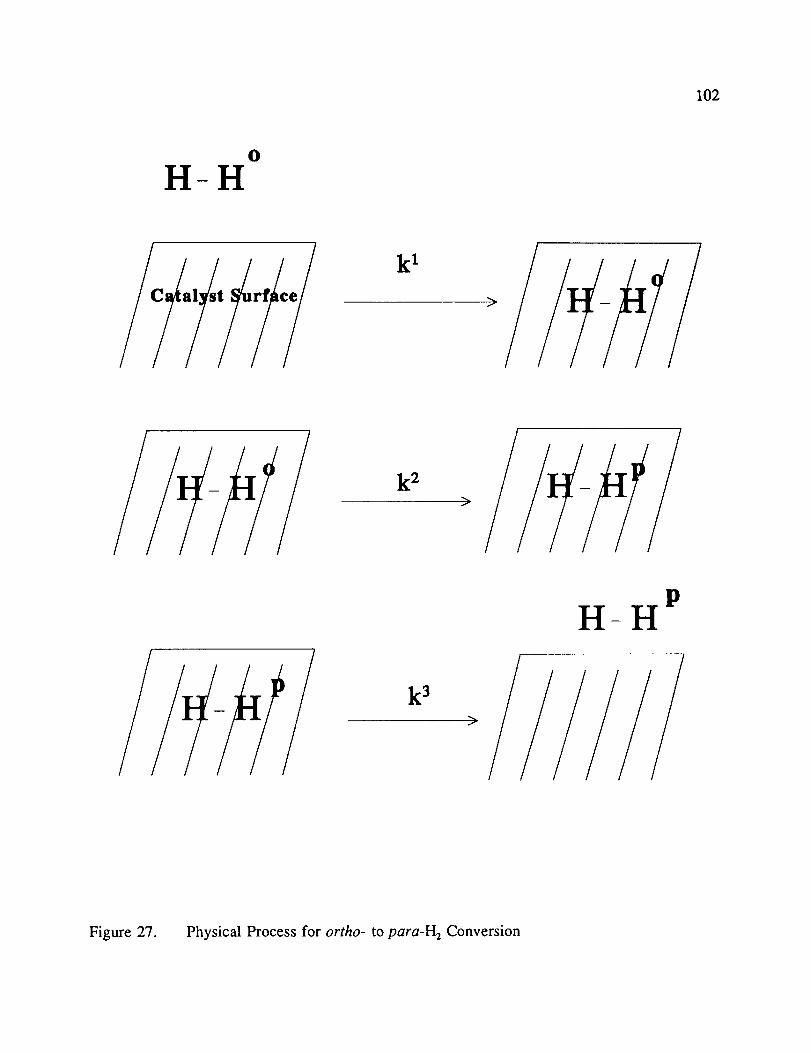
102
O
H-H
/
/ k2 >
/
PH-H
Figure 27. Physical Process for ortho- to para-H 2 Conversion
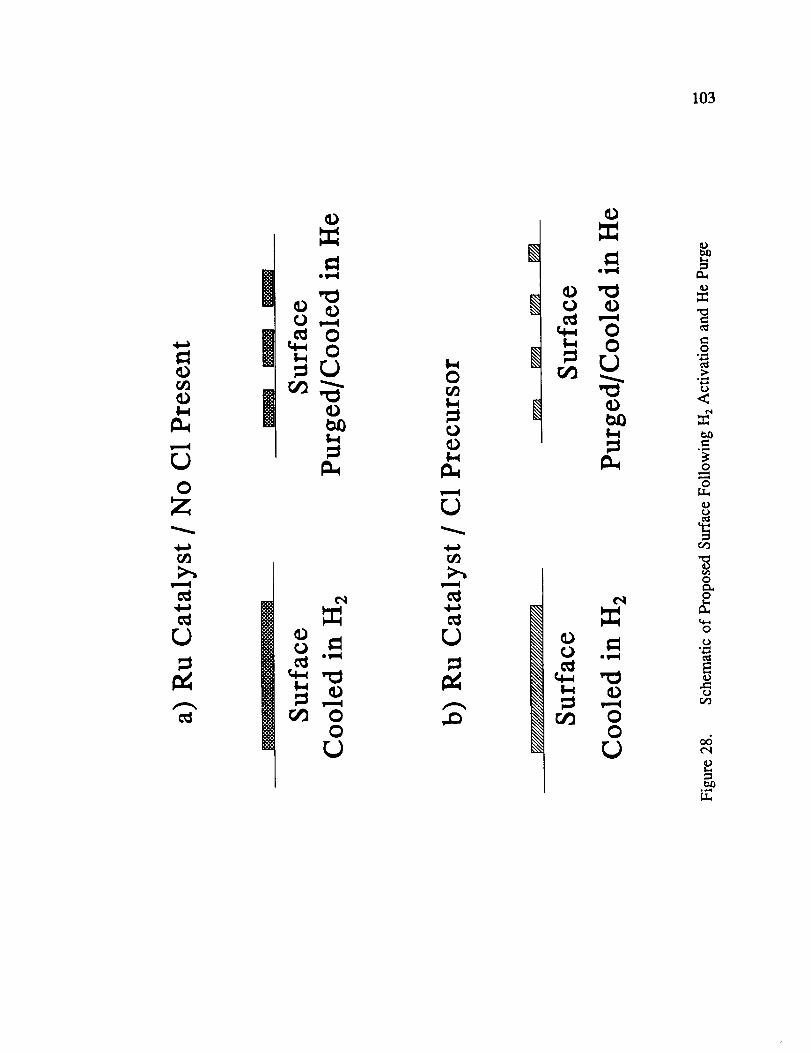
103
_2
rj
(/2
C_
Ord'2
cD
r.t2
CD
,lml
O ow..I
r,.)
0"m
<
ff
0
0
o
0
0
0,,_

REFERENCES
104
(1)
(2)
(3)
(4)
(5)
(6)
(7)
(8)
(9)
(10)
(11)
(12)
(13)
(14)
(15)
(16)
(17)
Bah'on, R. Cryogenic Systems; Oxford University; New York, 1985, p 47.
Comprehensive Inorganic Chemistry, Perganon; New York; 1973, Vol. I,
pll.
Noggle, J. H. Physical Chemistry Little, Brown and Company, Boston.
Farkus, L., and Sachsee, H. Z. Physik. Chem, 1933, B23, 19.
Wigner, E. Z. Physik. Chem., 1933, B23, 28.
Petzinger, K. G., and Scalapino, D. J. Physical Review B, 1973, 8, 266.
Coffman, R. E. "Final Technical Report to NASA", 1992.
Stevenson, R. J. Catal. 1983, 79, 218.
Van Cauwelaert, F. H., and Hall, W. K., Trans. Faraday Soc., 1970, 66, 454.
Scott, R. B., Brickwedde, F. G., Urey, H. C., and Wahl, M. H. J. Chem.
Phys., 1934, 2, 454.
Chapin, D. S., Cunningham, C. M., and Johnston, H. L. Advances in
Cryogenic Engineering; Plenum, 1960; Vol. I, p 280.
Arias, J.A., and Selwood, P.W.J. Catal. 1974, 33, 284.
Eley, D. D., Forrest, H., and Rudham, R. J. Catal., 1974, 34, 35.
a) Selwood, P. W. J. Catal. 1970, 19, 353.
b) Selwood, P. W. J. Catal. 1971, 22, 123.
c) Madhusudhan, C. P,. and Selwood, P. W. J. Catal., 1976, 45, 106.
Rudham, R., Tullett, A. D., and Wagstaff, K. P. J. Catal., 1975, 38, 488.
Singleton, A. H., Lapin, A., and Wenzel, L. A. Advances in Cryogenic
Engineering; Timmerhaus, K. D. Ed.; Plenum: New York; 1968, Vol XIII, p
409.
Barrick, P. L., Brown, L. F., Hutchinson, H. L., and Cruse, R. L. Advances
in Cryogenic Engineering; Plenum: New York, 1965, Vol X, p 181.

(18)
(19)
(20)
(21)
(22)
(23)
(24)
(25)
(26)
(27)
(28)
(29)
(30)
(31)
(32)
(33)
105
Haley, A. J., and Hinden, S. G. "Englehard Technical Report
AFAPL-TR-65-59" (1965).
Anderson, J. R.; Pratt, K. C. Introduction to Characterization and Testing of
Catalysts, Academic, New York, 1985.
a) Modern Practices of Gas Chromatography, Grob, R. L. Ed.; Wiley, New
York, 1977.
b) Littlewood, A. B., Gas Chromatography, Academic, New York, 1970.
Weitzel, D. H., and White, L. E. Rev. Sci. Inst., 1955, 23, 290.
Barton, R. Cryogenic Systems; Oxford University; New York, 1985
Barrick, P. L., Brown, L. F., Hutchinson, H. L., and Cruse, R. L. Advances
in Cryogenic Engineering; Plenum: New York, 1965, Vol X, p 181.
Nykerk, K. M., Eyman, D. P., Simth, R. L. Inorganic Chemistry, 1967, 6,
2262.
Song, K. University of Iowa, unpublished result.
Gloer, K. B. University of Iowa, unpublished result.
LaBrush, D. M. University of Iowa, unpublished result.
Beamish, F. E. The Analytical Chemistry of the Nobel Metals, Pregamon,
New York, 1966.
Gay, I. D. J. Catal., 1983, 231.
Wu, X. Ph.D. Thesis, Iowa State University, 1990.
Marczenko, Separation and Spectroscopic Determination of the Elements;
Halsted; New York, 1986; p 493.
a) Howe, J. L. J. Am. Chem. Soc., 1901, 23, 777.
b) Brauer, G. Handbook of Preparative Inorganic Chemistry; Vol. H,
Academic, New York, 1965.
c) Jacobson, C. A., Encyclopedia of Chemical Reactions; Vol V, Renhold,
New York, 1959.
Perrin, D. D. and Armarego, W. L. F.; Purification of Laboratory Chemicals;
Pergamon, New York, 1988.
(34) Anderson, J. R. Structure of Metallic Catalysts; Academic; New York; 1975.
106
(35) a) Narita, T., Miura, H., Sugiyama, T., Matsuda, T., and Gonzalex, R., J.
Catal., 1987, 103, 492-495.
b) Narita, T., Miura, H., Sugiyama, T., Matsuda, T., and Gonzalex, R. J.
Catal., 1987, 103, 185-190.
(36) a) Lu, K., Tatarchuk, B. J. Catal. 1987, 106, 166.
b) Lu, K., Tatarchuk, B. J. Catal. 1987, 106, 175.
(37) Miura, H., Hondou, H., Sugiyama, T., Matsuda, T., and Gonzalex, R., J.
International Congress on Catalysis Proceedings; Amsterdam
(38) Fubara, B., Accel Catalysis, Inc., Unpublished Results.
(39) Wang, W., University of Iowa, Unpublished Results.
(40) Somorjai, G. Chemistry in Two Dimensions: Surfaces; Cornell University;
Ithaca; 1981.
(41) Dalla Betta, R. A. J. Catal., 1974, 34, 57.
(42) a) Goodwin, J. J. Catal. 1981,68, 227.
b) Yang, C., Goodwin, J. G. J. Catal. 1982, 78, 182.
(43) a) Clausen, C. A., Good, M. L. J. Catal, 1975, 38, 92.
b) King, D. L. J. Catal., 1978, 51,386.
c) Koopman, D. L., Kieboom, A. P., Van Bekkum, H. J. Catal., 1981, 69,172.