support rand for more information€¦ · information technology as a competitive weapon..... 47...
TRANSCRIPT

This document and trademark(s) contained herein are protected by law as indicated in a notice appearing later in this work. This electronic representation of RAND intellectual property is provided for non-commercial use only. Permission is required from RAND to reproduce, or reuse in another form, any of our research documents.
Limited Electronic Distribution Rights
Visit RAND at www.rand.org
Explore RAND Health
View document details
For More Information
Purchase this document
Browse Books & Publications
Make a charitable contribution
Support RAND
This PDF document was made available from www.rand.org as
a public service of the RAND Corporation.
6Jump down to document
The RAND Corporation is a nonprofit research organization providing objective analysis and effective solutions that address the challenges facing the public and private sectors around the world.
THE ARTS
CHILD POLICY
CIVIL JUSTICE
EDUCATION
ENERGY AND ENVIRONMENT
HEALTH AND HEALTH CARE
INTERNATIONAL AFFAIRS
NATIONAL SECURITY
POPULATION AND AGING
PUBLIC SAFETY
SCIENCE AND TECHNOLOGY
SUBSTANCE ABUSE
TERRORISM AND HOMELAND SECURITY
TRANSPORTATION ANDINFRASTRUCTURE
WORKFORCE AND WORKPLACE

This product is part of the RAND Corporation monograph series. RAND
monographs present major research findings that address the challenges facing
the public and private sectors. All RAND monographs undergo rigorous peer
review to ensure high standards for research quality and objectivity.


The RAND Corporation is a nonprofit research organization providing objective analysis and effective solutions that address the challenges facing the public and private sectors around the world. RAND’s publications do not necessarily reflect the opinions of its research clients and sponsors.
R® is a registered trademark.
A profile of RAND Health, abstracts of its publications, and ordering information can be found on the RAND Health home page at www.rand.org/health.
© Copyright 2005 RAND Corporation
All rights reserved. No part of this book may be reproduced in any form by any electronic or mechanical means (including photocopying, recording, or information storage and retrieval) without permission in writing from RAND.
Published 2005 by the RAND Corporation1776 Main Street, P.O. Box 2138, Santa Monica, CA 90407-2138
1200 South Hayes Street, Arlington, VA 22202-5050201 North Craig Street, Suite 202, Pittsburgh, PA 15213-1516
RAND URL: http://www.rand.org/To order RAND documents or to obtain additional information, contact
Distribution Services: Telephone: (310) 451-7002; Fax: (310) 451-6915; Email: [email protected]
Library of Congress Cataloging-in-Publication Data
Bower, Anthony G. The diffusion and value of healthcare information technology / Anthony G. Bower. p. cm. “MG-272.” Includes bibliographical references. ISBN 0-8330-3760-9 (pbk. : alk. paper) 1. Medicine—Information technology—Evaluation. 2. Medicine—Information
technology—Government policy—United States. 3. Medical records—Data processing—Cost effectiveness. 4. Diffusion of innovations.
[DNLM: 1. Diffusion of innovation. 2. Medical Records Systems, Computerized—utilization. 3. Information Systems. ] I. Title.
R858.B68 2005610'.28—dc22
2005002944
Cover design by Barbara Angell Caslon
The research described in this report was conducted within RAND Health and sponsored by a consortium of private companies, including Cerner Corporation, General Electric, Hewlett-Packard, Johnson & Johnson, and Xerox.
iii
Preface
This report presents research on the diffusion and value of healthcare informationtechnology (HIT). It is part of a larger RAND Corporation study that examined thevalue of HIT and policy options available to promote HIT, if and when such promo-tion seems appropriate. Future reports from the larger study are anticipated to bepublished in the middle of 2005.
Healthcare faces multiple problems, including high and rising expenditures, in-consistent quality, and gaps in care and access. Healthcare information technology,and especially complex electronic health records (EHRs), have been thought to bepossible partial solutions to those problems.
This report characterizes the diffusion of electronic health records and placesthat diffusion within a theoretical diffusion framework. EHR diffusion, once thetheory is understood, is for the most part intuitive and explainable. The report thenanswers the question of how much healthcare information technology might beworth to society. It analyzes other industries to arrive at a theory of informationtechnology (IT) value and then creates plausible healthcare scenarios and quantifiesthe benefits.
Finally, the report analyzes potential IT market failures in healthcare and identi-fies some possible policy directions.
This research was conducted within RAND Health, a division of the RANDCorporation. It was sponsored by a generous consortium of private companies, in-cluding Cerner, General Electric, Hewlett Packard, Johnson & Johnson, and Xerox.The right to publish any results was retained by RAND.
The report should be of interest to information technology professionals,healthcare executives, and government officials responsible for health policy.


v
Contents
Preface ........................................................................................ iiiFigures ........................................................................................viiTables......................................................................................... ixSummary......................................................................................xiAcknowledgments .......................................................................... xviiAcronyms ....................................................................................xix
CHAPTER ONE
Introduction ...................................................................................1Why Is Healthcare Information Technology Diffusion and Its Value Important? ...........1Study Questions and Key Findings............................................................2Brief Overview of Research Approach .........................................................3
CHAPTER TWO
What Is the Current Diffusion of HIT? ......................................................5Results from the Dorenfest Survey ............................................................5Review of Other Estimates of EHR Penetration ..............................................8
CHAPTER THREE
EHR Past and Future Diffusion in Relation to Other Innovations ....................... 11Identifying Historical Diffusion Curves ..................................................... 11Using the Literature to Identify Key Drivers of Diffusion .................................. 14
Key Papers in HIT Diffusion.............................................................. 15Generating a Predicted EHR Diffusion Curve Based on the Broader Diffusion
Literature.............................................................................. 16The Basic Causality Problem .............................................................. 18An Integrated Causal Model............................................................... 19Definition of Causal Diffusion Variables for EHR........................................ 21
Assessment of Causal Diffusion Variables with Respect to EHR............................ 22Relative Advantage to Clinicians .......................................................... 24

vi The Diffusion and Value of Healthcare Information Technology
Compatibility with Existing Systems of Care ............................................. 24Complexity ................................................................................ 24External Influence ......................................................................... 25Social Pressure ............................................................................. 25Network Effects............................................................................ 25Specialization .............................................................................. 26
Selecting an HIT Diffusion Curve........................................................... 26
CHAPTER FOUR
The Potential Value of Wide HIT Diffusion............................................... 33Measuring HIT Productivity Improvements in Healthcare ................................. 34Implementation—A Key Factor in Realizing HIT Value ................................... 35Benefits of IT in the Overall U.S. Economy and in Specific Industries ..................... 37
Benefits of IT in the Overall Economy.................................................... 37Benefits of IT in Specific Industries ....................................................... 40Three Categories of IT Investor Industries................................................ 41Information Technology as a Competitive Weapon ...................................... 47
Potential Benefits of IT in Health ........................................................... 47IT Productivity Enhancers................................................................. 47Scenarios for Productivity Gains from HIT............................................... 51
CHAPTER FIVE
Should the Government Intervene to Speed Diffusion of HIT?........................... 55Rationales and Discussions of Government Intervention: Market Failure .................. 56
Imperfect Information..................................................................... 57Market Power.............................................................................. 61Externalities................................................................................ 62
Summary of Key Findings and Concluding Observations .................................. 64Coordinate Standards Immediately........................................................ 65Work to Improve Quality Measurement .................................................. 65Reduce Network Externalities ............................................................. 66Recognize That HIT Requires Complementary Investments ............................. 66Make Policy Decisions That Turn HIT into a Competitive Weapon .................... 67Discuss and Agree Whether 100 Percent EHR Penetration Is a Societal Goal,
Because History Suggests That It Will Not Happen Without Intervention ......... 67Adopt an Incremental, Evolutionary Perspective on Policy Development................ 68
Bibliography................................................................................. 69

vii
Figures
2.1. Clinical HIT Software in Hospitals (2002)...........................................62.2. Diffusion of Electronic Health Records in Acute-Care Hospitals ....................83.1. Diffusion of Selected Information Technology..................................... 123.2. Diffusion Rates in the United States for Selected Consumer
Products............................................................................. 133.3. Diffusion Curve for Large-Scale Relational Databases ............................. 193.4. Cluster Analysis of 19 IT-Innovation Diffusions................................... 293.5. Diffusion of EHR LSRD ........................................................... 304.1. IT Is Now the Single Biggest Driver of Increases in U.S. Labor Productivity...... 384.2. Cumulative Productivity Contribution Diagram: 1995 Productivity
Growth Jump ....................................................................... 394.3. Number of Sectors with Growth Acceleration of at Least 3 Percent ............... 414.4. Gains from HIT Improvement ..................................................... 524.5. Potential 15-Year HIT Savings Are Large Because the Stakes Are Enormous...... 53


ix
Tables
2.1. EHR Adoption Levels in Other Studies ..............................................93.1. Time to Progress from “Early Adopters” to the End of “Late Majority” Is
Variable ............................................................................. 143.2. Assessment of EHR Attributes on Causal Diffusion Variables ..................... 233.3. Comparison of Enterprise Resource Planning and Electronic Medical
Record IT ........................................................................... 304.1. IT Productivity Gains Varied by Industry.......................................... 424.2. Assessment of IT Productivity Enhancers in Healthcare ........................... 484.3. IT Capital Intensity in Assorted Industries ......................................... 49


xi
Summary
Virtually no one would argue that the $1.6 trillion spent annually (as of 2002) onU.S. healthcare is spent efficiently. Americans are not any healthier than citizens inmost other developed nations, despite the mammoth expenditures.
There is a well-documented productivity renaissance in the U.S. economy,dating from the mid-1990s. A number of prominent industries, including wholesal-ing and retailing, have greatly increased productivity over the last decade.1 At theheart of their efforts was information technology (IT) transformation, although notall heavy IT-using industries have experienced increased productivity.
The purpose of this study is to investigate four sets of questions designed tohelp determine if healthcare can duplicate the IT-enabled gains seen in other indus-tries, and if so, how:
• What is the current diffusion of HIT, especially the complex electronic healthrecord (EHR) systems2 that hold out the promise of healthcare transformation?
• How does EHR diffusion compare to other innovations, especially IT innova-tions, in other industries? And how fast will EHR likely diffuse if the healthcaresystem does nothing differently?
• How much would HIT diffusion likely be worth to society (1) if nothing isdone differently and also (2) if adoption were quickened?
• What should the government do, if anything, to assist in the purchase or im-plementation of HIT and specifically EHR? Is speeding the adoption of EHRworth the costs of doing so?
____________1 The primary productivity measure used in this report is labor productivity, which is simply output divided bylabor hours.2 A basic EHR system provides electronic remote user access of results in the form of text, including lab reports,radiology, transcribed notes, current medications, problems, demographics, and possibly some scanned reports.More advanced EHR systems have guideline-based content and patient- and condition-specific reminders, popu-lation management, and interprovider communication.
xii The Diffusion and Value of Healthcare Information Technology
Brief Overview of Research Approach
To answer the question of the current diffusion of HIT (Chapter Two), we analyzedan industry data source and compared our results to others’ results. To answer thequestion of why HIT has diffused the way that it has (Chapter Three), we surveyedthe diffusion literature to find diffusion drivers and then assessed HIT and particu-larly EHR on those drivers.
Part of our assessment relied on a series of surveys and interviews conducted atfacilities that were using or contemplating the use of EHR. Our survey used a pur-posive sample of a variety of healthcare stakeholders identified through literature andexpert recommendations. Sixteen sites were visited. Later visits were specifically togather cost and HIT-related process improvement information from sites identifiedas engaging in these activities.
Site visits were supported by telephone interviews with leading HIT profession-als. The site visit goals included fact finding and hypothesis development, identifyingbarriers, enablers, value measurement, range of implementation strategies, and costs.
The second part of our assessment relied on an extensive literature review. Thetwo approaches when combined yielded a prediction of future EHR diffusion. Toanswer the question of what HIT (and especially EHR) diffusion is worth to the na-tion (Chapter Four), we found case studies that identified the worth of IT in otherindustries. We synthesized the case studies and other literature to arrive at a cross-industry theory of IT value and assessed HIT on those drivers using informationfrom literature and interviews with providers. Finally, in asking the question of howor why should government help (Chapter Five), we started from a welfare economicsperspective and attempted to identify failures in the HIT market, if any. Our reviewof all of the evidence from our interviews and the HIT implementation and policyliterature revealed several market failures, and on that basis we recommend furtherstudy of specific plausible policy interventions.
Our key findings are summarized below.
• EHR is diffusing at a rate consistent with other similar IT technologies in otherindustries. EHR diffusion is explicable using modern diffusion theory applicableto complex, highly networked IT products.
• Complex electronic medical records are, after a 20-year waiting period, rapidlydiffusing in many segments of our healthcare system, with about 30 percent ofacute-care hospital providers reporting by the end of 2003 that they had or-dered EHR products, and will reach 80 percent saturation in hospitals by about2016—or earlier if assisted by government or other organizations. Diffusionamong physicians’ offices is 10–16 percent, depending on the measure.
• More important than hastening adoption, which appears to have taken off since1999 without intervention, is ensuring that appropriate incentives are in placeso that complex EHRs will be used effectively.

Summary xiii
• The benefits of the current increase in HIT spending are arguably a cumulative1 percent per year,3 but the range varies widely depending on what else the gov-ernment and healthcare players do. Other industries have shown quantifiable ITlabor productivity benefits ranging from 0 percent to perhaps 4 percent peryear.
• Speeding up adoption may be beneficial, although it depends on the presence ofother factors such as competition and regulation. There is very strong evidencethat HIT will complement other pro-productivity features such as competitionand deregulation. HIT is an enabler of change in how work gets accomplished.This is especially true of complex electronic medical records.
Promising Policy Avenues Identified by This Research
Our research has revealed a number of attractive policy avenues that deserve furtherstudy. The policy avenues discussed below are active priorities among the many poli-cymaking stakeholders. The purpose of this report has been to provide a better con-ceptual and empirical basis for pursuing certain general lines of policy, rather than todiscuss specific current proposals in much depth (which are better addressed in a se-ries of ongoing, brief issue papers, for example, than in full reports). Note also thatthe list below is still very broad. The question may be asked: Ultimately, is HIT not anarrower concern within healthcare, albeit an important one, that deserves a shorterand less ambitious list? There are at least two reasons for the broad list below. First,HIT and especially EHR is a technology that affects virtually all players in thehealthcare community. It is a broad technology and requires broad policy to be effec-tive.
Second, the value of HIT is maximized when complementary investments aremade. The value of HIT swings widely (perhaps by a factor of 10) depending onwhat else is going on in the system. In healthcare, there is a lot going on, much of itunhelpful to maximizing the HIT investment. Accordingly, the policy remit to op-timize HIT efficiency touches on a number of healthcare problems, many all too fa-miliar to health policymakers.
This report’s research lends support to developing policy and solutions in thefollowing broad policy avenues:
Coordinate standards immediately. It is important to continue to coordinatestandards and push for initiatives that improve the chances for interoperability, espe-cially within regional communities. Standards should be improved without reducingcompetition among competing EHR vendors.____________3 That is, benefits in the first year are a 1 percent increase in labor productivity, in the second year a 2 percentincrease, in the third year a 3 percent increase, and so on, for as long as IT continues to change the organizationof work within an industry.
xiv The Diffusion and Value of Healthcare Information Technology
Work to improve quality measurement. The benefits of improving qualitymeasurement are twofold: First, improving quality measurement will help to over-come the healthcare market failure of inadequately recognizing quality, which willspur the adoption of quality-improving innovation, including EHR. Second, there isa feedback loop: Adoption itself will reduce this market failure, because EHR holdsthe promise of improving quality measurement, largely by automating an otherwisedauntingly labor-intensive process of quality management. This difficulty in meas-uring and competing on quality is arguably the most important problem inhealthcare and EHR could be an important part of the solution.
In addition to these two strong rationales for policy in this area, there is still athird: The government is not just a regulator but a key customer and has the oppor-tunity and indeed the right to improve provider cost effectiveness over time. A strongseries of results in the theory of innovation show that a “smart buyer” can drive anindustry to higher efficiency. (For example, consider the effects of Japanese consum-ers’ tastes in consumer electronics on Japanese consumer electronics companies.) Todate, the government as a buyer has done much to affect the system but much less toreform the system. HIT can help transform the system and help government pushthrough complementary changes in quality measurement and pay for performancethat should improve the system. Perhaps this is the area that holds out the greatestpromise for truly transformative change.
Reduce network externalities.4 The government can work to lessen network ex-ternalities, which should lead to more adoption of EHR and especially more effectiveadoption. Our analysis suggests that the federal government could lead an interven-tion, but a successful policy needs to encourage linking the local providers for anyspecific patient. To assist with these efforts, the government may need to considerfurther relaxing inurement of benefit regulations with respect to HIT. Because ofnetwork externalities, some selective grants or subsidies may be optimal for under-funded physicians’ offices, but we do not view this as proven. Alternatively, allowingtransfer payments (connect fees or bonuses) among members of the regional networkmay be a good idea (and less expensive for the government). The allowed financialincentives should be targeted at improving community connectivity directly (e.g., IThardware), or indirectly (e.g., digitizing patient paper records). However, there needsto be further, detailed research at the firm and regional level to guide policy here.
Recognize that HIT requires complementary investments. It has been shownin other industries that IT is much more effective when combined with vigorouscompetition and deregulation. Complex IT such as EHR is definitely not a stand-alone or plug-and-play type of benefit. Rather, it can, if (and only if) used appropri-____________4 A network externality exists when a user’s benefit increases as the number of other users increases. A fax machineis an example of an IT innovation with network externalities.

Summary xv
ately, deliver dramatic changes in the overall delivery of care that could radically im-prove quality and lower the cost of delivering that higher quality.
The reverse side of this observation is that preventing complementary changesin work processes by stifling competition or direct regulation might prevent HITgains from occurring.
Make policy decisions that turn HIT into a competitive weapon. Industrialhistory shows that IT is most efficiently used when used as a competitive weaponcentral to a firm’s business. This result is highly consistent with a more general the-ory of successful innovation in a modern economy. In the context of health policy,one way to sharpen the competitive advantage of IT might be to reimburse quality inMedicare more directly, where measuring quality is possible only with an EHR-enabled quality tracking system. Another fruitful line of research would be to studywhether Medicare should pay for EHR-enabled claims. In such a world, providersimprove profitability by using EHR and using it well and having the credible qualitymeasures to prove that they are using it well. (Note that this policy prescription isrelated to the quality-measurement policies above, because they both address thefundamental market failure of poorly measured quality.)
Discuss and agree whether 100 percent EHR penetration is a societal goal,because history suggests that it will not happen without intervention. EHR diffu-sion has reached more than 20 percent of acute-care hospitals and may soon go over50 percent. However, the analysis in Chapter Two suggests, based on review of otherIT innovations, that penetration will not reach 100 percent of the provider commu-nity. If 100 percent EHR is a societal goal, because society wishes to maximize net-work gains or avoid a two-tier system, or both, then some form of subsidy for themore disadvantaged and isolated practices is likely necessary. The issues for these of-fices should likely be interoperability and community connectivity to maximize gainsfrom HIT and EHR in particular.
Adopt an incremental, evolutionary perspective on policy development. Thereare few more important areas for proper government economic policy thanhealthcare, specifically HIT. It is only a slight overstatement to say that future U.S.competitiveness and the health of its citizens depend upon it.
Given the enormous stakes, the uncertainty in the effects of policy, and the la-tency of the gains from HIT implementation, it might be wise to heed organizationaltheorists’ views on evolutionary policy analysis. It is usually best to be able to evaluatepolicies and business strategies early and adapt quickly. Such a perspective is almostcertainly wise in this context.
This suggests incremental government interventions with rapid review of re-sults, with follow-on funding for successful interventions.


xvii
Acknowledgments
I wish to thank my colleagues on the project team for their expertise and insights.The research has also benefited from comments from a steering committee, chairedby David Lawrence. A special thanks goes to those who provided detailed commentson drafts, including James Bigelow, Tora Bikson, Robin Meili, Richard Scoville,Roger Taylor, Mary Vaiana, and the project leader, Richard Hillestad, and the twoformal reviewers, Emmett Keeler and James Teng.
I also wish to thank Kateryna Fonkych, RAND Graduate School student, forher careful research assistance and for her comments on earlier versions of this report.
Finally, I am most grateful to our research sponsors for their support. They in-clude Cerner, GE, Hewlett Packard, Johnson & Johnson, and Xerox.


xix
Acronyms
4GL Fourth Generation Language
ACH Automated Clearing House
AHA American Hospital Association
ATM Automated Teller Machine
CAD/CAM Computer-Assisted Drawing/Computer-Aided Manufacturing
CAGR Compounded Annual Growth Rate
CASE Computer Assisted Software Engineering
CDR Computerized Data Record
CEO Chief Executive Officer
CIO Chief Information Officer
CMS Centers for Medicare and Medicaid Services
CPOE Computerized Physician Order Entry
CPR Computerized Patient Records
EDI Electronic Data Interchange
EHR Electronic Health Records
EIS Expanded Inband Signaling
EMR-S Electronic Medical Record Systems
ERP Enterprise Resource Planning
GDP Gross Domestic Product
GM General Motors
GMS General Merchandising Services
HIT Healthcare Information Technology
HMO Health Maintenance Organization
ICD International Classification of Diseases
xx The Diffusion and Value of Healthcare Information Technology
IHDS Integrated Healthcare Delivery System
ISDN Integrated Services Data Network
IT Information Technology
LAN Local Area Network
LSRD Large Scale Relational Database
MGI McKinsey Global Institute
NCVHS National Committee on Vital and Health Statistics
PACS Picture Archiving and Communication System
PC Personal Computer
PITAC President’s Information Technology Advisory Committee
QALY Quality Adjusted Life Years
RHIO Regional Heal Initiative Organization
VCR Video Camera Recorder

1
CHAPTER ONE
Introduction
Why Is Healthcare Information Technology Diffusion and Its ValueImportant?
In 2002, the United States spent approximately 15 percent of its gross domesticproduct (GDP) on healthcare (National Health Expenditure Statistics, 2004). Thisspending represents the highest proportion in the world and the largest single sectorof the U.S. economy. And yet, virtually no one would argue that it is spent effi-ciently. Americans are not much healthier than citizens in other nations, despite themammoth expenditures.
There is a well-documented productivity renaissance in the U.S. economy,dating from the mid-1990s (see Nordhaus, 2002, for example). A number of promi-nent industries, including wholesaling and retailing, have greatly increased produc-tivity over the last decade.1 At the heart of their efforts was information technology(IT) transformation, although not all heavy IT-using industries have experienced in-creased productivity. Healthcare IT introduction appears to continue at a relativelyrapid pace, but very little evidence to date points to significant productivity im-provements in the massive healthcare sector.2
At the same time, IT usage in healthcare lags some other industries. HIT ex-penditures have not accelerated in the last six years, instead only keeping pace withoverall healthcare expenditures (see Sheldon Dorenfest and Associates, 2004). Afragmented healthcare system, go-it-alone culture, and seemingly inadequate invest-ment funds (despite the high overall expenditures on healthcare) have appeared to____________1 The primary productivity measure is labor productivity, which is simply output divided by labor hours. Im-proving labor productivity means creating more output in less time and is perhaps the central ingredient in im-proving living standards.2 By information technology, we mean electronic means of organizing and disseminating clinical or financialinformation.

2 The Diffusion and Value of Healthcare Information Technology
handicap HIT installation. The large annual increases in health expenditures under-line the urgency of improving healthcare productivity; otherwise, quite realistically,the healthcare system threatens U.S. economic growth. At the same time, HIT repre-sents an enormous opportunity for improving productivity and the American stan-dard of living.
Study Questions and Key Findings
The purpose of this study is to investigate four sets of questions.
• What is the current diffusion of HIT, especially the complex electronic healthrecord (EHR) systems3 that hold out the promise of healthcare transformation?
• How does EHR diffusion compare to other innovations, especially IT innova-tions, in other industries? And how fast will EHR likely diffuse if the healthcaresystem does nothing differently?
• How much would HIT diffusion likely be worth to society (1) if nothing isdone differently and also (2) if adoption were quickened?
• What should the government do, if anything, to assist in the purchase or im-plementation of HIT and specifically EHR? Is speeding the adoption of EHRworth the costs of doing so?
Our key findings are summarized below.
• EHR is diffusing at a rate consistent with other similar IT in other industries.EHR diffusion is explicable using modern diffusion theory applicable to com-plex, highly networked IT products.
• Complex electronic medical records are rapidly diffusing in many segments ofour healthcare system, with about 30 percent of acute-care hospital providersreporting by the end of 2003 that they had ordered EHR products and willreach 80 percent saturation in hospitals by about 2016—or earlier if assisted bythe government or other organizations. Diffusion among physicians’ offices is10–16 percent, depending on the measure.
____________3 A basic EHR system provides electronic remote user access of results in the form of text, including labreports, radiology, transcribed notes, current medications, problems, demographics, and possibly some scannedreports. More advanced EHR systems have guideline-based content and patient- and condition-specific remind-ers, population management, and interprovider communication.

Introduction 3
• The benefits of the current increase in HIT spending are arguably a cumulative1 percent per year,4 but the range varies widely depending on what else the gov-ernment and healthcare players do. Other industries have shown quantifiable ITlabor productivity benefits ranging from 0 percent to perhaps 4 percent peryear.
• Speeding up adoption may be beneficial, although it depends on the presence ofother factors such as competition and regulation. There is very strong evidencethat HIT will complement these pro-productivity features. HIT is an enabler ofchange in how work gets accomplished. This is especially true of complex elec-tronic medical records.
• More important than hastening adoption, which appears to have taken off since1999 without intervention, is ensuring that appropriate incentives are in placeso that complex EHRs will be used effectively.
• The U.S. federal government has the rationale, the power, and the opportunityto improve competitive conditions by promoting EHR standards, lesseningnetwork externalities at the community level,5 and sharpening the private-market competition among providers to use the best and most efficient EHR.
Brief Overview of Research Approach
To answer the question of the current diffusion of HIT (Chapter Two), we analyzedan industry data source and compared our results to others’ results. To answer thequestion of why HIT has diffused the way that it has (Chapter Three), we surveyedthe diffusion literature to find diffusion drivers and then assessed HIT and particu-larly EHR on those drivers. This yielded a prediction of future EHR diffusion. Toanswer the question of what HIT (and especially EHR) diffusion is worth to the na-tion (Chapter Four), we found case studies that identified the worth of IT in otherindustries. We synthesized the case studies and other literature to arrive at a cross-industry theory of IT value and assessed HIT on those drivers using informationfrom literature and interviews with providers. It is worth alerting the reader thatChapters Three and Four are not closely related analytically, but both are necessaryfor the analysis in Chapter Five. Finally, in asking the question of how or why shouldgovernment help (Chapter Five), we started from a welfare economics perspectiveand attempted to identify failures in the HIT market, if any. Our review of all of the____________4 That is, benefits in the first year are a 1 percent increase in labor productivity, in the second year a 2 percentincrease, in the third year a 3 percent increase, and so on, for as long as IT continues to change the organizationof work within an industry.5 Network externalities will be discussed in more detail in a following chapter, but briefly: A network externalityexists when a user’s benefit increases as the number of other users increases. A fax machine is an example of an ITinnovation with network externalities.

4 The Diffusion and Value of Healthcare Information Technology
evidence from our interviews and the HIT implementation and policy literature re-vealed several failures, and on that basis we recommend further study of specificplausible policy interventions.

5
CHAPTER TWO
What Is the Current Diffusion of HIT?
We researched the current diffusion of HIT, and especially EHR, in three ways:
1. We analyzed data from Sheldon Dorenfest and Associates, a major source of HITdata. Dorenfest conducts an extensive survey of provider organizations about theirIT purchases, down to the provider and vendor level. We analyzed the Dorenfestdata, using our own definition of EHR that works with the data available to us.We derived a penetration curve, one provider at a time, according to our defini-tions.
2. We conducted a literature review of current diffusion of EHR and compared ourresults to those found by other authors, both in the HIT domain and in othertechnology diffusion domains.
3. We spoke with HIT experts and providers to gain a qualitative understanding ofthe HIT environment and identified barriers and enablers for HIT implementa-tion. We used a semi-structured interview format, derived from team consensus,IT, healthcare, and management experience. Detailed results from these inter-views will be reported elsewhere in 2005. The qualitative results were used as con-firmatory information for the quantitative data collected in steps 1 and 2. In thediscussion that follows, we report results from the interviews only when theyaugment what is learned in steps 1 and 2.
Results from the Dorenfest Survey
The Dorenfest Integrated Healthcare Delivery System (IHDS) database (Dorenfestdatabase) contains information describing the overall characteristics of each inte-grated healthcare delivery system in the nation, as well as data about the systems’ in-formation technology programs. Dorenfest defines an IHDS as an organization thatowns at least one short-term, acute-care, nonfederal hospital with at least 100 beds asdefined by the American Hospital Association (AHA). This includes almost 36,000healthcare facilities associated with 1,500 integrated healthcare delivery systems; thus

6 The Diffusion and Value of Healthcare Information Technology
a majority of U.S. hospitals are covered by this dataset. The 2003 Dorenfest databasecovers about 82 percent of “community” hospitals, defined in the AHA survey as “allnonfederal, short-term general, and other special hospitals.” The hospitals with fewerthan 100 beds not associated with a larger integrated healthcare delivery system areunderrepresented in this database—about 65 percent are included compared to al-most 100 percent of larger hospitals.
The data are gathered using an annual mail survey. Dorenfest asks which appli-cations (including model and manufacturer) each IHDS has. Figure 2.1 summarizesinformation from the 20021 Dorenfest survey about adoption of clinical HIT appli-cations. Note that adoption rates vary widely and are quite high for some applica-tions. For example, over 90 percent of hospitals in the sample own software for labsand pharmacy.
However, our concern is diffusion of a system—an electronic health record thatmay provide physician order entry, guidelines, and treatment protocols and thatsupports patient-centered care by offering providers instant access to all clinical
Figure 2.1Clinical HIT Software in Hospitals (2002)
10
RAND MG272-2.1
NOTE: PACS refers to picture archiving and communication systems.
Percentage adopted in 2002—from the Dorenfest database
Master patient indexAbstracting
EncoderPharmacy
LaboratoryCase mix analysis
Order communication/resultsRadiologyDictation
Clinical data repositoryOutcomes and quality management
Clinical decision supportComputerized patient records
Emergency departmentMedical records imaging
CardiologyPACS
Obstetrical systems
0 25 50 75 100
92
91
89
89
84
60
41
34
30
26
20
96
96
97
58
66
57
____________1 Please note that we use 2002 data for this figure, but that the EHR diffusion data reported below are from2003; these data became available shortly before publication of this report.

What Is the Current Diffusion of HIT? 7
information.2 Dorenfest does not ask whether the facility has an electronic medicalrecord. Therefore, we had to construct this measure from the data.
We stipulated that a provider has EHR if it has purchased clinical decision sup-port, computerized patient records, and a clinical data repository. Authors over the yearshave variously defined electronic health record systems, including EHR, CPRs (com-puterized patient records), and the EMR-S (electronic medical record systems). Someof the terms used refer only to the patient record itself, whereas others include theentire system that supports the delivery of high-quality, integrated patient care acrossmultiple providers. In choosing the three functions above to identify systems with anEHR, we are attempting to strike a practical midpoint in definitions as they apply tothe Dorenfest data. Using these definitions, we were able to generate a diffusioncurve for acute-care hospitals.
The adoption rate in physician offices is lower. Dorenfest reports that 16.4 per-cent of the physician offices in their dataset have EHR. Dorenfest has a large sampleof over 7,800 offices, representing approximately 110,000 physicians, or roughly 22percent of all U.S. physicians. Adoption is heavily size-dependent—adoption is 10.9percent for sole practitioners and 37.9 percent for practices of 30 physicians or more.The overall mean is almost certainly biased upward because an office must be at-tached to an IHDS to be in the Dorenfest sample. Our unofficial estimate of pene-tration in all provider offices by the end of 2003 was roughly 12 percent.
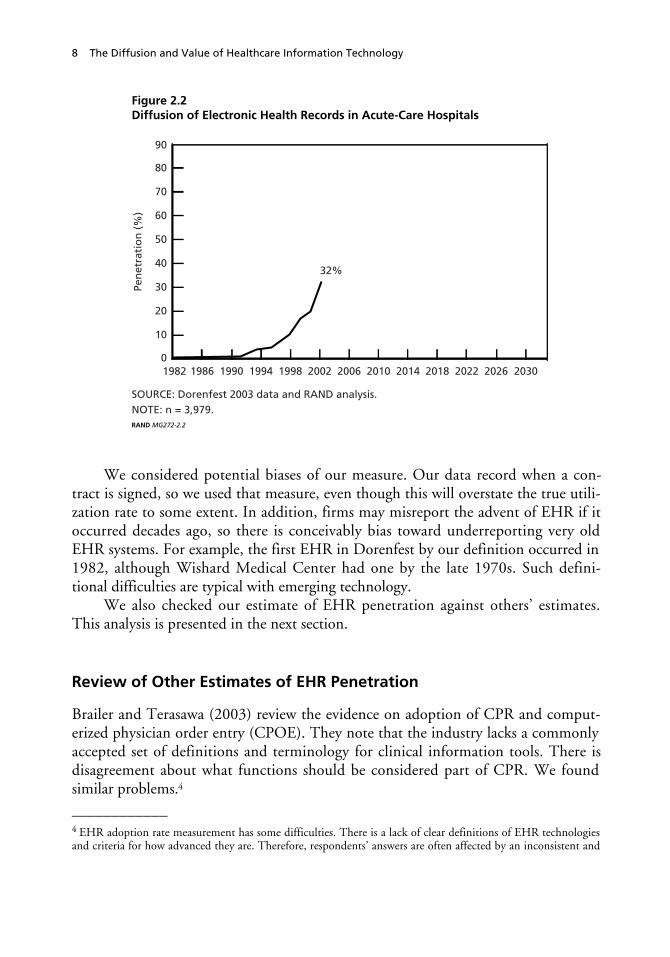
Figure 2.2 shows the diffusion of EHR in the Dorenfest sample using our basecase definition. The figure shows that, according to our definition, EHR penetrationwas about 32 percent by the end of 2003, which is 22 years after the introduction ofthe first EHR in the Dorenfest data. We also considered more conservative measures,including requiring “full implementation,” not just “adopted,” and requiring all threeapplications to be purchased from the same vendor. Requiring full implementationdrops the penetration by about 6 percent, suggesting that about one in 16 offices wasimplementing its adopted system in 2002. Requiring two applications from the samevendor drops penetration from about 32 percent to 27 percent. The higher numberseems more relevant for predicting the future, so we use the higher number.3 Thislevel of penetration implies, for most innovations, that it is no longer the innovatorsand early adopting acute-care hospitals who are adopting. The technology hasreached the steep part of the uptake curve, where the “early majority” (Rogers, 1995)have begun to adopt.____________2 A more detailed analysis of HIT diffusion and its demographic drivers will be the subject of a future publica-tion; only high-level results are presented here.3 An even better measure could be developed by mapping the reported vendor product purchase decisions into adefinition of EHR. However, this would have to be done at the individual provider/product selection level andwould be very labor intensive.
8 The Diffusion and Value of Healthcare Information Technology
Figure 2.2Diffusion of Electronic Health Records in Acute-Care Hospitals
RAND MG272-2.2
Pen
etra
tio
n (
%)
1982 203020142010200620021998199419901986
32%40
30
20
10
90
0
80
70
60
50
SOURCE: Dorenfest 2003 data and RAND analysis.NOTE: n = 3,979.
202620222018
We considered potential biases of our measure. Our data record when a con-tract is signed, so we used that measure, even though this will overstate the true utili-zation rate to some extent. In addition, firms may misreport the advent of EHR if itoccurred decades ago, so there is conceivably bias toward underreporting very oldEHR systems. For example, the first EHR in Dorenfest by our definition occurred in1982, although Wishard Medical Center had one by the late 1970s. Such defini-tional difficulties are typical with emerging technology.
We also checked our estimate of EHR penetration against others’ estimates.This analysis is presented in the next section.
Review of Other Estimates of EHR Penetration
Brailer and Terasawa (2003) review the evidence on adoption of CPR and comput-erized physician order entry (CPOE). They note that the industry lacks a commonlyaccepted set of definitions and terminology for clinical information tools. There isdisagreement about what functions should be considered part of CPR. We foundsimilar problems.4
____________4 EHR adoption rate measurement has some difficulties. There is a lack of clear definitions of EHR technologiesand criteria for how advanced they are. Therefore, respondents’ answers are often affected by an inconsistent and

What Is the Current Diffusion of HIT? 9
With caveats duly noted, studies of adoption suggest a use rate of perhaps22–41 percent (see Table 2.1) by the end of 2002 and perhaps 50–60 percent by2006. However, these surveys are mostly completed by self-selected IT professionals,so the rates reported are almost certainly biased upward. Brailer and Terasawa notethat five studies conducted in 2002 had an outpatient EHR use of 14–39 percent,with a median of 23 percent. However, functionality of EHR varied across the stud-ies and the authors raise the prospect that these studies may be overgeneralizing thetrue rate of adoption. We found EHR adoption rates broadly consistent with the lit-erature, although our estimate is a bit higher than others. In particular, GartnerGroup suggests that only 7–10 percent of hospitals have made serious progress to-ward deploying CPR, and that true CPOE is closer to 1–2 percent. Data on a subsetof EHRs—CPOE—had surveyed adoption rates ranging from 3.3–21 percent(Brailer and Terasawa, 2003). Yet another study, sampling at random (a preferredmethod), estimates complete CPOE availability at 10 percent of hospitals and partialavailability at an additional 6 percent (Ash et al., 2004). As mentioned, we defined aprovider as having adopted when it had signed a contract (as reported in the data-base), so that is likely part of the reason why our adoption rate is higher than the“deployed” EHR mentioned by Gartner. On the other hand, our estimate appears tosuffer less from strong upward selection bias than others.
In summary, most of these studies have problems: The respondents are some-times from a nonrandom sample; multiple respondents are permitted from the sameorganization; and one cannot always distinguish among different settings (e.g., hospi-tal vs. ambulatory). In addition, it is rarely clear what CPR or EHR system is the fo-cus of the study. Nevertheless, in comparing the penetration rates across studies, the
Table 2.1EHR Adoption Levels in Other Studies
Study Measure Results
HIMSS (2003) CPR system 19% fully implemented37% in process
MIR (2001) Computerized datarecord (CDR)
21.6% CDR supports some CPR11% CDR also supports clinical codes
Modern Physician/Price Wa-terhouse Coopers (2003)
EMR-S 41% of respondents are from organi-zations that invested in EMR-S (31%in 2002)
NOTES: HIMSS (2003): n = 287 and 93 percent of respondents are Chief Information Officers;MRI (2001): n = 717 U.S. and international health professionals; Modern Physician/Price Water-house Coopers (2003): n = 436 physicians.
__________________________________________________________________subjective perception of what EHR is. Also, there is no truly representative dataset of different U.S. healthcareproviders giving their HIT adoption data. The Dorenfest data have these problems, although perhaps to a lesserextent than the alternatives.

10 The Diffusion and Value of Healthcare Information Technology
RAND estimate of 32 percent for EHR adoption (from Figure 2.2) looks broadlyconsistent, given that we defined adoption as “contract signed.” Rogers finds thatadoption of innovations tends to accelerate at between 15–20 percent penetration ofthe population, and this seems to be certainly true with EHR as well.
Almost all of the experts we interviewed believe that there will be a sizable in-crease in EHR adoption in the next few years.5 Even relatively pessimistic forecastsstate that CPOE penetration will eventually top 50 percent, although not until atleast 2006.
It should be noted that EHR technology is not near maturity. To take an IT ex-ample from another era, the Macintosh personal computer (PC) helped desktopcomputing saturate the mass market, but the computing power in that first Mac wasa fraction of that in current personal computers. Certainly the future EHR will havegreatly enhanced capabilities and this improvement is no doubt partly to blame forthe disparate estimates of EHR penetration, as different analysts apply different tech-nical definitions.6
Our examination of the available data suggests that
• EHR acute-care hospital penetration, after a 20+ year latency, might be near 32percent by the end of 2003.
• EHR and CPOE adoption will grow significantly in the next few years. The“early majority” have begun to adopt the technology.
• The technology will improve over time. What was considered an adequate EHRtoday will not be considered adequate in a few years.
____________5 In addition, some authors believe that the general perception that HIT is 10–15 years behind banking, manu-facturing, and the airline industry is rapidly changing (Raghupathi and Tan, 1999).6 It is interesting to note that the Institute of Medicine’s 2003 definition of a functional electronic health recordbecame less ambitious in some respects than the one issued in 1991.

11
CHAPTER THREE
EHR Past and Future Diffusion in Relation to OtherInnovations
How does EHR diffusion compare to other innovations, and how fast will it likelydiffuse if the healthcare system is left alone? To answer these questions, we (1) identi-fied historical diffusion curves, (2) surveyed the diffusion literature to identify thekey drivers of diffusion, and (3) generated a prediction of future EHR diffusionbased on a historical diffusion curve under a “change nothing” scenario.
Our objective was to place our project into a broader context and provide a rig-orous foundation for empirically and theoretically based projections of future EHRgrowth. We needed a theory that would help us predict—or at least bound—EHRdiffusion in hospitals and ambulatory settings if nothing were changed. We alsoneeded to go one step further and develop a basis for predicting, or bounding,changes in EHR diffusion as a function of potential new government policy. Thisoutput will be used and reported on in future RAND work. In the next section, wewill infer the value of this diffusion in healthcare. The review in this chapter will bestructured around these goals.
Identifying Historical Diffusion Curves
We searched the literature for candidate diffusion curves and identified over twodozen. Some of the most useful for EHR can be found in Teng, Grover, and Guttler(2002), which lists the diffusion curves of 19 information technologies. The datawere collected from 318 respondent firms in the United States from a mail sample of900. The surveys asked the respondents, often chief information officers (CIOs), forimplementation dates of the 19 technologies.1 Using the survey responses, theauthors constructed historical diffusion curves by adding up the number of firms that____________1 This method of mail survey and rely-on-recall is standard for the literature. To construct the EHR diffusioncurve, we relied on self-reported adoption data from Dorenfest. The advantage of Dorenfest is that the questionsare asked every year, which presumably obtains more reliable answers for recent years.

12 The Diffusion and Value of Healthcare Information Technology
reported having adopted a technology. Some of the diffusion curves are shown inFigure 3.1. (Note that the time scales are different for the two graphs.)
Note that mainframes diffused much more slowly than PCs, and that e-mail,which began diffusing at roughly the same time as PCs, diffused much more slowlythan PCs. Mainframes never diffused to 100 percent of the population, whereas Pcseventually did so (as did e-mail, which is not shown in the figure). Computer As-sisted Software Engineering (CASE) is a younger technology. Note that diffusion
Figure 3.1Diffusion of Selected Information Technology
RAND MG272-3.1
Ad
op
ters
(%
)
1970 19951990198519801975
40
30
20
10
100
0
80
90
70
60
50
PC
CASE
Ad
op
ters
(%
)
1950 19951990196519601955
40
30
20
10
100
0
80
90
70
60
50
1985198019751970
Mainframe
PC
Mini
SOURCE: Teng, Grover, and Guttler (2002).NOTE: CASE refers to computer assisted software engineering.

EHR Past and Future Diffusion in Relation to Other Innovations 13
speed and ultimate saturation varies within IT innovation, even for the same sampleof firms.
We found consumer product diffusion curves drawn from a survey by Hall andKhan (2003). Figure 3.2 highlights the wide divergence in diffusion rates.
To compare across technologies more easily, we list the amount of time it tookfor an innovation to diffuse broadly across potential adopters (see Table 3.1). Thetable charts the time from midway through the “early adoption” period (8 percentadopted) to the end of the “late majority” period (84 percent adopted).2
The table illustrates that not all innovations diffuse to 100 percent of the appli-cable population. There are usually very good reasons for incomplete diffusion,varying from cost to technical need to technological progress of competing innova-tions. Also, the median adoption period, including six IT innovations, is 25 years.
Economy-wide adoption of valuable innovations—including high-value IT—can take a long time and often never reaches 100 percent.3
Figure 3.2Diffusion Rates in the United States for Selected Consumer Products
RAND MG272-3.2
Shar
e (%
)
1900 199019801970196019501940193019201910
Electricservice
Refrigerator
Telephone
Washingmachine
VCR
PC inhousehold
90
40
30
20
10
100
02000
80
70
60
50
SOURCE: Hall and Khan (2003).NOTE: VCR refers to video cassette recorder.
____________2 These terms are from Rogers (1995).3 The slowest adoption we found is the length of time it took the Royal Navy to move from clearly linking citrusconsumption and the reduction in scurvy to requiring sailors to eat citrus—150 years (Rogers, 1995). There ap-pears to be a trend over time toward more rapid adoption of innovations in general. This might suggest that morerecent diffusion curves will be more relevant in understanding modern HIT diffusion. If one defines “population”broadly, then no innovation diffuses to 100 percent of the population. But more informally, it means that eventhose with resources and opportunity who would benefit to some extent do not always adopt the innovation.

14 The Diffusion and Value of Healthcare Information Technology
Table 3.1Time to Progress from “Early Adopters” to the End of “LateMajority” Is Variable
Type of InnovationYears Taken to Diffuse to the Late Majority
Electric service 36
Telephone > 43
Washing machine > 60
Refrigerator ~20–30
VCR ~7
PC in households > 15
PC in businesses 7
Mainframe > 45
Minicomputer ~25
E-mail 11
Median 25
SOURCES: Rogers (1995); Hall and Khan (2003); and Teng, Grover,and Guttler (2002).
Drawing from the literature, we have now identified a number of candidate dif-fusion curves based on the history of diffusion of other innovations. EHR diffusionmay resemble one of these curves, which would allow us to explain past diffusion in ageneral industrial context and to generate a prediction for future EHR adoption. Topick a curve, we need to have a theory to guide our choice.
Because diffusion theory is well established, we used that theory to generate aprediction of future EHR diffusion and explain its past diffusion. We provide thelessons from a large literature survey below.
Using the Literature to Identify Key Drivers of Diffusion
The diffusion literature is both vast and varied in its methodological approaches andinterests. The books and articles we selected are more heavily weighted toward sur-veys or meta-analyses and are based on hundreds of diffusion articles and sometimesdecades of research from a variety of disciplines. In our discussion, we present a con-densed rather than comprehensive literature review that attempts to focus on predic-tion of EHR diffusion.

EHR Past and Future Diffusion in Relation to Other Innovations 15
The literature can be organized in several categories:
Type of innovation (such as IT, agricultural, etc.).Industry. Although healthcare is represented, a large number of industries arestudied and the important theoretical results apply across industries.Academic discipline (such as sociology, economics, etc).Level of analysis. Level of analysis refers to whether the study attempts to under-stand or predict the adoption behavior of individuals, organizations, or entireindustries. Individual adoption behavior, if it occurs within a firm, is often re-ferred to as “intrafirm” diffusion.Academic objective (such as prediction, description).
Despite the massive amount of work, most of it is descriptive, in the sense that,after collecting data on a historical diffusion process, it finds variables that are corre-lated with diffusion. Very little work has been performed that assists with ex-anteprediction of diffusion paths for specific technologies. This weakness in the literatureappears to be increasingly well recognized, and there are now calls for further predic-tive work. However, there is relatively little today that is of help (with the exceptionof one prominent example discussed below). Partly because of this weakness, we de-cided to select and use important insights from several academic disciplines.4 Wefound it most useful to focus on a cross-product, cross-industry, cross-disciplinary,predictive framework.
Key Papers in HIT Diffusion
The theoretically strongest diffusion papers, crucial to building a predictive theory,are outside healthcare IT. However, the key papers in healthcare IT diffusion lead usto believe that the general diffusion theory is applicable to HIT and to EHR specifi-cally. We review below only those few papers that build the bridge from diffusiontheory to healthcare IT. Where healthcare appears to specifically depart from diffu-sion theory, we note it in the analysis.
England, Stewart, and Walker (2000) place healthcare information technologydiffusion into Rogers’ (1995) well-known diffusion framework (discussed below).Their paper demonstrates that HIT can be placed in a framework that is validated bya large body of existing work. In this endeavor, the article is very much in the spiritof what we are trying to accomplish here, that is, to provide a broader context forunderstanding HIT diffusion. Although placing HIT into a framework is not asgood as testing HIT adoption predictions in that framework, the authors are able tomethodically assess variables that drive HIT diffusion. The authors conclude that the____________4 Furthermore, there is little work across national boundaries. Because we are concerned with U.S. HIT diffu-sion, we will draw more heavily from the sizeable U.S.-based literature.

16 The Diffusion and Value of Healthcare Information Technology
observed “slow”5 diffusion of HIT is explainable, given the providers’ fragmentedinternal structure, immature status of strategic HIT, constrained financial resources,and complexity of the HIT systems. The authors do not attempt to predict futureHIT diffusion or to suggest how government policy would change uptake quantita-tively.
Anderson and Jay (1985) are important to this study because their study vali-dates a crucial point for our purposes. They find that informal communication net-works, in this case physician networks, are very important to the process of diffusion.This is consistent with Rogers’ (1995) framework in which informal communicationnetworks are important to diffusion. Anderson and Jay find that network locationhas a significant effect on adoption independent of practice characteristics or thebackground of a physician.
Anderson and Jay have also discovered that “epidemic effects,” discussed belowin more detail, play a substantial role in physician adoption: Physicians talk to eachother and social interaction is an independent driver of adoption—it is not merelyassociated with the “true” variables that drive adoption.
Epidemic effects are a classic externality. Their existence in this context suggeststhat some government intervention to promote adoption might be socially beneficial,depending on the state of diffusion.
Having established some basic congruency between the diffusion literature andthe diffusion processes inside healthcare, we turn to the broader diffusion review andmethodological framework. The next two sections explain the methodology for gen-erating a diffusion curve. Readers not interested in the technical details may skipahead to the section titled “An Integrated Causal Model.”
Generating a Predicted EHR Diffusion Curve Based on the Broader DiffusionLiterature
To narrow the task of generating a predicted EHR diffusion curve, we focus on thelevel of analysis most important to our study: industry. This level is the most impor-tant because we are attempting to predict, or at least bound, total adoption of EHRin the healthcare industry over time in the United States.
However, other levels of analysis will also contribute to our understanding ofdiffusion, such as the Anderson and Jay (1985) paper discussed above.6 We will alsoextrapolate—unavoidably—from one level of analysis to another. For example, theAnderson and Jay result pertains to individual physician behavior. We are unaware ofany published analogous result for hospitals and clinics. Nevertheless, we conjecturefrom our site visits that some degree of epidemic effect occurs at this level, meaning____________5 See, for example, Dong and Saha (1998).6 We discuss the important issue of intrafirm diffusion at the end of this chapter. Also, the need and determi-nants of effective intrafirm diffusion permeate the discussion of the realized value of IT in Chapter Four.
EHR Past and Future Diffusion in Relation to Other Innovations 17
that hospital physicians and CIOs and chief executive officers (CEOs) talk to andinfluence their colleagues in other institutions. Furthermore, since an industry issimply a collection of firms, we conjecture that epidemic effects operate at the indus-try level as well.
There are three approaches to producing a future industry diffusion curve forEHR. The first is to create a predictive, statistical diffusion model based on empiricalEHR adoption data disaggregated at least to the firm level, bolstered by solid similarempirical work from other industries. The second is to generate econometrically apredicted curve based on actual EHR uptake data to date in the form of statisticalextrapolation. The third is an inductive approach that picks a diffusion curve fromhistorically “similar” industries, where a tested theoretical model guides the selection.
The first approach is preferred on methodological grounds because it wouldclearly link changes in policy to underlying changes in variables that drive adoption,firm by firm. Unfortunately, the first approach is infeasible. We have concluded thatthere is no robust predictive theory that would allow statistical estimation of EHRdiffusion curves based on the multivariate model.7 The second approach—pureextrapolation—is feasible but has been shown to be quite unreliable.8
We will use the third methodology. We will look for (and for EHR, have con-structed from scratch) historical diffusion curves, then use diffusion theory to pickthe curve or family of curves that best predict diffusion of EHR technology into thefuture.
To select a diffusion curve, we need to be able to describe candidate curves eas-ily. The literature has widely used an equation to describe industry diffusion curves(see, for example, Teng, Grover, and Guttler, 2002, and Geroski, 1999). The rate ofdiffusion in an industry can be described as9
dN(t)/dt = (a + bN(t))[m – N(t)] (3.1)
____________7 What would be required from a dataset to populate and test such a model? Just as a starting point, we wouldsuggest longitudinal panel data of a broad sample of health providers, including their EHR adoption dates, size,for-profit status, the level of competition in each local market, products available with features and prices, gov-ernment policies including subsidies and taxes, and expectations regarding future prices and features. Data onhospital marginal costs, economies of scope, and learning curves would also be helpful. Creating such a dataset ispotentially feasible but has not been done yet for EHR.8 This method generates diffusion curves from early HIT adoption data alone. It is possible to run a regressionthat uses existing data to generate a “predicted” curve. It has been shown that generating diffusion curves fromearly adoption data is not statistically sound (Sultan, Farley, and Lehmann, 1990) because there are not enoughdata on which to base a reliable estimate and, perhaps more seriously, they are almost atheoretical in their con-struction. Thus, we will avoid relying on such estimates. Further, the adoption data are likely autocorrelated(Karshenas and Stoneman, in Stoneman 1995). While there are econometric fixes for the autocorrelation prob-lem, they further reduce effective sample size, which exacerbates the reliability problem.9 A more general form of the equation that replaces the term a + bN(t) with g(t) has been used as well, but itsheds little additional light on the exposition and is omitted.

18 The Diffusion and Value of Healthcare Information Technology
whereN(t) is the proportion of the total potential adopters at time t;a is the coefficient of “external” influence;b is the coefficient of “internal” influence or “imitation;” andm is the proportion of the potential adopters that will ultimately adopt (notethis may be less than 100 percent).10
The external influence parameter a has been interpreted as the influence ofchange agents such as vendors, government publicity, consultants, and so on. Theinternal influence parameter b could represent the influence of other adopters on therate of adoption—notice that it is multiplied by the proportion of current adopters,m – N(t). This is known in some contexts as an epidemic effect, because it is mathe-matically and conceptually the same as contagion models in biology, in which epi-demics spread through contact among individuals. The proportion of eventualadopters is influenced by the specialization, usefulness, and speed with which an in-novation overtakes it.
When this equation is fit to historical adoption curves, the statistical correlation(R2) often will exceed 99 percent (see, for example, Teng, Grover, and Guttler, 2002,Table IV).11 Many studies have shown that the diffusion equation (3.1) and itscousins fit diffusion data in many industries very well (Mansfield, 1961; Romeo,1975; Sultan, Farley, and Lehmann, 1990; Wang and Kettinger, 1995). Therefore,we will use this equation in our analysis to describe diffusion curves accurately.
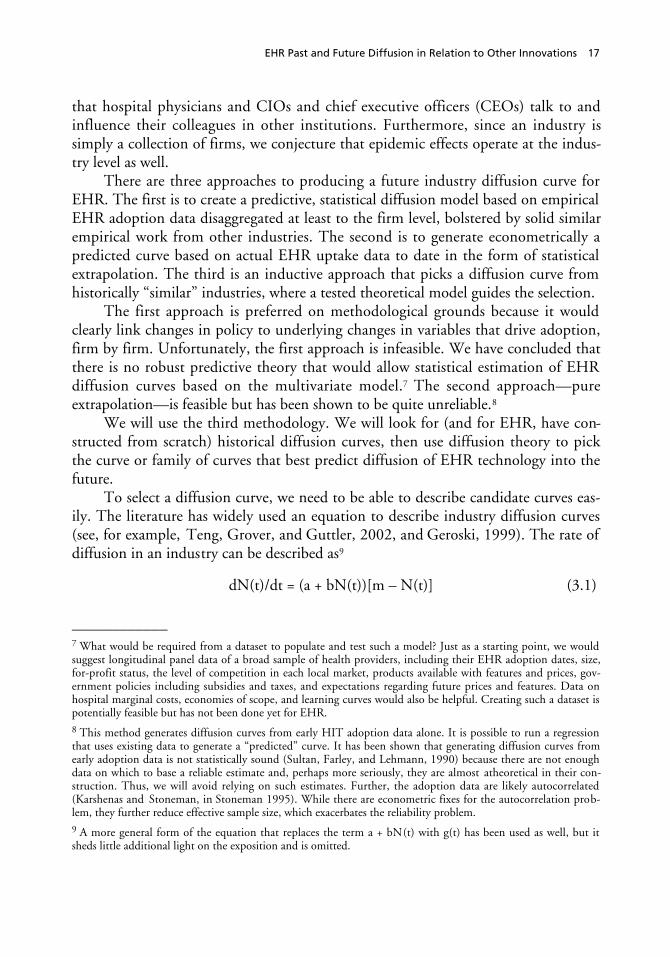
Typically “a” has very “low” values and “b” has much higher values. For exam-ple, the curve in Figure 3.3, drawn from the large-scale relational database technol-ogy, reflects a = 0.0006 and b = 0.31. Note the very long period between the “firstadopter” at time = 0 and the technology really taking off—it takes 15 years to pro-gress from the first adoption to 5 percent penetration. As we discussed above, this lagis characteristic of many technologies, including IT.
The Basic Causality Problem
Because Equation (3.1) has very high levels of fit, it is tempting but completely erro-neous to attribute causality to the model coefficients—or to go further and conclude,from the low values of “a” and high values of “b” in published regressions, that “in-ternal” influence drives adoption. This curve characterized by Equation (3.1), or very____________10 Equation (3.1) is a differential equation whose solution is a logistic curve characterized by a long equation andis omitted for brevity. See Figure 3.3 for a graphical example.11 Other models that use a different functional form for the term a + bN(t) generate almost equally high R2.
EHR Past and Future Diffusion in Relation to Other Innovations 19
Figure 3.3Diffusion Curve for Large-Scale Relational Databases
RAND MG272-3.3
Ad
op
tio
n (
%)
1 353331292725 37171513
Years since first adoption
119753
40
30
20
10
90
0
80
70
60
50
NOTE: 318 respondent firms.
232119
similar S-curves, can be generated by many competing theories of diffusion. For in-stance, a pure epidemic effect or a purely nonepidemic economic model can generatecurves that fit that equation (Hall and Khan, 2003; Geroski, 1999).12
With more variables of microeconomic interest, a number of models have foundthat S-curves can be generated from adopter-level decisions in internally consistentmodels of individual decisionmakers (Chatterjee and Eliashberg, 1990; Chattoe andGilbert, 1998; Silverberg, Dosi, and Orsenigo, 1988).
Because of inadequate data for micro-modeling discussed above, we willuse Equation (3.1) as the basic equation for prediction but will treat it as purely de-scriptive—as a convenience to describe compactly and quantitatively EHR adoptionbehavior. Our survey of causal diffusion variables, covered next, will help us choosethe correct diffusion curve.
An Integrated Causal Model
To produce our causal model, we drew from Rogers (1995), Tornatzky and Klein(1982), Moore and Benbasat (1991), Stoneman and Diederen (1994), Venkatesh etal. (2003), and O’Callaghan (in Larsen and McGuire, 1998). The resulting modeltherefore is our synthesis of their work, tailored to the issues of interest in this____________12 For example, suppose that the value of a technology is normally distributed among a population of potentialadopters. Adopters never speak to each other and adopt as soon as the price drops below their valuation of thetechnology. Price drops linearly over time. This model will generate S-curves that will fit Equation (3.1) quitewell (Hall and Khan, 2003, p. 2). Yet, by construction, there are no epidemic effects in this model.

20 The Diffusion and Value of Healthcare Information Technology
report—for example, our interest in government policy. It is important to acknowl-edge the “pro-innovation” bias of most diffusion research (Rogers, 1995). We recog-nize that our analysis assumes that EHR will ultimately diffuse over the long run andtherefore could conceivably have the same bias. However, we believe from our re-search that this is not a bias but, in fact, EHR’s destiny. The real issue is EHR uptakespeed and ultimate penetration, not whether it should or will ever diffuse to modernhealthcare.13
The causal variables selected for inclusion in the diffusion model we propose are
1. Three perceived attributes of the innovation: relative advantage, compatibility,and complexity
2. External influence, such as promotion and vendor marketing3. Social pressure via activated peer group networks (i.e., epidemic effects)4. Network externalities5. Degree of specialization of the innovation (i.e., narrowness of its appeal)6. Government policy.
The sociology tradition has focused on the first three variables, whereas the eco-nomics literature has been particularly interested in the fourth. Network externalitiesappear to be important to adoption speed (Teng, Grover, and Guttler, 2002);Saloner and Shepard, 1995; Karshenas and Stoneman, 1993). In addition, as we dis-cuss at the end of this report, they are very important elements of any rationale forgovernment policy intervention. 14 The fifth variable, specialization, has not been afocus of the broad literature. However, we found that one significant paper, discussedbelow, predicted diffusion, and so we include it here. There is relatively less in theliterature empirically on the sixth variable, government policy, although there is rea-sonably persuasive theory to guide us there. Some work in sociology from the 1970sdetails how government-led innovations can be stymied locally (Pressman andWildavsky, 1984).
We now define each variable. We will then assess EHR on each of them andgenerate a predicted diffusion curve.____________13 However, there will be failures along the way. Southon et al. (1999) detail lessons of a failed IT initiative in acomplex organization.14 Karshenas and Stoneman in Stoneman (1995) articulated an important alternative, economically oriented viewof adoption. They view the adoption decision as an interaction between demand-side (potential adopters) andsupply-side (vendor) forces. Their view is correct but not easily estimable for the same reasons already articulated:It is very data-intensive to adopt this approach and then populate the subsequent model with data. In addition,the supply side of certain HIT products, such as CPOE, is historically underdeveloped, as illustrated by the num-ber of homegrown systems.

EHR Past and Future Diffusion in Relation to Other Innovations 21
Definition of Causal Diffusion Variables for EHR
Perceived Attributes of the Innovation: Relative Advantage, Compatibility, andComplexity. These attributes are taken from Rogers (1995). In Tornatzky andKlein’s meta-analysis of 75 diffusion studies, they found that (only) these three char-acteristics, among the larger set defined by Rogers, were consistently significantacross those studies.
1. Relative advantage. Relative advantage is the degree to which an innovation is per-ceived as being better than the innovation that it supersedes. Relative advantage isoften expressed as degree of profitability, social prestige, or other benefits.
2. Compatibility. Compatibility is the degree to which an innovation is perceived asconsistent with the existing values, past experiences, and needs of potential adopt-ers. An idea that is more compatible is less uncertain to the adopter and fits moreclosely with the organization’s situation. A new idea is affected by the old ideathat it supersedes.
3. Complexity. Complexity is the degree to which an innovation is perceived as rela-tively difficult to understand and use. Related to this is an innovation’s “systems-ness,”—more complex innovations may be adopted more slowly. A subcompo-nent of complexity, which is broken out separately in some studies, is trialability.Trialability is the degree to which an innovation may be experimented with on alimited basis. New ideas that can be tried piecemeal are generally adopted morerapidly than innovations that are not divisible and therefore are more complex toimplement. Another complexity subcomponent is observability. Observability isthe degree to which the results of an innovation are visible to others.15
External Influence, Such As Promotion and Vendor Marketing. Theoretically,external influences such as promotion and marketing affect adoption (purchase) be-havior, although we found little evidence in the diffusion literature of promotion’seffect on diffusion.16 We found little empirical work that separates the independenteffect of promotion, although almost all models mention it as a driver. In the mixedinfluence model, “a,” the external influence parameter, is typically very small but thatcannot be used to infer a low level of external influence. Because of the lack of evi-dence in the literature and in our site visits, we cannot use this variable when select-ing a curve. Our subjective judgment is that it is not a key driver in EHR diffusionand that there are other more important factors.____________15 Prater and Sobol (2003) have developed a tool to estimate the profitability of IT investment in health mainte-nance organizations (HMOs). This is an example of a tool that increases the observability of an innovation.16 We did not survey the prodigious literature on the effects of promotion and advertising on purchase behavior.

22 The Diffusion and Value of Healthcare Information Technology
Social Pressure Via Activated Peer Group Networks..17 It is very clear from our
site visits and literature review (Anderson and Jay, 1985) that physicians and hospitalmanagers acquire adoption-relevant HIT information through informal contact withtheir peers. These peers are generally early adopters or “champions” of the technologyand are physicians. The dissemination activities of these champions are known in thediffusion literature as “epidemic effects via activated peer group networks”(O’Callaghan, 1998).
Network Externalities. An externality is present when a cost or benefit accruesto a provider besides the purchaser. Specifically, a healthcare provider making a deci-sion to join a network does not take into account that others will benefit from theprovider’s joining. For example, the Internet and the fax machine are technologiesthat have network externalities: purchasing an online service or a fax machine is morevaluable the more other consumers can be reached with the technology. In this case,adoption may be slower than optimal, as consumers play a game of waiting for othersto join first. Network externalities are prevalent in IT (Hall and Khan, 2003).
It is possible to lump network externalities under “relative advantage” above,but we treat this driver separately because of its importance in EHR for diffusionand, potentially, for government policy.
Degree of Specialization. Degree of specialization refers to the breadth of thetechnology’s appeal. Some technologies have broad appeal for virtually all membersof a population, whereas others are narrower. More specialized technologies may dif-fuse rapidly or slowly but will not diffuse ultimately to all potential adopters.
Government Policy. Government policy sets the rules of the game and affectsincentives for adoption. We discuss government policy in detail in the policy section.Hence, we do not treat it here in our discussion of predicting EHR diffusion underthe “change nothing” scenario.
Assessment of Causal Diffusion Variables with Respect to EHR
Part of our assessment relied on a series of surveys and interviews conducted at facili-ties that were using or contemplating the use of EHR. In the first six months, oursurvey used a purposive sample identified through literature and expert recommenda-tions. The sample consisted of thought leaders and early adopters (primarily aca-demic medical centers), new adopters of advance EHRs, primary care sites, nonadop-ters, and community health networks and included both closed and open healthcaresystems. Sixteen sites were visited.____________17 Social pressure can be thought of as parts of relative advantage. We have broken them out separately because oftheir significance in the sociology literature and the normative theory of policy intervention discussed below.

EHR Past and Future Diffusion in Relation to Other Innovations 23
Later visits were specifically to gather cost and HIT-related process improve-ment information from sites identified as engaging in these activities.
Site visits were supported by thought leader telephone interviews. The site visitgoals included fact-finding and hypothesis development; identifying barriers and en-ablers; value measurement; and the range of implementation strategies and costs. Wealso met with thought leaders and early adopters to understand the state of develop-ment.
To measure firm-level attitudes, we used the key respondent approach whennecessary (Hu, Chau, and Sheng, 2000), interviewing CIOs and other senior execu-tives regarding their own organizations.18 We bolstered the key respondent approachby interviewing other respondents in the hospital, including the CEO, nurse admin-istrators, and other physicians. Our approach is biased toward senior officers. There-fore, our analysis may reflect adoption decisions at the organizational level morereadily than the decisions of line individuals to adopt (e.g., individual physicians).We aggregated firm-level responses to obtain an industry-level assessment.19 Finally,we relied on an extensive review of secondary sources and literature. Our summaryassessment of all of this information is presented in Table 3.2.
Table 3.2Assessment of EHR Attributes on Causal Diffusion Variables
Causal Diffusion Variable Assessment of EHR
Perceived attributes
Relative advantage to clinicians High (at least, eventually)
Compatibility with existingsystems of care
Moderate
Complexity (for example, is it asystem or a device?)
High (definitely a system)
Other variables
External influence Low
Social pressure Moderate to high—consistentwith most innovations
Network effects High
Specialization Low to moderate
Government policy Moderate influence to date
SOURCE: RAND site visits and secondary sources.
____________18 The interview guide is available upon request from the author.19 A validated formal survey exists for individuals adopting personal workstations, which was constructed withspecial emphasis on generalizability to other IT adoption decisions (Moore and Benbasat, 1991). Their study isintraorganizational; our objective, in contrast, is to measure industry-level behavior.
24 The Diffusion and Value of Healthcare Information Technology
Relative Advantage to Clinicians
Our site visits and literature review of the value of the technology indicate that al-though EHR is costly to learn to use, it is of high value to clinicians. This evidencewill be reviewed in detail in a future report. The promise of EHR is that it will de-liver high value to clinicians, if used properly. The profitability, or return on invest-ment, of EHR has not had strong support yet. For those for whom profitability isvery important, such as for-profit hospitals, adoption has been slower for EHR. Thisappears to reflect the lack of evidence about return on investment; this lack was re-vealed in our interviews of “mission”-based need to adopt EHR, and a lack of teach-ing hospitals in this sample. However, these adoption rate differences have beenmoderate in magnitude relative to other factors discussed below.20
We assess each variable in order below.
Compatibility with Existing Systems of Care
EHR compatibility with existing healthcare systems is moderate. We have found evi-dence that EHR initially impedes workflow to a minor extent, but EHR deploymentdoes not require or cause wholesale transformation of work processes or existingpower relationships in the short term. Over the long term, there may be large organi-zational changes. In fact, such changes are crucial to realizing the full value of EHRs,but at least initially EHR use will involve moderate changes to existing workflow orvalues.
The literature is consistent with this view. Eger, Godkin, and Valentine (2001)integrate IT and consumer behavior literatures to analyze the individual physician’sacceptance, adoption, and application of IT. They conclude from their own review ofthe literature and application of their model that faster adoption will come from im-proved training, increased physician involvement in development, and obtainingphysician buy-in before purchase. All these identified issues suggest at least someEHR resistance because of imperfect compatibility with existing systems of care.
Complexity
EHR is without question a highly complex system. This applies especially to the in-teroperable, complete-system vision of the future EHR. These systems take years, andmillions of dollars, to implement at major hospitals, and typically tens of thousandsof dollars per physician in small practices.____________20 In general, diffusion theory was created to explain diffusion across both profitmaking and nonprofitmakingenterprises. Health’s mixed features affects but does not preclude its application here.

EHR Past and Future Diffusion in Relation to Other Innovations 25
External Influence
As discussed above, there is little evidence to bring to bear on the variable of “exter-nal influence,” such as promotion and vendor marketing, so its assessment is omit-ted. Our subjective judgment is that this omission is not crucial.
Social Pressure
Social pressure does not necessarily refer to coercion but generally includes peer in-fluence. This appears to be strong in healthcare, judging by our interviews and thepublished literature. Physicians, especially the mainstream clinicians, often learnabout new medical techniques from their peers. The early adopters tend to find in-formation from a broader group of sources. In this sense, the diffusion of medicalinnovation is highly consistent with diffusion of innovations in other settings. Thisincreases our confidence in applying a predictive model of diffusion in the next sec-tion.
Network Effects
Network effects in EHR diffusion are certainly present. Evidence rests fundamentallyon the following observations: The current system is incomplete and results in dupli-cation of tests, poorer compliance, and medical errors, among other problems. Pa-tient care and value to the physician of any EHR are higher, often much higher, ifthe system has complete information at the point of care. Therefore, any providercontemplating an EHR would find the system more valuable if it can link all careinformation about its patients.
This sets up the classic externality: The value of EHR is higher if others alreadyhave it or if all providers in an area buy in at once. However, the institutional struc-ture of U.S. healthcare is not integrated at the care level. Care is not patient-centered,it is provider-centered and operates with autonomous provider units. There may bevery good, independent reasons for this decentralization, but it is hindering the inte-gration and diffusion of EHR.
There have been notable success stories about overcoming EHR network exter-nalities, usually involving an agency with sufficient scope to have the right incentivesand an individual (almost always a physician by formal training and an IT expert byinterest) who acts as an extraordinarily committed champion for digital medicine. AtInland Northwest Health Services in Washington State, this nonprofit organizationcreated a unified EHR for more than two million patients in the region. Communityphysicians can access full fidelity clinical imaging, in addition to patient data, fromtheir homes, offices, and at the point of care. Many also choose to link wirelessly.They report that the tool has decreased daily rounds by 30–45 minutes per physician.
Other authors have observed the network externality problem. Goldsmith(2003) notes that there is a physical infrastructure impediment to realizing networkbenefits: “because 83% of physicians’ records are in paper form, building interfaces

26 The Diffusion and Value of Healthcare Information Technology
from the hospital or other physicians’ offices to reach them is technically impossible”(p. 50). He also mentions mistrust between hospitals and physicians and their com-pletely separate information domains.
Further empirical evidence, albeit indirect, for network externalities can befound in many other industries. Saloner and Shepard (1995) found fairly strong net-work effects in banks’ adoption of automated teller machines (ATMs). Adoption ismore rapid in banks with more branches (a proxy for network effects) and higher to-tal deposits (a proxy for production scale economies). Majumdar and Venkataraman(1998) studied 40 large telecommunications firms in a dataset from 1973–1987.They found evidence for network effects but not evidence of imitative (epidemic)effects. Gowrisankaran and Stavins (2002) examined automated clearing house(ACH) technology using a quarterly panel dataset on individual bank adoption anduse. They used three methods to identify network externalities. All three methodssuggest that the network externalities are moderately large.
Although none of these studies in other industries proves that EHR has networkexternalities, the literature establishes that scholars have found that IT-oriented tech-nologies in other industries have easily measurable externalities when they are lookedfor. The regularity of these results and others led Hall and Khan (2003) in their sur-vey paper to single out IT as a type of innovation subject to network externalities.These findings, when combined with our healthcare-specific qualitative research,strongly suggest that there are network externalities in EHR.
Specialization
Earlier IT systems were often specialized and self contained (e.g., lab or pharmacy).However, the new EHR vision calls for integration across many clinical practices andspecialties. New EHRs are meant to be used by virtually all care providers.
Selecting an HIT Diffusion Curve
In this section, we select one historical diffusion curve as a basis for predicting HITadoption, relying on the theory and evidence presented in the previous section.
It is important to note that diffusion at the industry level (expressed as Equation(3.1)) does not connect automatically or mechanically to the data that we collect(shown in Table 3.2). To select a diffusion curve, industry-level information isneeded to find parameters a, b, and m to write down the curve
dN(t)/dt = (a + bN(t))[m – N(t)].
However, what we collected is detailed qualitative site-specific informationabout how key informants inside their respective organizations viewed relative advan-

EHR Past and Future Diffusion in Relation to Other Innovations 27
tage, complexity, network externalities, and so on. Therefore, the data collected are ata different level (key respondents instead of industry) and of a different kind (charac-teristics instead of a, b, m). We will consider these issues in more detail in our policyanalysis. Inferences will be required to make the jump from what we have to what isneeded. We will use best judgment to pick a diffusion curve (a, b, m) based on spe-cific adoption attributes listed above.
We are aware of only one paper that attempts to take characteristics from diffu-sion theory and use them to suggest the rate and ultimate level of diffusion (a, b, m)in an industry. We use this paper for our analysis.
As mentioned in the previous chapter, Teng, Grover, and Guttler (2002) study19 IT applications in a survey that was sent to 900 U.S. companies and received re-sponses from 318 firms. (This is considered a good response rate in the diffusion lit-erature.)21 They fit the curves to several models, finding that the model in Equation(3.1), the mixed influence model, provided the best fit in more technologies thancompeting models.
All the models had very high levels of fit—often over 99 percent. The 19 regres-sions yield 19 estimates of (a, b, m), each corresponding to one IT innovation’s diffu-sion. Because “a” is close to zero in virtually every regression, they omit “a” and con-sider the pairs (b, m). They subjected the 19 pairs to a factor analysis to see how thetechnologies cluster. This is shown in Figure 3.4. The vertical axis is “m,” the ulti-mate saturation, and the horizontal axis is “b,” the coefficient of imitation, which isproportional to the speed of diffusion (roughly, the slope of the diffusion curve).There are similarities within the groups that appear to be explainable using diffusiontheory.
According to the authors’ analysis, an IT innovation will tend to achieve higherlevels of saturation (high m) if it has
• High relative advantage• Less specialized appeal/greater mass appeal• High compatibility with user work processes• Low complexity.
An innovation will achieve faster diffusion if
• It is a device, not a system• Has a low level of network externalities.
____________21 There is some evidence that mail surveys have not proven to be reliable in HIT. Ash et al. (2004) found re-sponse bias in their study of CPOE adoption.
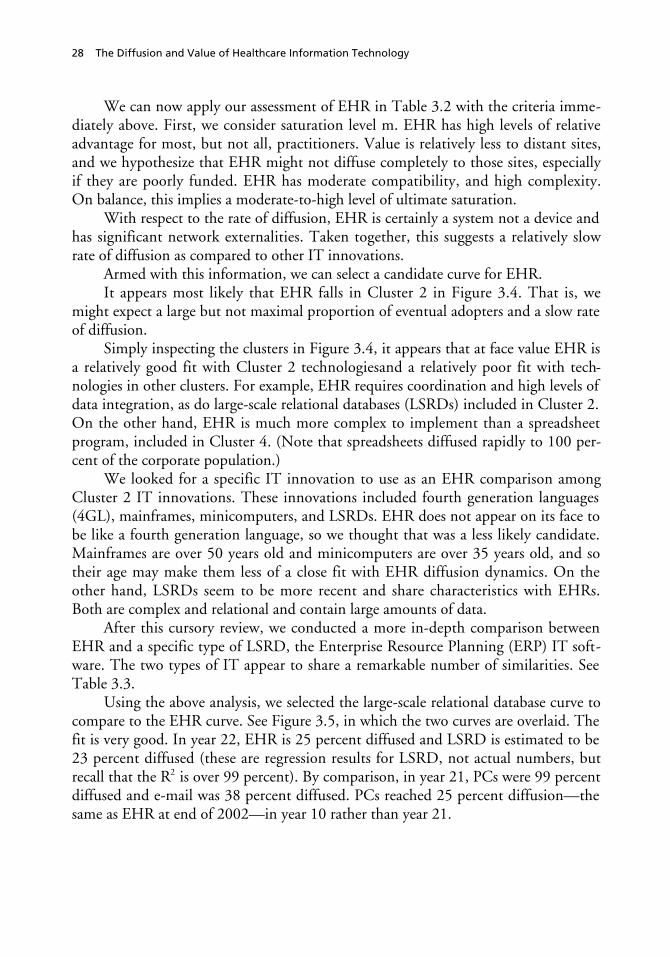
28 The Diffusion and Value of Healthcare Information Technology
We can now apply our assessment of EHR in Table 3.2 with the criteria imme-diately above. First, we consider saturation level m. EHR has high levels of relativeadvantage for most, but not all, practitioners. Value is relatively less to distant sites,and we hypothesize that EHR might not diffuse completely to those sites, especiallyif they are poorly funded. EHR has moderate compatibility, and high complexity.On balance, this implies a moderate-to-high level of ultimate saturation.
With respect to the rate of diffusion, EHR is certainly a system not a device andhas significant network externalities. Taken together, this suggests a relatively slowrate of diffusion as compared to other IT innovations.
Armed with this information, we can select a candidate curve for EHR.It appears most likely that EHR falls in Cluster 2 in Figure 3.4. That is, we
might expect a large but not maximal proportion of eventual adopters and a slow rateof diffusion.
Simply inspecting the clusters in Figure 3.4, it appears that at face value EHR isa relatively good fit with Cluster 2 technologiesand a relatively poor fit with tech-nologies in other clusters. For example, EHR requires coordination and high levels ofdata integration, as do large-scale relational databases (LSRDs) included in Cluster 2.On the other hand, EHR is much more complex to implement than a spreadsheetprogram, included in Cluster 4. (Note that spreadsheets diffused rapidly to 100 per-cent of the corporate population.)
We looked for a specific IT innovation to use as an EHR comparison amongCluster 2 IT innovations. These innovations included fourth generation languages(4GL), mainframes, minicomputers, and LSRDs. EHR does not appear on its face tobe like a fourth generation language, so we thought that was a less likely candidate.Mainframes are over 50 years old and minicomputers are over 35 years old, and sotheir age may make them less of a close fit with EHR diffusion dynamics. On theother hand, LSRDs seem to be more recent and share characteristics with EHRs.Both are complex and relational and contain large amounts of data.
After this cursory review, we conducted a more in-depth comparison betweenEHR and a specific type of LSRD, the Enterprise Resource Planning (ERP) IT soft-ware. The two types of IT appear to share a remarkable number of similarities. SeeTable 3.3.
Using the above analysis, we selected the large-scale relational database curve tocompare to the EHR curve. See Figure 3.5, in which the two curves are overlaid. Thefit is very good. In year 22, EHR is 25 percent diffused and LSRD is estimated to be23 percent diffused (these are regression results for LSRD, not actual numbers, butrecall that the R2 is over 99 percent). By comparison, in year 21, PCs were 99 percentdiffused and e-mail was 38 percent diffused. PCs reached 25 percent diffusion—thesame as EHR at end of 2002—in year 10 rather than year 21.

EHR Past and Future Diffusion in Relation to Other Innovations 29
Figure 3.4Cluster Analysis of 19 IT-Innovation Diffusions
RAND MG272-3.4
SOURCE: Teng, Grover, and Guttler (2002).
m—
satu
rati
on
leve
l (%
)
b—index of imitation
100
90
80
70
60
50
40
30
20
10
.10 .20 .30 .40 .50 .60 .70 .80 .900
Workstation Spreadsheet
PC LAN
Client/server
Teleconferencing Email
Mini
CAD/CAM
4GL
EIS
Imaging
CASE
ISDN
Expertsystems
Largescale RDB
Mainframe
FAX
Cluster 1
Cluster 2
Cluster 3
Cluster 4
Cluster 5
Speed of diffusion
EDI
The definitional difficulties of assigning the date for the first EHR (discussed inChapter Two) could move the EHR curve in Figure 3.5 to the left by a few years,which would change the point estimates for the curve and make it look like a lessperfect fit. Also, physician office diffusion is lower, as noted above. However, notethat the general shapes of the curves are very similar. For purposes of future predic-tion, given current penetration, the starting date is less important than the overallshape and ultimate saturation of the diffusion curve.

30 The Diffusion and Value of Healthcare Information Technology
Table 3.3Comparison of Enterprise Resource Planning and Electronic MedicalRecord IT
Point of comparison ERP EHR
Objective Integrate and optimize an enter-prise’s internal manufacturing, finan-cial, distribution, and human resourcefunctions
Integrate and optimize a careprovider’s physicians, financialoperations, labs, and pharmacy
First steps inimplementation
Complex and expensive re-engineering of legacy IT systems
Complex and expensive re-engineering of legacy IT systems
First generationtechnology
Intrafirm collaboration among de-partments
Intrahospital collaboration amongdepartments
Second generation tech-nology
Collaboration across firms (e.g., ven-dors)
Collaboration across care provid-ers (e.g., hospitals and physicians’offices)
Information flow Real time and simultaneous Real time and simultaneous
Consequences of inaction Department or firm isolated within itsbusiness environment
Department or care provider iso-lated within its care environment
Based on the above . . .
Complexity High High
Network externalities High High
SOURCE: Gartner Group and RAND analysis.
Figure 3.5Diffusion of EHR LSRD
RAND MG272-3.5
Pen
etra
tio
n (
%)
1 353331292725 37171513
Years since first adoption
119753
40
30
20
10
90
0
80
70
60
50
232119
EHR
LSRD

EHR Past and Future Diffusion in Relation to Other Innovations 31
In light of these results, it seems that EHR diffusion has been “slow” more withrespect to high expectations of innovators than with respect to historical rates of dif-fusion across numerous technologies, including recent IT innovations. In addition,to the extent that it has been slow, it is explainable within classic diffusion theory—historically, complex systems diffuse more slowly and systems characterized by exter-nalities diffuse more slowly. EHR has both of these qualities.
Considering both theory and historical information, it may not be realistic toexpect EHR to diffuse across 100 percent of potential adopters without governmentintervention.
The literature has less to say about why diffusion in an industry starts at a spe-cific time. Because of the long latency, another question might be why does IT diffu-sion in healthcare rapidly increase later than in other industries? Without much the-ory available, we will allow ourselves some speculations. First, diffusion by type ofHIT varies dramatically—in contrast to EHR, financial or stand-alone applicationshave diffused widely and early in healthcare. These applications had a direct effect oninstitutions’ financial health, and adopters took advantage of them. Second, compari-sons to other industries tend to suffer from selection bias; healthcare is compared tothose industries in the vanguard of IT implementation. It might be more fair tocompare it to the median industry. Third, as England, Stewart, and Walker (2000)pointed out, EHR is slower because it is a complex, networked product that is beingintroduced into a very complicated and uncoordinated system. The barriers that thislack of coordination causes will be discussed in more detail in the next two chapters.
Note that we might expect 80 percent diffusion of EHR by year 33, or roughly2016, even without intervention by the government. We thus should expect EHR todiffuse broadly, although not maximally, to the provider population. We now turn tothe question of how much broad EHR, and HIT, diffusion might be worth to theU.S. economy.


33
CHAPTER FOUR
The Potential Value of Wide HIT Diffusion
How much might HIT be worth in the long run? What magnitude of productivitygains is available? If HIT diffuses broadly, in particular if EHR diffuses broadly andtransforms healthcare, what might society expect to gain? To answer these questions,we must first return to the broader term of HIT, rather than considering EHR alone,even though EHR is almost certainly the most important part of the investment andone that will be largely completed over the next 15 years.
We use two complementary methodologies to answer the question of HITvalue—“bottom-up” and “top-down.” The bottom-up method is a deductive, micro-level approach based on results from generally peer-reviewed medical journals. It hasthe advantage of clearly linking gains from studies of specific HIT interventions forparticular populations to overall gains, and allows HIT gains to be identified bystakeholder. This approach will be discussed in forthcoming research. We employ thecomplementary, top-down approach for reasons discussed below.
There are problems with using the bottom-up approach to measure the longestof the long-term gains. HIT is a complementary product that helps enable long-termwork flow changes. Journal articles report (generally speaking) short-term results be-cause the HIT innovations studied are new in the reporting organizations. Further-more, even if the HIT innovation is not new, it is very difficult to attribute long-term changes to any one innovation. Therefore, the bottom-up approach cannoteasily forecast the truly large gains that the work flow changes might enable. Thesechanges may take a decade or more to show up. What is needed is evidence regardinglong-term changes and productivity gains and a theory of the drivers of IT benefits.
Such evidence exists in other industries. Some industries have undergone this ITtransformation and obtained major productivity benefits, resulting in higher profits,higher wages, and, especially, higher consumer surplus. Other industries have madethe IT investment but have not reaped the benefits.
We study both types of industries to understand inductively the magnitude ofthe gains and the complementary activities or factors that must take place to realizelong-term gains from HIT. We then assess healthcare on those activities and factors,

34 The Diffusion and Value of Healthcare Information Technology
using literature reviews and site interviews. This generates a range of predictions forthe value of HIT.
It is worth noting that this chapter is not closely related analytically to ChapterThree. The specific diffusion curve identified in Chapter Three does not alter theanalysis here. In Chapter Three, we picked a specific diffusion curve for EHR; in thischapter, we explore what rapid IT diffusion has been worth in other industries.However, both chapters are necessary to inform the policy discussion and conclu-sions in Chapter Five.
But first, since we will need to discuss productivity to discuss value, we turn ourattention to the issue of measuring productivity in healthcare.
Measuring HIT Productivity Improvements in Healthcare
HIT productivity benefits will likely arrive in the form of higher quality and lowercosts. At its simplest, productivity is output divided by input. For example, qualityadjusted life years (QALYs) divided by labor hours could be a candidate measure ofhealthcare labor productivity. Many successful healthcare innovations are aimed atmaking people healthier, at some (hopefully small) incremental cost. How wouldsuch an innovation affect labor productivity? In this case, the input (cost, in the de-nominator) goes up, but the numerator (QALYs in this example, in the numerator)goes up more. Overall, productivity (the ratio) goes up.
One problem with health productivity statistics has been the difficulty of meas-uring output at the national, aggregated level. Historically, there have been somepoor measures of productivity. In some instances, inputs to production were used asproxies for outputs.1 This ensures a measured productivity gain of zero.
Ultimately, if HIT is valuable, it should be cost effective and deliver moreQALYs per dollar of healthcare spending. For example, if HIT reduces medicationerrors without additional labor, that will reduce morbidity and mortality (increasingQALYs) and lower costs by avoiding additional expenditures to treat the iatrogenicillness. This would increase productivity.2 There are also process measures of quality,and HIT, with its emphasis on clinical decision support and best practice guidelines,will certainly help improve performance on those measures.
In the following analysis, some care was taken to choose industries in which theproductivity statistic is reasonably well measured. Difficulties still remain, which willbe dealt with in the case analysis. For example, productivity increases sometimes____________1 For example, bed days was used at one point to measure healthcare output.2 If healthcare were a standard or textbook industry, economics would assert that the productivity benefits ofadded health and higher quality could be collected by charging higher prices that reflect what people are willingto pay for better health. It is a market failure that healthcare providers can do so only very imperfectly. We willdiscuss this in more detail in Chapter Five.

The Potential Value of Wide HIT Diffusion 35
years after the initial investment. Productivity in the short run may decrease. Also,firms may increase efficiency without increasing investment, which will show up asincreased productivity.
There is another measurement difficulty besides measuring productivity. It isdifficult to attribute productivity gains to HIT specifically, as opposed to comple-mentary changes in healthcare inputs, such as labor mix, physical plant, and mediat-ing variables (e.g., work processes). This same difficulty will be seen in studies inother industries. However, that does not make the analysis useless at all; on the con-trary, it points us in the direction of understanding the broader process changes andcomplementary investments that must take place in addition to HIT investment toobtain large gains. In summary, while productivity is the right type of measure, thespecific productivity measure must be chosen and interpreted with care.
One additional investment that must take place is effort in implementation.The time that it takes to perform excellent implementation is part of the reason whyIT benefits usually take time to appear. We briefly review this literature before turn-ing to the studies of HIT value.
Implementation—A Key Factor in Realizing HIT Value
So far, we have not discussed the important issue of effective and widespread diffu-sion within the firm and the implementation techniques that assist this process.However, we have found that it is a very important issue for HIT. It is importantbecause it has been shown that the ultimate value of HIT depends on much morethan whether an organization adopts it. It depends directly on how many doctors in apractice use it and how often they use it and how well (Miller and Sim, 2004). Ulti-mately, potential users must use HIT to get the value out of it. With respect to EHR,because it is networked, the value (meaning lower costs, better quality, and fewerdeaths) increases faster than the number of users. Because of the importance of get-ting all potential users to employ EHR, lessons from the implementation literatureare particularly relevant.
The implementation literature has found that three factors are key to successfulimplementation: (1) the properties of the innovation (such as compatibility andcomplexity); (2) the features of the organizational context (such as size, degree of cen-tralization, political and regulatory constraints, and orientation toward change); and(3) the characteristics of the implementation strategy (that is, the series of activitiesrealized in the day-to-day work practices of the targeted context, Bikson et al., 1995).In a study of the early 1980s implementation of office technology, Bikson found that“resistance to computer use” was not a key factor in implementation (Bikson, 1987).This finding is reaffirmed 20 years later in our literature reviews and other researchinto physician EHR use.

36 The Diffusion and Value of Healthcare Information Technology
In our site visits, we saw that all three of these factors matter a great deal withrespect to EHR implementation success. In particular, the third factor, implementa-tion strategy, including buy-in of medical staff and adequate IT support and training,is crucial to success. Also, the features of the organizational context have predictedsuccess—very decentralized providers have tended to have more trouble with EHRimplementation.
Other studies reinforce the finding that gains from the innovation increase inthe commitment to implementation. In another study of an IT innovation, payoffsto implementation of Electronic Data Interchange (EDI) varied in proportion to itsembeddedness within the organization (Chatfield and Yetton, 2000). In this case,embeddedness is defined as the degree to which an EDI network is central (ratherthan peripheral) to managing interfirm interdependence.
EHR is intended to be absolutely central to managing such interdependencies.It should be the coordinating device for patient-centered care. Thus, the implementa-tion literature suggests that marginalizing EHR, allowing workarounds, or creatingoff-line communication mechanisms among providers will severely reduce its value.Our site visits and visits with experts certainly confirm this insight.
Other important success factors, identified by Bikson et al. (1997) and echoedin our site visits to providers with EHR, are planning for implementation, addressinga genuine user need, using pilot projects, eliciting strong support from senior man-agement (including medical management), and choosing vendors with practical expe-rience.
In a landmark study of software implementation, The Standish Group (1995)found that a shocking 31 percent of software projects (with a median expenditure of$2.3 million for a large company) failed. After extensive case studies, they identifiedthe following variables as critical to the success of implementation:
• User involvement• Executive management support3
• A clear statement of requirements• Proper planning• Realistic expectations.
There is adequate evidence that the same criteria apply to successful implemen-tation of EHR.
Our discussion of the value of EHR implementation below assumes that suc-cessful implementation techniques are applied with some diligence within providers.Implementation skills are crucial to realizing the value from the HIT investment.____________3 Also, see Goldsmith (2003), p. 173.

The Potential Value of Wide HIT Diffusion 37
The reader may ask, why make the assumption that implementation is handled well?Although implementation is very important and often is not handled well, the nextchapter concerns itself with the potential value of HIT. If implementation is poorlyhandled, we already know that the value of an HIT investment will be close to zero,or negative. By ignoring implementation analytically, we can establish an informalupper bound on the value of HIT. Furthermore, in the long run, competition shouldforce effective implementation of valuable innovations. Since this analysis forecaststhe long run, assuming efficient implementation in the long run may be the mostappropriate perspective. There is also some empirical support for this assumption:Many initial ERP implementation failures are followed by a second and more suc-cessful trial.4
We now return to the top-down analysis of HIT’s potential long-term value.There are two types of IT productivity evidence: macroeconomic and microeco-nomic. Macroeconomic evidence considers evidence of IT benefit in the entire U.S.economy taken as a whole. Microeconomic evidence considers IT benefit realized inspecific industries. We consider the macroeconomic literature and then the (morepersuasive) microeconomic literature.
Benefits of IT in the Overall U.S. Economy and in Specific Industries
Benefits of IT in the Overall Economy
Massive IT investment took place in the U.S. business community in the 1980s. APC was put on almost every work desk, as reflected in the PC diffusion data in Fig-ure 3.1. Supply chain management was automated, and customer data in a largenumber of industries were computerized.
By the mid-1990s, annual U.S. labor productivity increases continued to lag no-ticeably behind many other national economies. Investigations were launched, andone main culprit was identified: information technology. People started to ask:Where are the economic gains for our billions of dollars of IT investment? There wastalk of overinvestment, or at least underuse, of IT.
By the late 1990s, the story had changed. U.S. productivity surged in the sec-ond half of the 1990s. After some investigation, many concluded that IT investmentwas finally showing up in national productivity gains.5 Oliner and Sichel (2000) findthat IT created an extra 0.7 percent per year increase in labor productivity (see Figure4.1). The gains accumulate over time. Furthermore, most of the evidence from recent____________4 Personal communication with J. Teng, University of Texas, September 2004.5 See for example, Jorgenson and Stiroh (1999).

38 The Diffusion and Value of Healthcare Information Technology
Figure 4.1IT Is Now the Single Biggest Driver of Increases in U.S. Labor Productivity
RAND MG272-4.1
An
nu
al in
crea
se (
%)
1974–1990 1991–1995
2.5
2.0
1.5
1.0
0.5
3.0
01996–1999
Extra growth from ITExtra growth from other factorsAverage annual base productivity growth
SOURCE: Oliner and Sichel (2000).
government statistics suggests that the gains of the late 1990s have continued into theearly 2000s.
The result that IT contributes such a large proportion to growth is not withoutcontroversy among growth accounting economists. It is well known that in economicbooms, as occurred in the late 1990s, output increases faster than labor hours; there-fore labor productivity improves. Exactly how much of the increased labor produc-tivity to attribute to this cyclicality varies by study. If one attributes a great deal of aproductivity increase to cyclicality, that leaves less for IT to explain.
One notable exception to the bullish consensus is Gordon (2002), who analyzesaggregate growth data and finds that almost all of the growth is due to cyclical fac-tors. However, most studies find some solid improvements to labor productivity inthe late 1990s, with a sizable fraction due to IT. More recent Bureau of Labor Statis-tics data, through 2003, seem to strongly confirm this: Productivity has continued toimprove markedly even without strong economic growth. It appears to be a majorfactor in the “jobless recovery” of 2002–2003.
The suggested reasons for the delay in realized productivity improvements werethat firms have to learn how to use IT to re-engineer their work processes and have toget enough IT on board to realize the benefits of IT complementarities. There ap-peared to be perhaps a 5–15 year lag between the IT investment and large labor pro-ductivity gains. In other words, there is a long latency between investment and re-turn.
However, relying on nationally aggregated growth data is not adequate for ourpurposes, partly because it includes productivity numbers from IT industries them-

The Potential Value of Wide HIT Diffusion 39
selves, which are not relevant. The productivity improvements of using IT in a non-IT-producing industry (e.g., health) are conceptually different from the productivityimprovements within an IT-producing sector (e.g., computers or microprocessors).We would want to ignore gains in IT-producing sectors.
In addition, Bureau of Labor Statistics data clearly show that the productivitygains were not uniform across industries, so how one slices the data matters. Thisvariation raises the obvious question of whether healthcare would be one of the starusers of IT or one of the laggards—many non-IT-producing industries had no pro-ductivity gains at all.
A McKinsey Global Institute (MGI) study (2001) establishes the barely positiveand statistically insignificant overall relationship between IT investment growth peremployee (called the capital intensity growth rate) and acceleration in productivitygrowth, no doubt partly a result of latency effects.
The reason for this can be seen by charting the industries according to howmuch they contributed to the late 1990s growth acceleration. In fact, only six indus-tries (31 percent of GDP) constituted 99 percent of the productivity growth increaseof 1.33 percent from the early to the late 1990s. Figure 4.2 depicts net growth andidentifies the largest contributing industries, many of which will be discussed below.The figure shows that very large productivity gains have recently been rather concen-trated in a few industries. Whereas a solid 65+ percent of the economy grew at least a
Figure 4.2Cumulative Productivity Contribution Diagram: 1995 Productivity Growth Jump
Electronics (semiconductors)
Industrial mach. (computer manufacturing)
Cu
mu
lati
ve c
on
trib
uti
on
to
ag
gre
gat
ep
rod
uct
ivit
y g
row
th ju
mp
(C
AG
R, %
)
0 100806040
Cumulative share of 1995 nonfarm private sector GDP
20
0.8
0.6
0.4
0.2
1.32
1.33
1.79
31
2.0
0
1.6
1.8
1.4
1.2
1.0
RAND MG272-4.2
SOURCE: McKinsey Global Institute (2001).NOTE: CAGR refers to compounded annual growth rate.
Sum of allpositivesectors =1.79%
Netacceleration =1.33%
6 sectorsaccount for1.32% ofacceleration—99% of netaccelerationand 74% ofpositivesectors
Wholesale
Retail
Telecom
Securities

40 The Diffusion and Value of Healthcare Information Technology
little, roughly 35 percent of the economy suffered lower productivity. Besides raisingquestions about measurement error, this suggests that specific industry factors drivegrowth.
In summary, macroeconomic growth data show a weak correlation between ITintensity and productivity growth in general, at least in the short term. In addition,an analysis such as ours requires that we exclude IT-producing industries. Macroeco-nomic growth data also lack any explanation of industry-level factors, including gov-ernment policies, that may have contributed to productivity results. Therefore, weneed to look at microeconomic data from other industries to understand potentialHIT benefits for healthcare.
Benefits of IT in Specific Industries
The only healthcare productivity analysis that we uncovered was an MGI study com-paring healthcare productivity across several countries; the study did not focus on IT.The productivity literature in health is sparse, no doubt partly because of the difficul-ties in measuring healthcare productivity. Therefore, we review analyses of other in-dustries and draw lessons from those for healthcare.
Stiroh (2002) poses the question: “IT and the US productivity revival: What dothe industry data say?” He finds that productivity gains from IT are broad-based—averaging a solid contribution of 0.92 percent per year in the noncomputersectors in the economy. However, McKinsey reports that if Stiroh had removed allsix of the highest-performing sectors, rather than only the four that he did remove,then the gains would have evaporated. In other words, it is possible that the produc-tivity gains are not broad-based in the noncomputer sectors.
Figure 4.3 depicts the number of sectors of the economy that experienced aproductivity growth jump of at least 3 percent in the six years surrounding 1995.(Three percent was an arbitrary but seemingly reasonable number chosen by MGI asa cutoff for being economically significant.) The number is pro-cyclical and variesbetween two and 11. The most recent period, which includes the productivity renais-sance in question, had a very average eight sectors with that improvement. The num-ber of sectors with productivity growth jumps was not unusual and therefore not es-pecially broad-based. Instead, the unusual feature of the late 1990s is the large size ofthe high-performing sectors, reflected in the share of employment in the “jumping”sectors. In particular, the enormous retail and wholesale sectors were two sectors thatenjoyed great productivity growth. The size of the sectors helps partly to explain whyaggregate U.S. productivity did so well in the period.

The Potential Value of Wide HIT Diffusion 41
Figure 4.3Number of Sectors with Growth Acceleration of at Least 3 Percent
1983 1984 1985 1986 1987 1988 1989 1990 1991 1992 1993 1994 1995 1996
RAND MG272-4.3
SOURCE: McKinsey Global Institute (2001).aA sector is classified as “jumping” in year Y if its compounded annual growth rate of productivity for years Y through Y+3 is at least 3 percent higher than it was for years Y–3 to Y.
% share of employment in jumping sectorsa
Number of jumping sectorsa
11
1983 1984 1985 1986 1987 1988 1989 1990 1991 1992 1993 1994 1995 1996
4 3
10
2
7 810 9
4
10
58 8
8.44.2 3.2
13.1
2.7 4.212.5
6.5 8.5 5.2 5.6 7.1
29.7
6.2
MGI conducted an extensive study of the drivers of productivity gains, withspecial emphasis on understanding the source of productivity growth in IT-intensiveindustries. The industry data showed that some IT-intensive industries had notgrown faster than average, whereas others had. MGI chose a number of high-IT-investment industries to examine in case studies to identify the sources of growth.They chose to study both high-performing and low-performing industries and IT-producing and IT-using industries.
From this sample, RAND chose to review the non-IT-producing cases, becausethese would be the most similar to healthcare, given that it does not produce IT. Weconsidered six cases: telecommunications, securities trading, retail (including generalmerchandising), wholesale, retail banking, and hotels.
Three Categories of IT Investor Industries
We judged how successful these firms were in capitalizing on their IT investment andassigned them to one of three categories:
1. Dramatic successes (telecommunications, securities trading)2. Successful users (retail, wholesale)3. Disappointments (hotels, retail banking). (See Table 4.1.)

42 The Diffusion and Value of Healthcare Information Technology
Table 4.1IT Productivity Gains Varied by Industry
Industry
AnnualProductivity
Gains,1995–1999
Output Measure (InputMeasure Is Always Labor
Hours)Amount RoughlyAttributed to IT
Dramatic Successes
Telecommunications 8% Local access lines and callminutes + mobile subscrip-tions and mobile minutes +long-distance calls
Substantial—butonly a complementto other factors
Securities 18.9% innonportfoliomanagement
# equity trades plus de-flated $ value of underwrit-ing deals
Substantial—butonly a complementto other factors
Successful Users
Wholesale 8.2% Value added 1–3%
Retail 6.3% Value added 1–2%
Disappointments
Retail banking 4.1% No. of various transactions 0% to negative
Hotels 0% Quality-equivalent roomnights sold
0%
As a way to make comparisons to the national economy, keep in mind that theoverall gains for the economy from 1995–1999 from IT have been estimated at 0.7percent per year and for the noncomputer sector were 0.9 percent per year (with awide variance by industry).
All these industries had high growth rates in IT investment in the late 1990s,generally in the 12–18 percent range per year per employee. (This will be discussedin more detail below.)6 But they had very different productivity outcomes. Our dis-cussion below is intended to help develop insight about what we might expect HITto deliver in healthcare and what the key drivers of success are. These insights willalso help to inform the policy discussion in the next chapter.
Telecommunications. A series of interrelated events propelled the telecommuni-cations industry to 8 percent annual productivity growth over a period of 12 years(and likely continuing into 2005). The events occurred in a specific beneficial order.Deregulation stimulated massive competition in the industry. On the technical engi-neering side, the carrying capacity of a single fiber increased 230 percent per year for____________6 One other reasonable figure to use might be, for example, marginal investment per employee. However, theMGI analysis used the growth rate, so marginal investment is not readily available. Also, growth rates rather thandollar figures also provide a common reference for industries that vary enormously in IT capital per employee.

The Potential Value of Wide HIT Diffusion 43
six years in a row. This in turn led to high investment in capacity to deliver phoneminutes, especially mobile phones. The capacity plus the competition stimulatedlarge price decreases by carriers for consumers. The large price decreases greatly in-creased demand for phones and minutes. Finally, the telecommunications industrywas able to respond to the demand for more minutes without adding workers in pro-portion to the minutes. This led to the 8 percent annual increase in labor productiv-ity. (Note that increased demand led to the productivity improvement. Thus, oper-ating at an efficient scale, at high-capacity use, is an important productivity driver.)
MGI does not attempt to isolate the independent effect of IT in productivitygrowth; indeed, it is probably not possible to do so. IT clearly enabled growth.Without the IT capacity backbone, growth would have been much lower. But with-out competition to stimulate investment in capacity and price decreases, productivitygrowth would have been much lower. In addition, deregulation helped to enable thecompetition to take full advantage of the technical progress.
In the telecommunications industry, one can think of competition, deregula-tion, and IT as economically complementary factors—the whole is truly greater thanthe sum of the parts. When this is true, the gains of any one complementary ingredi-ent are not determined, in the same way that a bolt’s value is dependent on the pres-ence of a nut. In telecommunications, it is the sum of all three factors (competition,deregulation, and IT) that created the spectacular productivity outcome.
In this case, a fixed IT capital infrastructure was put in place that could handleincreased demand without adding workers.
Securities Trading. Securities trading is one of the very few industries in the late1990s where the Internet had an effect on industry productivity. The Internet helpedto create online trading, which led to brokerage staff reductions. There was also in-creased competition, partly because of deregulation and partly because of continuedpressure from discount brokerages such as Schwab. As with telecommunications, ITinstalled an infrastructure that allowed more trades at minimal cost.7 When securitiestrading skyrocketed during the late 1990s stock market bubble, labor did not in-crease very much.
The result was that labor productivity went up by a remarkable 18.9 percent peryear. Some of the gains were given back in the early 2000s, when trading droppedafter the Internet bubble burst.
MGI concluded that the productivity increase came from the combination ofgrowing demand, deregulation, competition, and IT. Clearly, the booming stockmarket rapidly drove up the volume of trades and the dollar value of deals and thishad a major effect on productivity. Of course, it is cyclical. However, gains in the____________7 Presumably, this will decrease the value of an individual trade, all things equal. This lowers the value per trade.Overall, value should go up. This may be similar to what will happen with e-visits in health: more value, but lessvalue per e-visit than with a classic doctor visit.
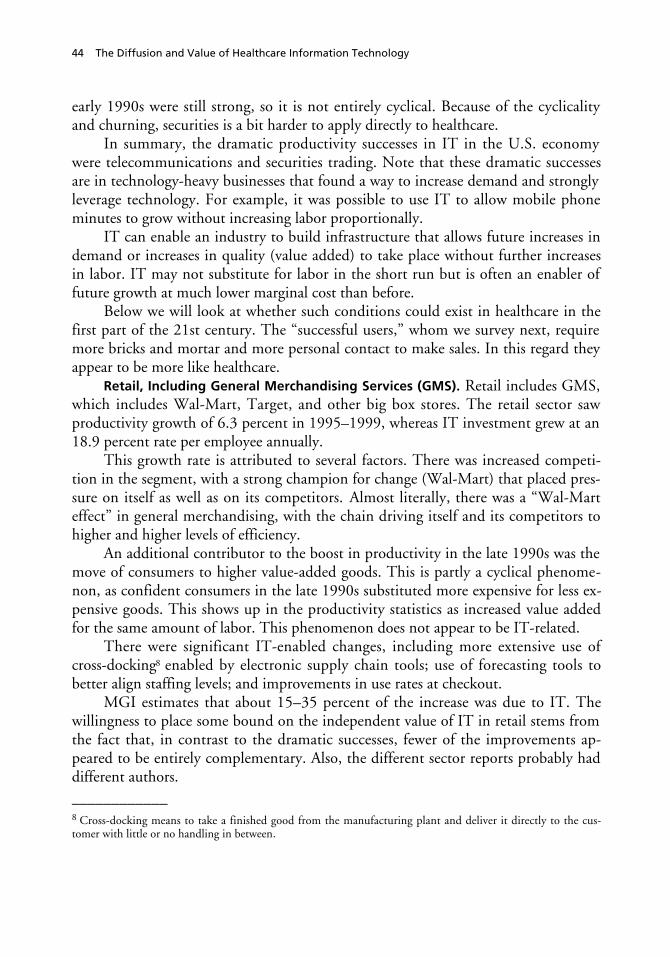
44 The Diffusion and Value of Healthcare Information Technology
early 1990s were still strong, so it is not entirely cyclical. Because of the cyclicalityand churning, securities is a bit harder to apply directly to healthcare.
In summary, the dramatic productivity successes in IT in the U.S. economywere telecommunications and securities trading. Note that these dramatic successesare in technology-heavy businesses that found a way to increase demand and stronglyleverage technology. For example, it was possible to use IT to allow mobile phoneminutes to grow without increasing labor proportionally.
IT can enable an industry to build infrastructure that allows future increases indemand or increases in quality (value added) to take place without further increasesin labor. IT may not substitute for labor in the short run but is often an enabler offuture growth at much lower marginal cost than before.
Below we will look at whether such conditions could exist in healthcare in thefirst part of the 21st century. The “successful users,” whom we survey next, requiremore bricks and mortar and more personal contact to make sales. In this regard theyappear to be more like healthcare.
Retail, Including General Merchandising Services (GMS). Retail includes GMS,which includes Wal-Mart, Target, and other big box stores. The retail sector sawproductivity growth of 6.3 percent in 1995–1999, whereas IT investment grew at an18.9 percent rate per employee annually.
This growth rate is attributed to several factors. There was increased competi-tion in the segment, with a strong champion for change (Wal-Mart) that placed pres-sure on itself as well as on its competitors. Almost literally, there was a “Wal-Marteffect” in general merchandising, with the chain driving itself and its competitors tohigher and higher levels of efficiency.
An additional contributor to the boost in productivity in the late 1990s was themove of consumers to higher value-added goods. This is partly a cyclical phenome-non, as confident consumers in the late 1990s substituted more expensive for less ex-pensive goods. This shows up in the productivity statistics as increased value addedfor the same amount of labor. This phenomenon does not appear to be IT-related.
There were significant IT-enabled changes, including more extensive use ofcross-docking8 enabled by electronic supply chain tools; use of forecasting tools tobetter align staffing levels; and improvements in use rates at checkout.
MGI estimates that about 15–35 percent of the increase was due to IT. Thewillingness to place some bound on the independent value of IT in retail stems fromthe fact that, in contrast to the dramatic successes, fewer of the improvements ap-peared to be entirely complementary. Also, the different sector reports probably haddifferent authors.____________8 Cross-docking means to take a finished good from the manufacturing plant and deliver it directly to the cus-tomer with little or no handling in between.
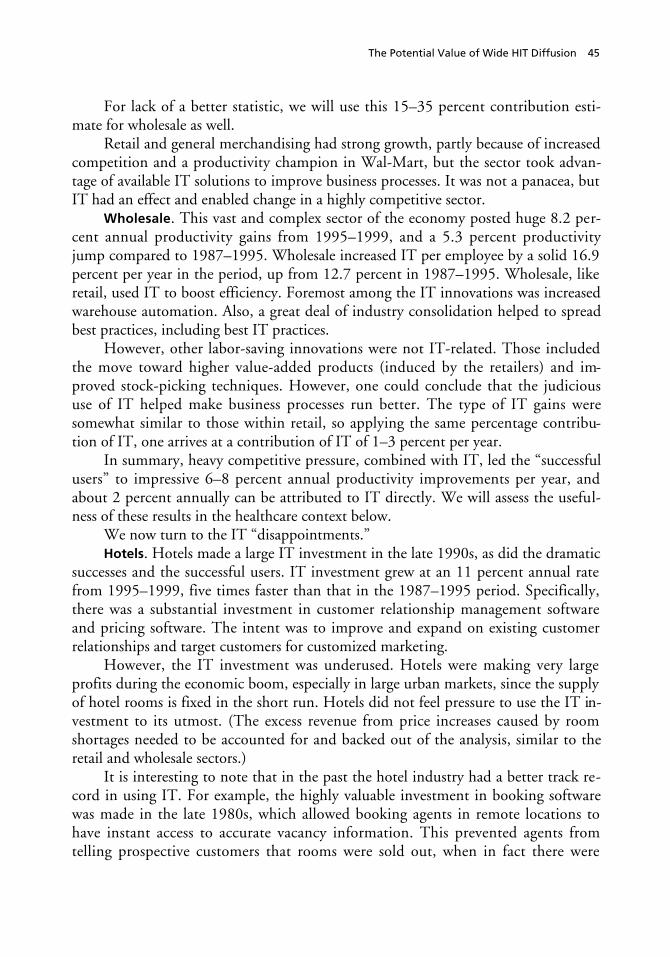
The Potential Value of Wide HIT Diffusion 45
For lack of a better statistic, we will use this 15–35 percent contribution esti-mate for wholesale as well.
Retail and general merchandising had strong growth, partly because of increasedcompetition and a productivity champion in Wal-Mart, but the sector took advan-tage of available IT solutions to improve business processes. It was not a panacea, butIT had an effect and enabled change in a highly competitive sector.
Wholesale. This vast and complex sector of the economy posted huge 8.2 per-cent annual productivity gains from 1995–1999, and a 5.3 percent productivityjump compared to 1987–1995. Wholesale increased IT per employee by a solid 16.9percent per year in the period, up from 12.7 percent in 1987–1995. Wholesale, likeretail, used IT to boost efficiency. Foremost among the IT innovations was increasedwarehouse automation. Also, a great deal of industry consolidation helped to spreadbest practices, including best IT practices.
However, other labor-saving innovations were not IT-related. Those includedthe move toward higher value-added products (induced by the retailers) and im-proved stock-picking techniques. However, one could conclude that the judicioususe of IT helped make business processes run better. The type of IT gains weresomewhat similar to those within retail, so applying the same percentage contribu-tion of IT, one arrives at a contribution of IT of 1–3 percent per year.
In summary, heavy competitive pressure, combined with IT, led the “successfulusers” to impressive 6–8 percent annual productivity improvements per year, andabout 2 percent annually can be attributed to IT directly. We will assess the useful-ness of these results in the healthcare context below.
We now turn to the IT “disappointments.”Hotels. Hotels made a large IT investment in the late 1990s, as did the dramatic
successes and the successful users. IT investment grew at an 11 percent annual ratefrom 1995–1999, five times faster than that in the 1987–1995 period. Specifically,there was a substantial investment in customer relationship management softwareand pricing software. The intent was to improve and expand on existing customerrelationships and target customers for customized marketing.
However, the IT investment was underused. Hotels were making very largeprofits during the economic boom, especially in large urban markets, since the supplyof hotel rooms is fixed in the short run. Hotels did not feel pressure to use the IT in-vestment to its utmost. (The excess revenue from price increases caused by roomshortages needed to be accounted for and backed out of the analysis, similar to theretail and wholesale sectors.)
It is interesting to note that in the past the hotel industry had a better track re-cord in using IT. For example, the highly valuable investment in booking softwarewas made in the late 1980s, which allowed booking agents in remote locations tohave instant access to accurate vacancy information. This prevented agents fromtelling prospective customers that rooms were sold out, when in fact there were

46 The Diffusion and Value of Healthcare Information Technology
rooms available in other niches of the system. These IT gains had already been real-ized by 1995.
Therefore there is evidence that IT-led productivity gains not only vary by in-dustry, but also by time period and specific IT application.
It is notable that over 50 percent of hotel staff are maids and janitors, who arerelatively unaffected by IT. Overall, the effect of IT on productivity growth in hotelsin the late 1990s was judged to be negligible. It is interesting to note that healthcare,especially hospitals, have substantial hotel-like functions and could likely have someof the same problems in leveraging IT for a segment of their employees.
Retail Banking. Retail banking, like hotels, was an IT productivity disappoint-ment. Productivity grew at a reasonable rate of 4.1 percent during 1995–1999, butthis was 1.4 percent slower per year than in the previous eight years. From1995–1999, banking made a large IT investment, growing IT investment by 16.8percent per employee per year, up from 11.4 percent in 1987–1995. For example,banking invested in an average of two computers per employee in the four-year span.
However, interviews revealed that these computers did not deliver big produc-tivity gains because the average employee did not really need the functionality andcomputing power in the new machines. The expensive functionality sat on the desk-tops without transforming the business. Banking, like hotels, invested in customerrelationship management software, but it was judged mostly a failure. The data werenot used nor marketing strategies devised to exploit the new information (although itis noted that they may be exploited in the future). It was also felt that mergers dis-rupted investment and that IT-enabled product proliferation did little to improvecustomer relations or bank profitability. Finally, the successful implementation anduse of ATMs had largely occurred before 1995 and so did not contribute to furtherproductivity improvements after 1995.
The customer relationship management “failure” reported above points out anapparent weakness in the MGI methodology that is not easily remedied. As we notedin the discussion above, IT gains can have a latency of over 10 years. Therefore,growing current IT investment (one of the selection criteria of MGI) may not lead tohigh productivity until years later, thus leading to a spurious negative correlation be-tween high current growth in IT spending and current productivity growth. So itappears that the MGI methodology is not completely consistent with results fromother literatures that suggest long latency. We note that this is a weakness, but it ismitigated by the ability of detailed case studies to draw firmer conclusions aboutwork process changes and cause-and-effect relationships in general.
Not all banking IT in this period was a failure. Imaging and voice recognitiondelivered gains, as imaging contributed to faster transmission and recording ofchecks, and customer relations staff were replaced by voice recognition.
Online banking was an innovation in the 1990s. Online banking could decreasestaff time per transaction, but online banking penetration in 1999 was so low that it

The Potential Value of Wide HIT Diffusion 47
did not affect aggregate banking labor productivity. There is also a productivitymeasurement problem: the customer convenience in online banking is an unmeas-ured benefit, at least when productivity is measured as the number of transactions.
Finally, like hotels, banking was profitable in the late 1990s, largely becausenoninterest income from stocks and property buoyed profits. This eased competitivepressures.
In summary, there was a slackening of labor productivity improvements, andunderused IT contributed to this slackening.
Information Technology as a Competitive Weapon
In all of the cases where IT contributed to high productivity, it was seen and used asa competitive weapon for differentiating a firm’s products or lowering costs per cus-tomer.
In the unsuccessful cases, IT was a peripheral activity or something new and notwell understood by the industry (e.g., customer relationship software), and manage-ment was distracted by other issues.
Baumol (2002) notes that a fundamental empirical regularity of high-growtheconomies is a firm’s use of innovation as a competitive weapon. In these economies,firms innovate to stay ahead or catch up to their competition. This is part of the “in-novation machine” of the modern western economy. Our case studies suggest that ITfits this model of productivity growth: When IT is viewed and used as a competitiveweapon and as central to the survival of the firm, it tends to enable the firm to in-crease productivity dramatically.
Potential Benefits of IT in Health
We now turn to the potential benefits of IT in health. What kind of productivityenhancement might be expected?
IT Productivity Enhancers
The six industries discussed above, all of which have high and growing IT invest-ments, show a wide range in productivity improvements—from up to 18.9 percentper year (when combined with other elements), down to 0 percent per year. Fur-thermore, the six case studies establish the key IT productivity enhancers in the suc-cessful use of IT. These success factors are summarized in Table 4.2. We will usethese factors to obtain a plausible productivity growth range for HIT. Because thereare only six case studies to identify productivity enhancers, and we have not per-formed a detailed assessment or validation of the productivity enhancers, the follow-ing analysis in this section must be considered exploratory. One way to avoid

48 The Diffusion and Value of Healthcare Information Technology
Table 4.2Assessment of IT Productivity Enhancers in Healthcare
IT Productivity Enhancer Healthcare Assessment
Raw growth in IT investment Low to moderate—IT growth roughly one-thirdof high performing industries
Competition Moderate—not as intense as retail or warehous-ing, for example; inefficiency not heavily pun-ished
IT viewed as a competitive weapon Not as of 2004, but inklings of change evident
Deregulation No; trend toward increasing regulation; publicsuspicious of labor-saving moves
Opportunity for rapid technological improve-ment
Moderate; EHR will improve, but not at the rateof change found in telecoms, for example
Excessive merger activity Probably not
Champion firm to drive change (e.g., Wal-Mart) No
Integrated system—scope of organization con-ducive to optimized IT investment
No; significant network externalities; physiciansand hospitals do not work together
Potential for HIT infrastructure to substitute forfuture labor or capital
Moderate
over-generalizing is to emphasize a range of possible healthcare IT productivity out-comes, which we will do at the end of this chapter.
The table outlines the strengths and weaknesses of the current healthcare systemwith respect to IT productivity enablers. Overall, the assessment is mixed at best. Weconsider each factor in turn then provide productivity scenarios based on the assess-ment.
Raw Growth of IT Investment. Although the microeconomic analysis clearly de-lineates the importance of complementary factors in extracting the value out of IT,the cases showed that the successful industries did invest a large and rapidly growingraw dollar amount in IT. Generally, in these industries, IT investment per employee(“IT capital intensity”) grew faster than the national average and faster than it hadhistorically. These industries increased their IT investment per year per employee at arate in the mid-teens (see Table 4.3). In comparison, within healthcare, IT invest-ment has a forecasted compounded annual growth rate (CAGR) from 1998–2006 of8.4 percent,9 and we estimate that it would be 1–2 percentage points less—perhaps5–8 percent—if investment is calculated as investment per employee. There is not anoticeable investment uptick expected from 2004 to 2006.____________9 Sheldon Dorenfest and Associates (2004).

The Potential Value of Wide HIT Diffusion 49
Table 4.3IT Capital Intensity in Assorted Industries
IndustryIT Capital Intensity
in 1999, $Growth Rate 1995–1999,% (Using Available Data)
Telecommunications 265,000 17.3
Securities 16,000 17.2
Retail 1,900 18.9
Wholesale 18,500 16.9
Banking 27,200 16.8a
Hotels 2,311 11.0
U.S. average 9,130 13.9
Health 5,000–8,000b estimate 5-8 (1998-2006 estimate)
SOURCES: MGI, the Bureau of Labor Statistics, Dorenfest, and RAND analysis.aAfter inflation.bAssumes 25 percent depreciation of IT capital stock per year. Capital intensity isquite insensitive to changes in depreciation rate.
From our perspective, this less than stellar level of investment raises two con-cerns. First, the well documented fact that healthcare spends a lower percentage of itsrevenue on IT than other industries might suggest investment that is too low. Onlythe tech-light retail and hotel industries have lower capital intensity. Wholesale hasthree times the investment per employee. We find this argument only somewhat per-suasive because interindustry comparisons of investment rates are very difficult tomake. Second, and more serious, statistics show that HIT spending is not accelerat-ing to any great degree, despite predictions of more rapid EHR uptake. As a percent-age of healthcare revenue, HIT spending is virtually flat, and compared to other in-dustries, its capital intensity growth rate is about one-third that of the high-performing industries. Because we are comparing growth rates, we do not have theinterindustry comparison problem to the same degree; therefore, the comparison forHIT spending to IT spending in the high-productivity growth sectors should bejudged appropriate. The comparison yields an unfavorable picture for the future ofHIT-led productivity growth.
The capital intensity figures themselves show wide disparities between indus-tries. IT capital in telecommunications includes the fiber and other telecommunica-tions equipment, which explains its extraordinarily high capital intensity. Hotels andretail are more labor-intensive and less capital-intensive and have strong personalservice orientations. Wholesale and banking are much higher than the average. Thesefigures suggest that telecommunications and hotels are not as good comparators forhealth, because they are so different in their approaches to the use of IT. Healthcareis more like banking and wholesale, although hospitals have significant hotel-like

50 The Diffusion and Value of Healthcare Information Technology
functions. The figures also show that healthcare is below the national average, al-though not radically so.
IT Viewed as a Competitive Weapon. The level of competition in healthcare is acontroversial subject and a detailed assessment is beyond the scope of this report.However, it seems safe to assert that compared to the level of competition in the“successful users” of IT or certainly in the “dramatic successes,” there is less competi-tion and certainly less-effective competition in healthcare, especially given the waveof provider mergers in the 1990s.
Among the successful users of IT, IT was considered a competitive weapon—away to get ahead of competitors. This has not been the case to date for EHR.10 Ini-tially, EHR was adopted by academic centers interested in building knowledge andin pursuing other intrinsic motivations such as “it is part of our mission.” However,this perception may be changing and policy could perhaps help this along, as we dis-cuss in the next section. As of this writing, patients are beginning to show an interestin having their providers use EHR, and there is great interest on the part of govern-ment about how to pay for quality. Exactly how to operationalize paying for qualityis not yet clear but is an area of active research.
Deregulation. There does not appear to be good news for IT productivity withrespect to deregulation in healthcare. There is a trend toward more regulation, in-cluding legislating nurse staffing ratios. There may be important health reasons forthe legislation; however, from the standpoint of trying to radically raise productivitythrough IT, the case studies suggest that this staffing ratio policy would hinder thetransformation that IT could enable. IT tends to work as a complementary productthat allows for radical redesign of work processes that entail changes in staffing, skillsets, and jobs. Regulation, especially labor regulation, might hinder these changes orstop them altogether.
Opportunity for Rapid Technological Improvement and Merger Activity. Thereis opportunity for technical improvement in EHR, as expressed by the gray literatureand vendors, albeit less dramatic sheer technical improvement than the case for tele-communications. Merger activity is difficult to predict but should not be a greaterimpediment than it was to successful users.
Champion Firm. Healthcare does not have a champion firm to drive productiv-ity, like Wal-Mart in big-box retail. Perhaps 15 years ago we would have argued thatthe staff model HMO would be the organization that is integrated and powerfulenough to champion change. That is clearly not the case today and no substituteseems to be in sight. Instead, as yet unformed regional health initiative organizations(RHIOs) may be on the agenda to lead change.____________10 Although it has been for stand-alone revenue-enhancing IT innovations.

The Potential Value of Wide HIT Diffusion 51
Lack of Organizational Integration. We turn now to some of the serious organi-zational issues with respect to capturing HIT value. Healthcare suffers, from an ITperspective, from a lack of organizational integration. There are significant networkexternalities in EHR. Physicians and hospitals do not work together and have notbought compatible EHR systems. Compare this state of affairs to, say, Wal-Mart,which as a single company simply dictates that its retail stores and its highly efficientwarehouses have IT systems that can interoperate. In healthcare, it is as if the retailstores and the warehouses do not work together and do not particularly trust eachother. Lack of interoperability is arguably the largest impediment to enhancing thevalue of HIT; our research repeatedly identified it as a barrier to successful adoption.Conceivably, privacy demands could forestall benefits of networked technology.These are discussed in other RAND work. However, the general conclusion is thatprivacy issues are manageable.
Potential for HIT Infrastructure to Substitute for Labor in the Future. Most suc-cessful IT-using industries were able to pay fixed costs on IT to enable future de-mand growth at low marginal cost, which in turn enables productivity growth. Forexample, telecommunications invested in mobile phone capacity, which allowedminutes to grow at low additional cost. It is not immediately apparent that such aneconomic transition could take place in healthcare. Healthcare has been very labor-intensive, and machines will not take care of large numbers of patients any timesoon. It is possible that HIT could allow for much improved prevention, whichwould lead to higher quality at current funding and staffing levels. (For example, ad-vanced monitoring of chronic conditions might promote longer lives at minimalcost.) It is much harder to see how HIT would wring out a large amount of laborfrom the current system, the way that online trading did in the securities trading in-dustry.
Scenarios for Productivity Gains from HIT
From the above qualitative analysis, we generate scenarios for gains from HIT (seeFigure 4.4). The “worst” case would be if expensive HIT, especially EHR, is pur-chased and then ignored and worked around, as providers become distracted by othermatters and hospitals and physicians fail to solve the integration problem. If thishappens, productivity improvements from HIT may be near zero, as in banking andhotels in the late 1990s.
The “excellent” case of 2 percent extra growth per year essentially replicates thesuccess of the retail and wholesale sectors. This would indeed appear to be an excel-lent outcome for healthcare, and would be large enough to move the national pro-ductivity statistics in a positive direction as did retail and wholesale in the late 1990s.This size gain might not be likely, because the conditions in healthcare seem to beless favorable for IT-led productivity gains than they were in retail or wholesale in

52 The Diffusion and Value of Healthcare Information Technology
Figure 4.4Gains from HIT Improvement
Pro
du
ctiv
ity
imp
rove
men
tp
er y
ear
(%)
Worsta
RAND MG272-4.4
Baseb
Scenarios
7
4
3
2
1
8
0Excellentc Transformd
0
1
2
4
6
5
aWorst: buy IT, get distracted, work around it (banking in the late 1990s).bBase: 1/2 of excellent (some competition, good attention to implementation).cExcellent: same as retail (deregulated, competitive).dTransform: fundamentally change the process of care (IT monitoring, integrated systems, personalized medicine, etc.).
the late 1990s. IT investment is much lower, competition is not as intense, and thereis no champion Wal-Mart-type firm to drive results. Also, if physicians and hospitalsdo not work together, it will hinder realizing the gains. This suggests that perhapsone-half of the full 2 percent gain might be a more realistic outcome, or even a mod-erately favorable outcome. Note that achieving this still requires attention to imple-mentation (discussed above). The “Base” case of 1 percent is merely a subjective es-timate. The reader may reasonably consider other projections as more likely,although projections of HIT productivity improvements of over 2 percent per yeargiven the current structure of U.S. healthcare would appear to lack foundation. How-ever, we include an upper estimate of 4 percent as a subjective upper bound.
When thought leaders talk about transforming healthcare with EHR and HITin general, they are not talking about achieving roughly 1 percent productivity im-provement per year. They are talking about the kinds of benefits seen in telecommu-nications or securities—IT-enabled gains of 8+ percent per year, year after year.These sectors show that it can be done. But they also show the ingredients needed toachieve this growth: intense competition, tremendous technical improvement, ag-gressive deregulation followed by minimal government intrusion except for anti-trustvigilance, firms that are integrated to the right level to make optimal IT investment

The Potential Value of Wide HIT Diffusion 53
decisions, and, finally, a physical ability to lay down a fixed IT investment and thenhave increased demand handled by the IT infrastructure rather than by more workersand more non-IT capital.
None of these conditions applies today in health, but these conditions suggestdirections for policy improvements: Move healthcare toward the conditions provenin other industries to enhance IT and encourage raw investment in HIT.
Figure 4.5 shows the IT gains over 15 years from the different scenarios relativeto the status quo. We chose 15 years because that provides enough time for savings tobuild, and there is evidence that at least one industry, telecommunications, was ableto sustain productivity improvements over 15 years (and counting). The numbersabove the bars are the percentage savings of the total healthcare spend of $37 tril-lion.11 With a total 15-year healthcare spend of $37 trillion, the IT gains are verylarge, even though modest in percentage terms.
Under the “transform” scenario, savings are one-third of the healthcare budgeton average. Under the base case, raw dollar savings are 9 percent. Comparing the
Figure 4.5Potential 15-Year HIT Savings Are Large Because the Stakes Are Enormous
$ b
illio
ns
Worst
RAND MG272-4.5
NOTE: See the note to Figure 4.4 for scenario definitions.
Base
Scenarios
10,000
8,000
6,000
4,000
2,000
12,000
0Excellent Transform
0%
9%
17%
31%
____________11 We assumed that the productivity increases decrease only cost, rather than increase quality. This is clearlycounterfactual, but it allows for dollar quantification of the productivity benefits. Alternatively, one could assumethat all benefits accrue to quality, or something in between. For example, if all benefits are in the form of in-creased quality, rather than costs, then under the base case QALYs (or some other measurement of quality) wouldimprove 1 – 1/(1 – 0.09) = 10 percent. This analysis makes no assumptions about to whom the savings accrue,although such an analysis was performed in the larger project.

54 The Diffusion and Value of Healthcare Information Technology
worst case with the transformational case shows that IT savings can be from zero to afull one-third of the spending depending on what else is going on in the industry. Thispoints out in another way how important other activities are and the extent that IT isa complementary good. IT is more effective when mixed with other ingredients andhealthcare IT appears to be no exception.
What other ingredients should the government add to enable HIT led produc-tivity growth, if any? We consider this question in the next section.

55
CHAPTER FIVE
Should the Government Intervene to SpeedDiffusion of HIT?
To answer this question completely, policy analysis must quantify the costs and bene-fits of HIT,1 forecast responses on the demand side and supply side of the market,and take into account the distortionary cost of raising a tax dollar.2 Unfortunately,this is technically impossible because there is little recent empirically grounded re-search about how policy interventions change technology diffusion, let alonehealthcare information technology diffusion. Some older sociological research fromthe 1970s details the failures of government mandates to change local practices, typi-cally by failures of implementation (see Pressman and Wildavsky, 1984, for exam-ple).
Leaders in diffusion research agree that there is little evaluation of specific diffu-sion policies.3 Stoneman and Diederen (1994), in The Economic Journal, state that itis surprising to find very few policy initiatives aimed at innovation diffusion.4 Otherleaders in the field, Tornatzky, Fleischer, et al. (1990, p. 239) state:
In a study of over 200 published articles in the policy research and analysis field,over half the articles could best be described as based on “wisdom” or armchairtheorizing. . . .
____________1 Again, while our purview is HIT, the primary focus of the section will be on the crucial EHR technology.2 The welfare effects of speeding up adoption are complex and certainly not unambiguously positive (Stonemanand Diederen, 1994), not least because increased sales caused by faster adoption changes the time path of pricesand quality in the industry via its effects on vendors. The medical community, however—at least those notcharged directly with paying for systems—seems to have forged a consensus to push for faster adoption. Thismessage comes from the IOM (1994) and the President’s Information Technology Advisory Committee (PITAC)(2001), among others.3 One exception is Borzekowski (2002), who finds that state price regulation slowed adoption of IT in hospitals,whereas the Medicare prospective payment system increased speed of adoption.4 They go on to say: “For an evaluation of diffusion policy, one would wish to judge whether the costs incurredby government in pursuing a policy are greater or less than the welfare increases generated by the policy. Therehave been no evaluations of actual diffusion policies on those terms.” p. 928. Karshenas and Stoneman in Stone-man (1995) state that we are currently very thin in policy analysis; the field is in its infancy.

56 The Diffusion and Value of Healthcare Information Technology
Although this lack of empirical evidence is dismaying for a field that is almost60 years old, there are some reasons for the dearth of hard data. It is very difficult tocreate the longitudinal datasets necessary to conduct policy analysis,5 and there maybe long latencies and many confounders in attempted empirical policy analyses.Therefore, we must proceed along theoretical lines and use caution in predicting theoutcomes of specific policies.
This section addresses two basic questions:
1. In a reasonably competitive market such as the one for HIT, what is the rationalefor any policy intervention? Why not just “let the market work?” That is often theleast expensive option.
2. If there is a rationale for a policy intervention, what are the possible effects of thepotentially beneficial intervention?
Rationales and Discussion of Government Intervention: MarketFailure
We use fundamental economic welfare principles to evaluate normative rationales forpolicy intervention. The argument for speeding up adoption for any type of innova-tion must satisfy two conditions: (1) adoption is better than no adoption, and (2)adoption today is better than waiting and adopting tomorrow. In this framework, thebasic reason for intervention is correcting a market failure.
There has been much discussion of the distorted incentives among patients,payers, and providers in healthcare. For example, patients do not pay on the marginanywhere near marginal cost of care; hospitals are often paid under fee-for-service,which rewards increased services rather than quality; physicians and hospitals workfor different organizations, and incentives for quality are inadequate (too many medi-cal errors) and yet also overdone in the name of quality (too many MRI machinesand tests).
However, these distortions do not seem to provide adequate motivation bythemselves for government intervention or subsidy. For example, why has HIT andespecially expensive EHR diffused as widely as it has in the face of these distorted in-centives? It is very important to identify which types of market failure appear to bethe culprits in preventing HIT and specifically EHR from diffusing widely anddeeply. We will attempt to do this below.
There are three general sources of potential market failure in HIT: imperfect in-formation, including the key role of technical standards and quality measurement;____________5 We note that HIT has the same problem—any longitudinal datasets would have had to be created for this pro-ject specifically.

Should the Government Intervene to Speed Diffusion of HIT? 57
market power; and externalities. We cover each in turn and then discuss potentialpolicies to address them.
Imperfect Information
In perfectly efficient markets, consumers costlessly collect full information aboutproduct price and quality. However, it is clear from our site visits and from the litera-ture that hospitals acquire information incrementally through informal contact withtheir peers. These are discussed in the diffusion literature review above as epidemiceffects via “activated peer group networks.”
There are almost certainly epidemic effects (“peer group activation”) in HIT,and we confirmed directly that HIT performance information flows between hospi-tals and from key medical opinion leaders to practicing physicians. Note that the“key opinion leader” terminology from medicine has very close cousins in social sci-ence terminology, with its “opinion leaders” who influence adoption behavior(Rogers, 1995). It is clear that opinion leaders drive adoption of innovations into themainstream.
The academic literature identifies indirect evidence of epidemic effects in manyother settings (see, for example, Kapur, 1995; Karshenas and Stoneman, 1993; andCzepiel, 1974).6
Epidemic effects in communication networks are important for policy becausethey could produce a multiplier effect with any policy-led increase in adoption. As aconsequence, government intervention could induce a virtuous cycle, where adop-tion, either coerced or encouraged by incentives by the government, begets moreadoption through peer-group recommendations. Government could augment adop-tion with ad campaigns or demonstration projects.
However, with hospital penetration of EHR nearing 25 percent in 2003 and in-creasing, the rationale for further demonstration programs diminishes. Virtually allproviders are aware of EHR and know both the success and failure stories in its im-plementation. It is probably too late to consider demonstration programs in a broad____________6 Kapur (1995) finds epidemic effects in a theoretical diffusion framework. In this model, firms learn progres-sively through observing the experience of others. Given this prospect of social learning, every firm would preferthat other firms adopt before it does. (This is not a network externality because the firm benefits from the learn-ing provided by the other firms’ purchases rather than directly from the other firms’ purchases.) Kapur finds thatheterogeneity of firms is not essential to explain interfirm differences in adoption times. The model shows differ-ences even among identical firms.
In the numerically controlled machine tool industry, the main factors affecting diffusion were found to be en-dogenous learning (epidemic effects), firm size, industry growth rates, the cost of the technology, and expectedchanges in the cost of the technology (Karshenas and Stoneman, 1993).
An early study describes epidemic effects in the continuous steel-casting industry (Czepiel, 1974). Using adirected-graph approach, the author identified informal communications networks and interactions within theindustry. There was clear evidence that competing firms actively used friendship networks.

58 The Diffusion and Value of Healthcare Information Technology
sense as a useful exercise although they might be useful if targeted on low-adopterpopulations.
A second source of imperfect information may be that expectations about futuretechnological change are wrong. Incorrect expectations may lead to inefficient adop-tion decisions. However, correct expectations can lead to less socially optimal behav-ior. For example, suppose that the socially optimal diffusion path is faster than theone currently realized by providers. Further, suppose that providers erroneously be-lieve that HIT prices will not fall. In this case, informing them of the true lower fu-ture prices may increase the delay in purchase, exacerbating the slow adoption prob-lem.7 Instead a commonly cited barrier was lack of evidence for return oninvestment.
Our site visits did not provide much evidence that providers have inaccurate ex-pectations about future technological change. Undoubtedly, the world will unfold inunpredictable ways, but we found little evidence that decisionmakers had systematicmisinformation.
Standards. It is well known that private markets may not by themselves effi-ciently choose a technical standard (the case of the VHS cassette is frequently cited inthe literature). We found that some providers might be reluctant to invest in a tech-nology that may be incompatible with emerging standards. They may delay HITadoption because of uncertainty about its compatibility with the future communityinfrastructure. This compatibility and interoperability is valuable both within an or-ganization as well as for sharing information between organizations. Standards areneeded to make sure that similar functions are available in different EHR systemsand that the format, structure, content, language, and transmission protocols arecompatible between systems. Below, we will focus on this part of the standards issue.The issue in HIT with respect to standards is interoperability—different systemsfrom different vendors must be able to talk to each other and share data to realizemajor gains for patient care.
For interoperability to be achieved, three things must be in order: (1) The sepa-rate pieces of hardware must be technically compatible, (2) software from differentvendors must share a common medical vocabulary, and (3) the different systemsmust be electronically interfaced so that they can communicate with each other.
The first level of interoperability is largely in place. HL-7 provides a commonmachine language.
The second level is the focus of much of the current activity. The difficulty hasbeen in finding standard medical terms. It has been difficult to find a standard medi-cal language (Rector, 1999), partly because terminology changes over time. The____________7 We have asked hospitals about their price expectations. They do not expect prices to fall. They expect HITquality to improve, but their own resources seem to be a larger factor in adoption than expectations of any majorchange in product variety or price.

Should the Government Intervene to Speed Diffusion of HIT? 59
World Health Organization produces a new International Classification of Diseases(ICD) every ten years or so. The switch from ICD-9 to ICD-10 is driving a 2004overhaul of clinical terminology as well. Finally, a common patient identifier has notbeen agreed on.
The third level of interoperability has not been addressed to any significant de-gree. Analysts note that doing so would be very expensive with current hardware andsoftware because the interface would have to be custom-made. Goldsmith (2003)believes that attempts to use the powerful new EHRs in the current fragmented in-formation systems could result in huge waste and inefficiency. He suggests that thegovernment specify minimum technical standards for clinical information systems.
It is important to point out that standardization would not eliminate competi-tion in the software industry. Competition would continue, not only on price but onease and speed of installation (a major factor mentioned in our site visits), speed ofresponse, stability and reliability, user friendliness, and clinical decision support.
Although there is little empirical policy analysis about the effects of standards(Mowery, in Stoneman, 1995), we found a great deal of anecdotal evidence as well asstudies described in the trade literature in healthcare and IT generally suggesting thatstandards are absolutely necessary to the smooth functioning of future EHR. Thebenefits of standardization appear to be well understood by the healthcare commu-nity. Comments from the thought leaders we interviewed largely echoed the NationalCommittee on Vital and Health Statistics (NCVHS’s) 2000 finding that “the great-est impediment to the adoption of healthcare information technology is the lack ofcomplete and comprehensive standards for patient medical record information.”
Moving data seamlessly between systems lies at the core of many quality and ef-ficiency issues in healthcare (Brailer and Terasawa, 2003), and interoperability is atthe heart of this ability. But the authors find low adoption rates for some of the stan-dards that are critical to interoperability. For example, in the early 2000s, few pro-viders implemented unique patient identifiers, interconnectivity, or standardizedclinical terminology.
In summary, we found few detractors and many proponents of standards forEHR. The policy issue is what can be done and how quickly can it be done. Every-one wants standards, but any particular standard has detractors.
We surveyed evidence from other industries to understand how standards wereapplied and what contributed to their successful implementation. In the case of fac-tory and office Local Area Networks, standardization depended on whether any firmwas large enough to coordinate the entire market, be it General Motors (GM) as abuyer or IBM as a vendor (David and Greenstein, 1990, p. 20). In healthcare, nosingle provider is large enough to play a “GM” type of role, although the very largestemployers could work together as buyers to impose standards.
However, the largest customer of healthcare in the United States is the federalgovernment, and the largest government customer is the Centers for Medicare and

60 The Diffusion and Value of Healthcare Information Technology
Medicaid Services (CMS). As the largest customer in healthcare, CMS could play acentral role in driving standards.
In their analysis of seven case studies of standardization, Besen and Johnson(1986) identified several conditions that facilitated agreements on standards withinvoluntary organizations’ committee process (i.e., not unlike healthcare standard-setting bodies). They found that (1) all major industry parties must be willing to par-ticipate; (2) any industry group has to overcome anti-trust objections; (3) a groupmust find a way to narrow choices, so that interested parties can more easily arrive atconsensus; (4) groups must develop objective technical means for considering alter-natives; and (5) there should be liberal licensing agreements and nominal royalty fees(quoted in David and Greenstein, 1990).
It appears that the HIT standards movement achieves most of these criteria, andthe government could perhaps play the role of coordinator more ably than others.Indeed, CMS could address Besen and Johnson’s five points above without having toplay a role much different from its traditional one—including bringing industry par-ties together under the aegis of impartiality, dealing directly and authoritatively withantitrust issues, driving the group to narrow choices, and leaning on those with the“winning” standards to provide liberal licensing arrangements.
In summary, we found general consensus that standards are important and thatgovernment should play a role both in technical coordination and through its role asa major payer. Our analysis suggests that interoperability must be at the heart of fu-ture standardization efforts.
Inability to Measure Provider Quality Accurately. A pervasive problem inhealthcare is the difficulty in measuring quality objectively. It is difficult to competeon what one cannot measure. In well-functioning markets, firms compete on quality,service, and price. In other industries studied in the previous chapter, it is taken forgranted that quality benefits are noticed by the customers. For example, ifAmazon.com invests in superior pick, pack, and ship IT that reduces shipping errors,there will be fewer customer complaints and returns. In healthcare, where quality isso important, providers instead compete more on price and service and provide littleinformation on quality to the consumer or to employers. This is a fundamental andvery serious market failure in healthcare. (For a recent article identifying this problemas central, see Porter and Teisberg, 2004.)
There is evidence that EHR may reduce this problem by allowing more sophis-ticated quality measurement tools, which generally require at least some data collec-tion, manipulation, and computation, to be automated. By automating these qualitymeasurement tools, they become much more usable.
Notice that in this area HIT could help and be helped in two ways. First, theinability to measure quality can conceivably retard the adoption of all quality-improving innovation, including HIT. This is the classic market failure problem:The market does not correctly value the quality-improving innovation. Second, HIT

Should the Government Intervene to Speed Diffusion of HIT? 61
may have a somewhat unique ability to improve the measurement of quality inhealthcare. Thus, adopting HIT may reduce the original market failure. There is achicken-and-egg problem: HIT adoption is retarded by the market failure of inabilityto measure quality. But, to measure quality better, HIT must be adopted. Govern-ment may have a fairly strong rationale for intervening to lessen this problem. HITnot only improves quality, it improves the measurement of quality, which attacks theunderlying market failure that is so pernicious in healthcare.
Government can intervene by promulgating HIT-enabled quality standards,paying for quality directly when it can measure it, and possibly subsidizing the pur-chase of EHR that enables better measurement of quality.
Market Power
Another general source of potential market failure can be market power. The eco-nomics literature identifies a number of market power rationales for intervention.Antitrust enforcement is a classic intervention to curtail excessive market powerwielded by a firm. For example, it has been shown theoretically that diffusion may betoo fast in unconcentrated markets because vendors compete with each other so vig-orously that they essentially oversell the market.
The economics literature is split on whether concentrated industries (i.e., whereproviders have significant market power) produce more or less innovation. In sum-marizing much of this work, Mowery in Stoneman (1995) note that these studiesgenerate no firm conclusion.8
Given these mixed results, the rationale for government intervention in HIT tocorrect for undue market power appears to be weak. There are neither empirical northeoretical reasons to worry about too many or too few buyers or sellers in this mar-ket.9 Although there are a substantial number of HIT suppliers—7 suppliers had 74percent of the EHR market in 2002, with the remaining 26 percent composed ofsmaller players and self-developed systems—it seems implausible that they areoverselling the market or need to be reined in by government. Thus, realigning mar-ket power does not appear to be a very credible reason for government interventionin HIT.
Related to issues of market power are potential supply-side policies involvingchanging incentives for vendors. They might include tax breaks, price subsidies, and,perhaps most prominently, standards-setting. Outside standards-setting, there ap-pears to be little political interest in supply-side policies at this point because theyclash overtly with the free-market policies of the United States. In addition, subsidiesand tax breaks would partly create higher vendor profits and possibly higher prices____________8 See also Dearden, Ickes, and Samuelson (1990) and Levin et al. (1992).9 See Bhattacharya, Chatterjee, et al. (1986); Nault (1998), Nault et al. (1997), and Hoppe (2002) among others.

62 The Diffusion and Value of Healthcare Information Technology
(although the effect is not clear-cut), neither result being a goal of policymakers orhealthcare providers. Demand-side policies to assist providers who care directly forpatients appear to be more likely policy options.
Externalities
A third potential source of market failure is externalities. Fundamentally, our respon-dents felt that the value of EHR is higher if others in the patient’s care network al-ready have it. This is a classic network externality. It can lead to a socially inefficientwaiting game played by purchasers and to inefficiency in implementation.
Perhaps the most basic problem is that the hospital (the acute-care facility)rarely employs the physicians, who admit patients but conduct much of their care inremote locations. Further, pharmacies and labs have different ownership, partly be-cause of well-intentioned conflict-of-interest regulations. These differences in owner-ship have come about for historical and probably understandable reasons, includingpreferred autonomy of physicians, patient choice, and some distrust between hospi-tals and physicians. But from the narrower perspective of maximizing HIT efficiency,the ownership differences are not optimal.
As an illustration of the difficulty, recall the retailing case study from the previ-ous section and the benefits of IT in that setting. To make a comparison tohealthcare, again imagine if Wal-Mart did not own its own warehouses, had lowmarket share at those warehouses, and there was not a great deal of mutual trust be-tween stores and warehouses. Such a situation would probably lead to less-than-optimal investment (lack of adoption) and to relatively poor implementation oncethe investment is made. This is the situation most of the time in healthcare.
It would be naïve to suggest reorganizing U.S. healthcare to optimize HIT deci-sions. Indeed, reorganizing options such as increasing vertical integration (that is,putting hospitals, doctors, labs, and pharmacies all under one organization) and ac-countability for a defined population might also be called a “staff HMO.” This caremodel was the purported savior of U.S. healthcare in the early 1990s, but it was farfrom universally embraced by the customers. Furthermore, these disparate organiza-tions would have greater incentive to work together if quality could be better meas-ured. For example, New York State’s publication of cardiac surgery mortality data ledto big reductions in risk of surgery, despite the different players that needed to bebrought to the table, as hospitals stopped some surgeons from operating or over-hauled their failing departments. Nevertheless, the challenge for government is tocraft a policy that reduces network externalities without requiring wholesale reorgani-zation of the current system as an absolutely crucial piece of reform.10
____________10 Although it is quite plausible, judging by other industries’ histories, that a substantial reorganization will takeplace. The incentives should push organizations to move toward forms that can capture the benefits.

Should the Government Intervene to Speed Diffusion of HIT? 63
Reducing network externalities is a formidable challenge—as noted above, cur-rently 83 percent of physician records are in paper form, so building interfaces fromthe hospital or other physicians’ offices is technically impossible today (Goldsmith,2003). Thus, the first step may be to digitize physician’s offices. This may take policyinitiatives, including possibly subsidies, since individual offices are generally capital-poor. The rationale is that network externalities constitute a market failure, prevent-ing most of the gains of the IT investment from accruing to the physician that needsto make the investment.
Transfers among parties (rather than outright government payments) are theusual economic prescription for reducing network problems. For example, a hospitalthat installs EHR first could pay physicians’ offices to join its network. At least theo-retically, this arrangement reduces the problem, because it gets all the parties to actmore on the collective EHR benefit (since they now formally share the benefits).11
There are two problems with transfers in this context: (1) They are illegal inhealthcare under some circumstances, and (2) they are certain to be expensive to im-plement and that money will have to come from somewhere. Direct payments fromhospitals to physicians have been illegal under the Stark laws, and it might be diffi-cult to separate EHR payments from (illegal) payments for referrals. Even if theseproblems can be overcome, implementing these payments can be daunting. Estab-lishing regional health information organizations, likely enablers of transfer pay-ments, may costs millions per city (or similar unit) and take two years to implement.
The standards problem and the network externalities problem combine into oneoverarching problem: The EHR systems must be able to communicate with eachother and the healthcare providers must have the incentive (not currently providedby the imperfect market) to adopt and use the technology. This problem could beaddressed by promoting “community connectivity,” which has been receiving in-creased attention. Furthermore, it is recognized that there is no management acrossmany boundaries (e.g., hospital/physician practice) and policy must take this intoaccount. In other words, this concept partly aims to correct some of the market andorganizational failures of healthcare IT and, in a broad sense, this analysis stronglysupports those efforts.
An intervention to address network externalities may be led by both federal andstate governments. However, the policy needs to encourage linking the local provid-ers for any specific patient or at least remove current impediments to those linkages.To assist with this, the government may need to consider relaxing inurement of____________11 In fact, under not implausible modeling assumptions, allowing transfers may provide correct incentives toachieve socially optimal adoption times. In other words, at least theoretically, subsidies may not be necessary;allowing transfers may suffice (the author’s microeconomic analysis is available on request).

64 The Diffusion and Value of Healthcare Information Technology
benefit regulations with respect to HIT.12 Such changes are naturally very complexand need to be carefully considered before implementation.
It has been noted by some in the trade literature that there is a “problem” be-cause not all of the beneficiaries of HIT, such as insurers and patients, pay for HITdirectly. Usually, only the provider pays for HIT. However, the existence of a groupthat benefits but does not pay directly is not a sufficient reason for market interven-tion. For example, consumers do not pay cereal companies for IT upgrades to makebetter cereal. In that market, consumers prefer low-cost, high-quality cereals and thecereal companies decide if IT will help them meet those preferences and invest ac-cordingly.
It can be a poor idea to appeal for subsidies on the basis of “shared cost forshared benefit,” because in efficiently functioning markets, costs are rarely shared. Ina market with poor information, such as quality measurement in healthcare, HITcould improve quality indirectly by improving measurement of quality. But then thereason for the intervention is improving quality measurement, not that the customersneed to pay for the improvement per se. Instead, firms must decide whether IT is auseful competitive weapon and then invest and use it effectively to profit. A tax ormandate on insurers to pay for HIT, for example, flies in the face of this logic andcould possibly blunt instead of sharpen the weapon of HIT as a means of succeedingin the healthcare marketplace.
Summary of Key Findings and Concluding Observations
EHR has diffused to up to 32 percent of the acute-care hospital population after a20+ year latency. It is diffusing at a rate consistent with other similar informationtechnologies characterized by network externalities and high complexity. HIT worksby enabling improvements in work processes. It may or may not be the prime moverof improvements. Because of its complementary role, benefits of IT vary widelyacross industries and regulatory environments. HIT is possibly delivering incrementallabor productivity benefits of 1 percent per year; the range may be from 0 percent toperhaps 4 percent per year. With the base case improvement of 1 percent per year,the savings are in the range of $3 trillion dollars over 15 years.
Extraordinarily effective implementation within the current healthcare systemmight double this number, in which case healthcare would be using IT as effectivelyas the highly efficient retail and wholesale sectors used IT in the late 1990s. Otherindustries have undergone productivity transformations of 8 percent per year ormore, enabled by the combination of deregulation, competition, and rapid im-provement in IT. Transformational productivity improvements, seen in telecommu-____________12 Inurement of benefit refers to the federal prohibition against hospitals’ compensating physicians for referrals.

Should the Government Intervene to Speed Diffusion of HIT? 65
nications and securities trading, are out of reach given healthcare’s structure and de-pendence on labor and constant capital deepening. However, if such transformationswere achieved, they could lower healthcare costs per unit of quality by 75 percentafter 15 years. This is well worth the investment to society, but how much should thegovernment, or other agencies responsible for policy, help the private market toachieve these gains?
A number of attractive policy avenues deserve further study. The policy avenuesdiscussed below are active priorities among the many policymaking stakeholders.13
The purpose of this report has been to provide a better conceptual and empirical ba-sis for pursuing certain general lines of policy, rather than to discuss specific currentproposals in much depth (which are better addressed in a series of ongoing issue pa-pers, for example, than in full reports). Note also that the list below is still verybroad. The question may be asked: Ultimately, is HIT not a narrower concernwithin healthcare, albeit an important one? There are at least two reasons for thebroad list below. First, HIT and especially EHR is a technology that affects virtuallyall players in the healthcare community. It is a broad technology and requires a broadpolicy to be effective.
Second, the value of HIT is maximized when complementary investments aremade. The value of HIT swings widely depending on what else is going on in thesystem. In healthcare, there is a lot going on, much of it unhelpful to maximizing theHIT investment. Accordingly, the policy remit to optimize HIT efficiency toucheson a number of healthcare problems, many all too familiar to health policymakers.
This report’s research lends support to developing policy and solutions in thefollowing policy areas:
Coordinate Standards Immediately
It is important to continue to coordinate standards and push for initiatives that im-prove the chances for interoperability, especially within regional communities. Stan-dards should be improved without affecting competition among competing EHRvendors.
Work to Improve Quality Measurement
The benefits of improving quality measurement are twofold: First, improving qualitymeasurement will help to overcome the market failure of not recognizing quality,which will spur the adoption of quality-improving innovation, including HIT. Sec-ond, there is a feedback loop: Adoption itself will reduce this market failure, becauseEHR holds the promise of improving quality measurement, largely by automating anotherwise dauntingly labor-intensive process of quality management. Some have ar-____________13 A forthcoming report will give a more detailed review of current policy efforts, which are very numerous.

66 The Diffusion and Value of Healthcare Information Technology
gued that this difficulty in measuring and competing on quality is the most impor-tant problem in healthcare.
In addition to these two strong rationales for policy in this area, there is still athird: The government, as a key customer, has the opportunity to improve providers’performance. A strong series of results in the theory of innovation show that a “smartbuyer” can drive an industry to higher efficiency. (For example, consider the effectsof Japanese consumers’ cutting-edge tastes on Japanese consumer electronics firms.)To date, the government as a healthcare buyer has done much to affect the systembut much less to reform the system. HIT can help transform the system and helpgovernment push through complementary changes in quality measurement and payfor performance that should improve the system. Perhaps this is the area that holdsout the greatest promise for truly transformative HIT-enabled change.
The government should consider what quality-based rewards it could use to vir-tually require that providers pursue EHR. Is there something the government can dowithout blatantly interfering with private economic transactions to assist with thisgoal?
Reduce Network Externalities
The government can work to lessen network externalities, which should lead to moreadoption of EHR and especially more effective adoption. Our analysis suggests thatthe federal government could lead an intervention, but a successful policy needs toencourage linking the local providers for any specific patient. To assist with these ef-forts, the government may need to consider further relaxing inurement of benefitregulations with respect to HIT. Because of network externalities, some selectivegrants or subsidies may be optimal for underfunded physicians’ offices, but we do notview this as proven. Alternatively, allowing transfer payments (connect fees or bo-nuses) among members of the regional network may be a good idea (and less expen-sive for the government), if legal issues can be overcome. The allowed financial in-centives should be targeted at improving community connectivity directly (e.g., IThardware), or indirectly (e.g., digitizing patient paper records).
However, there needs to be further, detailed research at the firm and regionallevel to guide policy here. This report identifies a promising research agenda butmust stop short of detailed recommendations; it certainly does not endorse subsidiesat this time.
Recognize That HIT Requires Complementary Investments
It has been shown in other industries that IT is much more effective when combinedwith vigorous competition and deregulation. Complex IT such as EHR is definitelynot a stand-alone or plug-and-play type of benefit. Rather, it can, if (and only if)used appropriately, deliver dramatic changes in the overall delivery of care that couldradically improve quality and lower the cost of delivering that higher quality.

Should the Government Intervene to Speed Diffusion of HIT? 67
The reverse side of this observation is that preventing complementary changesin work processes by stifling competition or direct regulation might stop HIT gainsoutright. For example, HIT efficiencies conceivably allow reductions in nurse staff-ing. Realizing those reductions would be greatly hindered in California, where floorstaffing ratios are fixed by state law. Therefore, the indirect benefits of allowing com-petition and reorganization should be considered along with any direct benefits oflabor market or, more generally, input to production regulation.
Make Policy Decisions That Turn HIT into a Competitive Weapon
Industrial history shows that IT is most efficiently used when used as a competitiveweapon central to a firm’s business. This result is highly consistent with a more gen-eral theory of successful innovation in a modern economy. In the context of healthpolicy, one way to sharpen the competitive advantage of IT might be to reimbursequality in Medicare more directly, where measuring quality is possible only with anEHR-enabled quality tracking system. Another fruitful line of research would be tostudy whether Medicare should pay for EHR-enabled claims. In such a world, pro-viders improve profitability by using EHR and using it well and having the crediblequality measures to prove that they are using it well. (Note that this policy prescrip-tion is related to the quality-measurement policies above, because they both addressthe fundamental market failure of poorly measured quality.)
Before the government can implement such efforts, however, it needs to deter-mine lead time to install EHR widely and deeply, to determine how to pay for qual-ity and not just the physical presence of an EHR, to calculate the correct size of thepremium for IT-submitted claims, and finally, to quantify and address the size of anyunfunded mandate. To encourage broad use within a network, payment should bestructured to reward very broad physician participation rather than simply the pres-ence of some kind of EHR in the provider.
Discuss and Agree Whether 100 Percent EHR Penetration Is a Societal Goal, BecauseHistory Suggests That It Will Not Happen Without Intervention
EHR diffusion has reached more than 20 percent of acute-care hospitals and maysoon go over 50 percent. However, the analysis in Chapter Two suggests, based onreview of other IT innovations, that penetration will not reach 100 percent of theprovider community. If 100 percent EHR is a societal goal, because society wishes tomaximize network gains or avoid a two-tier system, or both, then some form of sub-sidy for the more disadvantaged and isolated practices is likely necessary. The issuesfor these offices should likely be interoperability and community connectivity tomaximize gains from HIT and EHR in particular.

68 The Diffusion and Value of Healthcare Information Technology
Adopt an Incremental, Evolutionary Perspective on Policy Development
There are few more important areas for proper government economic policy thanhealthcare, specifically HIT. It is only a slight overstatement to say that future U.S.competitiveness and the health of its citizens depend upon it.
Given the enormous stakes, the uncertainty in the effects of policy, and the la-tency of the gains from HIT implementation, it might be wise to heed organizationaltheorists’ views on evolutionary policy analysis. Evolutionary theory of organizationsand policy suggests that policymakers have bounded rationality, just like firms (orproviders).14 Although policymakers do not know the effects of policy with muchcertainty, they have superior ability to coordinate across groups and a rationale to fixmarket failures. Evolutionary theorists, as well as some business school academics,suggest that it is usually best to be able to evaluate policies and business strategiesearly and adapt quickly.15 Such a perspective is almost certainly wise in this context.
This suggests incremental government interventions with rapid review of re-sults, with follow-on funding for successful interventions. This will help to avoidmistakes and allows policy a better chance to keep up with the rapid technical changein IT and in healthcare organization.____________14 Metcalfe (1994, 1995, p. 418).15 Metcalfe (1994), Christensen et al. (2000), and Christensen and Raynor (2003).

69
Bibliography
Anderson, J. G., and S. J. Jay, “Computers and Clinical Judgment: The Role of Physi-cian Networks,” Social Science & Medicine, Vol. 20, No. 10, 1985, pp.969–979.
Anderson, R. L., and D. J. Ortinau, “Exploring Consumers’ Postadoption Attitudesand Use Behaviors in Monitoring the Diffusion of a Technology-Based Discon-tinuous Innovation,” Journal of Business Research, Vol. 3, No. 17, 1988, pp.283–298.
Ash, J., P. Gorman, V. Seshadri, and W. Hersh, “Computerized Physician Order En-try in U.S. Hospitals: Results of a 2002 Survey,” Journal of the American Medi-cal Association, Vol. 11, No. 2, 2004, pp. 95–99.
“Automation of Web Logistics Can Reduce Return Processing Costs,” Direct Market-ing, Vol. 65, No. 4, 2001.
Axam, R., and D. Jerome, “A Guide to ERP Success,” The Project Office, Teams, Proc-esses and Tools.
Baily, M. N., “Distinguished Lecture on Economics in Government, The New Econ-omy: Post Mortem or Second Wind?” Journal of Economic Perspectives, Vol. 16,No. 2, 2002, pp. 3–22.
Baldwin, F. D., “CPRs in the Winner’s Circle,” Healthcare Informatics, 2003.Basu, S., J. G. Fernald, N. Oulton, and S. Srinivasan, “The Case of the Missing Pro-
ductivity Growth: Or, Does Information Technology Explain Why Productiv-ity Accelerated in the United States But Not the United Kingdom?” Cam-bridge, Mass.: National Bureau of Economic Research, working paper #10010,2003.
Batiz-Lazo, B., and D. Wood, “Information Technology Innovations and CommercialBanking: A Review and Appraisal from an Historical Perspective,” EconomicHistory, Economics Working Paper Archive, WUSTL, #0211001, 2002.
Baumol, W. J., The Free-Market Innovation Machine, Princeton, N.J.: Princeton Uni-versity Press, 2002.

70 The Diffusion and Value of Healthcare Information Technology
Baur, C., “Limiting Factors on the Transformative Powers of E-Mail in Patient-Physician Relationships: A Critical Analysis,” Health Communication, Vol. 12,No. 3, 2000, pp. 239–259.
Besen, S. M., and L. L. Johnson, Compatibility Standards, Competition and Innovationin the Broadcasting Industry, Santa Monica, Calif.: RAND Corporation, R-3453-NSF, 1986.
Bhattacharya, S., K. Chatterjee, et al., “Sequential Research and the Adoption of Inno-vations,” Oxford Economic Papers, Vol. 38, No. 0, 1986, pp. 219–243.
Bikson, T. K., Understanding the Implementation of Office Technology, Santa Monica,Calif.: RAND Corporation, N-2619-NSF, 1987.
Bikson, T. K., Organizational Trends and Electronic Media: Work in Progress, SantaMonica, Calif.: RAND Corporation, RP-307, 1997.
Bikson, T. K., S. A. Law, M. Markovich, and B. T. Harder, Facilitating the Implemen-tation of Research Findings: Review, Synthesis, Recommendations, Santa Monica,Calif.: RAND Corporation, RP-481, 1995.
Bikson, T. K., S. A. Law, M. Markovich, and B. T. Harder, Facilitating the Implemen-tation of Research Findings: A Summary Report, Santa Monica, Calif.: RANDCorporation, RP-595, 1997.
Blair, J., “The Electronic Health Record Today,” Healthcare Informatics, 2003.Blume, S., “Early Warning in the Light of Theories of Technological Change,” Inter-
national Journal of Technology Assessment in Health Care, Vol. 14, No. 4, 1998,pp. 613–623.
Borzekowski, R., “Measuring the Cost Impact of Hospital Information Systems:1987–1994,” 2002.
Borzekowski, R., “Healthcare Finance and the Early Adoption of Hospital Informa-tion Systems,” Board of Governors of the Federal Reserve System, 2002, pp.1–32.
Brailer, D. J., and E. L. Terasawa, “Use and Adoption of Computer-based PatientRecords,” Prepared for California HealthCare Foundation, 2003, available atwww.chcf.org.
Burke, D. E., B. B. Wang, et al., “Exploring Hospitals’ Adoption of InformationTechnology,” Journal of Medical Systems, Vol. 26, No. 4, 2002, pp. 349–355.
Chatfield, A. T., and P. Yetton, “Strategic Payoff from EDI as a Function of EDIEmbeddedness,” Journal of Management Information Systems, Vol. 16, No. 4,2000, pp. 195–224.
Chatterjee, R., and J. Eliashberg, “The Innovation Diffusion Process in a Heterogene-ous Population: A Micromodeling Approach,” Management Science, Vol. 36,No. 9, 1990, pp. 1057–1079.
Chattoe, E., and N. Gilbert, A Basic Simulation of Information Diffusion, Centre forResearch on Simulation in the Social Sciences (CRESS), Guildford, UnitedKingdom: Department of Sociology, University of Surrey, 1998.

Bibliography 71
Chau, P.Y.K., and K. Y. Tam, “Organizational Adoption of Open Systems: A‘Technology-Push, Need Push’ Perspective,” Information & Management, Vol.37, No. 5, 2000, pp. 229–239.
Chiasson, M. W., and C. Y. Lovato “The Health Planning Context and Its Effect on aUser’s Perceptions of Software Usefulness,” Canadian Journal of Public Health,Vol. 91, No. 3, 2000, pp. 225–258.
Christensen, C. M., R. Bohmer, et al., “Will Disruptive Innovations CureHealthcare?” Harvard Business Review, Vol. 78, No. 5, 2000, p. 102.
Christensen, C. M., and M. E. Raynor, The Innovator’s Solution, Boston, Mass.: Har-vard Business School Press, 2003.
Colombo, M. G., and R. Mosconi, “Complementarity and Cumulative LearningEffects in the Early Diffusion of Multiple Technologies,” Journal of IndustrialEconomics, Vol. 43, No. 1, 1995, pp. 13–48.
Czepiel, J. A., “Word-of-Mouth Processes in the Diffusion of a Major TechnologicalInnovation,” Journal of Marketing Research, Vol. 11, No. 2, 1974, pp. 172–180.
Dansky, K. H., L. D. Gamm, et al., “Electronic Medical Records: Are PhysiciansReady?” Journal of Health Care Management, Vol. 44, No. 6, 1999, pp.440–454; discussion 454-5.
David, P., and S. Greenstein, “The Economics of Compatibility Standards: An Intro-duction to Recent Research,” Economics of Innovation and New Technology, Vol1, 1990, pp. 3–41.
Dearden, J., B. W. Ickes, and L. Samuelson, “To Innovate Or Not to Innovate: Incen-tives and Innovation in Hierarchies,” The American Economic Review, Vol. 80,No. 5, 1990, pp. 1105–1124.
Detmer, D. E., “Information Technology for Quality Healthcare: A Summary ofUnited Kingdom and United States Experiences,” Quality Healthcare, Vol. 9,No. 3, 2000, pp. 181–189.
Dong, D., and A. Saha, “He Came, He Saw, (and) He Waited: An Empirical Analysisof Inertia in Technology Adoption,” Applied Economics, Vol. 30, No. 7, 1998,pp. 893–905.
Dorenfest, S., HIMSS Analytics Database (formerly the Dorenfest IHDS+ Database).Drazen, E., and J. Fortin, “Digital Hospitals Move Off the Drawing Board,” Prepared
for California HealthCare Foundation, 2003.Eger, M. S., R. L. Godkin, and S. R. Valentine, “Physicians’ Adoption of Information
Technology: A Consumer Behavior Approach,” Health Mark Q , Vol. 19, No. 2,2001, pp. 3–21.
England, I., D. Stewart, and S. Walker, “Information Technology Adoption inHealthcare: When Organisations and Technology Collide,” Australian HealthReview, Vol. 23, No. 3, 2000, pp. 176–185.

72 The Diffusion and Value of Healthcare Information Technology
Frewer, L., “Risk Perception, Social Trust, and Public Participation in Strategic Deci-sion Making: Implications for Emerging Technologies,” Ambio, Vol. 28, No.61999, pp. 569–574.
Geroski, P. A., “Models of Technology Diffusion,” CEPR Discussion Paper No. 2146,1999.
Geroski, P. A., “Models of Technology Diffusion,” Research Policy , Vol. 29, Nos. 4–5,2000, pp. 603–625.
Goldsmith, J., Digital Medicine: Implications for Healthcare Leaders, Chicago, Ill.:Health Administration Press, 2003.
Goldsmith, J., D. Blumenthal, et al., “Federal Health Information Policy: A Case ofArrested Development,” Health Affairs (Millwood), Vol. 22, No. 4, 2003, pp.44–55.
Gordon, R. J., “Comments and Discussions,” Brookings Papers on Economic Activity,Vol. 2, 2002, pp. 245–265.
Gowrisankaran, G., and J. Stavins, “Network Externalities and Technology Adoption:Lessons from Electronic Payments,” Cambridge, Mass.: National Bureau ofEconomic Research, working paper #8943, May 2002.
Grover, V., K. Fiedler, et al., “Empirical Evidence on Swanson’s Tri-Core Model ofInformation Systems Innovation,” Information Systems Research, Vol. 8, No. 3,1997, pp. 273–287.
Gust, C., and J. Marquez, “International Comparisons of Productivity Growth: Re-cent Developments,” Business Economics, 2001, pp. 55–62.
Hagland, M., “Doctors’ Orders,” Healthcare Informatics, 2003.Hagland, M., “Emerging Picture Shows Technical Integration and Business Consoli-
dation,” Healthcare Informatics, 2003.Hall, B. H., and B. Khan, “Adoption of New Technology,” Cambridge, Mass.: Na-
tional Bureau of Economic Research, working paper #9730, May 2003.HIMSS Healthcare CIO Survey, 2003.“Hooker Furniture Sees the Benefits of Real-Time Information Visibility—Wireless
Distribution and Shipping Systems Raise Productivity 20% and May EliminateNeed to Take Inventory,” Frontline Solutions, January 2000.
Hoppe, H. C., “The Timing of New Technology Adoption: Theoretical Models andEmpirical Evidence,” Manchester School, Vol. 70, No. 1, 2002, pp. 56–76.
Hornstein, A., and P. Krusell, “The IT Revolution: Is It Evident in the ProductivityNumbers?” Federal Reserve Bank of Richmond Economic Quarterly, Vol. 86, No.4, 2000, pp. 49–78.
Hu, P. J.-H., P.Y.K. Chau, and O.R.L. Sheng, Investigation of Factors AffectingHealthcare Organizations’ Adoption of Telemedicine Technology, 33rd Hawaii In-ternational Conference on System Sciences, Maui, Hawaii, 2000.
IOM, Adopting New Medical Technology, Washington, D.C.: National Academy Press,1994.

Bibliography 73
Jardini, D., “From Iron to Steel: The Recasting of the Jones and Laughlin Workforcebetween 1885 and 1896,” Technology and Culture, Vol. 35, 1995, pp. 271–301.
Jorgenson, D. W., and K. J. Stiroh, “Information Technology and Growth,” AmericanEconomic Review, Vol. 89, No. 2, 1999, pp. 109–115.
Kapur, S., “Technological Diffusion with Social Learning,” The Journal of IndustrialEconomics, Vol. 43, No. 2, 1995, pp. 173–195.
Karshenas, M., and P. L. Stoneman, “Rank, Stock, Order, and Epidemic Effects in theDiffusion of New Process Technologies: An Empirical Model,” The Rand Jour-nal of Economics, Vol. 24, No. 4, 1993, pp. 503–528.
Karshenas, M., and P. L. Stoneman, “Techological Diffusion,” in P. L. Stoneman, ed.,Handbook of the Economics of Innovation and Technological Change, UnitedKingdom: Blackwell, 1995, pp. 265–297.
Katz, M. L., and C. Shapiro, “Technology Adoption in the Presence of Network Ex-ternalities,” Journal of Political Economy, Vol. 94, No. 4, 1986, pp. 822–841.
Kuan, K.K.Y., and P.Y.K. Chau, “A Perception-Based Model for EDI Adoption inSmall Businesses Using a Technology-Organization-Environment Framework,”Information & Management, Vol. 38, No. 8, 2001, pp. 507–521.
Lai, V. S., and J. L. Guynes, “An Assessment of the Influence of Organizational Char-acteristics on Information Technology Adoption Decision: A DiscriminativeApproach,” IEEE Transactions on Engineering Management, Vol. 44, 1997, pp.146–157.
Larsen, T. J., and E. McGuire, eds., Information Systems Innovation and Diffusion:Issues and Directions, Hershey, Penn.: Idea Group Publishing, 1998.
Levin, S. G., S. L. Levin, et al., “Market Structure, Uncertainty, and Intrafirm Diffu-sion: The Case of Optical Scanners in Grocery Stores,” The Review of Economicsand Statistics, Vol. 74, No. 2, 1992, pp. 345–350.
Liberatore, M. J., and D. Breem, “Adoption and Implementation of Digital-ImagingTechnology in the Banking and Insurance Industries,” IEEE Transactions onEngineering Management, Vol. 44, 1997, pp. 367–377.
Loh, L., and N. Venkatraman, “Diffusion of Information Technology Outsourcing:Influence Sources and the Kodak Effect,” Information Systems Research, Vol. 3,No. 4, 2001, pp. 334–358.
Majumdar, S., and S. Venkataraman, “Network Effects and the Adoption of NewTechnology: Evidence from the U.S. Telecommunications Industry,” StrategicManagement Journal, Vol. 19, 1998, pp. 1045–1062.
Mansfield, E., “Technical Change and the Rate of Imitation,” Econometrica: Journal ofthe Econometric Society, Vol. 29, No. 4, 1961, pp. 741–766.
Marhula, D. C., “Is e-Health FACT or FICTION,” Healthcare Informatics, 2003.McKinsey Global Institute, U.S. Productivity Growth 1995–2000, Understanding the
Contribution of Information Technology Relative to Other Factors, Washington,D.C., 2001.

74 The Diffusion and Value of Healthcare Information Technology
Medical Records Institute, 4th Annual Survey of Electronic Health Record Trends andUsage, sponsored by SNOMED, 2001.
Metcalfe, J. S., “Evolutionary Economics and Technology Policy,” The Economic Jour-nal, Vol. 104, No. 425, 1994, pp. 931–944.
Metcalfe, S., “The Economic Foundations of Technology Policy: EquilibriumandEvolutionary Perspectives,” in P. Stoneman, ed., Handbook of the Economics ofInnovation and Technological Change, United Kingdom: Blackwell, 1995.
Metzger, J., and F. Turisco, “Computerized Physician Order Entry: A Look at theVendor Marketplace and Getting Started,” First Consulting Group, 2001.
Miller, R. H., and I. Sim, “Physicians’ Use of Electronic Medical Records: Barriers andSolutions,” Pursuit of Quality, 2004, pp. 116–126.
Miller, R. H., I. Sim, and J. Newman, “Electronic Medical Records: Lessons fromSmall Physician Practices,” prepared for California HealthCare Foundation,Oakland, Calif., 2003.
Mitropoulos, P., and C. B. Tatum, “Technology Adoption Decisions in ConstructionOrganizations,” Journal of Construction Engineering and Management, Vol. 125,No. 5, 1999, pp. 330–338.
Modern Physician/Price Waterhouse Coopers survey, administered online at ModernPhysician website, 2003.
Moore, G. C., and I. Benbasat, “Development of an Instrument to Measure the Per-ceptions of Adopting an Information Technology Innovation,” Information Sys-tems Research, Vol. 2, No. 3, 1991, pp. 192–222.
Moore, J., Jr., “Barriers to Technology Adoption,” Environmental Science & Technol-ogy, Vol. 28, 1994, pp. 193A–195A.
Mowery, D., “The Practice of Technology Policy,” in Stoneman, P., ed., Handbook ofthe Economics of Innovation and Technological Change, United Kingdom: Black-well, 1995.
National Health Expenditure Statistics, available at www.nhe.gov.Nault, B. R., “Information Technology and Organizational Design: Locating Deci-
sions and Information,” Management Science, Vol. 44, No. 10, 1998, pp.1321–1335.
Nault, B. R., R. A. Wolfe, et al., “Support Strategies to Foster Adoption of Interor-ganizational Innovations,” IEEE Transactions on Engineering Management, Vol.44, 1997, pp. 378–389.
Nordhaus, W. D., “Productivity Growth and the New Economy,” Brookings Papers onEconomic Activity, Vol. 2, 2002, pp. 211–244.
O’Callaghan, R., “Technology Diffusion and Organizational Transformation: AnIntegrative Framework,” in T. Larsen, and E. McGuire, eds., Information Sys-tems Innovation and Diffusion: Issues and Directions, Hersehy, Pa.: Idea GroupPublishing, 1998.
Bibliography 75
Oliner, S., and D. Sichel, “The Resurgence of Growth in the Late 1990s: Is Informa-tion Technology the Story?” Journal of Economic Perspectives, Vol. 14, No. 4,2000, pp. 3–22.
Ortiz, E., “Federal Initiatives,” Healthcare Informatics, 2003.Pathak, G., and S. K. Goyal, “Transforming Business Through Information Technol-
ogy,” Computer, 1999, pp. 40–41.Perrotta, P., “EDI Lowers Transaction Costs for Texas Grocer,” Supermarket-
news.com, 2002, pp. 19, 21.Pilat, D., “Digital Economy Going for Growth,” Observer, Vol. 237, 2003, pp. 15–17.Porter, M. E., and E. O. Teisberg, “Redefining Competition in Healthcare,” Harvard
Business Review, June 2004.Powell, W. W., and P. J. DiMaggio, eds., The New Institutionalism in Organizational
Analysis, Chicago, Ill.: University of Chicago Press, 1991.Prater, E., and M. Sobol, A Financial Tool for Assessing Comparative Cost Savings and
Profitability of Information Technology Investment in HMOs, paper presented atthe Decision Sciences Institute Southwest Region Conference, San Antonio,Texas, 2003.
President’s Information Technology Advisory Committee, “Transforming Health CareThrough Information Technologies,” 2001.
Pressman, J., and A. Wildavsky, Implementation: How Great Expectations in Washing-ton are Dashed in Oakland, Berkeley, Calif.: University of California Press,1984.
Queree, A., “Portal Power,” Global Finance, Vol. 14, No. 4, 2000, pp. 65–66.Raghupathi, W., and J. Tan, “Strategic Uses of Information Technology in
Healthcare: A State-of-the-Art Survey,” Topics in Health Information Manage-ment, Vol. 20, No. 1, 1999, pp. 1–15.
Rai, A., T. Ravichandran, et al., “How to Anticipate the Internet’s Global Diffusion,”Communications of the ACM, Vol. 41, No. 10, 1998, pp. 97–106.
Raman, A., N. DeHoratius, and Z. Ton, “Execution: The Missing Link in Retail Op-erations,” California Management Review, Vol. 43, No. 3, 2001, pp. 136–152.
Rector, A., “Clinical Terminology: Why Is It So Hard?” Methods of Information inMedicine, Vol. 38, No. 4, 1999, pp. 239–252.
Ricci, R. J., “The Internet as a Computer,” Healthcare Informatics, 2003.Robison, K. K., and E. M. Crenshaw, “Post-Industrial Transformations and Cyber-
Space: A Cross-National Analysis of Internet Development,” Social Science Re-search, Vol. 32, No. 3, 2003, pp. 519–524.
Rogers, E. M., Diffusion of Innovations, 4th ed., New York: Free Press, 1995.Romeo, A. A., “Interindustry and Interfirm Differences in the Rate of Diffusion of an
Innovation,” Review of Economics and Statistics, Vol. 57, No. 3, 1975, pp.311–319.

76 The Diffusion and Value of Healthcare Information Technology
Rosenau, P. V., “Managing Medical Technology: Lessons for the United States fromQuebec and France,” International Journal of Health Services, Vol. 30, No. 3,2000, pp. 617–639.
Saloner, G., and A. Shepard, “Adoption of Technologies with Network Effects: AnEmpirical Examination of the Adoption of Automated Teller Machines,” TheRand Journal of Economics, Vol. 26, No. 3, 1995, pp. 479–501.
Santhanam, R., and E. Hartono, “Issues in Linking Information Technology Capabil-ity to Firm Performance,” MIS Quarterly, Vol. 27, No. 1, 2003, pp. 125–153.
Silverberg, G., G. Dosi, and L. Orsenigo, “Innovation, Diversity and Diffusion: ASelf-Organisation Model,” The Economic Journal, Vol. 98, No. 393, 1988, pp.1032–1054.
Southon, G., C. Sauer, et al., “Lessons from a Failed Information Systems Initiative:Issues for Complex Organisations,” International Journal of Medical Informatics,Vol. 55, No. 1, 1999, pp. 33–46.
Standish Group Report, “Chaos,” T23E-T10E, West Yarmouth, Mass., 1995.Stiroh, K. J., “Information Technology and the U.S. Productivity Revival: What Do
the Industry Data Say?” American Economic Review, Vol. 92, No. 5, 2002, pp.1559–1576.
Stoneman, P., and M-J Kwon, “The Diffusion of Multiple Process Technologies,” TheEconomic Journal, Vol. 104, No. 423, 1994, pp. 420–431.
Stoneman, P., and P. Diederen, “Technology Diffusion and Public Policy,” The Eco-nomic Journal, Vol. 104, No. 425, July 1994, pp. 918–930.
Stoneman, P., ed., Handbook of the Economics of Innovation and Technological Change,United Kingdom: Blackwell, 1995.
Sultan, F., and L. Chan, “The Adoption of New Technology: The Case of Object-Oriented Computing in Software Companies,” IEEE Transactions on Engineer-ing Management, Vol. 47, No. 1, 2000, pp. 106–126.
Sultan, F., J. U. Farley, and D. R. Lehmann, “A Meta-Analysis of Applications ofDiffusion Models,” Journal of Marketing Research, Vol. 27, No. 1, 1990, p. 70.
Teng, J.T.C., V. Grover, and W. Guttler, “Information Technology Innovations:General Diffusion Patterns and Its Relationships to Innovation Characteristics,”IEEE Transactions on Engineering Management, Vol. 49, No. 1, 2002, pp.13–27.
Tornatzky, L. G., and K. J. Klein, “Innovation Characteristics and Innovation Adop-tion-Implementation: A Meta-Analysis of Findings,” IEEE Transactions on En-gineering Management, Vol. 29, No. 1, 1982, pp. 28–45.
Tornatzky, L. G., M. Fleischer, et al., The Processes of Technological Innovation, Lexing-ton, Mass.: Lexington Books, 1990.
Venkatesh, V., M. Morris, G. Davis, and F. Davis, “User Acceptance of InformationTechnology: Toward a Unified View,” MIS Quarterly, Vol. 27, No. 3, 2003,pp. 425–478.

Bibliography 77
Wang, M., and W. J. Kettinger, “Projecting the Growth of Cellular Communica-tions,” Communications of the Association for Computing Machinery, Vol. 38, No.10, 1995, p. 119.
Wolff, E. N., “Productivity, Computerization, and Skill Change,” Economic Review,Federal Reserve Bank of Atlanta, 2002, pp. 63–87.