support for the review of the indirect effects of biofuels
TRANSCRIPT

Support for the Review of the Indirect Effects of Biofuels

Support for the Review of the Indirect Effects of Biofuels
Authors: N.D. Mortimer, A. Ashley, A. Evans, A. J. Hunter and V. L. Shaw
Final Version June 2008
North Energy Associates Limited
5 Bearl Farm • Bywell • Stocksfield • Northumberland • NE43 7AJ • UK
Tel: +44 (0)1661 843 545 • Fax: +44 (0)1661 844 085
Watson’s Chambers • 5-15 Market Place • Castle Square • Sheffield • S1 2GH • UK
Telephone: +44 (0)114 201 2604 • Fax: +44 (0)114 272 7374
www.northenergy.co.uk

QUALITY ASSURANCE
Name Signature Date
Anna Evans
Checked by Approved by
Nigel Mortimer

Acknowledgements We would like to thank Daniel Kindred, Roger Sylvester-Bradley and their colleagues at ADAS, and Giulio Volpi for providing essential information on the effects of land use change and other considerations on changes in greenhouse gas emissions which have been incorporated into the calculations used in the preparation of this report. We would also like to thank Alison Pridmore, Judith Bates, Pat Howes and their colleagues at AEA Technology for the co-ordination this and other contributions into the Gallagher Review and the subsequent assimilation and interpretation of results.
Page 3


Executive Summary This report summarises and document the work of North Energy Associates Ltd, under sub-contract to AEA Technology plc, in contributing relevant results related to the indirect effects of biofuels as part of the United Kingdom government review of the Renewable Transport Fuels Obligation; referred to generally as the Gallagher Review. This contribution mainly concerns the evidence and uncertainties associated with total greenhouse gas emissions from current and future biofuel technologies, and the impacts and uncertainties associated with the total greenhouse gas emissions from a variety of land use changes. The main tools used to conduct this work and produce results consisted of a workbook provided by E4tech Ltd to support the current Renewable Fuels Agency Technical Guidance, a study of future transport fuels prepared by the European Commission’s Joint Research Centre at Ispra and the Biomass Environmental Assessment Tool (BEAT) of the Department for Environment, Food and Rural Affairs in the United Kingdom. These particular tools were chosen because they enable good coverage of current and future biofuels in a manner consistent with the methodology adopted by the Renewable Fuels Agency Technical Guidance. These tools were used to derive baseline estimates of total greenhouse gas emissions associated with current and future biofuels, mainly as a percentage to those from the production and use of conventional transport fuels obtained from fossil fuels. The baseline results for current biofuels are indicative ranges rather than strictly representative estimates since they are based on conservative default values which may not reflect actual options for the supply of energy to processing. Depending in specific circumstances, certain current biofuels can achieve notable reductions in greenhouse gas emissions. However, future biofuels offer the potential for higher savings provided that assumptions about their production performance can be realised commercially. Major contributions to total greenhouse gas emissions are identified for each current and future biofuel. Another tool which is examined in this report is the Greenhouse gases, Regulated Emissions, and Energy use in Transportation (GREET) model which is cited by the paper by Searchinger et al which is critical of the potential greenhouse gas savings of current biofuels, especially those produced in the United States of America. The GREET Model is reviewed here to investigate its relevance for application in the European Union, in general, and the United Kingdom, in particular. It is concluded that, whilst the GREET Model is very sound and transparent, its results cannot be applied without careful modification and full disclosure of relevant input data which has to reflect circumstances in Europe which are noticeably different from the United States of America. Another paper which is critical of the greenhouse gas emissions savings of current biofuels is that by Crutzen et al. Specifically, this paper claims that existing values for nitrous oxide emissions from soils during the cultivation of crops for current biofuels are substantially under-estimated. Hence, the analysis used in the paper by Crutzen et al is reviewed in this report. It is concluded that the claimed discrepancies with assumptions by the Inter-governmental Panel on Climate Change are exaggerated and that diminished estimates greenhouse gas emissions savings of current biofuels are based on incomplete and misleading evaluation. Although estimates of nitrous oxide
Page 5

emissions from soil are likely to be revised in the future as more sophisticated modelling is finalised, it is proposed that the current approach to assessing these emissions is retained. The remainder of the report addresses the effect of land use changes and agricultural practices. Given the potentially, wide range of possible land use changes, work is focused on key considerations for the production of current biofuels in the United Kingdom and their supply as imports from prominent existing and future producers. The conversion of permanent grassland to arable land for biofuel crop cultivation is regarded as the most significant option for the United Kingdom, due to the considerable amount of land available. The likely changes in carbon dioxide, methane and nitrous oxide emissions due to grassland conversion are evaluated using data mainly available from ADAS. Results indicate that conversion of permanent grassland in the United Kingdom to the cultivation of oilseed rape for the production of biodiesel, and sugar beet and wheat grain for the production of bioethanol should be avoided due to negative impacts on total greenhouse gas emissions. The effects of extreme examples of land conversion to cultivation are also investigated for the production of current biofuels from crops grown outside the United Kingdom. Data from Giulio Volpi and the papers by Fargione at al and Smeets et al are used to estimate losses of above- and below-ground carbon, and rates and periods of conversion of this carbon to carbon dioxide. Results imply that conversion of Cerrado (grassland and wooded), rainforest (peatland and tropical) and permanent grassland should be avoided in most countries for the cultivation of biomass feedstock for current biofuel production. However, conversion of wooded Cerrado to the cultivation of sugar cane in Brazil would still offer small savings in greenhouse gas emissions. The possibility of utilising fallow and set-aside land for the cultivation of crops for the production of current biofuels is also examined for the United Kingdom. Different types of fallow and set-aside land are considered over different timescales using data provided by ADAS. It is demonstrated that the greatest greenhouse gas savings would be achieved by using maintained or non-maintained rotational set-aside land over either the short (<20 a) or long (>100 a) terms to grow oilseed rape for biodiesel, and sugar beet and wheat grain for bioethanol. Potential improvements in net greenhouse gas emissions savings by using different agricultural practices are investigated using data supplied by ADAS. In particular, the effects of minimum tillage and autocasting for crop cultivation are examined. It is suggested that the largest reductions in greenhouse gas emissions might be achieved with minimum tillage over the short-term (less than 20 years) for the production of biodiesel from oilseed rape and bioethanol from wheat grain. However, these improvements cannot counter-balance the negative effects of major land use conversion such as the use of permanent grassland to grow crops for current biofuels. Finally, possible limits to imports of current biofuels are explored. It is assumed that the ultimate constraint on biofuel imports to the United Kingdom is that overall net greenhouse emissions savings are zero. Analysis suggests that strict limits can be identified for importing certain biofuels that are grown on land converted from rainforest (peatland and tropical) and grassland in specific countries.
Page 6

Contents 1 Introduction 9
1.1 Background 9 1.2 Areas of Work 9 1.3 Work Plan 9 1.4 Reporting Units 9
2 Greenhouse Gas Emissions Savings of Current and Future Biofuels 10 2.1 Consistent Methodology 10 2.2 Selection of Tools 10 2.3 Baseline Results for Current Biofuels 11 2.4 Baseline Results for Future Biofuels 15 2.5 Review of the GREET Model 20 2.6 Nitrous Oxide Emissions from Soils 25
3 Land Use Changes 30 3.1 Main Land Use Change Issues 30 3.2 Effect of Land Use Conversion 30 3.3 Effect of Carbon Sequestration by Fallow Land 38 3.4 Effect of Agricultural Practices 41 3.5 Biofuel Import Limits 45
4 Conclusions 46 ANNEX A Evaluation of Total Soil N2O Emissions with the IPCC Tier 1 Approach 49 REFERENCES 50
Page 7

1 Introduction 1.1 Background
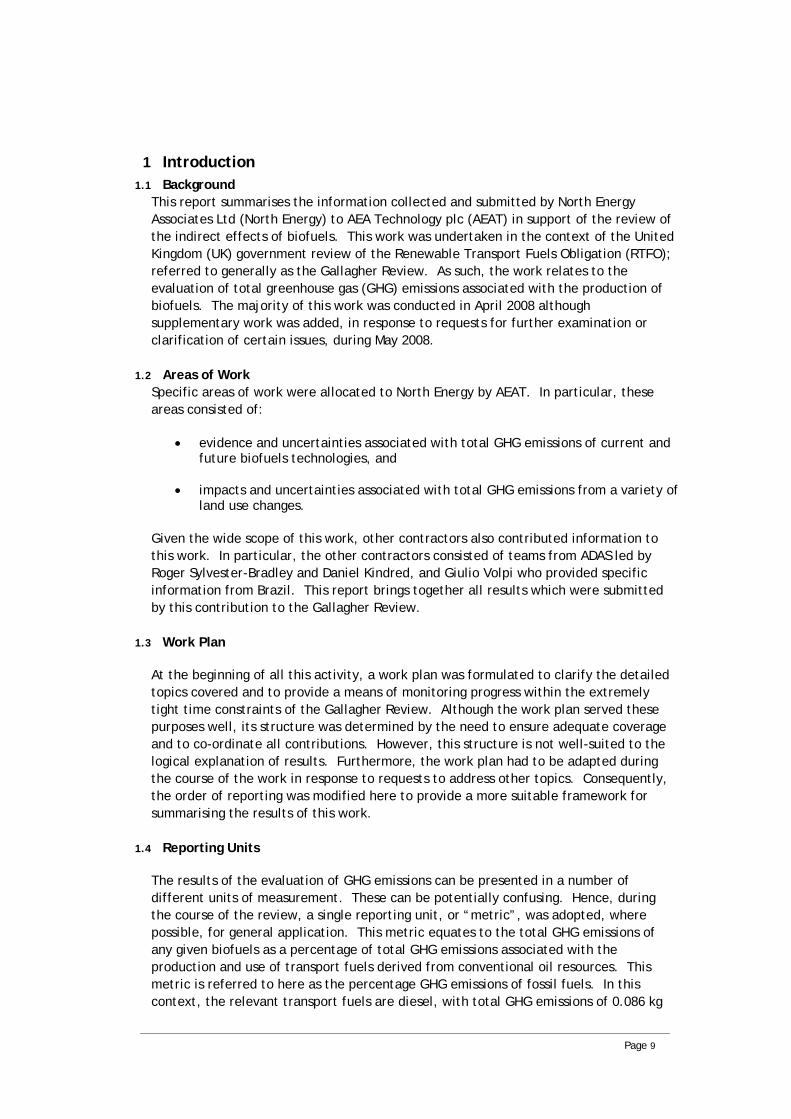
This report summarises the information collected and submitted by North Energy Associates Ltd (North Energy) to AEA Technology plc (AEAT) in support of the review of the indirect effects of biofuels. This work was undertaken in the context of the United Kingdom (UK) government review of the Renewable Transport Fuels Obligation (RTFO); referred to generally as the Gallagher Review. As such, the work relates to the evaluation of total greenhouse gas (GHG) emissions associated with the production of biofuels. The majority of this work was conducted in April 2008 although supplementary work was added, in response to requests for further examination or clarification of certain issues, during May 2008.
1.2 Areas of Work Specific areas of work were allocated to North Energy by AEAT. In particular, these areas consisted of:
• evidence and uncertainties associated with total GHG emissions of current and future biofuels technologies, and
• impacts and uncertainties associated with total GHG emissions from a variety of land use changes.
Given the wide scope of this work, other contractors also contributed information to this work. In particular, the other contractors consisted of teams from ADAS led by Roger Sylvester-Bradley and Daniel Kindred, and Giulio Volpi who provided specific information from Brazil. This report brings together all results which were submitted by this contribution to the Gallagher Review.
1.3 Work Plan At the beginning of all this activity, a work plan was formulated to clarify the detailed topics covered and to provide a means of monitoring progress within the extremely tight time constraints of the Gallagher Review. Although the work plan served these purposes well, its structure was determined by the need to ensure adequate coverage and to co-ordinate all contributions. However, this structure is not well-suited to the logical explanation of results. Furthermore, the work plan had to be adapted during the course of the work in response to requests to address other topics. Consequently, the order of reporting was modified here to provide a more suitable framework for summarising the results of this work.
1.4 Reporting Units The results of the evaluation of GHG emissions can be presented in a number of different units of measurement. These can be potentially confusing. Hence, during the course of the review, a single reporting unit, or “metric”, was adopted, where possible, for general application. This metric equates to the total GHG emissions of any given biofuels as a percentage of total GHG emissions associated with the production and use of transport fuels derived from conventional oil resources. This metric is referred to here as the percentage GHG emissions of fossil fuels. In this context, the relevant transport fuels are diesel, with total GHG emissions of 0.086 kg
Page 9

eq. CO2/MJ, and petrol or gasoline, with total GHG emissions of 0.085 kg eq. CO2/MJ (RFA, 2008b). These emissions factors are measured in terms of net calorific value.
2 Greenhouse Gas Emissions Savings of Current and Future Biofuels 2.1 Consistent Methodology
There are an extremely large number of studies which evaluate the total GHG emissions of current and future biofuels. Results vary between these studies, partly because of different assumptions that have been incorporated into the calculations and mainly because of differences in the methodologies that have been adopted to undertake the calculations. In order to provide a consistent basis for results and their comparison, it is necessary to use the same methodology. In terms of the current work, the most relevant methodology is that documented by the latest version of the Renewable Fuels Agency (RFA) Technical Guidance (RFA, 2008a). In addition to the existence of supporting documentation which contains default values (RFA, 2008b), a practical tool, in the form of a MS Excel workbook (RFA, 2008c), is available to enable calculations to be performed routinely.
Whilst various aspects of this methodology might be questioned, it has the advantage that it is an official, documented approach. However, one of its limitations in relation to the current work is that it only covers current biofuels which mainly consist of biodiesel derived from the esterification of vegetable oils and bioethanol obtained from the fermentation of starch- and sugar-bearing plant material. Future biofuels, such as biodiesel, bioethanol and other biofuels, produced using Fischer-Tropsch and lignocellulosic processing of biomass feedstocks, are not considered specifically by the RFA Technical Guidance. Hence, since time and resources were not available to derive new life cycle assessment (LCA) studies of future biofuels which would be compatible with RFA Technical Guidance, it has been necessary to adopt and modify existing approaches.
For compatibility with RFA Technical Guidance, two aspects of LCA methodology need to be taken into account; reference land use and allocation procedures for co-products. Reference land use addresses the issue of how much GHG emissions would arise from a piece of land if it were not used to cultivate a biomass feedstock for biofuels production. Currently, RFA Technical Guidance excludes reference land use. The choice of allocation procedure determines how total GHG emissions are divided amongst the various products that can be derived from biofuels production. Until recently, the RFA Technical Guidance adopted the use of substitution credits for all products other than the biofuels under consideration. This involves identifying the product which a co-product of biofuels production would displace and deriving avoided GHG emissions based on the GHG emissions factor of the displaced product. However, it should be noted that, in the latest version RFA Workbook (RFA, 2008c), options are kept open by including facilities for allocation by energy content and price.
2.2 Selection of Tools For this work, it was concluded that, in addition to the RFA Workbook, there are two other tools which were needed for assessing total GHG emissions of current and future biofuels on a consistent and comparable basis. In particular, coverage was extended by using the JEC Study (JEC, 2007) provides a suitable tool since it includes many future biomass feedstocks and processing technologies. Currently, this tool excludes land use reference systems and adopts substitution credits as a means of co-product allocation.
Page 10

However, the JEC Study derives results for the European Union (EU) as a whole whilst the RFA Technical Guidance has been formulated for initial use in the UK. This introduces the possibility of differences between results and the choice of different default values for the emissions factors of substitution credits. Some of the biofuel pathways accommodated within the JEC Study are not wholly consistent with the RFA Technical Guidance. Hence, it was necessary to merge results from the Biomass Environmental Assessment Tool (BEAT) which was formulated for the Department for Environment, Food and Rural Affairs (DEFRA) in the UK (DEFRA, 2008). Although BEAT has wider systems boundaries than either the RFA Workbook or the JEC Study, it was possible to eliminate incompatible elements to achieve consistency.
Consequently, in the present work, the RFA Workbook has been used to derive estimates of total GHG emissions for current biofuels including biodiesel production by means of esterification from oil palm, oilseed rape and soy bean, and bioethanol production by means of fermentation from maize (corn), molasses, sugar beet, sugar cane and wheat. The JEC Study has been adopted to derive estimates of total GHG emissions for future biofuels including bioethanol production using lignocellulosic processing and syndiesel production using gasification and Fischer-Tropsch (FT) processing of forestry residues, miscanthus, straw, waste wood and willow (from short rotation coppice). The JEC Study provided the evaluation of the GHG emissions from biomass feedstock processing whilst BEAT was used to address the provision of biomass feedstocks, particularly in the UK context.
It was also necessary to introduce a further modification into the JEC Study. This concerned the default value of the substitution credit for surplus electricity. The total GHG emissions associated with both lignocellulosic processing and gasification with FT processing are very sensitive to the choice of this value. To ensure consistency with the RFA Workbook, the value of marginal electricity generation of 0.106 kg eq. CO2/MJ in the UK was adopted in place of other values incorporated in the JEC Study. It should be noted that the JEC Study adopts a different approach to specification of the electricity substitution credit since this is based on the GHG emissions factor for electricity generated from the same biomass feedstock as used for biofuels production. This is an approach which is also found in the European Commission (EC) draft Renewable Energy Directive (EC, 2008).
2.3 Baseline Results for Current Biofuels The baseline results are given in Table 1 for current biofuel technologies with a methodology compatible with the current RFA Technical Guidance. Where possible, the results are given in the form of ranges based on the lowest and highest values derived from the RFA Workbook for different countries. This may not reflect the full extend to variations in results due to technological differences. It should also be noted that these results reflect default values which are considered to be conservative for RFTO reporting purposes. This approach has been adopted to encourage developers and suppliers to report their actual performance in terms of total GHG emissions. As part of this approach, it has been assumed that, in the majority of cases1, the sources of energy for biofuel conversion and processing consist of a fossil fuel-fired boiler (for
1 For the current biofuels considered here, default values assume the use of fossil fuel-fired boilers and imported electricity in all cases apart from bioethanol production from sugar cane in Brazil where bagasse-fired CHP is adopted (RFA, 2008c).
Page 11
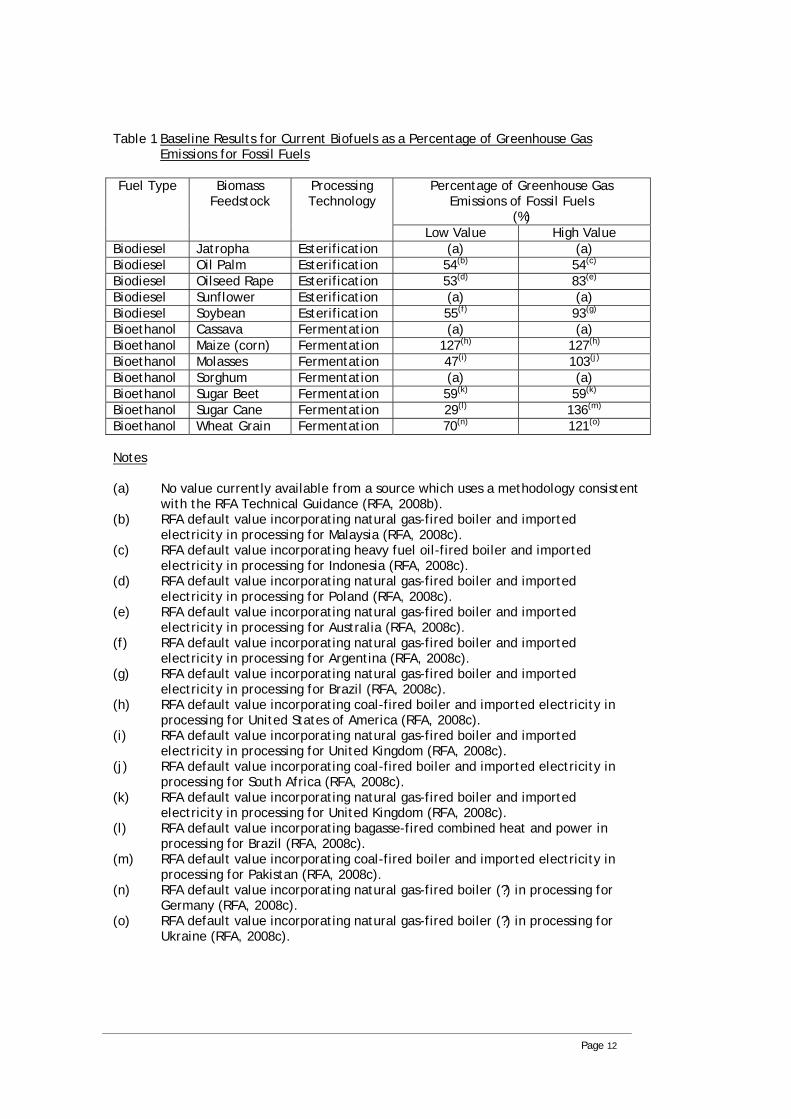
Table 1 Baseline Results for Current Biofuels as a Percentage of Greenhouse Gas Emissions for Fossil Fuels
Percentage of Greenhouse Gas
Emissions of Fossil Fuels (%)
Fuel Type Biomass Feedstock
Processing Technology
Low Value High Value Biodiesel Jatropha Esterification (a) (a) Biodiesel Oil Palm Esterification 54(b) 54(c)
Biodiesel Oilseed Rape Esterification 53(d) 83(e)
Biodiesel Sunflower Esterification (a) (a) Biodiesel Soybean Esterification 55(f) 93(g)
Bioethanol Cassava Fermentation (a) (a) Bioethanol Maize (corn) Fermentation 127(h) 127(h)
Bioethanol Molasses Fermentation 47(i) 103(j)
Bioethanol Sorghum Fermentation (a) (a) Bioethanol Sugar Beet Fermentation 59(k) 59(k)
Bioethanol Sugar Cane Fermentation 29(l) 136(m)
70(n) 121(o)Bioethanol Wheat Grain Fermentation Notes (a) No value currently available from a source which uses a methodology consistent
with the RFA Technical Guidance (RFA, 2008b). (b) RFA default value incorporating natural gas-fired boiler and imported
electricity in processing for Malaysia (RFA, 2008c). (c) RFA default value incorporating heavy fuel oil-fired boiler and imported
electricity in processing for Indonesia (RFA, 2008c). (d) RFA default value incorporating natural gas-fired boiler and imported
electricity in processing for Poland (RFA, 2008c). (e) RFA default value incorporating natural gas-fired boiler and imported
electricity in processing for Australia (RFA, 2008c). (f) RFA default value incorporating natural gas-fired boiler and imported
electricity in processing for Argentina (RFA, 2008c). (g) RFA default value incorporating natural gas-fired boiler and imported
electricity in processing for Brazil (RFA, 2008c). (h) RFA default value incorporating coal-fired boiler and imported electricity in
processing for United States of America (RFA, 2008c). (i) RFA default value incorporating natural gas-fired boiler and imported
electricity in processing for United Kingdom (RFA, 2008c). (j) RFA default value incorporating coal-fired boiler and imported electricity in
processing for South Africa (RFA, 2008c). (k) RFA default value incorporating natural gas-fired boiler and imported
electricity in processing for United Kingdom (RFA, 2008c). (l) RFA default value incorporating bagasse-fired combined heat and power in
processing for Brazil (RFA, 2008c). (m) RFA default value incorporating coal-fired boiler and imported electricity in
processing for Pakistan (RFA, 2008c). (n) RFA default value incorporating natural gas-fired boiler (?) in processing for
Germany (RFA, 2008c). (o) RFA default value incorporating natural gas-fired boiler (?) in processing for
Ukraine (RFA, 2008c).
Page 12

steam and/or heat) and electricity imported from the national electricity network2. As such, this is a conservative assumption. However, there are considerable advantages, in terms of economic costs, energy efficiency and total GHG emissions savings, from the use of combined heat and power (CHP) plants to provide steam and/or heat, and electricity. Hence, it is often more likely that a CHP plant or equivalent option will be adopted by biofuel producers in practice. As a consequence, results based on default values in the current RFA Technical Guidance, such as those summarised in Table 1, might not be regarded strictly as representative for current biofuels under consideration.
It will be seen that results for some biomass feedstocks included in scenario evaluation by E4tech Ltd for the Gallagher Review could not be included due to a lack of suitable and transparent data. These omissions consist of biodiesel from jatropha and sunflowers and bioethanol from cassava and sorghum. Whilst studies exist on the evaluation of GHG emissions associated with the production of biofuels from these biomass feedstocks, it was not possible to adopt these and ensure consistency with RFA Technical Guidance within the time available. However, it is likely that compatible results for these biomass feedstocks will emerge in the near future.
Relative contributions from different aspects of the current biofuel process pathways are provided in Tables 2 to 9. It will be seen that the major contributors and potential sources of uncertainty are limited to quite a few factors which vary depending on the biomass feedstock, the type of processing and the eventual current biofuels.
Table 2 Relative Contributions to the Total Greenhouse Gas Emissions Associated with
Biodiesel Production from Oil Palm by Esterification
Major Contribution Low Value High Value - Palm Oil Mill Effluent Emissions 36% 36% - Processing Chemicals (methanol) 18% 18% - Transport of Palm Oil 14% 14% - Soil Nitrous Oxide Emissions 12% 12% - Other Contributions 20% 20%
1742 1743 Total Greenhouse Gas Emissions (kg eq CO2/t biodiesel) Table 3 Relative Contributions to the Total Greenhouse Gas Emissions Associated with
Biodiesel Production from Oilseed Rape by Esterification
Major Contribution Low Value High Value - Nitrogen Fertiliser Manufacture 29% 38% - Soil Nitrous Oxide Emissions 26% 35% - Transport of Biodiesel 26% 2% - Cultivation and Harvesting Diesel Fuel 14% 11% - Processing Chemicals (methanol) 11% 18% - Other Contributions 18% 33% - Rape Meal Credit -24% -37% Total Greenhouse Gas Emissions (kg eq CO2/t biodiesel) 1682 2658 2 In the majority of cases, boilers are assumed to be fired by natural gas. Exceptions consist of the use of heavy fuel oil for biodiesel production from oil palm in Indonesia, and the use of coal for bioethanol production from molasses in South Africa, from maize (corn) in the United States of America, and from sugar cane in Pakistan (RFA, 2008c).
Page 13
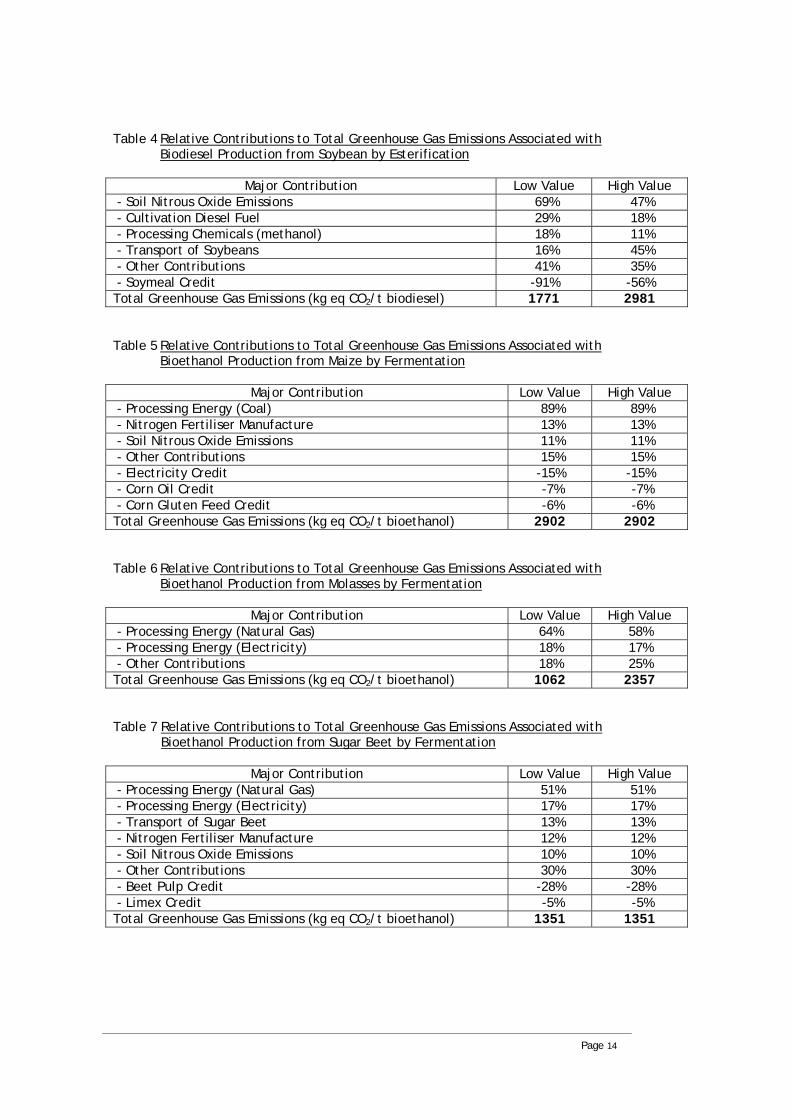
Table 4 Relative Contributions to Total Greenhouse Gas Emissions Associated with Biodiesel Production from Soybean by Esterification
Major Contribution Low Value High Value
- Soil Nitrous Oxide Emissions 69% 47% - Cultivation Diesel Fuel 29% 18% - Processing Chemicals (methanol) 18% 11% - Transport of Soybeans 16% 45% - Other Contributions 41% 35% - Soymeal Credit -91% -56%
1771 2981 Total Greenhouse Gas Emissions (kg eq CO2/t biodiesel) Table 5 Relative Contributions to Total Greenhouse Gas Emissions Associated with
Bioethanol Production from Maize by Fermentation
Major Contribution Low Value High Value - Processing Energy (Coal) 89% 89% - Nitrogen Fertiliser Manufacture 13% 13% - Soil Nitrous Oxide Emissions 11% 11% - Other Contributions 15% 15% - Electricity Credit -15% -15% - Corn Oil Credit -7% -7% - Corn Gluten Feed Credit -6% -6%
2902 2902 Total Greenhouse Gas Emissions (kg eq CO2/t bioethanol) Table 6 Relative Contributions to Total Greenhouse Gas Emissions Associated with
Bioethanol Production from Molasses by Fermentation
Major Contribution Low Value High Value - Processing Energy (Natural Gas) 64% 58% - Processing Energy (Electricity) 18% 17% - Other Contributions 18% 25%
1062 2357 Total Greenhouse Gas Emissions (kg eq CO2/t bioethanol) Table 7 Relative Contributions to Total Greenhouse Gas Emissions Associated with
Bioethanol Production from Sugar Beet by Fermentation
Major Contribution Low Value High Value - Processing Energy (Natural Gas) 51% 51% - Processing Energy (Electricity) 17% 17% - Transport of Sugar Beet 13% 13% - Nitrogen Fertiliser Manufacture 12% 12% - Soil Nitrous Oxide Emissions 10% 10% - Other Contributions 30% 30% - Beet Pulp Credit -28% -28% - Limex Credit -5% -5%
1351 1351 Total Greenhouse Gas Emissions (kg eq CO2/t bioethanol)
Page 14
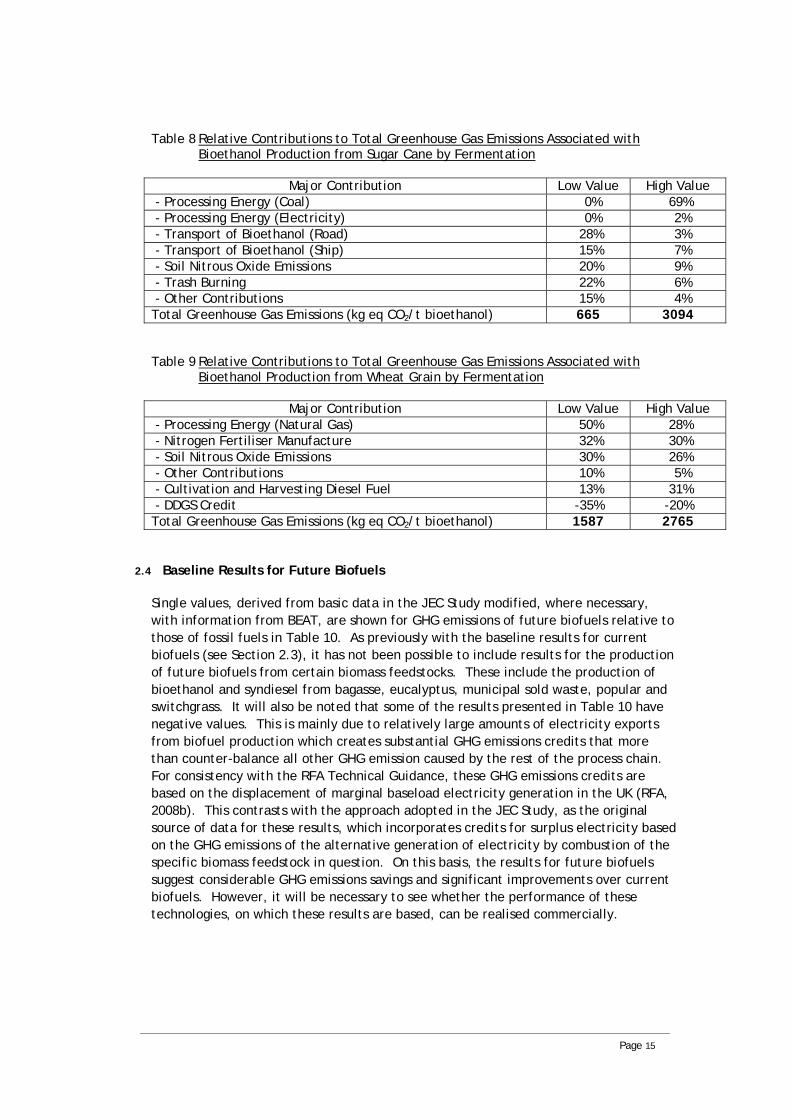
Table 8 Relative Contributions to Total Greenhouse Gas Emissions Associated with Bioethanol Production from Sugar Cane by Fermentation
Major Contribution Low Value High Value
- Processing Energy (Coal) 0% 69% - Processing Energy (Electricity) 0% 2% - Transport of Bioethanol (Road) 28% 3% - Transport of Bioethanol (Ship) 15% 7% - Soil Nitrous Oxide Emissions 20% 9% - Trash Burning 22% 6% - Other Contributions 15% 4%
665 3094 Total Greenhouse Gas Emissions (kg eq CO2/t bioethanol) Table 9 Relative Contributions to Total Greenhouse Gas Emissions Associated with
Bioethanol Production from Wheat Grain by Fermentation
Major Contribution Low Value High Value - Processing Energy (Natural Gas) 50% 28% - Nitrogen Fertiliser Manufacture 32% 30% - Soil Nitrous Oxide Emissions 30% 26% - Other Contributions 10% 5% - Cultivation and Harvesting Diesel Fuel 13% 31% - DDGS Credit -35% -20%
1587 2765 Total Greenhouse Gas Emissions (kg eq CO2/t bioethanol)
2.4 Baseline Results for Future Biofuels Single values, derived from basic data in the JEC Study modified, where necessary, with information from BEAT, are shown for GHG emissions of future biofuels relative to those of fossil fuels in Table 10. As previously with the baseline results for current biofuels (see Section 2.3), it has not been possible to include results for the production of future biofuels from certain biomass feedstocks. These include the production of bioethanol and syndiesel from bagasse, eucalyptus, municipal sold waste, popular and switchgrass. It will also be noted that some of the results presented in Table 10 have negative values. This is mainly due to relatively large amounts of electricity exports from biofuel production which creates substantial GHG emissions credits that more than counter-balance all other GHG emission caused by the rest of the process chain. For consistency with the RFA Technical Guidance, these GHG emissions credits are based on the displacement of marginal baseload electricity generation in the UK (RFA, 2008b). This contrasts with the approach adopted in the JEC Study, as the original source of data for these results, which incorporates credits for surplus electricity based on the GHG emissions of the alternative generation of electricity by combustion of the specific biomass feedstock in question. On this basis, the results for future biofuels suggest considerable GHG emissions savings and significant improvements over current biofuels. However, it will be necessary to see whether the performance of these technologies, on which these results are based, can be realised commercially.
Page 15
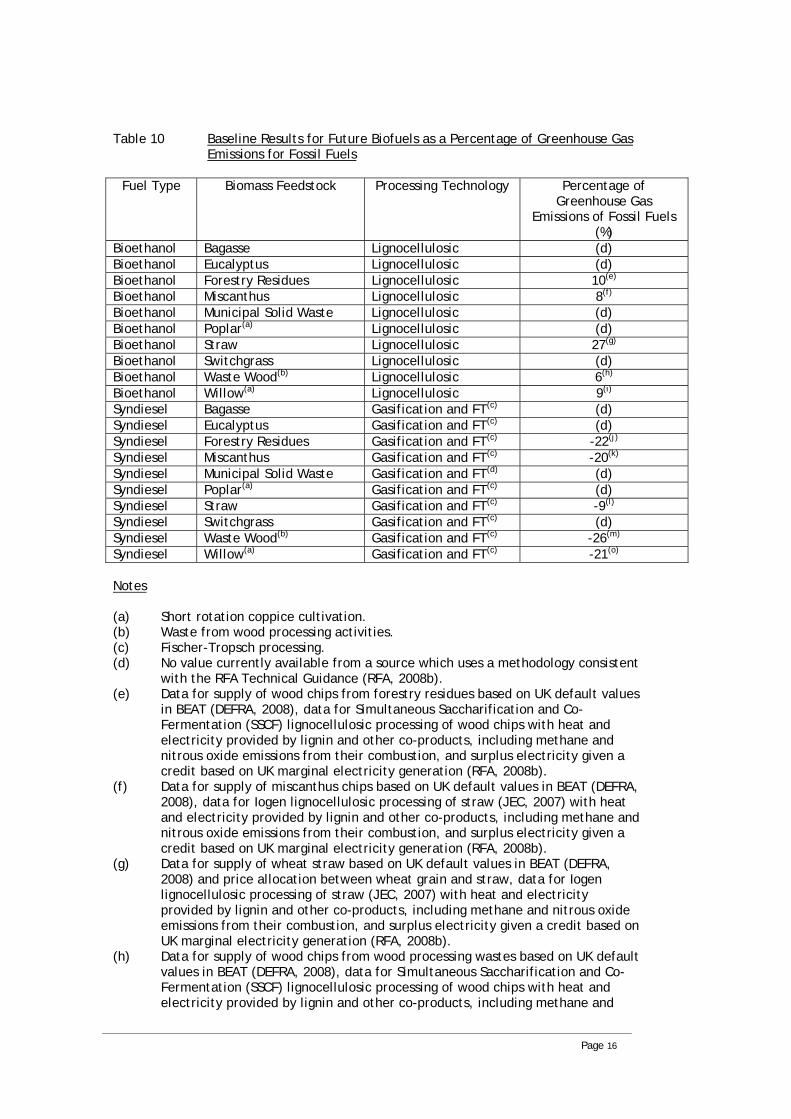
Table 10 Baseline Results for Future Biofuels as a Percentage of Greenhouse Gas Emissions for Fossil Fuels
Fuel Type Biomass Feedstock Processing Technology Percentage of
Greenhouse Gas Emissions of Fossil Fuels
(%) Bioethanol Bagasse Lignocellulosic (d) Bioethanol Eucalyptus Lignocellulosic (d) Bioethanol Forestry Residues Lignocellulosic 10(e)
Bioethanol Miscanthus Lignocellulosic 8(f)
Bioethanol Municipal Solid Waste Lignocellulosic (d) Bioethanol Poplar(a) Lignocellulosic (d) Bioethanol Straw Lignocellulosic 27(g)
Bioethanol Switchgrass Lignocellulosic (d) Bioethanol Waste Wood(b) Lignocellulosic 6(h)
Bioethanol Willow(a) Lignocellulosic 9(i)
Syndiesel Bagasse Gasification and FT(c) (d) Syndiesel Eucalyptus Gasification and FT(c) (d) Syndiesel Forestry Residues Gasification and FT(c) -22(j)
Syndiesel Miscanthus Gasification and FT(c) -20(k)
Syndiesel Municipal Solid Waste Gasification and FT(d) (d) Syndiesel Poplar(a) Gasification and FT(c) (d) Syndiesel Straw Gasification and FT(c) -9(l)
Syndiesel Switchgrass Gasification and FT(c) (d) Syndiesel Waste Wood(b) Gasification and FT(c) -26(m)
Willow(a) Gasification and FT(c) -21(o)Syndiesel Notes (a) Short rotation coppice cultivation. (b) Waste from wood processing activities. (c) Fischer-Tropsch processing. (d) No value currently available from a source which uses a methodology consistent
with the RFA Technical Guidance (RFA, 2008b). (e) Data for supply of wood chips from forestry residues based on UK default values
in BEAT (DEFRA, 2008), data for Simultaneous Saccharification and Co-Fermentation (SSCF) lignocellulosic processing of wood chips with heat and electricity provided by lignin and other co-products, including methane and nitrous oxide emissions from their combustion, and surplus electricity given a credit based on UK marginal electricity generation (RFA, 2008b).
(f) Data for supply of miscanthus chips based on UK default values in BEAT (DEFRA, 2008), data for Iogen lignocellulosic processing of straw (JEC, 2007) with heat and electricity provided by lignin and other co-products, including methane and nitrous oxide emissions from their combustion, and surplus electricity given a credit based on UK marginal electricity generation (RFA, 2008b).
(g) Data for supply of wheat straw based on UK default values in BEAT (DEFRA, 2008) and price allocation between wheat grain and straw, data for Iogen lignocellulosic processing of straw (JEC, 2007) with heat and electricity provided by lignin and other co-products, including methane and nitrous oxide emissions from their combustion, and surplus electricity given a credit based on UK marginal electricity generation (RFA, 2008b).
(h) Data for supply of wood chips from wood processing wastes based on UK default values in BEAT (DEFRA, 2008), data for Simultaneous Saccharification and Co-Fermentation (SSCF) lignocellulosic processing of wood chips with heat and electricity provided by lignin and other co-products, including methane and
Page 16
nitrous oxide emissions from their combustion, and surplus electricity given a credit based on UK marginal electricity generation (RFA, 2008b).
(i) Data for supply of wood chips from willow short rotation coppice (chip harvesting and natural drying) based on UK default values in BEAT (DEFRA, 2008), data for Simultaneous Saccharification and Co-Fermentation (SSCF) lignocellulosic processing of wood chips with heat and electricity provided by lignin and other co-products, including methane and nitrous oxide emissions from their combustion, and surplus electricity given a credit based on UK marginal electricity generation (RFA, 2008b).
(j) Data for supply of wood chips from forestry residues based on UK default values in BEAT (DEFRA, 2008), data for gasification and Fisher-Tropsch processing of wood chips with heat and electricity provided by off-gas, including methane and nitrous oxide emissions, and surplus electricity given a credit based on UK marginal electricity generation (RFA, 2008b).
(k) Data for supply of miscanthus chips based on UK default values in BEAT (DEFRA, 2008), data for gasification and Fisher-Tropsch processing of miscanthus chips with heat and electricity provided by off-gas, including methane and nitrous oxide emissions, and surplus electricity given a credit based on UK marginal electricity generation (RFA, 2007).
(l) Data for supply of wheat straw based on UK default values in BEAT (DEFRA, 2008) and price allocation between wheat grain and straw, data for gasification and Fisher-Tropsch processing of straw with heat and electricity provided by off-gas, including methane and nitrous oxide emissions, and surplus electricity given a credit based on UK marginal electricity generation (RFA, 2008b).
(m) Data for supply of wood chips from wood processing waste based on UK default values in BEAT (DEFRA, 2008), data for gasification and Fisher-Tropsch processing of wood chips with heat and electricity provided by off-gas, including methane and nitrous oxide emissions, and surplus electricity given a credit based on UK marginal electricity generation (RFA, 2008b).
(n) Data for supply of wood chips from willow short rotation coppice (chip harvesting and natural drying) based on UK default values in BEAT (DEFRA, 2008), data for gasification and Fisher-Tropsch processing of wood chips with heat and electricity provided by off-gas, including methane and nitrous oxide emissions, and surplus electricity given a credit based on UK marginal electricity generation (RFA, 2008b).
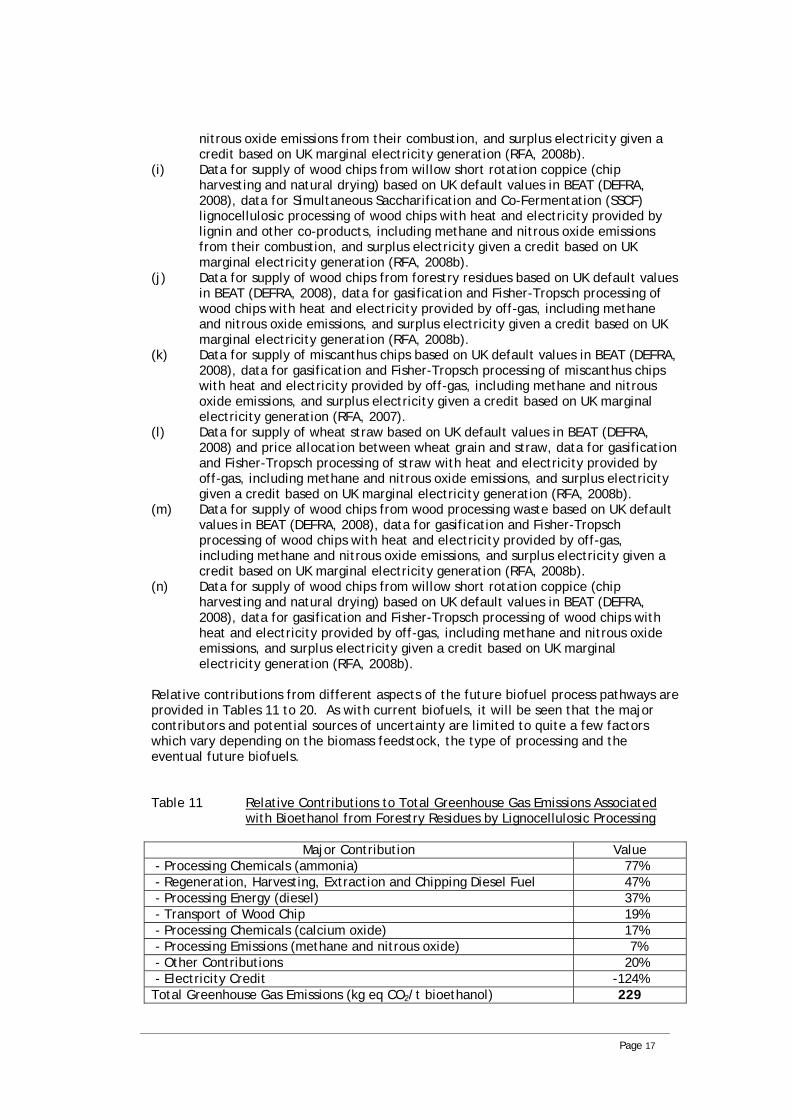
Relative contributions from different aspects of the future biofuel process pathways are provided in Tables 11 to 20. As with current biofuels, it will be seen that the major contributors and potential sources of uncertainty are limited to quite a few factors which vary depending on the biomass feedstock, the type of processing and the eventual future biofuels. Table 11 Relative Contributions to Total Greenhouse Gas Emissions Associated
with Bioethanol from Forestry Residues by Lignocellulosic Processing
Major Contribution Value - Processing Chemicals (ammonia) 77% - Regeneration, Harvesting, Extraction and Chipping Diesel Fuel 47% - Processing Energy (diesel) 37% - Transport of Wood Chip 19% - Processing Chemicals (calcium oxide) 17% - Processing Emissions (methane and nitrous oxide) 7% - Other Contributions 20% - Electricity Credit -124%
229 Total Greenhouse Gas Emissions (kg eq CO2/t bioethanol)
Page 17
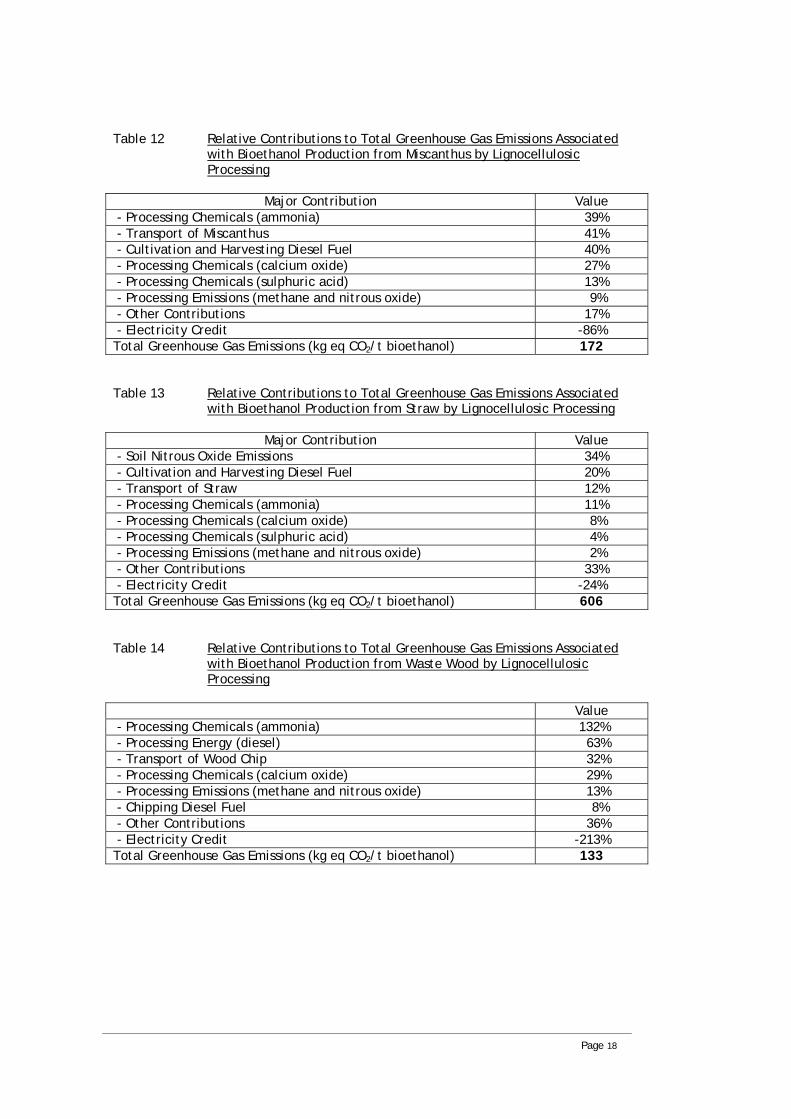
Table 12 Relative Contributions to Total Greenhouse Gas Emissions Associated with Bioethanol Production from Miscanthus by Lignocellulosic Processing
Major Contribution Value
- Processing Chemicals (ammonia) 39% - Transport of Miscanthus 41% - Cultivation and Harvesting Diesel Fuel 40% - Processing Chemicals (calcium oxide) 27% - Processing Chemicals (sulphuric acid) 13% - Processing Emissions (methane and nitrous oxide) 9% - Other Contributions 17% - Electricity Credit -86% Total Greenhouse Gas Emissions (kg eq CO2/t bioethanol) 172 Table 13 Relative Contributions to Total Greenhouse Gas Emissions Associated
with Bioethanol Production from Straw by Lignocellulosic Processing
Major Contribution Value - Soil Nitrous Oxide Emissions 34% - Cultivation and Harvesting Diesel Fuel 20% - Transport of Straw 12% - Processing Chemicals (ammonia) 11% - Processing Chemicals (calcium oxide) 8% - Processing Chemicals (sulphuric acid) 4% - Processing Emissions (methane and nitrous oxide) 2% - Other Contributions 33% - Electricity Credit -24% Total Greenhouse Gas Emissions (kg eq CO2/t bioethanol) 606 Table 14 Relative Contributions to Total Greenhouse Gas Emissions Associated
with Bioethanol Production from Waste Wood by Lignocellulosic Processing
Value - Processing Chemicals (ammonia) 132% - Processing Energy (diesel) 63% - Transport of Wood Chip 32% - Processing Chemicals (calcium oxide) 29% - Processing Emissions (methane and nitrous oxide) 13% - Chipping Diesel Fuel 8% - Other Contributions 36% - Electricity Credit -213%
133 Total Greenhouse Gas Emissions (kg eq CO2/t bioethanol)
Page 18
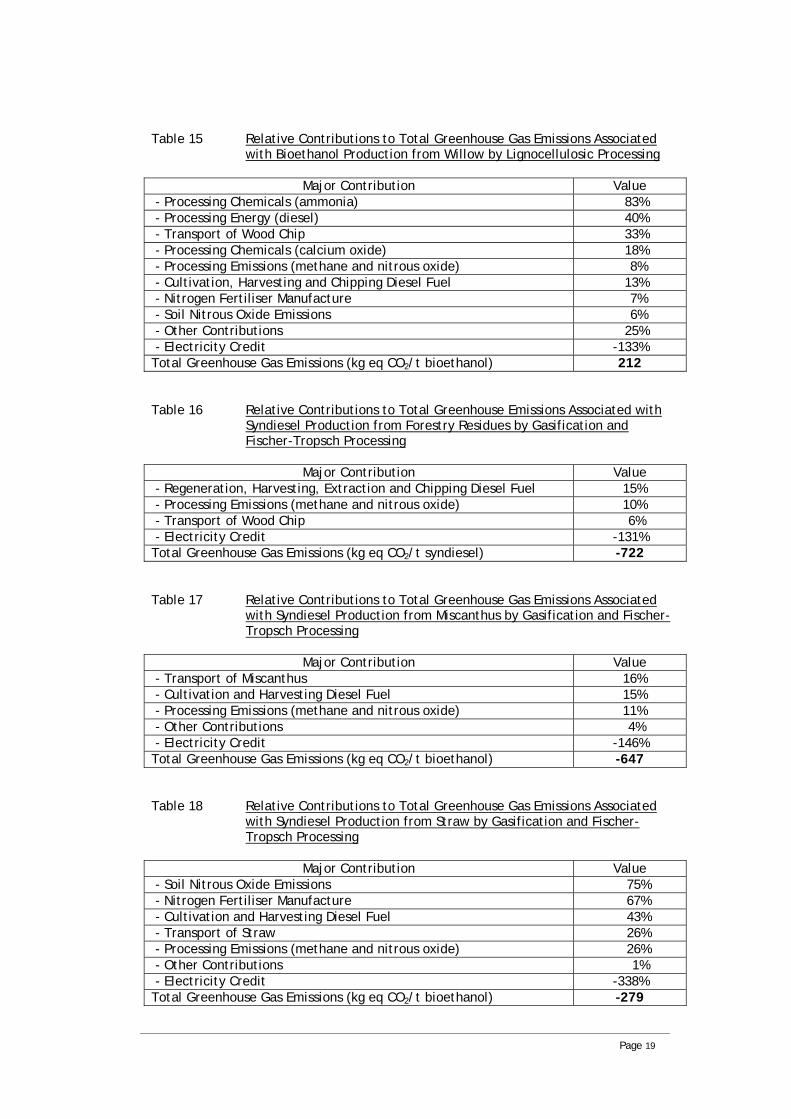
Table 15 Relative Contributions to Total Greenhouse Gas Emissions Associated with Bioethanol Production from Willow by Lignocellulosic Processing
Major Contribution Value
- Processing Chemicals (ammonia) 83% - Processing Energy (diesel) 40% - Transport of Wood Chip 33% - Processing Chemicals (calcium oxide) 18% - Processing Emissions (methane and nitrous oxide) 8% - Cultivation, Harvesting and Chipping Diesel Fuel 13% - Nitrogen Fertiliser Manufacture 7% - Soil Nitrous Oxide Emissions 6% - Other Contributions 25% - Electricity Credit -133% Total Greenhouse Gas Emissions (kg eq CO2/t bioethanol) 212 Table 16 Relative Contributions to Total Greenhouse Emissions Associated with
Syndiesel Production from Forestry Residues by Gasification and Fischer-Tropsch Processing
Major Contribution Value
- Regeneration, Harvesting, Extraction and Chipping Diesel Fuel 15% - Processing Emissions (methane and nitrous oxide) 10% - Transport of Wood Chip 6% - Electricity Credit -131% Total Greenhouse Gas Emissions (kg eq CO2/t syndiesel) -722 Table 17 Relative Contributions to Total Greenhouse Gas Emissions Associated
with Syndiesel Production from Miscanthus by Gasification and Fischer-Tropsch Processing
Major Contribution Value
- Transport of Miscanthus 16% - Cultivation and Harvesting Diesel Fuel 15% - Processing Emissions (methane and nitrous oxide) 11% - Other Contributions 4% - Electricity Credit -146% Total Greenhouse Gas Emissions (kg eq CO2/t bioethanol) -647 Table 18 Relative Contributions to Total Greenhouse Gas Emissions Associated
with Syndiesel Production from Straw by Gasification and Fischer-Tropsch Processing
Major Contribution Value
- Soil Nitrous Oxide Emissions 75% - Nitrogen Fertiliser Manufacture 67% - Cultivation and Harvesting Diesel Fuel 43% - Transport of Straw 26% - Processing Emissions (methane and nitrous oxide) 26% - Other Contributions 1% - Electricity Credit -338%
-279 Total Greenhouse Gas Emissions (kg eq CO2/t bioethanol)
Page 19

Table 19 Relative Contributions to Total Greenhouse Gas Emissions Associated with Syndiesel Production from Waste Wood by Gasification and Fischer-Tropsch Processing
Major Contribution Value
- Processing Emissions (methane and nitrous oxide) 9% - Transport of Wood Chip 5% - Chipping Diesel Fuel 1% - Electricity Credit -115% Total Greenhouse Gas Emissions (kg eq CO2/t syndiesel) -818 Table 20 Relative Contributions to Total Greenhouse Gas Emissions Associated
with Syndiesel Production from Willow by Gasification and Fischer-Tropsch Processing
Value - Transport of Wood Chip 15% - Processing Emissions (methane and nitrous oxide) 11% - Chipping Diesel Fuel 6% - Soil Nitrous Oxide Emissions 3% - Nitrogen Fertiliser Manufacture 3% - Other Contributions 8% - Electricity Credit -146%
-683 Total Greenhouse Gas Emissions (kg eq CO2/t syndiesel)
2.5 Review of the GREET Model To a significant degree, the Gallagher Review addresses criticisms of current biofuels raised in a paper which is subsequently referred as Searchinger et al (Searchinger et al, 2008). This paper adopts a US tool for estimating GHG emissions associated with the production certain biofuels. This tool, known as the Greenhouse gases, Regulated Emissions, and Energy use in Transportation (GREET) model, was developed by Argonne National Laboratory under the sponsorship of the US Department of Energy’s Office of Energy Efficiency and Renewable Energy in order to fully evaluate energy and emission impacts of advanced vehicle technologies and new transportation fuel and compare to traditional fuels. The current available version is GREET1.8b which was released in March 2008.
The model is very extensive as it includes conventional fuel production pathways including petroleum, as well as biofuels and reports results, in terms of energy use from “wells-to-fuel pump” and “wells-to-wheels” system boundaries, and emissions for vehicle/fuel technology combinations. Although the Searchinger et al paper uses the GREET Model for biofuels which are currently relevant to the USA, its conclusions have been expanded, by the authors and others, to comment on current biofuels production and utilisation outside the USA, in general, and within the European Union (EU), in particular. In the context of the Gallagher Review, the validity of this approach has to be examined with regard to the relevance of the methodology, data and coverage of the GREET Model. Therefore, current work has been conducted to ascertain the relevance of the GREET Model to the provision and use of current biofuels internationally and to determine whether this US-based model can be applied to the situation in the EU.
Page 20
The model is a MS Excel-based workbook tool with optional Graphical User Interface called GREETGUI (ANL, 2007). The results quantify the following for current and future scenarios:
• Consumption of total energy (energy in non-renewable and renewable sources) and fossil fuels (petroleum, natural gas and coal),
• Total GHG emissions – primarily CO2, CH4, and N2O measured terms of in equivalent CO2, and
• Emissions of five criteria pollutants: volatile organic oxide, particulate matter with size smaller than 10 micron (PM10), and sulphur oxides.
Point estimations and probability estimations can be produced. The time series results are for the years 1990 – 2020 in five year intervals.
The MS Excel workbook consists of 28 worksheets which calculate energy use and emissions for:
• Natural gas based fuels; • Hydrogen production pathways; • Manufacturing agricultural inputs including fertiliser, herbicides and
insecticides; • Ethanol production; • Additives to blend ethanol in diesel fuel; • Biodiesel production; • Coal mining; • Uranium ore mining and fuel production; • Landfill gas recovery; • Electricity generation; and • Vehicle operations.
Additionally, the workbook calculates:
• Energy and efficiencies of compression processes; and • Time series tables of fuel economy and emission rates/changes
associated with vehicle operations for passenger cars, light duty truck 1 and light duty truck 2.
The results of “well-to-fuel pump” and “well-to-wheels” energy use and emissions for vehicle/fuel technology combinations are presented in tabular and graphical forms. Stochastic simulation runs are possible. The “Input” worksheet contains the key variables and options for each stage. This worksheet allows the user to define the essential parameters for the various fuel pathways, the vehicle types, fuel blending options and includes the key GREET Model default assumptions for “well-to-fuel pump” activities.
Currently, the GREET Model includes more than 100 fuel production pathways from various energy feedstocks. The biofuels which are included are:
• Corn (maize) to bioethanol and biobutanol, • Soy bean to biodiesel via hydrogenation, and
Page 21

• Sugar cane and cellulosic biomass to bioethanol, hydrogen, biomethanol, dimethyl ether, and Fischer-Tropsch diesel.
The biofuel production pathways which are included are:
• Sugar crops for bioethanol • Starch crops for bioethanol • Oils for biodiesel/renewable diesel • Biobutanol production • Cellulosic biomass via gasification, and • Cellulosic biomass for bioethanol
Various methodologies have been adopted internationally whilst still complying with procedures recommended in ISO 14040 Series (ISO, 2006) as there is enough freedom of choice in the way that certain important aspects are addressed. The nuances of these choices can actually produce quite different results. The methodology of GREET has been examined to determine how it approaches the key methodological differences that are seen in other systems, being:
• Treatment of land use change/reference systems, • Co-product allocation procedures, and • System boundaries.
With regard to land use change, the GREET Model includes GHG emissions from direct land use changes and not indirect land use changes. The functionality of the tool allows this to be an option which can be excluded from the results.
Co-product allocation allows resource input and environmental outputs (for example, GHG emissions) to be attributed to all useful products which are produced as part of the fuel production pathway. There are various possible methods, but no universally accepted way of dealing with co-products which include:
• Displacement or system boundary expansion approach (substitution credits),
• Allocation methods: Mass based (allocation by mass) Market value-based (allocation by price) Energy content-based (allocation by energy content) • Production plant process purpose-based approach
Within the GREET Model, a mixture of co-product allocation procedures are used. For example, allocation by energy content is used for electricity but, otherwise, displacement of product or use of substitution credits is adopted where possible. The user can choose how each co-product is treated but the GREET Model limits this choice. Market value allocation allows both the “black box” (whole system level) approach and the subsystem level approach to be used. With the “black box” approach, all inputs and outputs within the production pathway are allocated between the fuel and co-products. However, with the subsystem level approach, only the inputs and outputs upstream of the point at which given co-products are produced in the fuel production pathway are allocated to these co-products.
The system boundary specifies which activities associated with a particular pathway are taken into account or included within a LCA study. The GREET Model has very clearly defined boundary definitions. It includes manufacturing stages of materials used in
Page 22
agriculture, such as fertilisers and other chemicals, but does not include manufacture and maintenance of machinery. It also allows the user to choose whether certain activities are included within the system boundary as, for example, whether the construction of a sugar cane mill is included in the GHG emissions calculations.
One of the most significant features of the GREET Model is the transparent nature of Excel workbook. The calculations and formulas are included though not directly referenced. Users are then able to review calculations and amend accordingly to the appropriate data source. Therefore, in theory, it should be possible for the experienced user to input European data and obtain results which are relevant to the EU.
However, despite there being over 100 fuel production pathways within the model, there are limited feedstock options and those which are included are pertinent to the US environment and not particularly relevant to EU, in general, or the UK, in particular. It can be assumed that the feedstocks which are within the RFA Technical Guidance (RFA, 2008a) are most relevant to the UK market. There is little overlap between the feedstocks in the RFA Technical Guidance and those included within the GREET Model. In particular, bioethanol from wheat and biodiesel from oilseed rape are more important from an EU perspective, whereas bioethanol from corn (maize) and biodiesel from soy bean are the most important for the USA. The GREET Model contains inventory data for corn and soy bean agriculture, transportation and processing into ethanol and biodiesel, but does not include any similar data for wheat or oilseed rape.
The emission factors within the GREET Model are sourced through the US Environmental Protection Agency ‘Compilation of Air Pollutant Emission Factors’, US government documents and other studies. Generally, all default data are US-based or US-generated. There is very little international data, unless it is relevant to significant US imports.
However, it should be possible to produce results for EU locations by including EU data for particular feedstock fuel pathways which are included, as the production of bioethanol from corn (maize) in France. When interrogated in greater detail, it can be found that the GREET Model’s inbuilt co-product for ethanol from dry milled corn is DDGS which displaces corn. This is true for the US market but, for France, the RFA assumes a co-product of DDGS which displaces US soy meal crushed in the EU. In short, different markets have different products displaced. However, if the allocation procedure was changed to market value, input values could be relevant to the EU. Additionally, the GREET Model only allows natural gas and coal input fuel for processing corn to bioethanol but the RFA Technical Guidance accommodates a wider range of processing fuels including coal, natural gas, heavy fuel oil and biomass which is more representative of the EU situation.
The following key parameters were examined in greater detail to ascertain whether they are applicable to the EU situation:
• N2O emissions from soils: The default emission rates included in the GREET Model are 1.3% of N in applied nitrogen fertiliser, of which 0.65% converts into N2O. This translates into 0.0208 kg N2O/kg N which is the same as the estimated total (direct and indirect emissions) derived from the Inter-governmental Panel on Climate Change (IPCC) Tier 1 approach (IPCC, 2006) adopted in the RFA Technical Guidance, the JEC Study and in BEAT (see Section 2.6 and Appendix A).
Page 23

• Electricity GHG emissions factor: The default emissions factor is based on the
average US power plant mix but there are various options including user defined. It is also possible to choose separately what mix of electricity is displaced for co-product electricity but there is a limited choice and this does not include user-defined options which would be required to make the calculations relevant to the EU. The emission factors for non-fossil electricity sources are assumed to be zero, but GHG emissions associated with uranium mining are included for electricity generated from nuclear power. All emission factors include upstream emissions. The resulting electricity GHG emissions factor incorporated, in effect, as a default value in the GREET Model is 0.203 kg eq. CO2/MJ. This can be compared with a default value of 0.160 kg eq. CO2/MJ for the USA adopted in the current RFA Technical Guidance3. There are significant differences between the electricity GHG emissions factors in different countries and these have to be taken into account when comparing results for biofuels that consume or generate, as an exported surplus, considerable amounts of electricity during their processing .
Ultimately, when reviewing biofuel production pathway results, a comparison to the conventional counterparts is usually required. Therefore, the GHG emission factors for diesel and gasoline (petrol) and diesel need to be relevant to the EU. When comparing diesel and gasoline emissions factors in the the GREET Model and RFA Workbook, similar results are found for diesel but not for gasoline (as shown in Table 21).
Table 21 Comparison of Emissions Factors in the GREET Model and the RFA Workbook
Emissions Factors GREET Model Values
Grams/mm Btu Kg eq. CO2/MJ GREET Model values for Baseline conventional and reformulated low sulphur gasoline
18,867 0.097
GREET Model values for baseline conventional and reformulated low sulphur diesel
16,986 0.087
RFA Technical Guidance value for gasoline (petrol)
0.085
RFA Technical Guidance value for diesel 0.086 In addition, it should be noted that “well-to-fuel pump” results are available from the GREET Model. Although the biofuel blends can be changed, it is recommended that these should not be varied significantly from the default values.
The GREET Model has additional functionality to that of the RFA Workbook as it includes “well-to-fuel pump” and “well-to-wheels” whereas the RFA Workbook only provides for evaluation up to and including the refinery/blending facility. In particular, the GREET Model includes evaluation of vehicle tailpipe emissions which are absent from the RFA Workbook. The magnitude of increased tailpipe emissions for vehicles powered by biofuels is not universally agreed as no robust research has been undertaken. Independent evidence using consistent and comparable vehicle trials is required to achieve this. By excluding consideration of vehicle performance, the RFA Technical Guidance assumes, in effect, same tailpipe emissions per unit energy 3 The difference in emissions factors is probably due to the fact that the current version of the RFA Technical Guidance derives values from the International Energy Agency online database which only considers direct GHG emissions from the electricity generation sector of the country in question.
Page 24
available for biofuels and their conventional counterparts. For the GREET Model, it is worth noting that whilst the vehicles included will be based on US standards, the “pump-to-wheel” (PTW) GHG, CO, NOx and PM10 emissions for bioethanol and biodiesel are similar to their oil and natural gas-based counterparts. The only significant difference is when comparing the VOC PTW emissions of biofuels with their natural gas-based counterparts (Brinkman et al, 2005). The GREET Model uses the MOBILE6.2 software (EPA, 2006) and EMFAC2002 software (CARB, 2003) to generate sets of emissions data for vehicles. It is possible to change the default fuel economies and emission rates accordingly.
As an illustration of the care which must be exercised when using the results from the GREET Model in a context different from the USA, the case of bioethanol production from maize can be considered. Although there is not a standard set of default results from the GREET Model, quoted results from Searchinger et al can be used to establish a basis for comparison. In particular, it is stated that “replacing gasoline with corn-ethanol reduces GHGs by 20% in the 2015 scenario excluding land use change” (Searchinger et al, 2008). With the GHG emissions factor of 0.097 kg eq. CO2/MJ for gasoline (petrol) used in the GREET Model, this equates to a GHG emissions factor of 0.078 kg eq. CO2/MJ for bioethanol from maize. In fact, this is lower than the conservative estimate of 0.108 kg eq. CO2/MJ4 for US bioethanol from maize derived from the RFA Workbook (RFA, 2008c). However, resulting RFA estimate for bioethanol produced from maize in France is considerably lower at 0.049 kg eq. CO2/MJ (RFA, 2008c). The main reason for this difference is that it has been assumed that, typically, coal is used as a fuel for bioethanol processing whereas the relevant fuel in France is natural gas.
It can be concluded from this review that the GREET Model cannot be readily used for the EU and UK biofuels market without significant care. The main reason is that the fuel production pathways which are included within the GREET Model are not directly applicable to the European situation. The transparent nature of the Excel workbook means that most data can be scrutinised and made relevant to the EU/UK, but it is not currently designed for use outside US as all inbuilt assumptions and defaults are US-based. Hence, the user must provide suitable values which reflect the circumstances that are being modelled and apply them accordingly. Whether subsequent estimates are meaningful and reliable depends on full disclosure of these applied values in any subsequent justification of their relevance. Citing the well-established and widely-used GREET Model as the source of such estimates is not sufficient since it does not automatically confer legitimacy to any resulting conclusions. Any suggestion that the outcomes of the Searchinger et al paper can be extended to current biofuel production in the EU, in general, and the UK, in particular, has to take this into account.
2.6 Nitrous Oxide Emissions from Soils
Although the emission of nitrous oxide (N2O) from soils is an important land-related issue for biofuel production, it is examined in this part of the report because it affects all land use rather than the specific matters of land use which are considered in Section 3. Such emissions can be relatively small, on a weight basis, compared with the emission of other GHGs, especially CO2, associated with all the processes involved in
4 Assuming a net calorific value for bioethanol of 26.8 MJ/kg (RFA, 2008b).
Page 25
the complete production of biofuels. However, the relative impact of these and other N2O emissions on global climate change is magnified by the Global Warming Potential of this GHG which is 296 times greater, weight for weight, than CO2. Because of this, there has been significant concern about the evaluation of N2O emissions from soils within the overall assessment of total GHG emissions of biofuels, especially those which involve the provision of biomass feedstocks by cultivation crops.
The paper by Crutzen et al is particularly critical of the standard means of assessing soil N2O emissions associated with the production of current biofuels (Crutzen et al, 2007). This paper examines the N2O flux through the atmosphere in an attempt to determine that amount of N2O that can be attributed to the global cultivation of soils. This is then compared with the global estimate of nitrogen (N) fertiliser applied to cultivated soils to derive a relationship between soil N2O emissions and N fertiliser application5. The resulting relationship is contrasted with that provided from relevant work by the Inter-governmental Panel on Climate Change (IPCC, 2006) and it is claimed that a significant discrepancy is identified. Prominent life cycle assessment (LCA) studies of biofuels use such IPCC 2006 data to accommodate soil N2O emissions. Hence, it is implied that such studies under-estimate the contribution of soil N2O emissions by a factor of 3 to 5. This conclusion is then applied to an evaluation of certain biofuels to demonstrate that most do not generate net GHG savings relative to conventional fossil fuels. Consequently, the paper by Crutzen at al is frequently cited as evidence against the use of biofuels as an effective means of mitigating global climate change.
The key issues of the paper by Crutzen et al for this critical review are as follows:
• Is the global estimate of the N2O flux attributed to cultivation and the subsequent relationship between N2O emissions and N fertiliser application correct?
• Is the assumed discrepancy between the relationship derived in the paper by Crutzen et al and that specified in IPCC 2006 meaningful?
• Are the conclusions for biofuels sound and are earlier LCA studies incorrect? In the paper by Crutzen et al, data from various sources are used to examine the current global N2O flux. In particular, it is estimated that the current total flux is 15.8 Tg N/a which is similar to the value of 16.2 Tg N/a quoted in IPCC 2006. From this total, a natural flux of 9.3 – 10.2 Tg N/a is subtracted to obtain an estimate of the anthropogenic flux of 5.6 – 6.5 Tg N/a. It is stated that the flux from industrial sources is 0.7 – 1.3 Tg N/a so that the balance of 4.3 – 5.8 Tg N/a is attributed to emissions from cultivated soils. An estimate of global N fertiliser application of 127 Tg N/a, referred to as the “anthropogenic new fixed nitrogen input”, is used to derive a relationship of 0.0340 – 0.0460 kg N2O-N/kg N (3.4 – 4.6%) or 0.0534 – 0.0723 kg N2O/kg N. This is contrasted with the relationship of 0.0100 kg N2O-N/kg N (1%) or 0.0157 kg N2O/kg N specified in IPCC 2006 for direct soil N2O emissions.
5 This is measured as the amount of N in N2O emitted (g N2O-N) per amount of N applied (g N) which can be expressed as a percentage (%). Alternatively, the relationship can be converted into the amount of N2O emitted (kg N2O) per amount of N applied (kg N) by means of the ratio of atomic weights of N2O to N2 (44/28 = 1.571). This latter means of expression is common in most LCA studies of biofuels and, therefore, will be adopted here.
Page 26

There are fundamental concerns about the attribution of N2O emissions to cultivated soils by what is, in effect, a “remainder calculation” which is highly sensitive to the assumed values of individual N2O fluxes. In particular, it is doubtful whether all the “non-cultivated soil” fluxes have been adequately accounted for by the flux from industrial sources of 0.7 – 1.3 Tg N/a. This estimated flux does not include all other anthropogenic N2O sources. These are very substantial and include N2O emissions from biomass combustion (0.2 – 1.0 Tg N/a) and livestock (0.2 – 0.5 Tg N/a) (IPCC 2006). It is also not apparent whether the industrial sources include N2O emissions from transport. Even if transport emissions are excluded from the analysis, deduction of global N2O emissions from biomass combustion and livestock reduces the balance attributed to cultivated soils to 0.0280 – 0.0420 kg N2O-N/kg N (2.8 – 4.2%) or 0.0440 – 0.0660 kg N2O/kg N.
It must also be pointed out that the apparent contrast with the quoted relationship from IPCC 2006 is incorrect since this refers to direct soil N2O emissions. For proper comparison, it is necessary to use the estimated total (direct plus indirect) soil N2O emissions. The derivation of indirect soil N2O emissions in IPCC 2006 is based on the estimated conversion of N to N2O through volatilisation and leaching/run-off. The calculation of these indirect emissions using the so-called IPCC Tier 1 approach (see below) is described in Appendix A. The outcome of the calculation is that the total soil N2O emissions derived from the IPCC 2006 Tier 1 approach has a likely value of 0.0132 kg N2O-N/kg N (1.3%) or 0.0208 kg N2O/kg N. Hence, the discrepancy is a factor of 2 to 3 and not 3 to 5, as claimed in the paper by Crutzen et al. It should also be noted that the total soil N2O emissions derived from the IPCC 2006 Tier 1 approach has a range of 0.0058 – 0.0348 kg N2O-N/kg N (0.6 -3.5 %) or 0.0091 – 0.0547 kg N2O/kg N. This suggests a slight overlap of the values with those derived in the paper by Crutzen et al.
However, even this conclusion is found to be misleading when the actual approach to estimating soil N2O emissions in IPPC 2006 and subsequent use in LCA studies is examined in proper detail. It needs to be appreciated that three methods for evaluating N2O emissions from cultivated soils treated with N fertiliser are specified in IPCC 2006. These methods are referred to as the Tier 1, Tier 2 and Tier 3 approaches. The Tier 1 approach is the simplest in which a single relationship between soil N2O emissions and N fertiliser application rates is proposed as means for deriving national GHG emissions inventories. Because of its simplicity, it was adopted initially by most countries which ratified the Kyoto Treaty. However, it is recognised that actual soil N2O emissions depend on a number of specific factors including soil and crop type, and past and present climate, land use and cultivation practices. In other words, soil N2O emissions are location specific and can be expected to vary from country to county (indeed, even within countries). In an attempt to accommodate this in an approximate manner, the Tier 2 approach allows location specific values to be incorporated into the simple relationship between soil N2O emissions and the N fertiliser application rate adopted in the Tier 2 approach. Further sophistication is achieved in the Tier 3 approach through the use of actual measurements and models for estimating soil N2O emissions.
Most analysts recognise the simplicity of the Tier 1 approach which enables every country to use the same relationship and, in effect, a universal set of data with actual national N fertiliser application rates to produce results for national GHG emissions inventories. It could be argued that, whilst there is a scientific basis for the Tier 1 approach, it includes an element of political compromise necessary during the
Page 27

development of the Kyoto Protocol and application of the subsequent Treaty. Most analysts also appreciate the limitations of the Tier 1 approach, which were accepted at the time, as a prelude to applying more sophisticated approaches, as represented by Tiers 2 and 3. Indeed, many countries have been collecting relevant data, measuring actual emissions and developing complex models which will enable them to adopt the Tier 2 and Tier 3 approaches in the future. It is quite apparent that this will lead to new estimates for national GHG emissions inventories which will be country specific. Significant variations between countries can be expected as this occurs. There is a growing acceptance that a single, simple relationship with universal data, as reflected in the Tier 1 approach, is no longer valid as a means of estimating soil N2O emissions. However, for the time being the Tier 1 approach is being used until agreed results are produced from developed and validated estimates of soil N2O emissions from the Tier 2 and Tier 3 approaches.
Hence, it could be argued that the evaluation undertaken in the paper by Crutzen et al simply confirms the already-known fact that the IPCC Tier 1 approach has limitations and probably cannot be used to estimate global soil N2O emissions. In effect, the paper by Crutzen at al presents a “top-down” analysis for estimating soil N2O emissions and attempts to reconcile this with a “bottom-up” estimate enshrined within the IPCC Tier 1 approach. From this perspective, it is hardly surprising that a discrepancy arises since, for acceptable accuracy, it would be necessary to determine global soil N2O emissions by aggregating individual estimates, at a country, region or, even, field level, using the IPCC Tier 2 or Tier 3 approaches. However, this does not mean that the conclusions drawn by Crutzen at al on this issue are correct, especially given doubts over their basic assumptions used to derive the contribution of cultivation to the global N2O flux. Instead, it indicates that there is a problem that will have to be addressed by more sophisticated means. These will result in proportionally-different country-by-country soil N2O emissions estimates which, when aggregated, should equal the correctly-established global N2O flux from cultivation.
Unfortunately, having assumed that the “top-down” approach is correct, Crutzen et al attempt to apply this to a rather precursory evaluation of net GHG emissions savings of biofuels. This evaluation is misleading on a number of counts. First, instead of adopting and/or adapting well-established and detailed LCA studies and tools, a highly simplified and selective method is used to determine whether a somewhat limited list of biofuels can reduce total GHG emissions relative to conventional fossil fuels. The list of biofuels is limited to biodiesel from oilseed rape and bioethanol from corn (maize) and sugar cane. It is misleading to take this list as representative of all current biofuels. Second, rather than combine actual N fertiliser application rates with their own relationship for soil N2O emissions, it is assumed that the fixed N content of the biomass from which biofuels are produced can be used as an accurate proxy. It may have been imagined that, by “globalising” the method of estimation in this novel way, the problem of avoiding the need to perform a country-by-country and crop-by-crop analysis can be resolved. However, it is only possible to consider this method by also assuming a global value of 40% for the uptake efficiency of N fertiliser by all crops. Third, the subsequent analysis attempted by Crutzen et al is incomplete because it only considers GHG emissions from the “conversion of biomass to biofuels” plus the “role of N2O (soil) emissions”. It is claimed that the effects of co-product allocation, which are ignored in this analysis, partially compensates for the GHG emissions of all the other stages of biofuel production. Apart from the fact that this assumption is wholly unnecessary if thorough LCA is undertaken, no evidence is offered to support this
Page 28

rather sweeping contention. Taken together, this means that subsequent conclusions about biofuels are wholly unconvincing.
Crutzen et al uses a “top-down” approach to deriving a relationship between soil N2O emissions and N fertiliser application rates. This relies on an incomplete assessment of the global N2O fluxes which are affected by considerable uncertainties. These are ignored to attribute a global N2O flux to cultivation which could, in fact, be an artefact of the method of calculation and its assumptions. Despite this, the resulting relationship is compared with the “bottom-up” approach of IPCC 2006 and an apparent discrepancy is identified. This comparison is also flawed because it only addresses the direct soil N2O emissions derived from the IPCC Tier 1 approach. Additionally, uncertainties, which, by themselves, could account for the discrepancy, are not recognised. Their own relationship between soil N2O emissions and N fertiliser application rates is then applied in an incomplete, partial and selective analysis which cannot be regarded as an acceptable replacement for proper LCA. All-in-all, one layer of dubious assumptions is added on top of further layers of assumptions and combined with unreliable data to form firm and radical conclusions about the potential of biofuels to reduce GHG emissions. Whilst the paper by Crutzen et al does seek to address an important matter, namely the magnitude of soil N2O emissions from the cultivation of crops for the production of biofuels, it cannot be regarded as resolving the problems and assisting the objective evaluation of biofuels.
It is clear that the main problem for estimating the soil N2O emissions from the cultivation of crops for biofuel production results from a lack of adequate knowledge about the N2O cycle. It is equally clear that this problem will only be resolved by adopting actual measurement and sophisticated models, as specified in the IPCC Tier 3 approach, and reconciling the results of these “bottom-up” approaches with reliable estimates of global N2O fluxes. Whilst much work is being conducted and much progress has been made, adequate outcomes are not available yet to incorporate into current LCA studies of biofuels. For the time being, most LCA studies and tools include a simple relationship, based on the IPCC Tier 1 approach, between total (direct plus indirect) soil N2O emissions and N fertiliser application rates (RFA 2008c; DEFRA 2008). The average value is taken to be 0.0208 kg N2O/kg N. However, it is recommended that the maximum range of 0.0091 – 0.0547 kg N2O/kg N in this value should be explored in LCA studies by means of sensitivity analysis. For comprehensive and meaningful assessment, it is also necessary to accommodate the effect of soil N2O emissions of incorporating or removing crop residues, and soil N2O emissions from reference land use (HGCA 2008).
Ideally, soil N2O emissions estimated using the IPCC Tier 3 approach should be adopted in LCA studies when representative measurements and reliable models become available. Whilst it is not possible to pre-empt the effect of this, it is necessary to appreciate one important consequence; the widespread adoption of the IPCC Tier 3 approach will mean that estimated total GHG emissions for biofuels derived from specific crops will vary depending on the location of cultivation. It is likely that national soil N2O emission maps will be required for the future preparation of national GHG emissions inventories and LCA studies of biofuels. Given the potential for large regional and national variations in soil N2O emissions, it is apparent that, from the perspective of net GHG emissions savings, the production of biofuels will be more beneficial in some countries than in others.
Page 29
3 Land Use Changes
3.1 Main Land Use Change Issues There are three elements to this work on land use changes that are addressed here. The first element concerns accessing data on total GHG emissions from changing the use of a given area of land by growing specific biofuel crops and accommodating such emissions into the overall assessment of total GHG emissions associated with the production of subsequent biofuels. This assessment links into the review of GHG emissions of current and future biofuel technologies (see Section 2). The second element relates to the effect of using fallow land for growing biofuel crops, particularly in terms of any forgone carbon sequestration. This is complements the first element which focuses mainly on land which is already cultivated. It should be noted that the way in which this is addressed by those who have been most critical of the negative effect of land use changes on the assessment of biofuels form the basis of the second element. The third element concentrates on effect of different agricultural practices on total GHG emissions associated with biofuel production. Whereas the first two elements take into account changes in land use, the third element incorporates both the land use change effect and the direct and indirect GHG emissions of agricultural inputs. Taken together, these elements should qualify and, where possible, quantify some of the main indirect aspects of total GHG emission assessments for biofuels. In all these elements of work, it has been necessary to limit the global scope due to the timescale and data availability. However, it is felt that the areas chosen within the global scope provides very meaningful contributions on these key land use change issues.
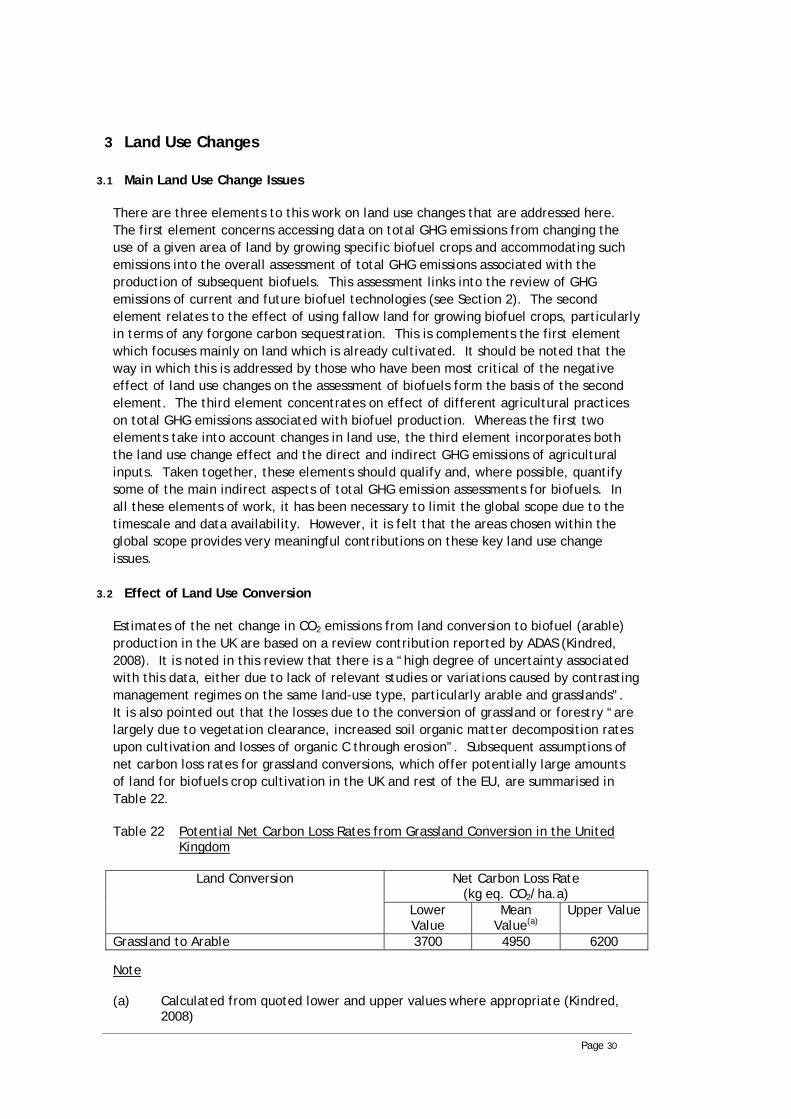
3.2 Effect of Land Use Conversion Estimates of the net change in CO2 emissions from land conversion to biofuel (arable) production in the UK are based on a review contribution reported by ADAS (Kindred, 2008). It is noted in this review that there is a “high degree of uncertainty associated with this data, either due to lack of relevant studies or variations caused by contrasting management regimes on the same land-use type, particularly arable and grasslands”. It is also pointed out that the losses due to the conversion of grassland or forestry “are largely due to vegetation clearance, increased soil organic matter decomposition rates upon cultivation and losses of organic C through erosion”. Subsequent assumptions of net carbon loss rates for grassland conversions, which offer potentially large amounts of land for biofuels crop cultivation in the UK and rest of the EU, are summarised in Table 22.
Table 22 Potential Net Carbon Loss Rates from Grassland Conversion in the United Kingdom
Net Carbon Loss Rate
(kg eq. CO2/ha.a) Land Conversion
Lower Value
Mean Upper Value Value(a)
Grassland to Arable 3700 4950 6200 Note (a) Calculated from quoted lower and upper values where appropriate (Kindred,
2008)
Page 30
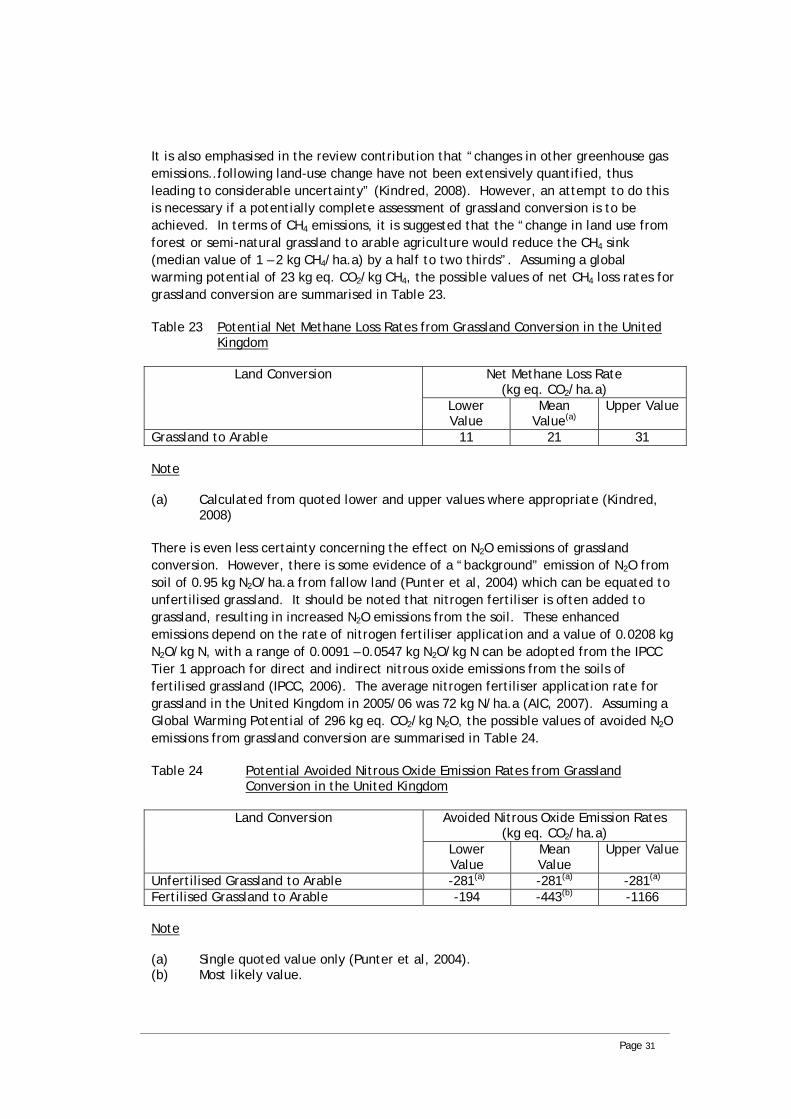
It is also emphasised in the review contribution that “changes in other greenhouse gas emissions…following land-use change have not been extensively quantified, thus leading to considerable uncertainty” (Kindred, 2008). However, an attempt to do this is necessary if a potentially complete assessment of grassland conversion is to be achieved. In terms of CH4 emissions, it is suggested that the “change in land use from forest or semi-natural grassland to arable agriculture would reduce the CH4 sink (median value of 1 – 2 kg CH4/ha.a) by a half to two thirds”. Assuming a global warming potential of 23 kg eq. CO2/kg CH4, the possible values of net CH4 loss rates for grassland conversion are summarised in Table 23.
Table 23 Potential Net Methane Loss Rates from Grassland Conversion in the United Kingdom
Net Methane Loss Rate
(kg eq. CO2/ha.a) Land Conversion
Lower Value
Mean Upper Value Value(a)
Grassland to Arable 11 21 31 Note (a) Calculated from quoted lower and upper values where appropriate (Kindred,
2008) There is even less certainty concerning the effect on N2O emissions of grassland conversion. However, there is some evidence of a “background” emission of N2O from soil of 0.95 kg N2O/ha.a from fallow land (Punter et al, 2004) which can be equated to unfertilised grassland. It should be noted that nitrogen fertiliser is often added to grassland, resulting in increased N2O emissions from the soil. These enhanced emissions depend on the rate of nitrogen fertiliser application and a value of 0.0208 kg N2O/kg N, with a range of 0.0091 – 0.0547 kg N2O/kg N can be adopted from the IPCC Tier 1 approach for direct and indirect nitrous oxide emissions from the soils of fertilised grassland (IPCC, 2006). The average nitrogen fertiliser application rate for grassland in the United Kingdom in 2005/06 was 72 kg N/ha.a (AIC, 2007). Assuming a Global Warming Potential of 296 kg eq. CO2/kg N2O, the possible values of avoided N2O emissions from grassland conversion are summarised in Table 24.
Table 24 Potential Avoided Nitrous Oxide Emission Rates from Grassland Conversion in the United Kingdom
Avoided Nitrous Oxide Emission Rates
(kg eq. CO2/ha.a) Land Conversion
Lower Value
Mean Value
Upper Value
Unfertilised Grassland to Arable -281(a) -281(a) -281(a)
-443(b)Fertilised Grassland to Arable -194 -1166 Note (a) Single quoted value only (Punter et al, 2004). (b) Most likely value.
Page 31

In order to evaluate total N2O emissions, it is necessary to take into account all additional sources of nitrogen. This includes nitrogen from organic sources such as animal manures which are often spread on grassland. However, it is contended that such N2O should not be incorporated into this assessment since emissions from these manures would have occurred regardless of their use as organic fertilisers and any impact should be accounted to the livestock which were responsible for their original production. It should be noted that N2O emissions from soils resulting the cultivation of biofuels are already included in their evaluation (IPCC, 2006). Values for the net change in total GHG emission rates from grassland conversion are summarised in Table 25.
Table 25 Net Change in Total Greenhouse Gas Emission Rates from Grassland
Conversion in the United Kingdom
Net Change in Total Greenhouse Gas Emission Rates
(kg eq. CO2/ha.a)
Land Conversion
Lower Value
Mean Value
Upper Value
Unfertilised Grassland to Arable 3430 4690 5950 Fertilised Grassland to Arable 3517 4528 5065 The resulting effect on the total GHG emission associated with the production of biofuels in the UK on converted unfertilised and fertilised grassland is demonstrated in Tables 26 and 27, respectively. These results indicate that, apart from one specific combination of data for bioethanol production from sugar beet, there are no net benefits from the production of current biofuels on converted grassland, either unfertilised or fertilised, relative to transport fuels derived from conventional fossil fuels. Additionally, it should be noted that the effects of displacing livestock production from such grassland has not been taken into account in this assessment. The overall conclusion from this evaluation is that grassland should not be converted for the production of current biofuels in the UK if it is intended to reduce total GHG emissions.
Table 26 Effect of Unfertilised Grassland Conversion to Biofuels Production in the United Kingdom as a Percentage of Greenhouse Gas Emissions for Fossil Fuels
Percentage of Greenhouse Gas Emissions of Fossil Fuels
(%) Biofuel
Lower Value Mean Value Upper Value Biodiesel from Oilseed Rape
150 182 214
Bioethanol from Wheat Grain
138 159 187
Bioethanol from Sugar Beet
94 106 119
Page 32
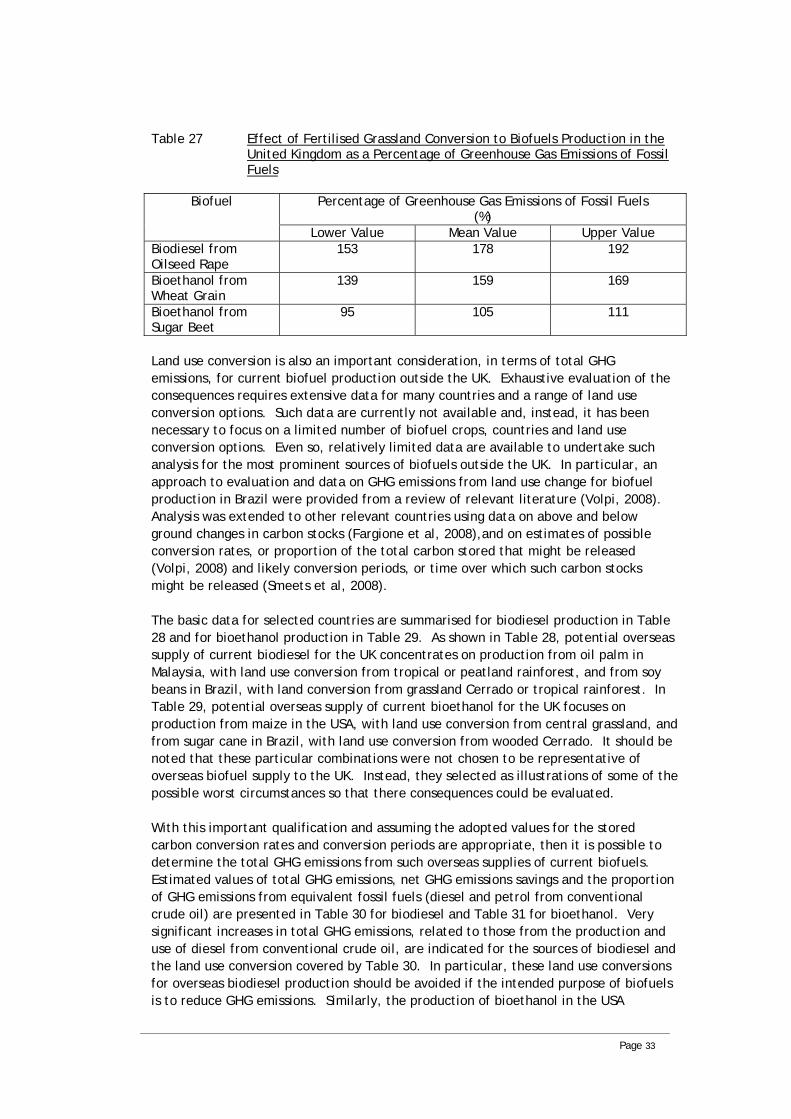
Table 27 Effect of Fertilised Grassland Conversion to Biofuels Production in the United Kingdom as a Percentage of Greenhouse Gas Emissions of Fossil Fuels
Percentage of Greenhouse Gas Emissions of Fossil Fuels
(%) Biofuel
Lower Value Mean Value Upper Value Biodiesel from Oilseed Rape
153 178 192
Bioethanol from Wheat Grain
139 159 169
Bioethanol from Sugar Beet
95 105 111
Land use conversion is also an important consideration, in terms of total GHG emissions, for current biofuel production outside the UK. Exhaustive evaluation of the consequences requires extensive data for many countries and a range of land use conversion options. Such data are currently not available and, instead, it has been necessary to focus on a limited number of biofuel crops, countries and land use conversion options. Even so, relatively limited data are available to undertake such analysis for the most prominent sources of biofuels outside the UK. In particular, an approach to evaluation and data on GHG emissions from land use change for biofuel production in Brazil were provided from a review of relevant literature (Volpi, 2008). Analysis was extended to other relevant countries using data on above and below ground changes in carbon stocks (Fargione et al, 2008),and on estimates of possible conversion rates, or proportion of the total carbon stored that might be released (Volpi, 2008) and likely conversion periods, or time over which such carbon stocks might be released (Smeets et al, 2008).
The basic data for selected countries are summarised for biodiesel production in Table 28 and for bioethanol production in Table 29. As shown in Table 28, potential overseas supply of current biodiesel for the UK concentrates on production from oil palm in Malaysia, with land use conversion from tropical or peatland rainforest, and from soy beans in Brazil, with land conversion from grassland Cerrado or tropical rainforest. In Table 29, potential overseas supply of current bioethanol for the UK focuses on production from maize in the USA, with land use conversion from central grassland, and from sugar cane in Brazil, with land use conversion from wooded Cerrado. It should be noted that these particular combinations were not chosen to be representative of overseas biofuel supply to the UK. Instead, they selected as illustrations of some of the possible worst circumstances so that there consequences could be evaluated.
With this important qualification and assuming the adopted values for the stored carbon conversion rates and conversion periods are appropriate, then it is possible to determine the total GHG emissions from such overseas supplies of current biofuels. Estimated values of total GHG emissions, net GHG emissions savings and the proportion of GHG emissions from equivalent fossil fuels (diesel and petrol from conventional crude oil) are presented in Table 30 for biodiesel and Table 31 for bioethanol. Very significant increases in total GHG emissions, related to those from the production and use of diesel from conventional crude oil, are indicated for the sources of biodiesel and the land use conversion covered by Table 30. In particular, these land use conversions for overseas biodiesel production should be avoided if the intended purpose of biofuels is to reduce GHG emissions. Similarly, the production of bioethanol in the USA
Page 33

following conversion of central grassland should also be avoided, as shown in Table 31. However, a net reduction in GHG emissions is still achieved from the production of bioethanol from sugar cane when the assumed land use conversion is from wooded Cerrado. The results generated here have a direct relevance to the assessment of limits to biofuels imports (see Section 3.5).
Page 34

Table 28 Estimated Total Greenhouse Gas Emission Associated with Land Use Conversion for Biodiesel Production
Above Ground Biomass Below Ground Biomass Biofuel Production Carbon Stored
(t C/ha)
Conversion Rate (%)
Conversion Period
(a)
Carbon Stored
(t C/ha)
Conversion Rate (%)
Conversion Period
(a)
Total Greenhouse Gas Emissions from Land Use
Change (kg eq CO2/t bd)
Biodiesel Production from Oil Palm (Malaysia) – conversion from tropical rainforest
480(a) 100(b) 50(b) 222(a) 10(b) 20(b) 13,598(c)
Biodiesel Production from Oil Palm (Malaysia) – conversion from peatland rainforest
480(a) 100(b) 50(b) 2,972(a) 10(b) 20(b) 31,055(c)
Biodiesel Production from Soy Bean (Brazil) – conversion from grassland Cerrado
10(a) 100(b) 50(b) 75(a) 10(b) 20(b) 5,219(d)
Biodiesel Production from Soy Bean (Brazil) – conversion from tropical rainforest
480(a) 100(b) 50(b) 257(a) 10(b) 20(b) 98.791(d)
Notes (a) Quoted data (Fargione et al, 2008). (b) Implied data (Smeets et al, 2007). (c) Based on a default value of yield of 2.888 t bd/ha.a for Malaysian oil palm (RFA, 2008c). (d) Based on a default value of yield of 0.404 t bd/ha.a for Brazilian soy bean (RFA, 2008c).
Page 35
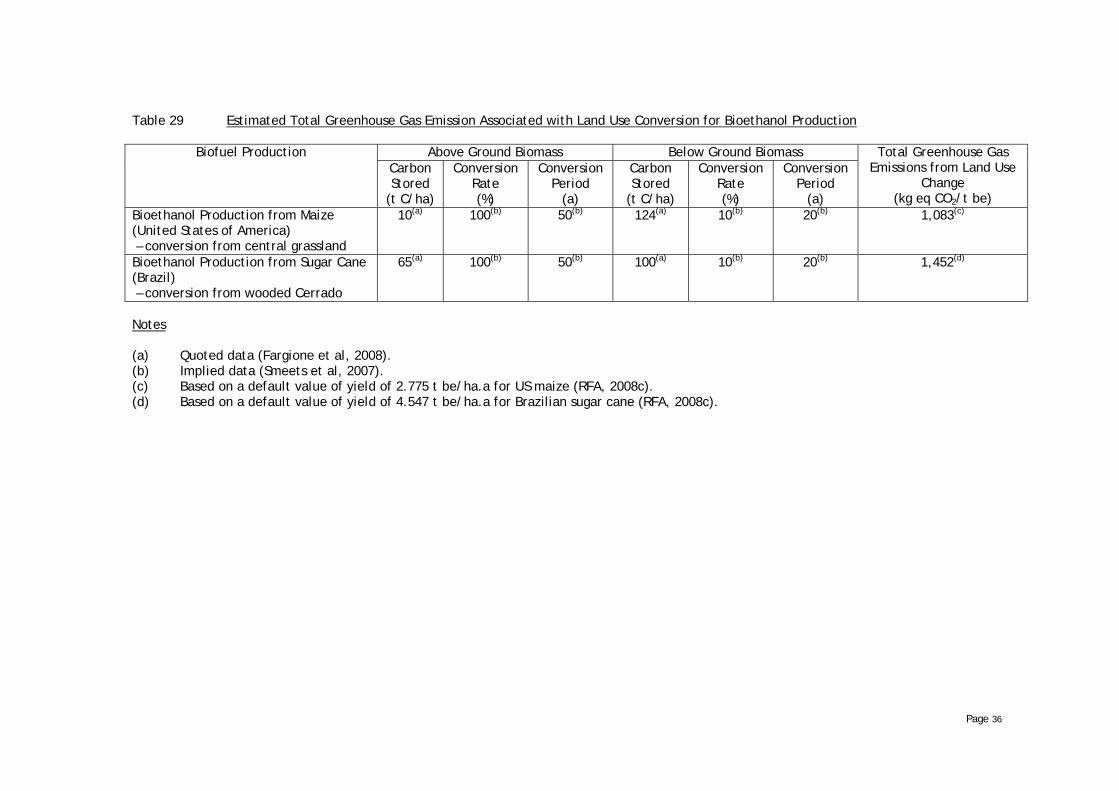
Table 29 Estimated Total Greenhouse Gas Emission Associated with Land Use Conversion for Bioethanol Production
Above Ground Biomass Below Ground Biomass Biofuel Production Carbon Stored
(t C/ha)
Conversion Rate (%)
Conversion Period
(a)
Carbon Stored
(t C/ha)
Conversion Rate (%)
Conversion Period
(a)
Total Greenhouse Gas Emissions from Land Use
Change (kg eq CO2/t be)
Bioethanol Production from Maize (United States of America) – conversion from central grassland
10(a) 100(b) 50(b) 124(a) 10(b) 20(b) 1,083(c)
Bioethanol Production from Sugar Cane (Brazil) – conversion from wooded Cerrado
65(a) 100(b) 50(b) 100(a) 10(b) 20(b) 1,452(d)
Notes (a) Quoted data (Fargione et al, 2008). (b) Implied data (Smeets et al, 2007). (c) Based on a default value of yield of 2.775 t be/ha.a for US maize (RFA, 2008c). (d) Based on a default value of yield of 4.547 t be/ha.a for Brazilian sugar cane (RFA, 2008c).
Page 36

Table 30 Effect of Land Use Conversion on Total Greenhouse Gas Emissions Associated with Overseas Biodiesel Production Using a Selection of Examples
Biofuel Production Total Greenhouse
Gas Emissions (kg eq, CO2/t bd)
Net Greenhouse
Gas Emissions Saving(a)
(%)
Percentage of Greenhouse Gas
Emissions of Fossil Fuels(a)
(%) Biodiesel Production from Oil Palm (Malaysia) – conversion from tropical rainforest
15,340 -379 (net loss)
479
Biodiesel Production from Oil Palm (Malaysia) – conversion from peatland rainforest
32,793 -925 (net loss)
10,252
Biodiesel Production from Soy Bean (Brazil) – conversion from grassland Cerrado
8,200 -156 (net loss)
256
Biodiesel Production from Soy Bean (Brazil)
101,772 -30,811 31,812 (net loss)
– conversion from tropical rainforest Note (a) Assuming a net calorific value for biodiesel of 37.2 MJ/kg (RFA, 2008b) and a
total GHG emissions factor for conventional diesel of 0.086 kg eq. CO2/MJ (RFA, 2008b).
Table 31 Effect of Land Use Conversion on Total Greenhouse Gas Emissions
Associated with Overseas Bioethanol Production Using a Selection of Examples
Biofuel Production Total Greenhouse
Gas Emissions (kg eq, CO2/t be)
Net Greenhouse
Gas Emissions Saving(a)
(%)
Percentage of Greenhouse Gas
Emissions of Fossil Fuels(a)
(%) Bioethanol Production from Maize (United States of America) – conversion from central grassland
3,985 -75 (net loss)
175
Bioethanol Production from Sugar Cane (Brazil)
2,17 7 93 (net saving)
– conversion from wooded Cerrado Note (a) Assuming a net calorific value for bioethanol of 26.8 MJ/kg (RFA, 2008b) and a
total GHG emissions factor for conventional petrol (gasoline) of 0.085 kg eq. CO2/MJ (RFA, 2008b).
Page 37
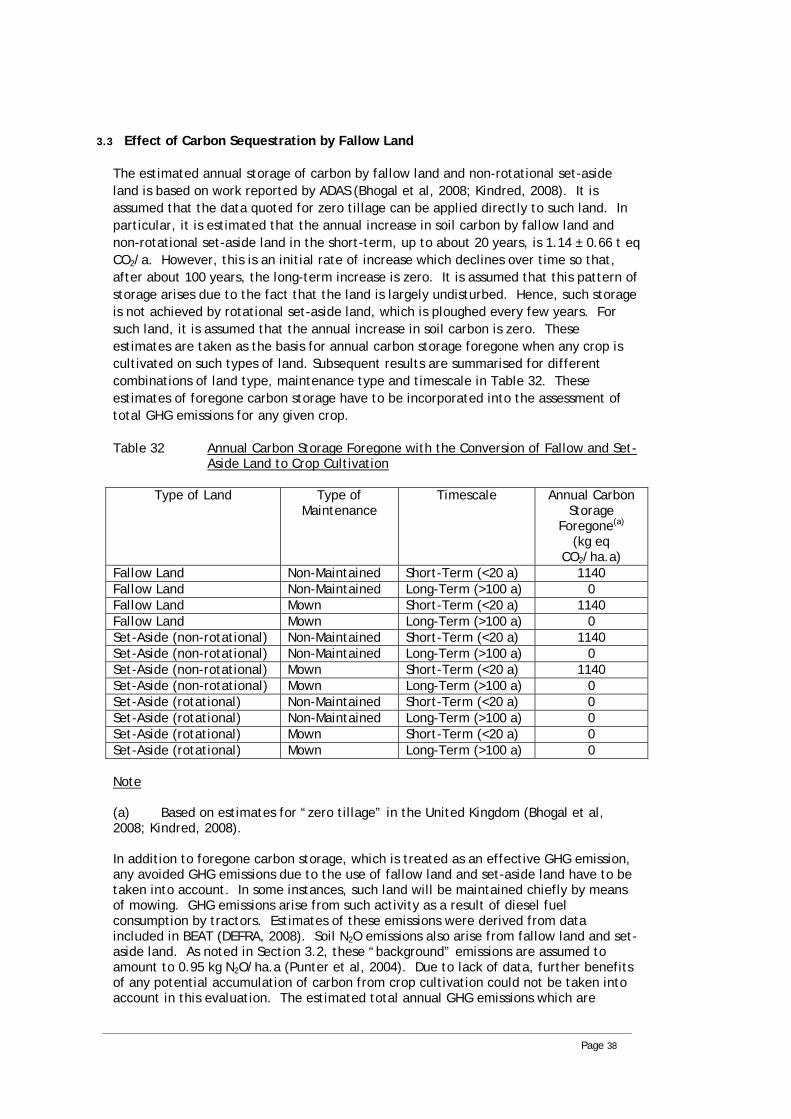
3.3 Effect of Carbon Sequestration by Fallow Land The estimated annual storage of carbon by fallow land and non-rotational set-aside land is based on work reported by ADAS (Bhogal et al, 2008; Kindred, 2008). It is assumed that the data quoted for zero tillage can be applied directly to such land. In particular, it is estimated that the annual increase in soil carbon by fallow land and non-rotational set-aside land in the short-term, up to about 20 years, is 1.14 ± 0.66 t eq CO2/a. However, this is an initial rate of increase which declines over time so that, after about 100 years, the long-term increase is zero. It is assumed that this pattern of storage arises due to the fact that the land is largely undisturbed. Hence, such storage is not achieved by rotational set-aside land, which is ploughed every few years. For such land, it is assumed that the annual increase in soil carbon is zero. These estimates are taken as the basis for annual carbon storage foregone when any crop is cultivated on such types of land. Subsequent results are summarised for different combinations of land type, maintenance type and timescale in Table 32. These estimates of foregone carbon storage have to be incorporated into the assessment of total GHG emissions for any given crop.
Table 32 Annual Carbon Storage Foregone with the Conversion of Fallow and Set-Aside Land to Crop Cultivation
Type of Land Type of
Maintenance Timescale Annual Carbon
Storage Foregone(a)
(kg eq CO2/ha.a)
Fallow Land Non-Maintained Short-Term (<20 a) 1140 Fallow Land Non-Maintained Long-Term (>100 a) 0 Fallow Land Mown Short-Term (<20 a) 1140 Fallow Land Mown Long-Term (>100 a) 0 Set-Aside (non-rotational) Non-Maintained Short-Term (<20 a) 1140 Set-Aside (non-rotational) Non-Maintained Long-Term (>100 a) 0 Set-Aside (non-rotational) Mown Short-Term (<20 a) 1140 Set-Aside (non-rotational) Mown Long-Term (>100 a) 0 Set-Aside (rotational) Non-Maintained Short-Term (<20 a) 0 Set-Aside (rotational) Non-Maintained Long-Term (>100 a) 0 Set-Aside (rotational) Mown Short-Term (<20 a) 0 Set-Aside (rotational) Mown Long-Term (>100 a) 0 Note (a) Based on estimates for “zero tillage” in the United Kingdom (Bhogal et al, 2008; Kindred, 2008). In addition to foregone carbon storage, which is treated as an effective GHG emission, any avoided GHG emissions due to the use of fallow land and set-aside land have to be taken into account. In some instances, such land will be maintained chiefly by means of mowing. GHG emissions arise from such activity as a result of diesel fuel consumption by tractors. Estimates of these emissions were derived from data included in BEAT (DEFRA, 2008). Soil N2O emissions also arise from fallow land and set-aside land. As noted in Section 3.2, these “background” emissions are assumed to amount to 0.95 kg N2O/ha.a (Punter et al, 2004). Due to lack of data, further benefits of any potential accumulation of carbon from crop cultivation could not be taken into account in this evaluation. The estimated total annual GHG emissions which are
Page 38
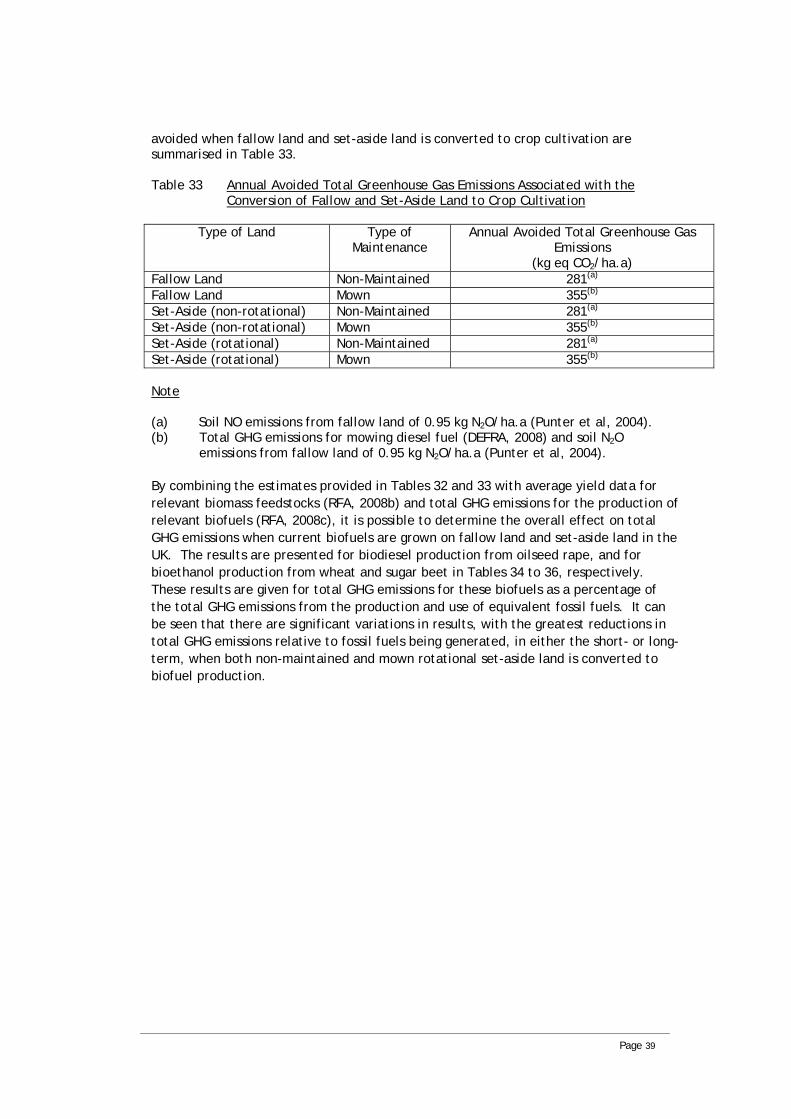
avoided when fallow land and set-aside land is converted to crop cultivation are summarised in Table 33. Table 33 Annual Avoided Total Greenhouse Gas Emissions Associated with the
Conversion of Fallow and Set-Aside Land to Crop Cultivation
Type of Land Type of Maintenance
Annual Avoided Total Greenhouse Gas Emissions
(kg eq CO2/ha.a) Non-Maintained 281(a)Fallow Land Mown 355(b)Fallow Land Non-Maintained 281(a)Set-Aside (non-rotational) Mown 355(b)Set-Aside (non-rotational)
281(a)Set-Aside (rotational) Non-Maintained 355(b)Set-Aside (rotational) Mown
Note (a) Soil NO emissions from fallow land of 0.95 kg N2O/ha.a (Punter et al, 2004). (b) Total GHG emissions for mowing diesel fuel (DEFRA, 2008) and soil N2O
emissions from fallow land of 0.95 kg N2O/ha.a (Punter et al, 2004). By combining the estimates provided in Tables 32 and 33 with average yield data for relevant biomass feedstocks (RFA, 2008b) and total GHG emissions for the production of relevant biofuels (RFA, 2008c), it is possible to determine the overall effect on total GHG emissions when current biofuels are grown on fallow land and set-aside land in the UK. The results are presented for biodiesel production from oilseed rape, and for bioethanol production from wheat and sugar beet in Tables 34 to 36, respectively. These results are given for total GHG emissions for these biofuels as a percentage of the total GHG emissions from the production and use of equivalent fossil fuels. It can be seen that there are significant variations in results, with the greatest reductions in total GHG emissions relative to fossil fuels being generated, in either the short- or long-term, when both non-maintained and mown rotational set-aside land is converted to biofuel production.
Page 39

Table 34 Effect of Fallow and Set-Aside Land Use Conversion Total Greenhouse Gas Emissions Associated with Biodiesel Production from Oilseed Rape in the UK
Type of Land Type of
Maintenance Timescale Percentage of
Greenhouse Gas Emissions
of Fossil Fuels(a)
(%) Fallow Land Non-Maintained Short-Term (<20 a) 86 Fallow Land Non-Maintained Long-Term (>100 a) 57 Fallow Land Mown Short-Term (<20 a) 84 Fallow Land Mown Long-Term (>100 a) 55 Set-Aside (non-rotational) Non-Maintained Short-Term (<20 a) 86 Set-Aside (non-rotational) Non-Maintained Long-Term (>100 a) 57 Set-Aside (non-rotational) Mown Short-Term (<20 a) 84 Set-Aside (non-rotational) Mown Long-Term (>100 a) 55 Set-Aside (rotational) Non-Maintained Short-Term (<20 a) 57 Set-Aside (rotational) Non-Maintained Long-Term (>100 a) 57 Set-Aside (rotational) Mown Short-Term (<20 a) 55 Set-Aside (rotational) Mown Long-Term (>100 a) 55 Note (a) Based on default values for the UK including an equivalent yield of 1.24 t
biodiesel/ha.a (RFA, 2008b), a net calorific value for biodiesel of 37.2 MJ/kg (Mortimer et al, 2003) and a GHG emissions factor for diesel from conventional oil of 0.086 kg eq. CO2/MJ (RFA, 2008b).
Table 35 Effect of Fallow and Set-Aside Land Use Conversion Total Greenhouse Gas
Emissions Associated with Bioethanol Production from Wheat Grain in the UK
Type of Land Type of Maintenance
Timescale Percentage of Greenhouse
Gas Emissions of Fossil Fuels(a)
(%) Fallow Land Non-Maintained Short-Term (<20 a) 88 Fallow Land Non-Maintained Long-Term (>100 a) 66 Fallow Land Mown Short-Term (<20 a) 86 Fallow Land Mown Long-Term (>100 a) 64 Set-Aside (non-rotational) Non-Maintained Short-Term (<20 a) 88 Set-Aside (non-rotational) Non-Maintained Long-Term (>100 a) 66 Set-Aside (non-rotational) Mown Short-Term (<20 a) 86 Set-Aside (non-rotational) Mown Long-Term (>100 a) 64 Set-Aside (rotational) Non-Maintained Short-Term (<20 a) 66 Set-Aside (rotational) Non-Maintained Long-Term (>100 a) 66 Set-Aside (rotational) Mown Short-Term (<20 a) 64 Set-Aside (rotational) Mown Long-Term (>100 a) 64 Note (a) Based on default values for the UK including an equivalent yield of 2.27 t
bioethanol/ha.a (RFA, 2008b), a net calorific value for bioethanol of 26.8 MJ/kg (Elsayed et al, 2003) and a GHG emissions factor for petrol or gasoline from conventional oil of 0.085 kg eq. CO2/MJ (RFA, 2008b).
Page 40
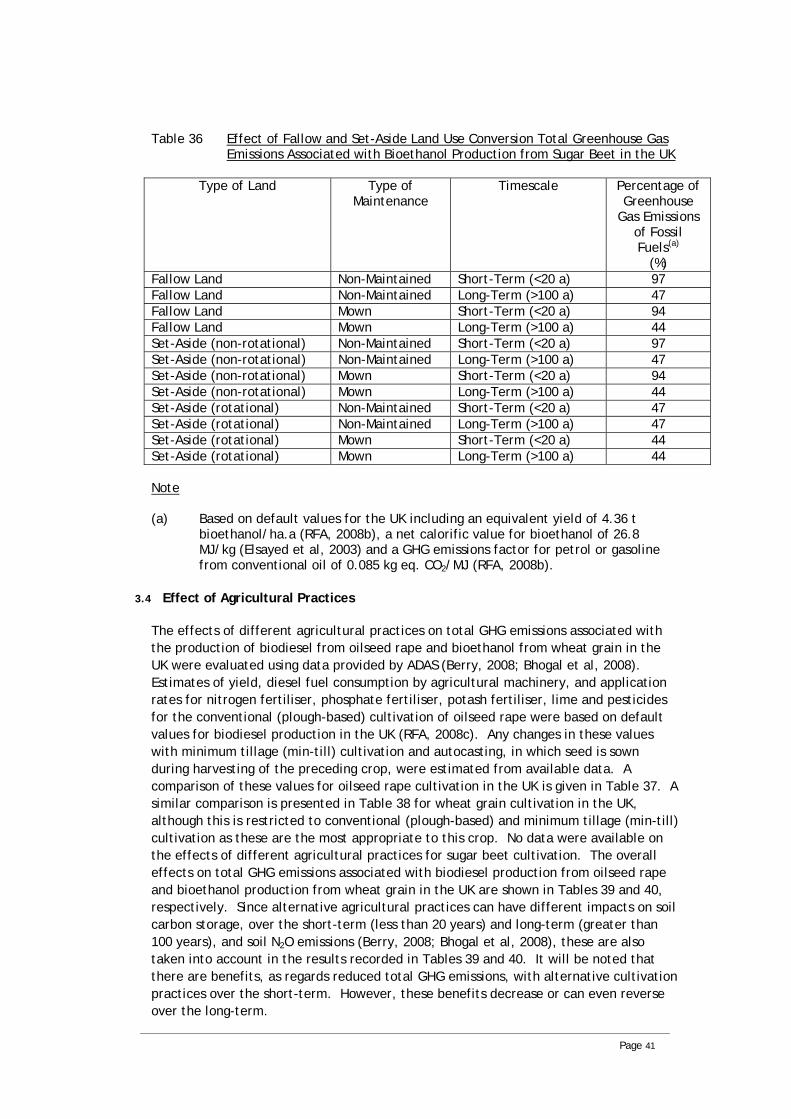
Table 36 Effect of Fallow and Set-Aside Land Use Conversion Total Greenhouse Gas Emissions Associated with Bioethanol Production from Sugar Beet in the UK
Type of Land Type of
Maintenance Timescale Percentage of
Greenhouse Gas Emissions
of Fossil Fuels(a)
(%) Fallow Land Non-Maintained Short-Term (<20 a) 97 Fallow Land Non-Maintained Long-Term (>100 a) 47 Fallow Land Mown Short-Term (<20 a) 94 Fallow Land Mown Long-Term (>100 a) 44 Set-Aside (non-rotational) Non-Maintained Short-Term (<20 a) 97 Set-Aside (non-rotational) Non-Maintained Long-Term (>100 a) 47 Set-Aside (non-rotational) Mown Short-Term (<20 a) 94 Set-Aside (non-rotational) Mown Long-Term (>100 a) 44 Set-Aside (rotational) Non-Maintained Short-Term (<20 a) 47 Set-Aside (rotational) Non-Maintained Long-Term (>100 a) 47 Set-Aside (rotational) Mown Short-Term (<20 a) 44 Set-Aside (rotational) Mown Long-Term (>100 a) 44 Note (a) Based on default values for the UK including an equivalent yield of 4.36 t
bioethanol/ha.a (RFA, 2008b), a net calorific value for bioethanol of 26.8 MJ/kg (Elsayed et al, 2003) and a GHG emissions factor for petrol or gasoline from conventional oil of 0.085 kg eq. CO2/MJ (RFA, 2008b).
3.4 Effect of Agricultural Practices
The effects of different agricultural practices on total GHG emissions associated with the production of biodiesel from oilseed rape and bioethanol from wheat grain in the UK were evaluated using data provided by ADAS (Berry, 2008; Bhogal et al, 2008). Estimates of yield, diesel fuel consumption by agricultural machinery, and application rates for nitrogen fertiliser, phosphate fertiliser, potash fertiliser, lime and pesticides for the conventional (plough-based) cultivation of oilseed rape were based on default values for biodiesel production in the UK (RFA, 2008c). Any changes in these values with minimum tillage (min-till) cultivation and autocasting, in which seed is sown during harvesting of the preceding crop, were estimated from available data. A comparison of these values for oilseed rape cultivation in the UK is given in Table 37. A similar comparison is presented in Table 38 for wheat grain cultivation in the UK, although this is restricted to conventional (plough-based) and minimum tillage (min-till) cultivation as these are the most appropriate to this crop. No data were available on the effects of different agricultural practices for sugar beet cultivation. The overall effects on total GHG emissions associated with biodiesel production from oilseed rape and bioethanol production from wheat grain in the UK are shown in Tables 39 and 40, respectively. Since alternative agricultural practices can have different impacts on soil carbon storage, over the short-term (less than 20 years) and long-term (greater than 100 years), and soil N2O emissions (Berry, 2008; Bhogal et al, 2008), these are also taken into account in the results recorded in Tables 39 and 40. It will be noted that there are benefits, as regards reduced total GHG emissions, with alternative cultivation practices over the short-term. However, these benefits decrease or can even reverse over the long-term.
Page 41

Table 37 Main Parameters for Different Oilseed Rape Cultivation Practices in the United Kingdom Cultivation Practice Yield
(t/ha.a) Moisture Content
(%)
Diesel Fuel Consumption(a)
(l/ha.a)
N Fertiliser Application
Rate (kg N/ha.a)
P Fertiliser Application Rate (kg P2O5/ha.a)
K Fertiliser Application
Rate (kg K2O/ha.a)
Lime Application
Rate (kg
CaCO3/ha.a)
Pesticide Application
Rate(b)
(kg/ha.a)
Conventional (plough-based)
3.03(c) 9.0(c) 66(c) 185(c) 45(c) 48(c) 271(c) 0.28(c)
Minimum Tillage (min-till)
3.03(c, d) 9.0(c) 51(c, e) 185(c, d) 45(c, d) 48(c, d) 271(c, d) 0.28(c)
Autocasting
2.76(f) 9.0(c) 4(g) 185(c, d) 45(c, h) 48(c, h) 271(c, h) 0.56(i)
Notes (a) Assuming a net calorific value for diesel fuel of 35.9 MJ/l (RFA, 2008b). (b) Combination of pesticides, herbicides and fungicides as consistent with the approach in the RFA RTFO default values workbook (RFA, 2008c). (c) Default values from RFA RTFO default values workbook (RFA, 2008c). (d) Suggested same value as conventional (plough-based) cultivation (RFA, 2008c). (e) Assumed to be based on the default value of 2,369 l/ha.a from RFA RTFO default values workbook (RFA, 2008c) reduced pro-rata to 77%
based on the average of 2,413 l/ha.a from quoted values for min-till cultivation of medium/light soil and heavy soil (Berry, 2008) and the average of 3,135 l/ha.a from quoted values for conventional (plough-based) cultivation of medium/light soil and heavy soil (Berry, 2008).
(f) Default value from RFA RTFO default values workbook (RFA, 2008c) less average of three estimates of effect on yields consisting of no change, less 0.2 t/ha.a and 0.6 t/ha.a (Berry, 2008).
(g) Quoted vale for min-till cultivation of medium/light and heavy soils (Berry, 2008). (h) Assumed to be same value as conventional (plough-based) cultivation (Berry, 2008). (i) Know to be increased relative to conventional (plough-based) cultivation (Berry, 2008) and assumed to be double this as an approximation.
Page 42

Table 38 Main Parameters for Different Wheat Cultivation Practices in the United Kingdom Cultivation Practice Yield
(t/ha.a) Moisture Content
(%)
Diesel Fuel Consumption(a)
(l/ha.a)
N Fertiliser Application
Rate (kg N/ha.a)
P Fertiliser Application Rate (kg P2O5/ha.a)
K Fertiliser Application
Rate (kg K2O/ha.a)
Lime Application
Rate (kg
CaCO3/ha.a)
Pesticide Application
Rate(b)
(kg/ha.a)
Conventional (plough-based)
7.76(c) 15.0(c) 141(c) 183(c) 40(c) 45(c) 363(c) 0.38(c)
Minimum Tillage (min till)
7.76(c, d) 15.0(c) 109(e) 183(c) 40(d) 45(d) 363(d) 0.38(d)
Notes (a) Assuming a net calorific value for diesel fuel of 35.9 MJ/l (RFA, 2008b). (b) Combination of pesticides, herbicides and fungicides as consistent with the approach in the RFA RTFO default values workbook (RFA, 2008c). (c) Default values from RFA RTFO default values workbook (RFA, 2008c). (d) Suggested same value as conventional (plough-based) cultivation (Berry, 2008). (e) Assumed to be based on the default value of 5,062 l/ha.a from RFA RTFO default values workbook (RFA, 2008c) reduced pro-rata to 77%
based on the average of 2,413 l/ha.a from quoted values for min-till cultivation of medium/light soil and heavy soil (Berry, 2008) and the average of 3,135 l/ha.a from quoted values for conventional (plough-based) cultivation of medium/light soil and heavy soil (Berry, 2008).
Page 43
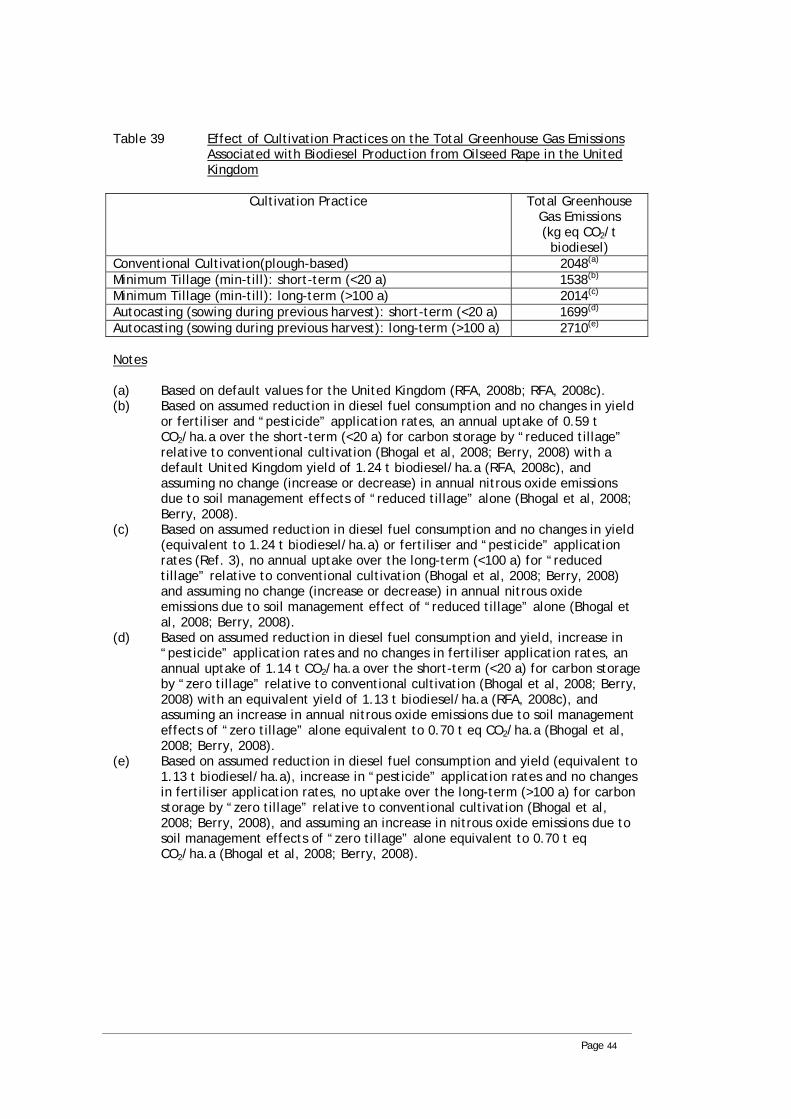
Table 39 Effect of Cultivation Practices on the Total Greenhouse Gas Emissions Associated with Biodiesel Production from Oilseed Rape in the United Kingdom
Cultivation Practice Total Greenhouse
Gas Emissions (kg eq CO2/t
biodiesel) Conventional Cultivation(plough-based) 2048(a)
1538(b)Minimum Tillage (min-till): short-term (<20 a) 2014(c)Minimum Tillage (min-till): long-term (>100 a) 1699(d)Autocasting (sowing during previous harvest): short-term (<20 a) 2710(e)Autocasting (sowing during previous harvest): long-term (>100 a)
Notes (a) Based on default values for the United Kingdom (RFA, 2008b; RFA, 2008c). (b) Based on assumed reduction in diesel fuel consumption and no changes in yield
or fertiliser and “pesticide” application rates, an annual uptake of 0.59 t CO2/ha.a over the short-term (<20 a) for carbon storage by “reduced tillage” relative to conventional cultivation (Bhogal et al, 2008; Berry, 2008) with a default United Kingdom yield of 1.24 t biodiesel/ha.a (RFA, 2008c), and assuming no change (increase or decrease) in annual nitrous oxide emissions due to soil management effects of “reduced tillage” alone (Bhogal et al, 2008; Berry, 2008).
(c) Based on assumed reduction in diesel fuel consumption and no changes in yield (equivalent to 1.24 t biodiesel/ha.a) or fertiliser and “pesticide” application rates (Ref. 3), no annual uptake over the long-term (<100 a) for “reduced tillage” relative to conventional cultivation (Bhogal et al, 2008; Berry, 2008) and assuming no change (increase or decrease) in annual nitrous oxide emissions due to soil management effect of “reduced tillage” alone (Bhogal et al, 2008; Berry, 2008).
(d) Based on assumed reduction in diesel fuel consumption and yield, increase in “pesticide” application rates and no changes in fertiliser application rates, an annual uptake of 1.14 t CO2/ha.a over the short-term (<20 a) for carbon storage by “zero tillage” relative to conventional cultivation (Bhogal et al, 2008; Berry, 2008) with an equivalent yield of 1.13 t biodiesel/ha.a (RFA, 2008c), and assuming an increase in annual nitrous oxide emissions due to soil management effects of “zero tillage” alone equivalent to 0.70 t eq CO2/ha.a (Bhogal et al, 2008; Berry, 2008).
(e) Based on assumed reduction in diesel fuel consumption and yield (equivalent to 1.13 t biodiesel/ha.a), increase in “pesticide” application rates and no changes in fertiliser application rates, no uptake over the long-term (>100 a) for carbon storage by “zero tillage” relative to conventional cultivation (Bhogal et al, 2008; Berry, 2008), and assuming an increase in nitrous oxide emissions due to soil management effects of “zero tillage” alone equivalent to 0.70 t eq CO2/ha.a (Bhogal et al, 2008; Berry, 2008).
Page 44
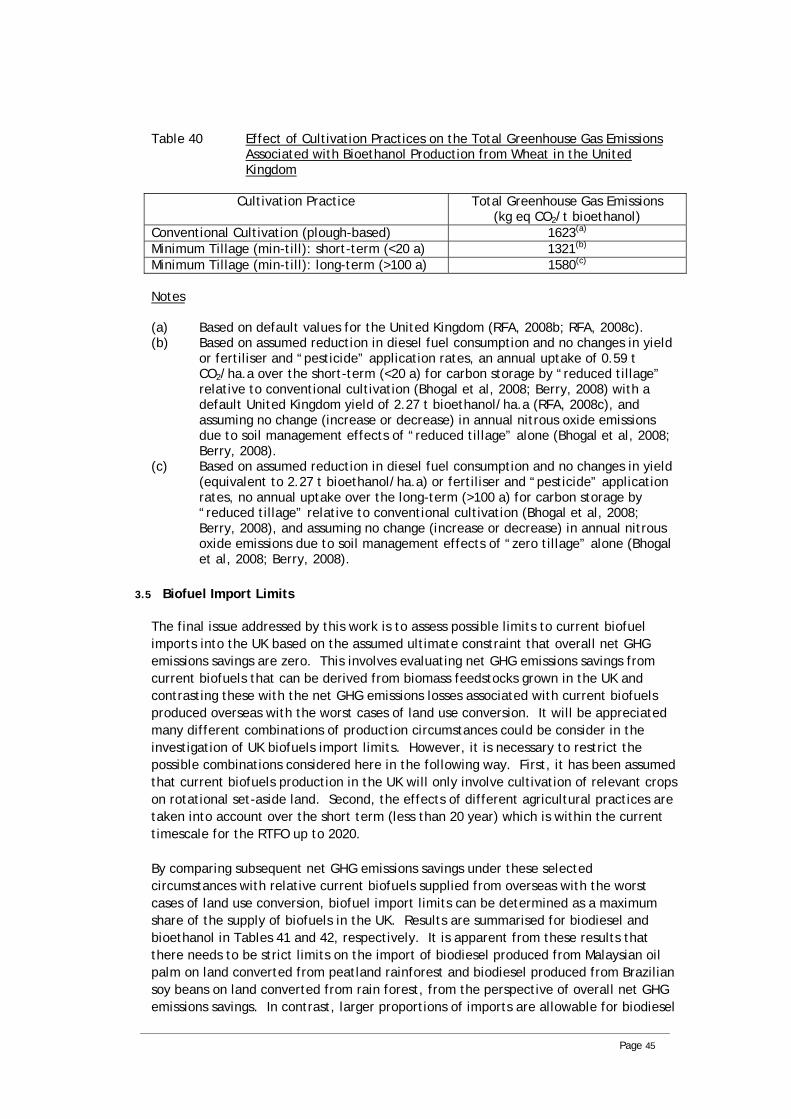
Table 40 Effect of Cultivation Practices on the Total Greenhouse Gas Emissions Associated with Bioethanol Production from Wheat in the United Kingdom
Cultivation Practice Total Greenhouse Gas Emissions
(kg eq CO2/t bioethanol) 1623(a)Conventional Cultivation (plough-based) 1321(b)Minimum Tillage (min-till): short-term (<20 a) 1580(c)Minimum Tillage (min-till): long-term (>100 a)
Notes (a) Based on default values for the United Kingdom (RFA, 2008b; RFA, 2008c). (b) Based on assumed reduction in diesel fuel consumption and no changes in yield
or fertiliser and “pesticide” application rates, an annual uptake of 0.59 t CO2/ha.a over the short-term (<20 a) for carbon storage by “reduced tillage” relative to conventional cultivation (Bhogal et al, 2008; Berry, 2008) with a default United Kingdom yield of 2.27 t bioethanol/ha.a (RFA, 2008c), and assuming no change (increase or decrease) in annual nitrous oxide emissions due to soil management effects of “reduced tillage” alone (Bhogal et al, 2008; Berry, 2008).
(c) Based on assumed reduction in diesel fuel consumption and no changes in yield (equivalent to 2.27 t bioethanol/ha.a) or fertiliser and “pesticide” application rates, no annual uptake over the long-term (>100 a) for carbon storage by “reduced tillage” relative to conventional cultivation (Bhogal et al, 2008; Berry, 2008), and assuming no change (increase or decrease) in annual nitrous oxide emissions due to soil management effects of “zero tillage” alone (Bhogal et al, 2008; Berry, 2008).
3.5 Biofuel Import Limits
The final issue addressed by this work is to assess possible limits to current biofuel imports into the UK based on the assumed ultimate constraint that overall net GHG emissions savings are zero. This involves evaluating net GHG emissions savings from current biofuels that can be derived from biomass feedstocks grown in the UK and contrasting these with the net GHG emissions losses associated with current biofuels produced overseas with the worst cases of land use conversion. It will be appreciated many different combinations of production circumstances could be consider in the investigation of UK biofuels import limits. However, it is necessary to restrict the possible combinations considered here in the following way. First, it has been assumed that current biofuels production in the UK will only involve cultivation of relevant crops on rotational set-aside land. Second, the effects of different agricultural practices are taken into account over the short term (less than 20 year) which is within the current timescale for the RTFO up to 2020.
By comparing subsequent net GHG emissions savings under these selected circumstances with relative current biofuels supplied from overseas with the worst cases of land use conversion, biofuel import limits can be determined as a maximum share of the supply of biofuels in the UK. Results are summarised for biodiesel and bioethanol in Tables 41 and 42, respectively. It is apparent from these results that there needs to be strict limits on the import of biodiesel produced from Malaysian oil palm on land converted from peatland rainforest and biodiesel produced from Brazilian soy beans on land converted from rain forest, from the perspective of overall net GHG emissions savings. In contrast, larger proportions of imports are allowable for biodiesel
Page 45
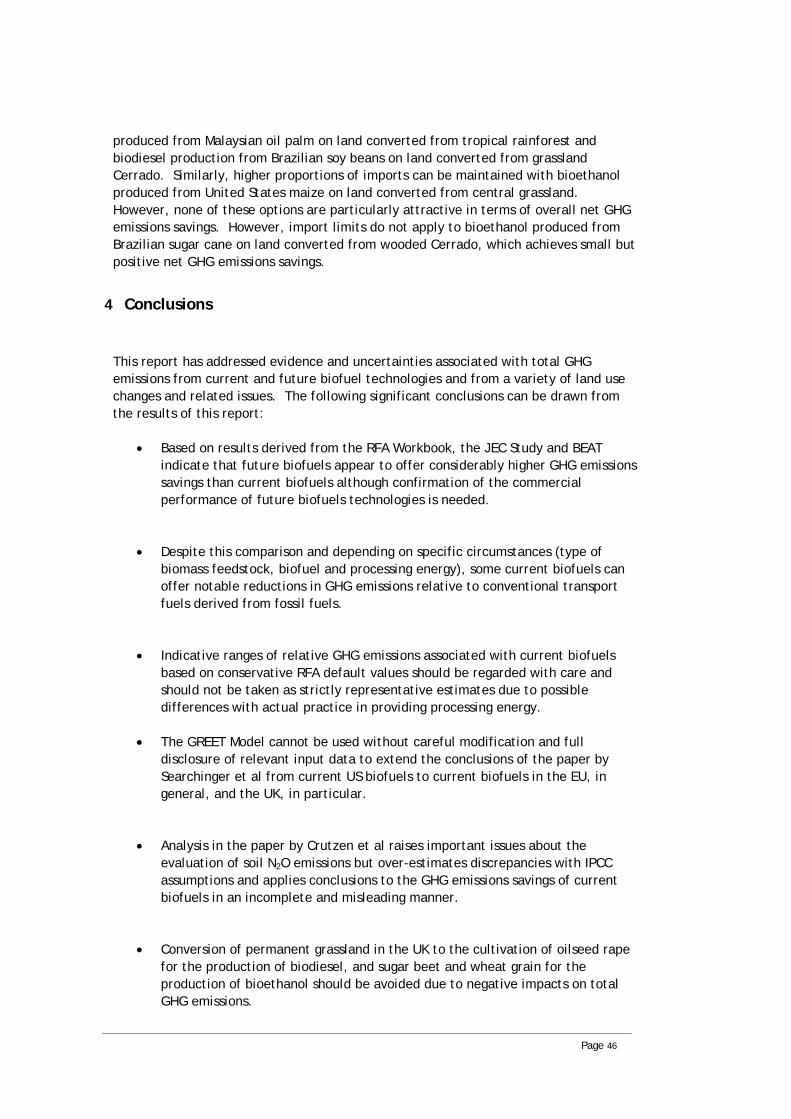
produced from Malaysian oil palm on land converted from tropical rainforest and biodiesel production from Brazilian soy beans on land converted from grassland Cerrado. Similarly, higher proportions of imports can be maintained with bioethanol produced from United States maize on land converted from central grassland. However, none of these options are particularly attractive in terms of overall net GHG emissions savings. However, import limits do not apply to bioethanol produced from Brazilian sugar cane on land converted from wooded Cerrado, which achieves small but positive net GHG emissions savings.
4 Conclusions
This report has addressed evidence and uncertainties associated with total GHG emissions from current and future biofuel technologies and from a variety of land use changes and related issues. The following significant conclusions can be drawn from the results of this report:
• Based on results derived from the RFA Workbook, the JEC Study and BEAT indicate that future biofuels appear to offer considerably higher GHG emissions savings than current biofuels although confirmation of the commercial performance of future biofuels technologies is needed.
• Despite this comparison and depending on specific circumstances (type of biomass feedstock, biofuel and processing energy), some current biofuels can offer notable reductions in GHG emissions relative to conventional transport fuels derived from fossil fuels.
• Indicative ranges of relative GHG emissions associated with current biofuels based on conservative RFA default values should be regarded with care and should not be taken as strictly representative estimates due to possible differences with actual practice in providing processing energy.
• The GREET Model cannot be used without careful modification and full disclosure of relevant input data to extend the conclusions of the paper by Searchinger et al from current US biofuels to current biofuels in the EU, in general, and the UK, in particular.
• Analysis in the paper by Crutzen et al raises important issues about the evaluation of soil N2O emissions but over-estimates discrepancies with IPCC assumptions and applies conclusions to the GHG emissions savings of current biofuels in an incomplete and misleading manner.
• Conversion of permanent grassland in the UK to the cultivation of oilseed rape for the production of biodiesel, and sugar beet and wheat grain for the production of bioethanol should be avoided due to negative impacts on total GHG emissions.
Page 46
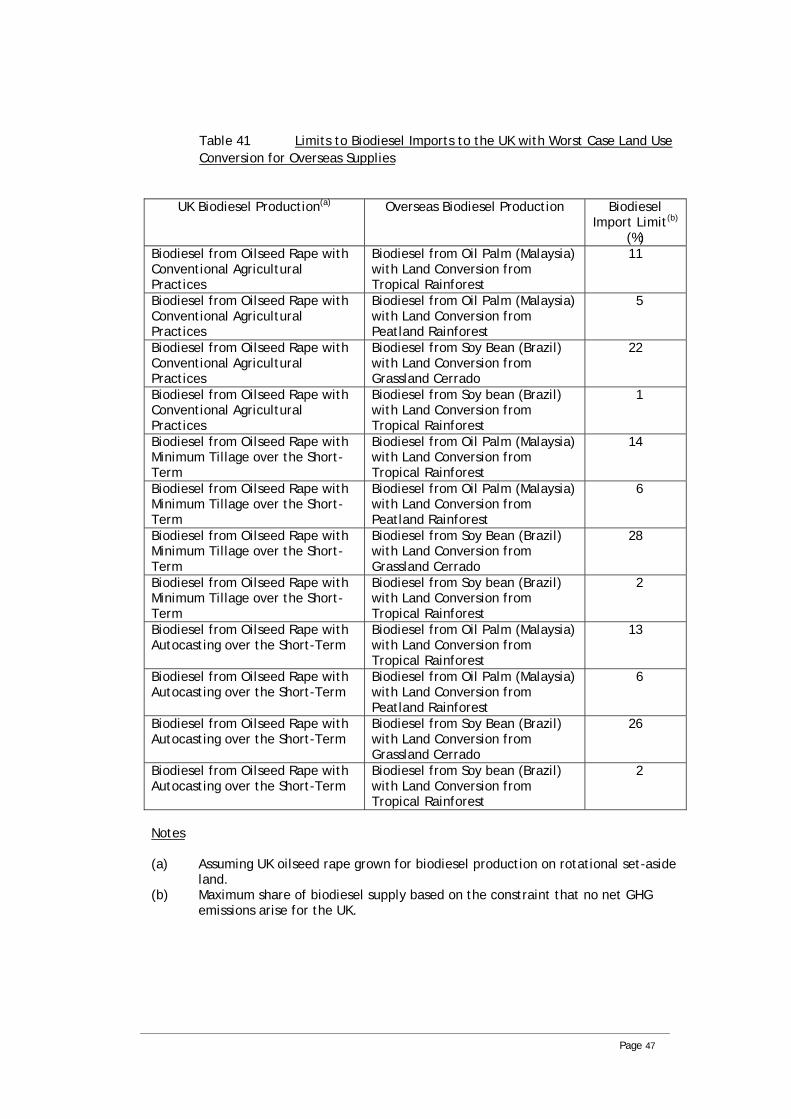
Table 41 Limits to Biodiesel Imports to the UK with Worst Case Land Use Conversion for Overseas Supplies
UK Biodiesel Production(a) Overseas Biodiesel Production Biodiesel
Import Limit(b)
(%) Biodiesel from Oilseed Rape with Conventional Agricultural Practices
Biodiesel from Oil Palm (Malaysia) with Land Conversion from Tropical Rainforest
11
Biodiesel from Oilseed Rape with Conventional Agricultural Practices
Biodiesel from Oil Palm (Malaysia) with Land Conversion from Peatland Rainforest
5
Biodiesel from Oilseed Rape with Conventional Agricultural Practices
Biodiesel from Soy Bean (Brazil) with Land Conversion from Grassland Cerrado
22
Biodiesel from Oilseed Rape with Conventional Agricultural Practices
Biodiesel from Soy bean (Brazil) with Land Conversion from Tropical Rainforest
1
Biodiesel from Oilseed Rape with Minimum Tillage over the Short-Term
Biodiesel from Oil Palm (Malaysia) with Land Conversion from Tropical Rainforest
14
Biodiesel from Oilseed Rape with Minimum Tillage over the Short-Term
Biodiesel from Oil Palm (Malaysia) with Land Conversion from Peatland Rainforest
6
Biodiesel from Oilseed Rape with Minimum Tillage over the Short-Term
Biodiesel from Soy Bean (Brazil) with Land Conversion from Grassland Cerrado
28
Biodiesel from Oilseed Rape with Minimum Tillage over the Short-Term
Biodiesel from Soy bean (Brazil) with Land Conversion from Tropical Rainforest
2
Biodiesel from Oilseed Rape with Autocasting over the Short-Term
Biodiesel from Oil Palm (Malaysia) with Land Conversion from Tropical Rainforest
13
Biodiesel from Oilseed Rape with Autocasting over the Short-Term
Biodiesel from Oil Palm (Malaysia) with Land Conversion from Peatland Rainforest
6
Biodiesel from Oilseed Rape with Autocasting over the Short-Term
Biodiesel from Soy Bean (Brazil) with Land Conversion from Grassland Cerrado
26
Biodiesel from Oilseed Rape with Autocasting over the Short-Term
Biodiesel from Soy bean (Brazil) with Land Conversion from Tropical Rainforest
2
Notes (a) Assuming UK oilseed rape grown for biodiesel production on rotational set-aside
land. (b) Maximum share of biodiesel supply based on the constraint that no net GHG
emissions arise for the UK.
Page 47

Table 42 Limits to Bioethanol Imports to the UK with Worst Case Land Use Conversion for Overseas Supplies
UK Bioethanol Production(a) Overseas Bioethanol Production Bioethanol
Import Limit(b)
(%) Bioethanol from Wheat Grain with Conventional Agricultural Practices
Bioethanol from Maize (USA) with Land Conversion from Central Grassland
32
Bioethanol from Wheat Grain with Minimum Tillage over the Short-Term
Bioethanol from Maize (USA) with Land Conversion from Central Grassland
39
Bioethanol from Sugar Beet with Conventional Agricultural Practices
Bioethanol from Maize (USA) with Land Conversion from Central Grassland
37
Notes (a) Assuming UK wheat grain and sugar beet for bioethanol grown on rotational set-
aside land. (b) Maximum share of bioethanol supply based on the constraint that no net GHG
emissions arise for the UK.
• Conversion of Cerrado (grassland and wooded), rainforest (peatland and tropical) and permanent grassland should be avoided in most countries for the cultivation of biomass feedstock for current biofuel production, although small net GHG emissions savings can still be achieved for bioethanol production from Brazilian sugar cane grown on land converted from wooded Cerrado
• Although net GHG emissions savings can be achieved from the production of all current biofuels (biodiesel from oilseed rape, and bioethanol from sugar beet and wheat grain) on former fallow and set-aside land in the UK, the greatest benefits arise from using maintained or non-maintained rotational set-aside land over either the short (<20 a) or long (>100 a) terms.
• There is potential for improving net GHG emissions savings of current biofuels in the UK by using different agricultural practices, especially minimum tillage over the short-term (<20 a) for the production of biodiesel from oilseed rape and bioethanol from wheat grain).
• Assuming that the ultimate constraint on biofuel imports to the UK is that overall net GHG emissions savings are zero, strict limits can be identified for importing certain biofuels that are grown on land converted from rainforest (peatland and tropical) and grassland in specific countries.
Page 48

ANNEX A Evaluation of Total Soil N2O Emissions with the IPCC Tier 1 Approach
Using the Tier 1 approach outlined in IPCC 2006, the direct soil N2O emissions from the application of N fertiliser has a likely value of 0.0100 kg N2O-N/kg N (1.0%) or 0.0157 kg N2O/kg N, and a range of 0.0030 – 0.0300 kg N2O-N/kg N (0.3 – 3.0%) or 0.0047 – 0.0470 kg N2O/kg N (IPCC 2006, Table 11.1).
Indirect soil N2O emissions are assumed to arise from volatilisation and leaching/run-off. The pathway to N2O from the atmospheric deposition of N through volatilisation involves the conversion of ammonia (NH3) and oxides of nitrogen (NOx). The IPCC 2006 Tier 1 approach assumes that the amount of N2O emitted indirectly through volatilisation depends on the product of the fraction of N fertiliser that volatilises as NH3 and NOx and the emissions factor for N2O emissions from the atmospheric deposition of N on soils (IPCC 2006, Equation 11.9). The fraction of N fertiliser that volatilises as NH3 and NOx has a likely value of 10% and a range of 3 – 30% (IPCC 2006, Table 11.3). The emissions factor for N2O emissions from the atmospheric deposition of N on soils has a likely value of 0.0100 kg N2O-N/kg N and a range of 0.0020 – 0.0500 kg N2O-N/kg N (IPCC 2006, Table 11.1). This results in indirect soil N2O emissions from volatilisation with a likely value of 0.0010 kg N2O-N/kg N (0.1%) or 0.0016 kg N2O/kg N, and a range of 0.0001 – 0.0055 kg N2O-N/kg N6 (0.01 – 0.55%) or 0.0002 – 0.0086 kg N2O/kg N.
The IPCC 2006 Tier 1 approach assumes that the amount of N2O emitted indirectly through leaching/run-off depends on the product of the fraction of N fertiliser that leaches or runs off and the emissions factor for N2O emissions from such leaching and run-off (IPCC 2006, Equation 11.10). The fraction of N fertiliser that leaches or runs off has a likely value of 30% and a range of 10 – 80% (IPCC 2006, Table 11.3). The emissions factor for N2O emissions from leaching and run-off has a likely value of 0.0075 kg N2O-N/kg N and a range of 0.0005 – 0.0250 kg N2O-N/kg N (IPCC 2006, Table 11.3). This results in indirect soil N2O emissions from leaching/run-off with a likely value of 0.0023 kg N2O-N/kg N (0.23%) or 0.0035 kg N2O/kg N, and a range of 0.0004 – 0.0088 kg N2O-N/kg N (0.04 – 0.88%) or 0.0006 – 0.0138 kg N2O/kg N.
Consequently, the total soil N2O emissions using the IPCC 2006 Tier approach has a likely value of 0.01325 kg N2O-N/kg N (1.33%) or 0.0208 kg N2O/kg N, and a range of 0.0058 – 0.0348 kg N2O-N/kg N (0.58 -3.48 %) or 0.0091 – 0.0547 kg N2O/kg N.
2 In order to derive estimated ranges in all the following, it is assumed that the ranges given in IPCC 2006 for the values of individual factors represent skewed or log-normal frequency distributions, that lower and upper standard deviations can be derived from the quoted likely values and ranges of values of these factors, and that standard propagation of errors routines can be applied to these lower and upper standard deviations.
Page 49

REFERENCES AIC (2007) “UK Fertiliser Statistics 2007” Agricultural Industries Confederation, Peterborough, United Kingdom, October 2007. ANL (2007) “Operating Manual for GREET: Version 1.7” prepared by Center for Transportation Research, Argonne National Laboratory, United States of America, revised February 2007, http://www.transportation.anl.gov/pdfs/TA/353.pdf. Berry, P. (2008) “Direct and Indirect Effects of Cultivations on GHG Emissions Associated with Crop Production” ADAS, United Kingdom, April 2008. Bhogal, A., Chambers, B. J., Whitmore, A. P., and Powlson, D. S., (2008) “The Effects of Reduced Tillage Practices and Organic Material Additions on the Carbon Content of Arable Soils” Summary Report for DEFRA Project SP0561, Department for Environment, Food and Rural Affairs, London, United Kingdom. Brinkman, N., Wang, M., Weber, T, and Darlington, T. (2005) “Well-to-Wheels Analysis of Advanced Fuel/Vehicle Systems — A North American Study of Energy Use, Greenhouse Gas Emissions, and Criteria Pollutant Emissions” May 2005. CARB (2003) “EMFAC2002 Motor Vehicle Emission Factor Model for Use in the State of California”, California Air Resources Board, Sacramento, United States of America. Crutzen, P. J., Mosier, A. R., Smith, K. A., and Winiwarter, W. (2007) “ N2O Release from Agro-Biofuel Production Negates Global Warming Reduction by Replacing Fossil Fuels” Atmospheric Chemistry and Physics Discussions, Vol. 7, pp. 11191 – 11205, www.atmos-chem-phys-discuss.net/11191/2007, 1 August 2007. DEFRA (2007) “Biomass Environmental Assessment Tool Version 2: User’s Manual” by J. Bates and S. Simmonds of the AEA Group for the Department for Environment, Food and Rural Affairs, London United Kingdom, 17 October 2007. DEFRA (2008) “Biomass Environmental Assessment Tool, Version 2.0” prepared by AEA Group plc and North Energy Associates Ltd for Department for Environment, Food and Rural Affairs, London, United Kingdom. EC (2008) “Proposal for a Directive of the European Parliament and of the Council on the Promotion of the Use of Energy from Renewable Sources”, Version 15.4, Commission of the European Communities, Brussels, Belgium. Elsayed, M. A., Matthews, R., and Mortimer, N. D. (2003) “Carbon and Energy Balances for a Range of Biofuels Options” Resources Research Unit of Sheffield Hallam University under Project No. B/B/00784/REP (URN 03/836) for the Department for Trade and Industry, London, United Kingdom, March 2003. EPA (2006) “MOBILE6 Vehicle Emission Modeling Software” United States Environmental Protection Agency, Washington DC, United States of America. Fargione, J., Hill, J., Tilman, D., Polasky, S., and Hawthorne, P. (2008) “Land Clearing and the Biofuel Carbon Debt” Sciencexpress, www.sciencexpress.org, 7 February 2008. HCGA (2008) “Understanding and Managing Uncertainties to Improve Biofuel GHG Emissions Calculations” by D. Kindred, N. Mortimer, R. Sylvester-Bradley, G. Brown and J. Woods, Home Grown Cereals Authority, London, 11 April 2008.
Page 50
IPCC (2006) “Inter-governmental Panel on Climate Change Guidelines for National Greenhouse Gas Inventories; Volume 4, Chapter 11: N2O Emissions from Managed Soils, and CO2 Emissions from Lime and Urea Application” by H. S. Eggleston, L. Buendia, K. Miwa, T. Hgara and K. Tanabe, IGES, Hayama, Japan. ISO (2006) "Environmental Management – Life Cycle Assessment – Principles and Framework" BS EN ISO 14040, British Standards Institution, London, United Kingdom. JEC (2007) “Well-to-Wheels Analysis of Future Automotive Fuels and Powertrains in the European Context: Well-to-Tank Report, Version 2c, WTT Appendix 1 – Description of Individual Processes and Detailed Input Data” Joint Research Centre, Ispra, Italy, www.ies.jrc.ec.europa.eu/WTW, March 2007. Kindred, D. (2008) “Effect of Land-Use Change: Total Greenhouse Gas Emissions from Land Use Change in the UK and EU” ADAS, United Kingdom, April 2008. Mortimer, N. D., Cormack, P., Elsayed. M. A., and Horne. R. E. (2003) “Evaluation of the Comparative Energy, Global Warming and Socio-Economic Costs and Benefits of Biodiesel” Resources Research Unit, Sheffield Hallam University under Contract Ref. No. CSA 5982/NF0422 for the Department for Environment, Food and Rural Affairs, London, United Kingdom, January 2003. Punter, G., Rickeard. D., Larivé, J.-F., Edwards, R., Mortimer, N. D., Horne, R. E., Bauen, A., and Woods, J. (2004) “Well-to-Wheel Evaluation for Production of Ethanol from Wheat” Report FWG-P-04-024 for the Low Carbon Vehicle Partnership, London, United Kingdom, October 2004, p. 40. RFA (2008a) “Carbon and Sustainability Reporting within the Renewable Transport Fuel Obligation: Technical Guidance Part 1” Office of the Renewable Fuels Agency, London, United Kingdom. RFA (2008b) “Carbon and Sustainability Reporting within the Renewable Transport Fuel Obligation: Technical Guidance Part 2 Carbon Reporting – Default Values and Fuel Chains” Version 1.2, Office of the Renewable Fuels Agency, London, United Kingdom, March 2008. RFA (2008c) “RFA RTFO Default Values.xls” E4Tech, London, United Kingdom, April 2008. Searchinger, T., Heimlich, R., Houghton, R., Dong, F., Elobeid, A., Fabiosa, J., Tokgoz, S., Hayes, D., and Yu, T. (2008) “Use of US Croplands for Biofuels Increases Greenhouse Gases Through Emissions from Land Use Change” Sciencexpress, www.sciencexpress.org, 29 February 2008, Vol. 319, No. 5867, pp. 1238 – 1240. Smeets, E., Junginger, M., Faaij, A., Walter, A., Dolzan, P., and Turkenburg, W. (2008) “The Sustainability of Brazilian Ethanol – An Assessment of the Possibilities of Certified Production”, Biomass and Bioenergy, in press. Volpi, G. (2008) “A Quick Review on Greenhouse Gas Emissions from Land Use Change in Brazil Resulting from Biofuels” Brussels, Belgium.
Page 51