supply chain services and solutions - tapa-apac.org · bsi supply chain services and solutions ......
TRANSCRIPT

1
Supply Chain Services and Solutions
BSI Risk Management and Intelligence Approach
Emmanuel Herve
Copyright © 2016 BSI. All rights reserved.

2
Objectives
• Introduction
• Supply Chain Concerns and Risks
• Supply Chain Risk Exposure and Evaluation Network (SCREEN)
Overview
• Cargo Theft
• Supply chain disruptions
3Copyright © 2015 BSI. All rights reserved.
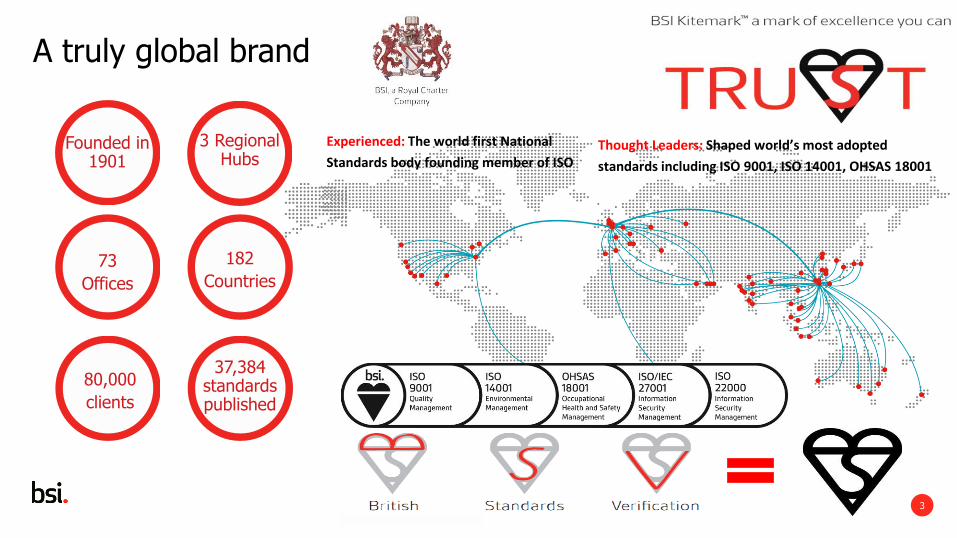
Founded in 1901
3 Regional Hubs
73
Offices
182
Countries
A truly global brand
80,000
clients
37,384 standards published
Experienced: The world first National
Standards body founding member of ISOThought Leaders: Shaped world’s most adopted
standards including ISO 9001, ISO 14001, OHSAS 18001
4
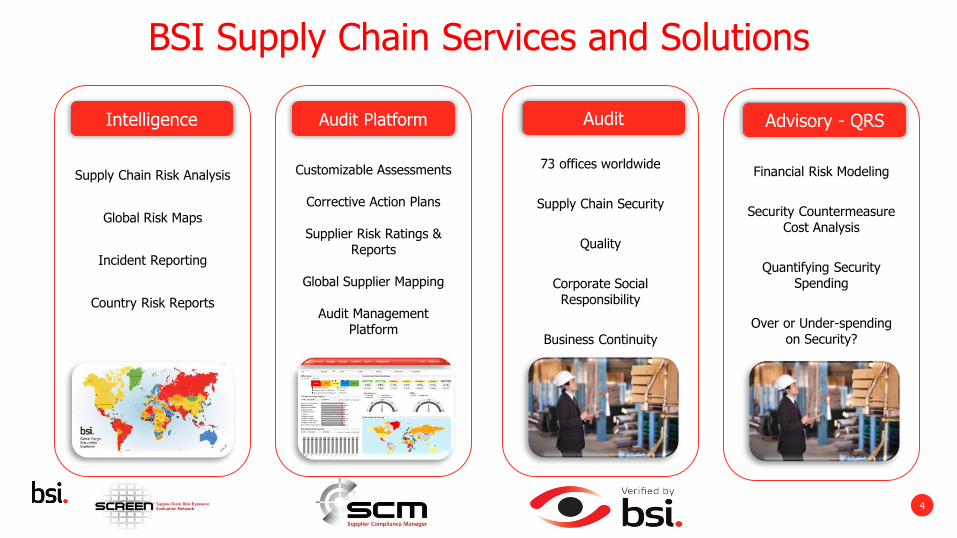
BSI Supply Chain Services and Solutions
Supply Chain Risk Analysis
Global Risk Maps
Incident Reporting
Country Risk Reports
Customizable Assessments
Corrective Action Plans
Supplier Risk Ratings & Reports
Global Supplier Mapping
Audit Management Platform
73 offices worldwide
Supply Chain Security
Quality
Corporate Social Responsibility
Business Continuity
Intelligence Audit Platform Audit
Financial Risk Modeling
Security Countermeasure Cost Analysis
Quantifying Security Spending
Over or Under-spending on Security?
Advisory - QRS

5
Government Partnerships - INTELLIGENCE
For 6 years, BSI Supply Chain Solutions has been the one source used by Department for Homeland Security (DHS), CBP, and AEO for supply chain and cargo risk intelligence
• BSI provides annual security and threat awareness training to the government as well as specialized reports around specific supply chain incidents and trends
Canada CBSA and PIP program uses BSI intelligence to quantify risk and BSI provides supply chain security and exposure training to PIP officers
BSI Intelligence is used in over 40 countries by U.S. Customs Attaché officers including 80% of AEO countries (including Japan)
UK Freight Crime Police Division – data sharing agreement and co-reporting
Copyright © 2015 BSI. All rights reserved

6
TAPA EMEA and BSI – Audit Risk Management Platform
• TAPA Member Company locations seeking certification will be uploaded into the TAPA EMEA audit report tool, provided by BSI
• TAPA will send a self-certification assessment (FSR C 2014 or TSR 3 2014) to Member Companies through the TAPA EMEA audit report tool, provided by BSI
• TAPA Member Companies will complete the self-certification assessment and waiver process through the TAPA EMEA audit report tool, provided by BSI
• Automated management and facilitation of results
• Tracking of completion progress and macro collation of data will be easier and more streamlined through the TAPA EMEA audit report tool, provided by BSI

7
Today’s Risks
In the Global Supply Chain

Copyright © 2013 BSI. All rights reserved. 8
Top Global Supply Chain Concerns
41.4%
56.1%48.8%
68.3%
53.7%
36.6%
46.3%
2.4%
0.0%
50.0%
100.0%
SocialResponsibilities
Brand protectionincluding
counterfeiting,intellectual property
rights &unmanifested cargo
Governmentcompliance
including C-TPAT,AEO, PIP
Supplier riskassessment
Business continuity(including naturaldisasters, labor
strikes/portoutages)
Political Instability Financial risksincluding cargo
thefts, counterfeits,insurance increasesas well as transport
security costs
Other (specify)
What Are Your Top Supply Chain Concerns?
Survey of 310 C-TPAT, PIP or AEO Certified Companies

Copyright © 2013 BSI. All rights reserved. 9
Top Global Supply Chain Concerns

Copyright © 2013 BSI. All rights reserved. 10
SecurityComplianceGovernment Compliance to include C-TPAT, PIP and AEO
• Keeping goods moving efficiently across borders is more important than ever
• Compliance with government programs is a business necessity, not a nice to have
• Managing programs are time and manpower intensive
• Unverified supplier information could lead to loss of government certifications

Copyright © 2013 BSI. All rights reserved. 11
In-TransitRiskDirect result of theft, insurance increases, transport security costs and counterfeit goods entering the global supply chain
• The weakest point in the supply chain – while freight is moving
• The use of a legitimate supply chain to introduce contraband, people or harmful materials
• Chain of Custody is very important
• Know your contractors and subcontractors
Copyright © 2013 BSI. All rights reserved. 12
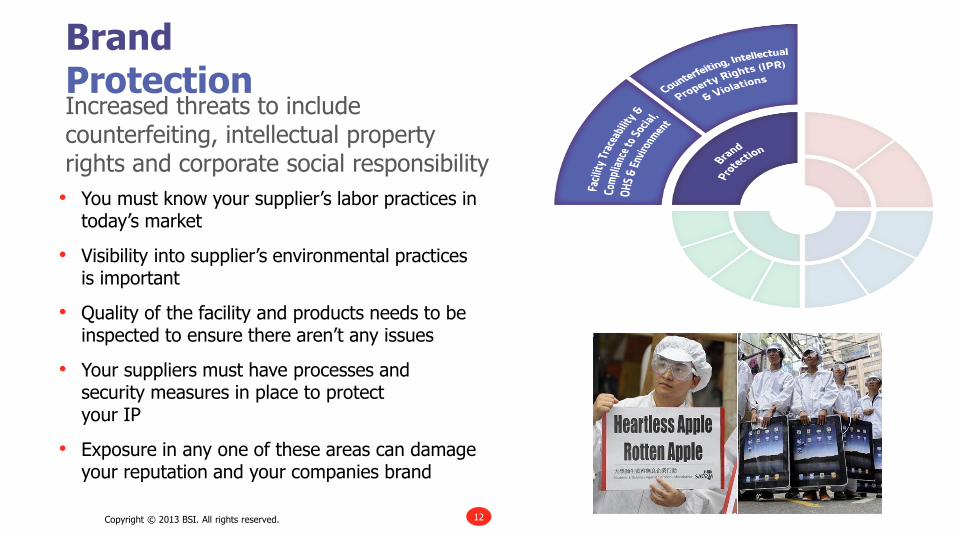
BrandProtectionIncreased threats to include counterfeiting, intellectual property rights and corporate social responsibility
• You must know your supplier’s labor practices in today’s market
• Visibility into supplier’s environmental practices is important
• Quality of the facility and products needs to be inspected to ensure there aren’t any issues
• Your suppliers must have processes and security measures in place to protectyour IP
• Exposure in any one of these areas can damage your reputation and your companies brand
Copyright © 2013 BSI. All rights reserved. 13
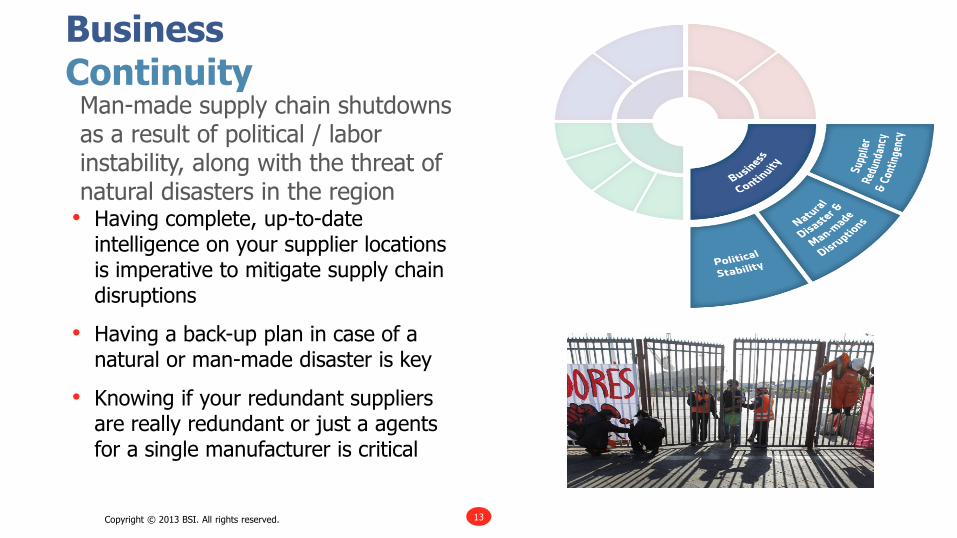
BusinessContinuityMan-made supply chain shutdowns as a result of political / labor instability, along with the threat of natural disasters in the region• Having complete, up-to-date
intelligence on your supplier locations is imperative to mitigate supply chain disruptions
• Having a back-up plan in case of a natural or man-made disaster is key
• Knowing if your redundant suppliers are really redundant or just a agents for a single manufacturer is critical

14
Supply Chain Security
Risk Management Best Practice Approach
Copyright © 2016 BSI. All rights reserved.

15
Reasons to Model Risk
Can we safely spend less?
Can we spend better?
SPENDING
LO
SS
ES
We need to spend more

16
Avoid the Security Spending Pendulum
High losses,increase spending
Low losses,pull spending
Acceptable losses,
Efficient security
ReactiveReactive
Proactive responses to predictable risks

17
BSI’s Supply Chain Risk Management Framework – Smart Resource Allocation
This integrated supply chain risk management solution in delivered in three distinct
risk components
Company Business Risk
Variablesi.e- critical commodity,
high spend with supplier, high volume
of transport
Compliance with TAPA TSR/FSR Standards
Probability Vulnerability Impact Risk Index
Likelihood of supply chain disruption events occurring in your global operations
How vulnerable are you to an event happening due to policy/procedural compliance
How consequential would the event be to your business if it happened in your supply chain?

18
Probability of Disruption
BSI SCREEN Country Risk Intelligence
Copyright © 2016 BSI. All rights reserved.

19
• BSI combines a variety of risk factors, quantifies them, and produces threat ratings for 203 countries
• Countries are rated on a five-panel scale
Low
Guarded
Elevated
High
Severe
• Intelligence is gathered from a wide range of sources:
Proprietary incident database
Information from auditors around the world
In-depth analysis and synthesis of local news sources
Information from governments, NGOs, and industry
• A dedicated team of analysts is constantly updating and refining our intelligence, making sure our risk ratings reflect the situation on the ground
SCREEN-Supply Chain Risk Exposure Evaluation Network

20
Security Business Continuity Social Responsibility – Human Rights
Environmental
Cargo Disruption Natural Disaster Exposure
Overall Human Rights Overall Environment
Cargo Theft Business Impact of Natural Disaster
Child Labour Air Pollution
Hijacking Political Stability Women’s Rights CO2 Emissions
Illicit Smuggling Social Unrest Discrimination Water Pollution
Counterfeiting Economic and Financial Stability
Working Conditions Stringency of regulations
Supply Chain Terrorism Man-made Disruption-strikes, labour unrest
Freedom of Association/Collective
Bargaining
Enforcement of Regulations
Sea Piracy Civil Liberties
Political Rights
BSI Proprietary Geographic Risk Intelligence Components
BSI Country Intelligence

21
© COPYRIGHT BSI 2016

22
Cargo Theft Trends in Malaysia
Copyright © 2016 BSI. All rights reserved.

23
Malaysia – Cargo Theft Trends
• Threat of cargo theft in Malaysia remains , but new data suggest a downward
trend
• Both median and average loss values have seen significant reductions
• Mirrors trend of overall crime rate, which has dropped by as much as 13 percent, according to Royal Police
• Law enforcement efforts are helping improve security situation for cargo transporters
• Includes task forces designed to combat organized criminal groups and vehicle theft (includes cargo and personal vehicles)
• Country still lacks task forces specifically focused on reducing cargo theft
Police in Malaysia recover a stolen cargo truck

24
Malaysia – Cargo Theft Trends
• Average and median theft values declined into 2015
• 2014: $198,600 (median); $234,059 (avg.)
• 2015: $53,800 (median); $74,389 (avg.)
• BSI also notes increasing diversity among commonly targeted goods
• Movement away from electronic goods thefts
• Base metals, consumer goods, and food and beverage items continue to be targeted
• Other causes of downward-trending risk include
• Lower-value commodities being increasingly targeted, suggesting diversification in targeted goods
• Reduction of Mamak Gang and other organized groups’ role in Malaysian cargo theft

25
Cargo Theft in Malaysia
• Reduced cargo-related activity by Mamak Gang members likely contributor
• Multiple deaths and arrests of gang members
• Remaining Mamak Gang members appear engaged in non-cargo crimes
• Theft of luxury personal vehicles
• Bank robberies
• Some pharmacy robberies
• No evidence to suggest pharmacy robberies will transition to targeting of pharmaceutical cargo shipments

26
Cargo Theft Trends in Indonesia
Copyright © 2016 BSI. All rights reserved.

27
Cargo Theft Trends in Indonesia
• The risk of cargo theft in Indonesia remains
• Cargo trucks targeted for most thefts, though warehouses increasingly targeted
• Hijackings remain a concern, particularly for West Java province
• Data from past two years show a shift towards a more even distribution among modalities
• Warehouses targeted in more than 23% of thefts over past two years; BSI rarely recorded warehouse thefts prior to 2014

28
Warehouse Thefts in Indonesia
• BSI has noted a distinct rise in the number of warehouses being targeted for theft
• Commodities targeted in warehouse thefts largely mirror overall cargo theft trends in Indonesia
• Agricultural products and other food items most commonly targeted (36%)
• Industrial goods also heavily targeted (27%)
• Warehouse thefts often small in scope and value (avg. loss value is $26,790)

29
Cargo Theft Trends in China
Copyright © 2016 BSI. All rights reserved.

30
Moving Truck Thefts in China
• BSI has recorded a number of thefts from moving trucks throughout China
• Most prominently in Guangdong Province
• Known locally as “kaitianchuang” (开天窗) – “open sunroof thefts”
• Soft-sided trailers are targeted more often
• Hole is usually cut on top rather than opening from the back as seen in other countries
• Electronics and pharmaceuticals have both been targeted in these thefts

31
Cargo Theft in Guangdong Province
• Guangdong Province is one of the few places BSI sees thefts by highly-organized cargo theft gangs
• High-risk highways
• G4 (JingGang’Ao) highway between Huadu and Shaoguan north of Guangzhou
• G45 highway north of Guangzhou
• More thefts occur during the summer
• Jurisdictional issues harm investigations

32
Cargo Theft Trends in India
Copyright © 2016 BSI. All rights reserved.

33
India – Cargo Theft Increasing in Sophistication
• BSI has recorded a rise in sophisticated cargo theft techniques over the past two years
• Threat of cargo theft in India is
• Theft groups targeting shipments after customs seals placed on container, prior to container reaching port
• Shipments diverted to group-controlled warehouses where paneling is removed
• Customs seals often left intact, delaying discovery until after shipment reaches customer
• First instance of a theft from a moving truck in July

34
India – Cargo Theft Increasing in Sophistication
• Occurrence has been geographically dispersed – New Delhi, Navi Mumbai, and Chennai
• Supply chain employees integral parts of these criminal groups
• Multiple high-profile cases of supply chain employee thefts in 2016
• Implications for cargo integrity:
• Incidents underscore gaps in security and tampering detection in India
• Ability to counterweight consignments exposes capacity for UMC introduction into export shipments
• Criminals’ ability to break into shipments without breaking customs seal poses major UMC risk due to seeming legitimacy/verification of shipments
• Background security checks a must for supply chain employees/contractors

35
Terrorism and the Supply Chain
Copyright © 2016 BSI. All rights reserved.

36
Copyright © 2016 BSI. All rights reserved.

37
Terrorist Extortion of the Supply Chain
• Leading groups for supply chain terrorism attacks are also most likely to extort or exploit the supply chain
• Groups often perpetrate attacks to threaten or intimidate businesses into paying extortion fees
• Extortion can increase as revenue from other sources declines
ISIS tax on trucks reached as high as $4,000 per vehicle in 2015, up from $200 in 2014
• Revenue from the extortion of local businesses is a major financing source for terrorist groups
• Other supply chain concerns• Contraband introductions
• Smuggling for supplies, revenue
February 2016 case in Spain
• Hijacking and cargo theft
Group Supply Chain Exploitation TacticSupply Chain Terrorism
Attacks (2006-15)
FARCExtortion, Kidnapping, Illegal taxes, Drug
smuggling
New People’s Army Extortion
ISIS Extortion, Kidnapping, Illegal taxes
PKK Extortion, Hijacking, Drug smuggling
MEND Kidnapping
AQAP Explosives introduction, Oil smuggling
Communist Party of India - Maoist
Kidnapping, Cargo Theft
Leading Supply Chain Terrorism Groups Often Exploit the Supply Chain

38
Increasing Terrorism Risk to Commercial Supply Chains
• Terrorists targeted a wider range of industries and cargo transport modalities in 2015 than any other recent year
• Increased targeting of industries associated with private/corporate supply chains rather than state-owned infrastructure since 2013
• Agriculture/food and beverage attacks more than tripled
• Attacks on industrial/manufacturing materials and pharmaceuticals more than doubled, metals nearly doubled
• Portion of fossil fuels targeted dropped from 75% to 51%
• Decline in previous hotspots for targeting of government supply chain
• One cargo truck attack in Afghanistan in 2015 compared to average of nearly four annually over past decade
0
50
100
150
200
250
300
2013 2014 2015
Fossil Fuels/Minerals Agriculture/Food and Beverage Industrial/Manufacturing Materials
Base Metals Pharmaceuticals/Chemical
0
50
100
150
200
2013 2014 2015
Pipeline Production/Processing Facility Truck Storage Facility Worker
Leading Industries and Modalities Targeted for Supply Chain Terrorism Attacks (2013-15)

39
Increased Terrorist Targeting of the Supply Chain
• Supply chain terrorism activity increased by virtually every metric in 2015-16
• Proportion of supply chain terrorism attacks grew 16% from 2014
• Geographic distribution increased 38% to a record of 33 countries
• Top 10 countries for supply chain terrorism exported $664 billion• $96 billion exported to the United States
• Highlights significant volume of international trade at risk of disruption by terrorist groups
40
Asia
Factory Labor Unrest
Copyright © 2016 BSI. All rights reserved.

41
Labor Unrest in China –Q2 2016 Update
• Major protest in Dongguan in late May highlighted increasing concern of protests over factory closures and relocations
• Portion of relocation-related factory strikes in China has increased significantly over the past year
• Absolute number of strikes over relocation issues has also risen dramatically
• Protest numbers likely to continue rising as operational costs in China escalate
Copyright © 2016 BSI. All rights reserved.
Factory Strikes in China by Grievance2013-2015 Average
Relocation
Wage Arrears
Other Grievance
Factory Strikes in China by Grievance2016 (YTD)
Relocation
Wage Arrears
Other Grievance

42
-15%
-10%
-5%
0%
5%
10%
15%
20%
25%
30%
35%
2013 2014 2015
Growth in FDI and Wages in Cambodia
Foreign Direct Investment Growth Minimum Wage Growth
Factory Unrest in Asia
• Other countries in Asia have witnessed protests over grievances seen in China
• Timely payment of wages, factory closures, and contract employment vs. physical working conditions, higher pay
• Most demonstrations in the garment manufacturing industry
• Cambodia• Recent protests over factory closures
• Industry representatives blame closures on rising operational costs, especially increasing wage rates
• Bangladesh• Officials identified nearly 360 factories ‘vulnerable’ to
protests over wage non-payment, holiday bonuses
• Likely an increasing concern as factory investment continues rising in these areas
Copyright © 2016 BSI. All rights reserved.
43
Vulnerability and Compliance
Infusion of Probability with TAPA standards
Copyright © 2016 BSI. All rights reserved.

44
Strategic Program Design with Operational Program Toolbox
An integrated approach to managing organizational risk, adhering to compliance objectives & instilling knowledge
Business ImpactVariables
Business Specific Components
Volume of Throughput
Criticality of Commodity
Security countermeasure spend
% of site production on site
Social Responsibility
Environment
Supply Chain Corruption
Political Stability
Cargo Theft
Counterfeiting
Supply Chain Terrorism
Natural Disaster Exposure
Legal Compliance
Ethical Trading
Hijacking
Illicit Smuggling
TAPA FSR/TSR
Standards
Logistics Security
Site Security
Physical Access Controls
Personnel Security
IT Security
Questions are weighted
Probability Vulnerability Impact Risk Index
45
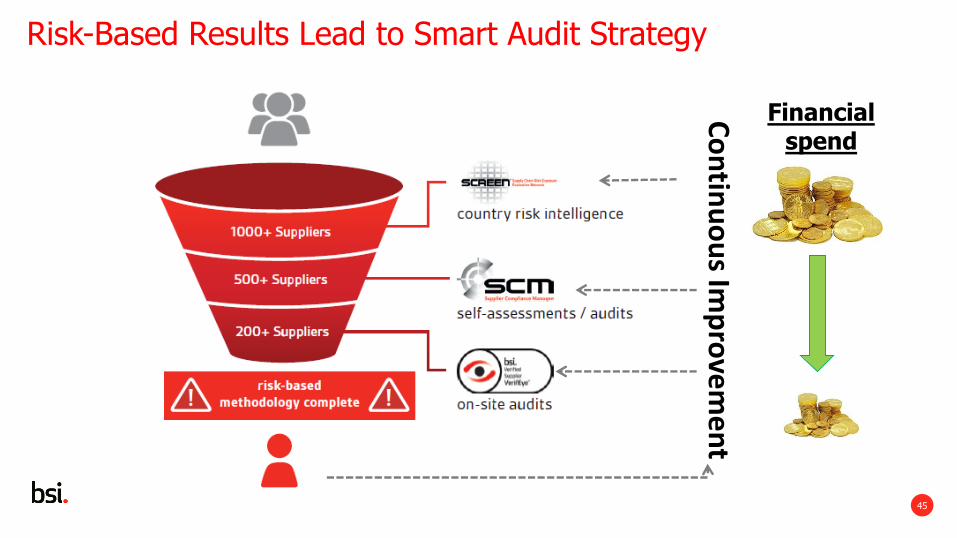
Financial spend
Risk-Based Results Lead to Smart Audit Strategy
Co
ntin
uo
us Im
pro
vem
en
t

46
Contact Information
Emmanuel Herve
BSI Supply Chain Services and Solutions
www.bsi-supplychain.com