supply chain inclusion in base of the pyramid markets
TRANSCRIPT
Supply chain inclusion in base ofthe pyramid markets
A cluster analysis and implications for globalsupply chainsEugenia Rosca
Department of Management, Tilburg University, Tilburg, The Netherlands andJacobs University Bremen gGmbH, Bremen, Germany
Guido MölleringReinhard Mohn Institute of Management,
Universitat Witten/Herdecke, Witten, Germany andJacobs University Bremen gGmbH, Bremen, Germany
Arpan RijalRotterdam School of Management,
Erasmus University, Rotterdam, The Netherlands, andJulia Christine Bendul
School of Business and Economics,RWTH Aachen University, Aachen, Germany and
Jacobs University Bremen gGmbH, Bremen, Germany
AbstractPurpose – The purpose of this paper is to explore mechanisms of supply chain inclusion in Base of thePyramid (BOP) settings. It distinguishes micro-, small- and medium-sized enterprises (MSME)-led localsupply chains on the one hand and multinational enterprises (MNEs)-led global supply chains on the otherhand. This paper aims to answer the following research question: Which mechanisms of supply chaininclusion are employed empirically by MSMEs and how can these mechanisms influence social impactcreation in MNE-led global supply chains?Design/methodology/approach – A large-scale empirical study of MSMEs operating in BOPmarkets is performed and a cluster analysis conducted to systematically categorize supply chaininclusion. The cluster analysis and current literature yield theory-based implications for MNE-led globalsupply chains.Findings – The cluster analysis reveals three meaningful clusters of supply chain inclusion in BOP marketsand highlights two main aspects. They include direct vs indirect mechanisms of inclusion and diversity insupplier relationships with local organizations aimed at either “sourcing” local capabilities needed forinclusion or “outsourcing” the inclusion. Based on these aspects, two scenarios are proposed and evaluatedfor local-global supply chain symbiosis.Research limitations/implications – This study aims to contribute to the existing literature with a morefine-grained understanding of the inclusion of BOP actors in local supply chains and by proposing alternativetrajectories for global supply chain inclusion.Practical implications – The findings outline several important decisions that managers need to make toinclude BOP actors in supply chain activities.
International Journal of PhysicalDistribution & Logistics
ManagementVol. 49 No. 5, 2019
pp. 575-598Emerald Publishing Limited
0960-0035DOI 10.1108/IJPDLM-01-2018-0042
Received 31 January 2018Revised 23 May 2018
23 October 201815 December 201820 December 2018
Accepted 20 December 2018
The current issue and full text archive of this journal is available on Emerald Insight at:www.emeraldinsight.com/0960-0035.htm
© Eugenia Rosca, Guido Möllering, Arpan Rijal and Julia Christine Bendul. Published byEmerald Publishing Limited. This articleis published under the Creative Commons Attribution(CC BY 4.0) licence. Anyone mayreproduce, distribute, translate and create derivative worksof this article (for both commercial and non-commercial purposes), subject to full attribution to theoriginalpublication and authors. The full terms of this licence may be seen athttp://creativecommons.org/licences/by/4.0/legalcode
575
Supply chaininclusion

Originality/value – This paper contributes a novel, combined perspective of local supply chains (MSMEs)and global supply chains (MNEs).Keywords Inclusion, Base of the PyramidPaper type Research paper
IntroductionThe idea of inclusion of actors from marginalized groups at different stages of supply chainshas recently been emphasized by developments in both practice and academia. From apractical perspective, the concept of inclusivity has gained prominence within the internationaldevelopment and policy discourse. As shown in a content analysis comparing key texts fromthe Millennium Development Goals with those from the Sustainable Development Goals, thelatter mentions inclusivity ten times more than the former (Heeks, 2014). From an academicperspective, scholars in innovation and development studies distinguish between mainstreamand inclusive innovation, where only the latter focuses on the inclusion of actors frommarginalized groups in business model and supply chain development (Heeks et al., 2014;George et al., 2012). The term “marginalized actors” is defined as individuals, households orgroups which can be found in “disenfranchised sectors of society” and “have structurally beendenied access to resources, capabilities, and opportunities” (George et al., 2012, p. 661).Marginalized groups frequently include women, the disabled, ethnic minorities, informal sectorentrepreneurs and those on lowest income levels in the economic pyramid (Heeks et al., 2014).From a supply chain management (SCM) perspective, the inclusion of actors frommarginalizedgroups has been brought to the forefront by the Base of the Pyramid (BOP) debate.
BOP is defined as the almost 4bn people who live on less than $1,500 per year (Prahalad andHart, 2002). BOPmarkets are characterized by largely underdeveloped formal institutions, wheresocioeconomic activities are guided by informal structures (London et al., 2014). In this study, thefocus is on BOP as one particular group which has been historically marginalized or excludedfrom mainstream models of value creation (Heeks et al., 2014). The current literature presentsseveral cases of supply chain inclusion where BOP can serve as producers and suppliers ofcritical raw materials (Hall and Matos, 2010), distributors and consumers of products (Gold et al.,2013) or enablers of reverse logistics activities (Brix-Asala et al., 2016).
Inclusion of BOP actors in supply chain activities is an important topic becauseit can be essential for social impact creation in developing economies (Nahi, 2016).Yet, current studies also show that the inclusion of vulnerable BOP actors presents companiesoutside the BOP market with severe difficulties. However, it is not clear which mechanismsand which stakeholders are better equipped to drive the supply chain inclusion ofmarginalized actors. In order to address this gap, the current study explores mechanisms ofthe supply chain inclusion of marginalized actors in BOP settings. A distinction is madebetween micro-, small- and medium-sized enterprises (MSMEs)-led local supply chains andmultinational enterprises (MNEs)-led global supply chains in order to build on currentfindings. These findings suggest that MNEs face severe difficulties when attempting toembed and integrate their global mindsets with local characteristics of informal markets(Parmigiani and Rivera-Santos, 2015), while MSMEs, on the account of their small size andflexible organizational structure, may be in a better position to integrate BOP actors into theirsupply chains (see, for a review, Rosca et al., 2017; Kolk et al., 2014). In this sense, this studyinvestigates mechanisms of the supply chain inclusion by MSMEs active in BOP markets andit discusses implications for MNEs who aim to expand to BOP markets. Therefore, this paperaims to answer the following research question:
RQ1. Which mechanisms of supply chain inclusion are employed empirically byMSMEs, and how might these mechanisms influence social impact creation inMNE-led global supply chains?
576
IJPDLM49,5
In order to answer this research question, this study is conducted in three stages.First, a large-scale empirical study of MSMEs operating in BOP markets is performed.Using a rich data set of 134 MSMEs, cluster analysis techniques are employed inorder to systematically categorize supply chain inclusion and to identify meaningfulconfigurations. In this study, exploratory cluster analysis is employed to identify patternsin the data and make inferences related to supply chain inclusion in BOP markets. Whileexploratory cluster analysis does not involve hypotheses development and testing, thevalue of this technique lies in mapping patterns in a data set while including multiplevariables as drivers of configuration definition with rich descriptions of configurations(Ketchen and Shook, 1996). This approach, also known as “problem-driven research”(Davis and Marquis, 2005) is especially suitable for exploratory research in an emergingresearch area of interest.
Second, based on the cluster analysis results, two main aspects for MSME-led supplychain inclusion are highlighted: direct vs indirect mechanisms of inclusion and diversity insupplier relationships with local organizations aimed at either “sourcing” local capabilitiesor “outsourcing” the inclusion. Third, cluster analysis along with the two outlined aspects isemployed in order to inform theory-based implications for MNE-led global supply chains,highlighting in particular the potential benefits, risks and challenges for social impactcreated in local BOP markets associated with different trajectories of global-local supplychain inclusion. The interpretation of the cluster analysis together with the implications forglobal supply chains are developed by building extensively on the current literature in orderto account for limitations inherent to the sample.
This study responds to recent calls for investigating supply chain issues in povertysettings (Sodhi and Tang, 2016; Fawcett and Waller, 2015). Moreover, the study hasimportant implications for managerial practice by outlining two important decisions relatedto the design of supply chain inclusion with essential implications for supply chaincomplexity and social impact creation.
This paper is structured in eight sections. This introduction follows a review of theliterature. The third section describes the data collection, the characteristics of the sampleand the steps undertaken for the cluster analysis. The fourth section profiles the threeclusters of BOP enterprises, while in the fifth section five, two main aspects emerging fromthe interpretation of the clusters are presented. The sixth section discusses implications forglobal supply chains of MNEs based on the clusters and emerging issues. The paperconcludes with a discussion of the theoretical contributions of this study and furtherresearch ideas.
Literature reviewInclusion of marginalized actors in MNE-led global supply chainsAlthough topics of inclusion and local participation have gained momentum in bothacademia and practice, only a few empirical studies adopt the SCM perspective andinclusion of impoverished actors. Building on these and other key studies from internationalbusiness and strategy literature, several important findings can be outlined concerning theinclusion of BOP actors in MNE-led global supply chains. First, MNEs face significantchallenges when operating in BOP markets and including BOP in their supply chains.MNEs often lack the skills and capabilities needed in order to embed and co-createlocally relevant value propositions and to build on local structures (Venn and Berg, 2013).They also face difficulties related to the lack of global standards enforcement (Prahalad,2012). Additionally, they need to develop “an active assistance approach” in order to enablethe adoption of global standards at the BOP level (Perez-Aleman and Sandilands, 2008).The lack of commitment of top management of MNEs toward BOP inclusion due to longreturn horizons also presents challenges (Hart et al., 2016; Olsen and Boxenbaum, 2009).
577
Supply chaininclusion

Additionally, existing power and knowledge asymmetries between the local BOP actors andMNEs present barriers for knowledge diffusion between impoverished actors and othersupply chain members (Hall and Matos, 2010).
In spite of all the challenges faced by MNEs to engage local BOP in their value creationactivities, their efforts may be essential to drive sustainable development and povertyalleviation efforts in BOP markets (Nahi, 2016). Critics of the initial BOP proposition arguethat the only way to eradicate poverty is to provide steady employment and reasonablewages, to help increase productivity levels and to strengthen capabilities and freedomsalong social, cultural and political dimensions (Karnani, 2007). Inclusion of marginalizedBOP in supply chain activities can provide such opportunities. Supply chain inclusionmechanisms can enable the creation of social impact in global supply chains. Social impactis as the positive effects of different activities on sellers (local distributors or producers),buyers (local consumers or agents) and communities (London, 2009). These effects can referto potential changes in economics (e.g. income, productivity), capabilities (e.g. skills,knowledge, self-esteem) and relationships (e.g. social status, access to networks)(London, 2009).
Second, local non-business partners can play an important role by contributing localknowledge and capabilities (Parmigiani and Rivera-Santos, 2015). In particular,non-business partners frequently undertake activities that require close connection withthe local context (Hahn and Gold, 2014). These activities include access to distributionnetworks, demand studies, social marketing and education campaigns, facilitatingpartnerships and value chain activities. Typical non-business partners are NGOs andgovernment agencies who can use their local knowledge to re-conceptualizesupply chains and fit them to the constraints of BOP markets (Gold et al., 2013).Yet, partnerships between for-profit MNEs and non-profit organizations can bechallenging because a common ground of resources, values and processes is needed anddifferent organizational identities may result in uneven expectations and goals (Le Berand Branzei, 2010).
Third, MNEs tend to include BOP actors in either upstream processes (BOP as suppliers)or downstream processes (BOP as distributors), but rarely both. Case studies from literatureillustrate examples of supply chain inclusion of BOP actors as either producers/suppliers ofraw materials or as distributors through women-led door-to-door distribution models(Parmigiani and Rivera-Santos, 2015; Gold et al., 2013; Hall and Matos, 2010). In particular,distribution models based on local networks of micro-entrepreneurs ( frequently women)are often presented as key mechanisms to address the lack of infrastructure and tomobilize the strength of social ties in informal markets (Bendul et al., 2016; Prahalad, 2012;Seelos and Mair, 2007).
Altogether, the inclusion of local BOP actors in global supply chains presents significantbarriers for MNEs in regards to institutional voids, informal market characteristics, powerand knowledge asymmetries and top management commitment. While non-businesspartners often mediate the relationship between MNEs and local BOP actors, differentorganizational mindsets and goals between for-profit and non-profit organizations cancreate further tensions. Supply chain inclusion of local BOP actors can serve as mechanismsto overcome local barriers, but more importantly can enable the creation of social impact inBOP communities.
Inclusion of marginalized actors in MSME-led local supply chainsRecent empirical work suggests that key organizations for supply chain inclusion and localdevelopment in BOPmarkets are MSMEs (see, for a review, Rosca et al., 2017; Kolk et al., 2014).Various aspects of local supply chains of MSMEs (e.g. distribution, sourcing from smallholderfarmers, partnerships and social impact) have received more attention from social
578
IJPDLM49,5
entrepreneurship and sustainable business research streams and less attention in theSCM literature. Insights from these research streams indicate a large diversity in termsof organizational models (e.g. for-profit initiatives, social enterprises). MSMEs in BOP marketshave real potential to enable local supply chains through access to credit, market informationand market access, and to achieve higher productivity through provision of new technologiesand equipment (Sodhi and Tang, 2011). Additionally, due to their small size and flexibleorganizational structure, MSMEs are in a better position to engage with local BOP actors.Yet, their own survival is at risk due to challenges related to lack of capital and capabilitiesfor scaling.
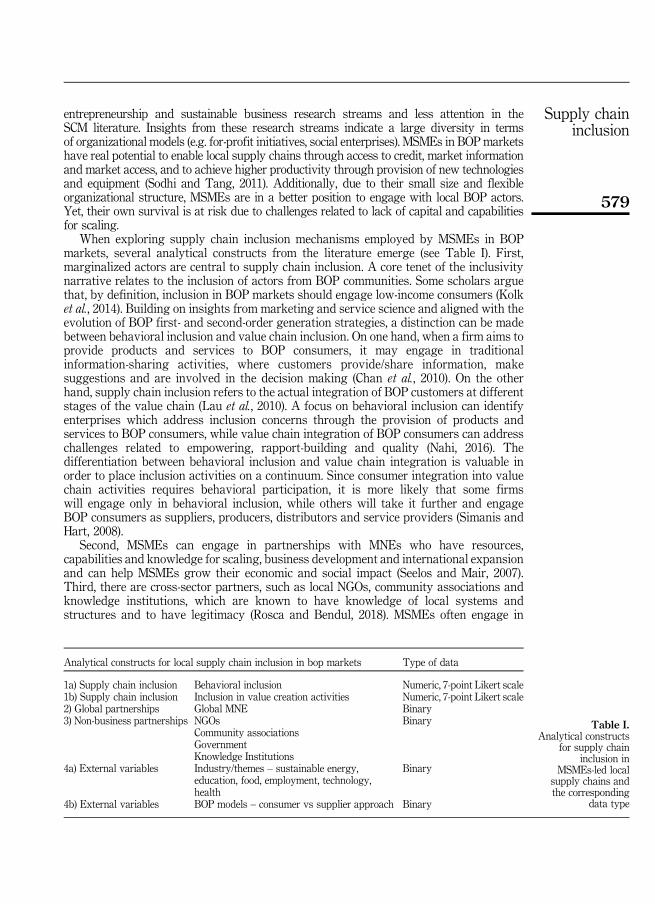
When exploring supply chain inclusion mechanisms employed by MSMEs in BOPmarkets, several analytical constructs from the literature emerge (see Table I). First,marginalized actors are central to supply chain inclusion. A core tenet of the inclusivitynarrative relates to the inclusion of actors from BOP communities. Some scholars arguethat, by definition, inclusion in BOP markets should engage low-income consumers (Kolket al., 2014). Building on insights from marketing and service science and aligned with theevolution of BOP first- and second-order generation strategies, a distinction can be madebetween behavioral inclusion and value chain inclusion. On one hand, when a firm aims toprovide products and services to BOP consumers, it may engage in traditionalinformation-sharing activities, where customers provide/share information, makesuggestions and are involved in the decision making (Chan et al., 2010). On the otherhand, supply chain inclusion refers to the actual integration of BOP customers at differentstages of the value chain (Lau et al., 2010). A focus on behavioral inclusion can identifyenterprises which address inclusion concerns through the provision of products andservices to BOP consumers, while value chain integration of BOP consumers can addresschallenges related to empowering, rapport-building and quality (Nahi, 2016). Thedifferentiation between behavioral inclusion and value chain integration is valuable inorder to place inclusion activities on a continuum. Since consumer integration into valuechain activities requires behavioral participation, it is more likely that some firmswill engage only in behavioral inclusion, while others will take it further and engageBOP consumers as suppliers, producers, distributors and service providers (Simanis andHart, 2008).
Second, MSMEs can engage in partnerships with MNEs who have resources,capabilities and knowledge for scaling, business development and international expansionand can help MSMEs grow their economic and social impact (Seelos and Mair, 2007).Third, there are cross-sector partners, such as local NGOs, community associations andknowledge institutions, which are known to have knowledge of local systems andstructures and to have legitimacy (Rosca and Bendul, 2018). MSMEs often engage in
Analytical constructs for local supply chain inclusion in bop markets Type of data
1a) Supply chain inclusion Behavioral inclusion Numeric, 7-point Likert scale1b) Supply chain inclusion Inclusion in value creation activities Numeric, 7-point Likert scale2) Global partnerships Global MNE Binary3) Non-business partnerships NGOs
Community associationsGovernmentKnowledge Institutions
Binary
4a) External variables Industry/themes – sustainable energy,education, food, employment, technology,health
Binary
4b) External variables BOP models – consumer vs supplier approach Binary
Table I.Analytical constructs
for supply chaininclusion in
MSMEs-led localsupply chains andthe corresponding
data type
579
Supply chaininclusion

partnerships with local cross-sector partners and leverage their resources and capabilitiesin order to acquire local knowledge, legitimacy and connections with BOP consumers(London et al., 2010).
Current studies also suggest that supply chain inclusion mechanisms may take differentforms, depending on the industries involved (Nahi, 2016) and whether BOP is a market forselling goods (a consumer approach) or a producer to be potentially sourced from (a supplierapproach) (London et al., 2010).
Research gaps and objectivesWhile the role of MSMEs has gained importance in BOP contexts, the literature reviewoutlines the challenges that MNEs face when attempting to integrate marginalized actorsinto their supply chains. The increasing role of MSMEs is supported not only by recentstudies (Rosca et al., 2017; Kolk et al., 2014) but also by numerous awards, incubators andaccelerator programs targeting market-based initiatives in BOP markets. Therefore, thegoal of this paper is to investigate supply chain inclusion mechanisms in BOP markets andto informMNEs about how they can facilitate the inclusion of BOP actors by building on thestructures already developed by local MSMEs. Thereby, the paper contributes a novelperspective on local supply chains of MSMEs and links the debates on local and globalsupply chains by proposing partnership trajectories between MNEs and MSMEs, therebydiscussing the implications and trade-offs for social impact creation.
MethodsIn order to develop a meaningful classification of MSMEs in BOP, a four-stage research designis employed. Stage 1 encompasses the data collection process, descriptive analysis of thesample and measures used for the clustering variables. In this study, the selection ofclustering variables is guided by the literature through the analytical constructs outlined inTable I, and therefore, a deductive approach for the selection of the clustering variables isemployed (Brusco et al., 2017). Stage 2 entails the selection of clustering algorithms anddetermining the number of clusters. Stage 3 explains the tests conducted to assess the internalvalidity of the obtained cluster solution. Finally, in Stage 4, post hoc tests are employed inorder to identify statistically significant differences between the clusters and conductadditional analyses to explore relationships between the clusters and other external variables.
Stage 1: data collectionThe units of analysis for this study are MSMEs that operate in BOP markets. An onlinequestionnaire was designed for this target group of respondents. The selection ofrespondent MSMEs employs a purposive sampling approach, where subjects are selectedbased on pre-specified criteria (Black, 1999). These criteria are as follows: First, theenterprises can have up to 250 employees[1] and can address BOP issues through consumeror supplier models, as described in the literature review. Second, these enterprises can belocal or foreign with headquarters in industrialized countries but with small-scaleproduction facilities or local branches in BOP settings. Third, the targeted enterprisesneed to have a profit orientation, or at least the intention of being profitable and achievingself-financing growth through retained earnings.
In order to find MSMEs that fit these criteria, databases with case studies and onlineplatforms showcasing BOP enterprises were screened[2]. This resulted in a total sample of 1089enterprises operating in BOP markets across various geographical regions and industries. Thesurvey was administered between August and November 2016, mainly in two stages, and itrecorded responses from 175 BOP ventures. The questionnaire was tested in several roundswith both practitioners and academics before the application. In the first stage, the online
580
IJPDLM49,5
questionnaire was sent via e-mail to the respondents together with a text explaining thebackground of the study and promising them the results of the study. Due to a low responserate during this stage (6 percent, 36/623), in the second stage, personal emails were sent out,addressing the founders/directors of the enterprises. This stage resulted in a higher responserate of 38 percent (139/367). After excluding incomplete and insufficient quality responses, thefinal sample used for this study consists of 134 enterprises. It presents a representativedistribution across various characteristics (see Appendix 1). The sample also presents a focuson Africa and South Asia, with young, small and mostly stand-alone enterprises.
In order to evaluate the representativeness of the sample, the sample characteristics ofthis study were compared with samples from similar studies. This sample is verycomparable with the study conducted by De Beule and Verwaal (2014) in terms of theenterprises’ age, size, sectors and geographical focus. The characteristics of the respondentsalong with the small size of enterprises suggest that respondents had in-depth knowledge ofthe enterprises and its related activities. Owners, managing directors, founders, executivedirectors and chairpersons filled out 59 percent of the questionnaires. In total, 31 percent ofthe questionnaires were completed by internal managers responsible for specific areas in thecompanies, such as IT, marketing or technical issues, or regional project managers. Theremaining 10 percent of the questionnaires were returned by other actors with intimateknowledge of the firms (e.g. impact advisors, researchers, lawyers). In order to check forpotential non-response biases in the sample, the extrapolation approach was employed(Armstrong and Overton, 1977). Several χ2 group tests between early and late respondentsdid not reveal any differences (all p W0.05). Therefore, one can conclude that there is notenough evidence to suggest the existence of non-response bias.
MeasuresThis study employs data from the questionnaire related to information-sharing activities,value chain inclusion and partnerships with business and non-business actors. Moreover,data were collected on the type of BOP model employed and the industry. The type of dataused for all variables can be found in Table I.
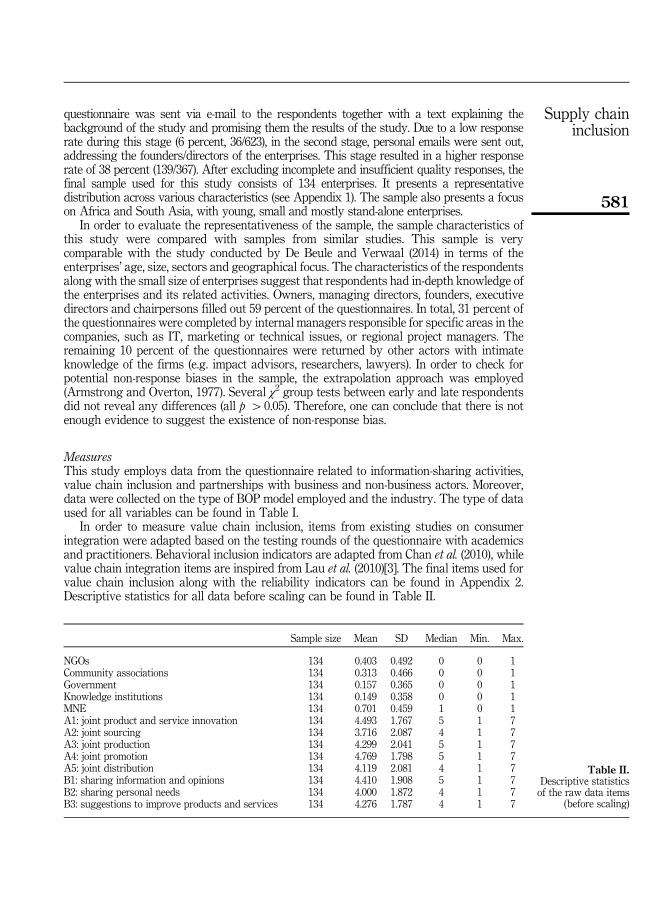
In order to measure value chain inclusion, items from existing studies on consumerintegration were adapted based on the testing rounds of the questionnaire with academicsand practitioners. Behavioral inclusion indicators are adapted from Chan et al. (2010), whilevalue chain integration items are inspired from Lau et al. (2010)[3]. The final items used forvalue chain inclusion along with the reliability indicators can be found in Appendix 2.Descriptive statistics for all data before scaling can be found in Table II.
Sample size Mean SD Median Min. Max.
NGOs 134 0.403 0.492 0 0 1Community associations 134 0.313 0.466 0 0 1Government 134 0.157 0.365 0 0 1Knowledge institutions 134 0.149 0.358 0 0 1MNE 134 0.701 0.459 1 0 1A1: joint product and service innovation 134 4.493 1.767 5 1 7A2: joint sourcing 134 3.716 2.087 4 1 7A3: joint production 134 4.299 2.041 5 1 7A4: joint promotion 134 4.769 1.798 5 1 7A5: joint distribution 134 4.119 2.081 4 1 7B1: sharing information and opinions 134 4.410 1.908 5 1 7B2: sharing personal needs 134 4.000 1.872 4 1 7B3: suggestions to improve products and services 134 4.276 1.787 4 1 7
Table II.Descriptive statisticsof the raw data items
(before scaling)
581
Supply chaininclusion

To evaluate partnerships with business actors, respondents were asked if their organizationcollaborates with MNEs. While for partnerships with non-business partners were asked toselect the cross-sector partner with whom they work most closely from NGOs, communityassociations, governments and knowledge institutions. Measuring the external variables“sectors” and “BOP approach” proceeded as follows. In the questionnaire, respondents wereasked to describe the main product/service that they provide and the mission of theenterprise. Based on these two categories, the approach of (Mair, Battilana and Cardenas,2012) was followed and enterprises classified into six themes, namely, sustainable solutions,education, food, employment, technology and health. Several enterprises were coded withinmore than one theme, since this was often the case. For example, a technological ventureaddressing healthcare issues was coded as both technology and healthcare. Lastly, aquestion was included to differentiate between consumer and producer models in BOPmarkets. However, during the testing of the questionnaire, an additional option was added,namely, that of intermediaries, since it became clear that numerous enterprises in BOPmarkets offer products and services for BOP consumers, but due to affordabilityconstraints, the actual customers are intermediaries (NGOs, governments, etc.).
Stage 2: cluster analysis – determining the number of clustersAs the first step to conduct cluster analysis, the variables were standardized using Z-scores(Brusco et al., 2017) and a correlation analysis conducted in order to evaluate preliminaryrelationships between the main variables (Möllering, 2003). To determine the proximity(similarity or dissimilarity) between the observations, each observation is represented by itsscaled vector of constructs. The dissimilarity (distance) between two observations iscalculated as the Euclidean distance (L2 norm) between the observations (Lattin et al., 2003).A partial distance matrix of 15 observations is presented in Table AI; a full version isavailable upon request.
In order to determine the number of clusters, the two-stage procedure recommended byBrusco et al. (2017) was followed. The number of clusters is determined in the firststage using hierarchical clustering. Then, the final clusters are determined withK-means clustering with known number of clusters. For the hierarchical clustering,Ward’s method is employed to select an appropriate number of clusters (Lattin et al., 2003).Ward’s method is chosen as it has been known to be superior compared to othermethods such as single, average and complete linkage in several simulation studies(Ferreira and Hitchcock, 2009).
Two stopping rules are used to identify the number of clusters – the index of Caliński andHarabasz (1974) and the elbow method for the intra-cluster variation (Hennig, 2007). Theapproach of Caliński and Harabasz (1974) employs a ratio of total variance between the clustersand total variance within clusters, and a large value for the ratio shows more distinct clustersbetter (Mair, Martí and Ventresca, 2012; Mair, Battilana, and Cardenas, 2012). Both approachesemployed for stopping rules suggest a three-cluster solution. The three clusters from thehierarchical clustering can be visualized in the rooted dendrogram illustrated in Figure 1.Using multiple approaches for determining the number of clusters increases the confidence inthe solution and overcomes the limitations of using a single method (Ketchen and Shook, 1996).Actual clusters are determined via the K-means clustering method, with the centroidsdetermined by the hierarchical cluster analysis with 5,000 re-starts (Brusco et al., 2017). As aresult of this procedure, the 134 observations are classified into three clusters of MSMEs.
Stage 3: internal consistencyIn order to evaluate the internal consistency of the three-cluster solution, discriminant analysisand ANOVA are performed as additional multivariate techniques (Mair, Battilana andCardenas, 2012; Hambrick, 1983). Using the discriminant analysis with 50 percent randomly
582
IJPDLM49,5

sampled training data and the complementary testing data, 90 percent of the observationswere classified accurately into the cluster they belonged to in the K-means clusters.Furthermore, the internal consistency of the cluster solution was investigated by measuringthe internal stability of the clusters. The original data set was bootstrapped 100 times withreplacement, and the K-means clustering was performed with 5,000 re-starts each time. Thebootstrapped means of the Jaccard similarity index for the three clusters are 0.78, 0.83 and0.75, respectively. Therefore, the three-cluster solution approach is robust and reliable. Thehigh Jaccard similarity index[4] (Hennig, 2007) of the clusters determined from the bootstrapcompared to the original clusters indicates that each of the clusters is valid and stable. TheANOVA test of variables across the clusters shows that only one variable is not significantlydifferent across clusters (collaboration with MNEs).
Stage 4: external validity – profiling the clustersAdditional analyses were conducted in order to explore statistically significant differencesbetween the three clusters. Multiple pair-wise comparisons based on post hoc tests areemployed for this purpose (Gabriel’s[5] or Games–Howell[6] tests). The selection of post hoctests is determined by the result of the Levene’s test of homogeneity of variances[7], namely,the assumption of equal variances (Field, 2013).
In order to enhance the external validity of the cluster solution, additional tests wereconducted with external variables not used in defining the clusters. This approach reducesresearcher’s judgments and biases and is regarded as superior (Brusco et al., 2017;Ketchen and Shook, 1996). In this sense, the three clusters were cross-tabulated withexternal variables “BOP approach” and “themes,” and Cramér’s V[8] index is employedto assess the strength of association between different variables (see Table IV ).These analyses help to gain a more nuanced picture of the individual clusters.Furthermore, several discussions with academics were conducted in order to evaluate theexternal validity of the clusters.
50
40
30
20
Hei
ght
10
0
8334 37 128 79 11 33 90 109
122 66 72 119
124
131 52 84 55 78 100 22 69 102 2 51 107 23 41 18 132 43 60 29 56 24 99 68 82 127
105 26 120 40 103 32 118 42 53 13 92 8 59 9 48 115 7 33 39 74 85 17 77 10 70 108 16 54 88 91 110
112
121 12 89 57 61 31 113 1 47 108 25 125 28 126 53 98 101 96 62 63 6 21 123
134 44 76 87 49 80 95 64 114 3 19 36 30 35 14 75 20 67 71 93 45 94 117 73 5 43 81 130 15 65 27 104
133 4 97 111
116 50 12980
Note: Dotted lines demarcate the three cluster solution
Figure 1.Rooted dendrogram
from hierarchicalclustering
583
Supply chaininclusion

Findings of the cluster analysis: three-cluster solution approachIn this section, the results are revealed in terms of the three-cluster solution approach. Theclusters differentiate themselves in regard to both the clustering (the value chain inclusionlevels and non-business partnerships employed) and external variables (BOP approach andthemes). The particularities of each cluster are briefly described below based on severalexamples from the sample.
Findings reveal three clusters of value chain inclusion in BOP markets (see Table III).Using Cramér’s V index as a measure of association, significant differences were foundbetween the clusters in terms of employed BOP approach (Cramér’s V¼ 0.323, sig.¼ 0.000).A more detailed overview is shown in Table IV, and this reveals that Cluster 1 is driven by aconsumer approach, Cluster 2 by both a producer and an intermediaries approachand Cluster 3 by a mix of a consumer and an intermediaries approach. Additionally, testswere done to analyze the differences between the clusters in regard to their themes.
Variables andattributes
Cluster 1(n¼ 46)
Cluster 2(n¼ 47)
Cluster 3(n¼ 41) F-test
Levine’stest
Post hoc test: Games–Howell or Gabriel’s test
Partners: business and non-businessMNC 0.63 (0.49) 0.74 (0.44) 0.73 (0.45) pW0.05 pW0.05 naNGO 0.04 (0.21) 0.28 (0.45) 0.95 (0.22) 94,234*** 38,888*** CL3WCL1, CL2; CL2WCL1Communityassociations
0.52 (0.50) 0.38 (0.49) 0.00 (0.0) 18,130*** 699,507*** CL1WCL3; CL2WCL3
Government 0.24 (0.43) 0.21 (0.41) 0.00 (0.0) 5,916*** 46,893*** CL1WCL3; CL2WCL3Knowledgeinstitutions
0.30 (0.46) 0.13 (0.34) 0.00 (0.0) 8,932*** 57,945*** CL1WCL3; CL2WCL3
Behavioral inclusionSharinginformation andopinions
5.54 (1.36) 2.66 (1.46) 5.15 (1.39) 56,967*** pW0.05 CL1WCL2; CL3WCL2
Sharing personalneeds
5.24 (1.29) 2.49 (1.44) 4.34 (1.68) 42,228*** PW0,05 CL1WCL2, CL3; CL3WCL2
Suggestions toimprove productsand services
5.63 (1.10) 2.94 (1.45) 4.29 (1.61) 43,179*** 3,603*** CL1WCL2, CL3; CL3WCL2
Value chain inclusionJoint product/serviceinnovation
5.59 (1.39) 3.17 (1.45) 4.78 (1.50) 33,529*** pW0.05 CL1WCL2, CL3; CL3WCL2
Joint sourcing 4.78 (1.94) 2.57 (1.70) 3.83 (2.08) 16,068*** pW0.05 CL1WCL2, CL3; CL3WCL2Joint production 5.48 (1.35) 2.79 (1.82) 4.71 (1.89) 31,060*** 5,504*** CL1WCL2; CL3WCL2Joint promotion 5.74 (1.06) 3.32 (1.80) 5.34 (1.35) 37,138*** 9,742*** CL1WCL2; CL3WCL2Joint distribution 5.30 (1.71) 2.53 (1.56) 4.61 (1.87) 32,971*** pW0.05 CL1WCL2; CL3WCL2Note: p o 0.001
Table III.Clusters for valuechain inclusionof MSMEs inBOP markets
ClustersExternal variable Cluster 1 Cluster 2 Cluster 3 Total
Consumer-based model 34 11 21 66Producer-based model 3 17 5 25Intermediaries-based model 9 19 15 43Total 46 47 41 134
Table IV.Profiling clustersbased on externalvariables – BOPapproach
584
IJPDLM49,5
Differences were found in regard to employment (Cramér’s V¼ 0.238, sig.¼ 0.022) andtechnology (Cramér’s V¼ 0.226, sig.¼ 0.032). This analysis reveals that technology venturesare in Cluster 1 (54 percent) and employment ventures belong to Cluster 2 (57 percent).
Cluster 1 – direct inclusion network (DIN)Cluster 1, DIN, differentiates itself through very high levels of both behavioral and value chaininclusion and a wide and diverse network of non-business partners supporting the inclusion.Typical offerings include organic fertilizers, briquettes, clean cooking fuel and stoves, solarlamps, heating and rural electrification. These enterprises offer products and services directlyto BOP consumers and address various aspects related to education, namely healthawareness, ecological education and agronomic advice. Several of these enterprises operate inthe agriculture/agri-business sector. They support farmers with information, technologies,input, advice, training, materials and related information to increase farmers’ productivityand/or to educate them on agri-business issues. These MSMEs are very difficult to beclassified into given industries or sectors because they provide a wide range of solutions forBOP customers. A typical example of the organizations in this cluster is an enterprise locatedin South East Asia, called Agrotrain (pseudonym). Its main aim is to train smallholder farmersand increase their incomes and productivity. This social enterprise offers a wide range ofservices for farmers including irrigation products, farm advisory services, financial services,rural energy, infrastructure and economic research.
Cluster 2 – indirect inclusion network (IIN)Cluster 2, IIN, differentiates itself through low levels of both behavioral and value chaininclusion and a wide network of non-business partners supporting the inclusion. Thiscluster includes MSMEs which follow the supplier- or intermediaries-based models, whereproducts and services are either sourced from the BOP producers and commercialized tohigher income markets or they are sold to intermediaries (NGOs, governments) and thendistributed/sold at very low price to BOP consumers. In the case of the producer-type ofenterprises, their aim is to offer education training and employment opportunities for localfarmers and artisans while opening access to new markets for their own products/services.Their network of non-business partners is also very wide and includes a variety of partnerswho handle specific issues. They often target rural farmers, artisans, women and otheractors from marginalized groups, and sourced products include cocoa, tea, coffee, garmentsand peanut butter. They are known to engage closely with NGOs and other local partners.A typical example would be Solarity (pseudonym), incubated by a large foundation andaiming to make energy available at affordable prices in remote areas in Africa. It workstogether with several international and local NGOs, and employs local entrepreneurs asdistributors for its products in remote areas.
Cluster 3 – direct NGO collaboration (DNC)Cluster 3, DNC, distinguishes itself through high levels of behavioral and value chaininclusion and a single type of partner – NGOs with various competencies and networks.This cluster includes MSMEs which offer basic needs services, including nutritious foodproducts, water, waste services and sanitation, last mile healthcare, sanitary pads,sanitation, water treatment systems, electricity, solar pump systems – services and productswhich traditionally have been in the repertoire of NGOs. The relationship of theseenterprises with NGOs can be traced back to different scenarios: enterprises foundedtogether with an NGO or organizations that transitioned from an NGO model to a socialbusiness. A typical example of an enterprise in this cluster is Puraqua (pseudonym) inCentral America, which is a social company committed to providing drinking water to
585
Supply chaininclusion

rural BOP. Its customers are people in remote areas with no access to clean drinking water,and its offering includes a water filter used to remove contaminants from water. It workstogether with local NGOs to select and train women entrepreneurs as sales agents.
Understanding supply chain inclusion in BOP marketsRegarding the three-cluster solution approach based on the empirical study, two mainaspects are highlighted as different mechanisms in order to solve core issues of supply chaininclusion of actors from marginalized groups: the chain of responsibility for the inclusionand diversity issues in supply chain partnerships.
Direct vs indirect supply chain inclusionThis study suggests that there are two main approaches to value chain inclusion. It isdistinguished between direct and indirect inclusion based on the chain of responsibility forthe inclusion. Direct inclusion refers to situations in which focal companies directly engagein inclusion activities with BOP and are only supported by local partners for differentactivities (DIN and DNC). In the case of indirect inclusion, the focal firms do not engage ininclusion themselves but rather “outsource” the inclusion to local partners (IIN). The indirectinclusion can take up different forms, whereby MSMEs can distribute products to BOPconsumers through local micro-entrepreneurial distribution networks managed by NGOs orcan create new markets for agricultural products of smallholder farmers. Both direct andindirect mechanisms of inclusion represent two potential ways to solve the supply chaininclusion in BOP markets, and each entails benefits and challenges for both the firm and thesocial impact created in local communities.
One interesting aspect highlighted by DIN cluster, which directly engages in inclusionactivities, is the idea of “inclusion as an end or inclusion as a means to an end.” MSMEs inDIN cluster tend to be inclusive across all value chain stages rather than being inclusive in asingle stage (e.g. distribution). One example of this typology of enterprises can also be theinclusive value chain example cited by Bendul et al. (2016): Toyola, a local enterprise fromGhana which produces cooking stoves. Its truly inclusive value chain illustrates how localBOP are engaged at every stage: stoves are made, sold, used, managed and maintained bylocal, independent, self-employed artisans. It is very likely that these types of MSMEsperceive BOP inclusion as their main value proposition and the products/services offeredare only the means through which inclusion can be materialized. With this inclusion,MSMEs aim to drive social impact through empowerment and local capacity building. Theindirect form of inclusion, where MSMEs “outsource” the function of integrating BOP acrossthe supply chain, raises important aspects, namely, the attribution of social impact and lackof control over extended supply chain networks, while the fact that some MSMEs createemployment and opportunities for the BOP indirectly through partners does not necessarilyimply they are not inclusive or the legitimacy of any social impact claims can be questioned.
Diversity issues in inclusive supply chainsThe findings highlight several tactics that MSMEs employ to address complexities causedby diverse organizational logics and modus operandi. The clusters reveal the issue ofmaintaining relationships with single or multiple types of organizational logics which canbe observed between DIN and DNC clusters. In order to source the local capabilities neededto enable supply chain inclusion, some MSMEs tend to engage extensively with a widerange of partners (DIN), while others rely on key NGOs who can handle all the local issuesby leveraging on their extensive local network (DNC). The aspect of collaborating withmultiple partners is also valid for IIN cluster where in order to ‘outsource” the inclusion,MSMEs still need to collaborate with a variety of partners. Between IIN and DNC, there are
586
IJPDLM49,5

two approaches to partnerships – multiple partners who handle specific issues, or a singlelarge partner with diverse competencies (Parmigiani and Rivera-Santos, 2015).
On one hand, firms in BOP markets do sometimes choose only one single largeorganization as a partner instead of working with multiple partners since this can be morecost-effective than identifying and developing partnerships with multiple organizations(Parmigiani and Rivera-Santos, 2015). This is particularly relevant if there are large NGOslike BRAC or Grameen in Bangladesh who have extensive knowledge of local structures,systems and even connections in the government. An example of this type of value chaininclusion includes the case of Vision Spring, a social enterprise from India, who scaled up itsdistribution network quickly and very efficiently by collaborating with one of the world’slargest NGO – BRAC. BRAC helped Vision Spring sell their eyeglasses by leveraging theirwide network in rural Bangladesh (Sodhi and Tang, 2011).
On the other hand, working with multiple partners, MSMEs can leverage on a wider rangeof resources and capabilities. Yet, dealing with multiple type of partners with different goals,demands and interests can result in issues of “stakeholder ambiguity” (Matos and Hall, 2007).Furthermore, additional costs may incur due to resources and capabilities needed to identify,select and retain multiple partners for different stages of the supply chain.
Implications for MNE-led global supply chainsPreviously, the literature has suggested that MNEs can tap BOP markets through NGOcollaborations. However, the results of the cluster analysis and the issues outlined abovesuggest that the most effective and efficient way to tap local value chains is throughexisting MSMEs ( for earlier work advocating this approach, see Seelos and Mair, 2007).Collaboration with MSMEs can create partnerships with synergistic effects for the involvedstakeholders and may present fewer challenges for MNEs due to similar logics andgovernance structures in contrast to collaboration with NGOs. The lack of economies ofscale, specialization, training and knowledge required to increase productivity in localsupply chains is a key challenge for local MSMEs to survive economically and therefore tosustain their impact (Karnani, 2007). By integrating global competences of MNEs and localexpertise of MSMEs, economies of scale and scope and higher productivity levels can beachieved and thereby social impact created in BOP settings.
Following this narrative, the cluster analysis findings suggest two main scenarios forlocal-global supply chain symbiosis enabled by MSMEs, as shown by Figure 2. While thetwo scenarios can result in important benefits for MNEs (Table V), there are also challengesto be overcome. The challenges can result in trade-offs for social impact created in BOPcommunities. Scenario 1, where MNEs integrate into their global supply chains localMSMEs which directly engage BOP actors, can result in valuable synergies by combining
BOP
MSME-led local supply chains
Partners
MNE-led global supply chains
Partner(s) Figure 2.MSMEs as connectors
of global and localsupply chains
587
Supply chaininclusion
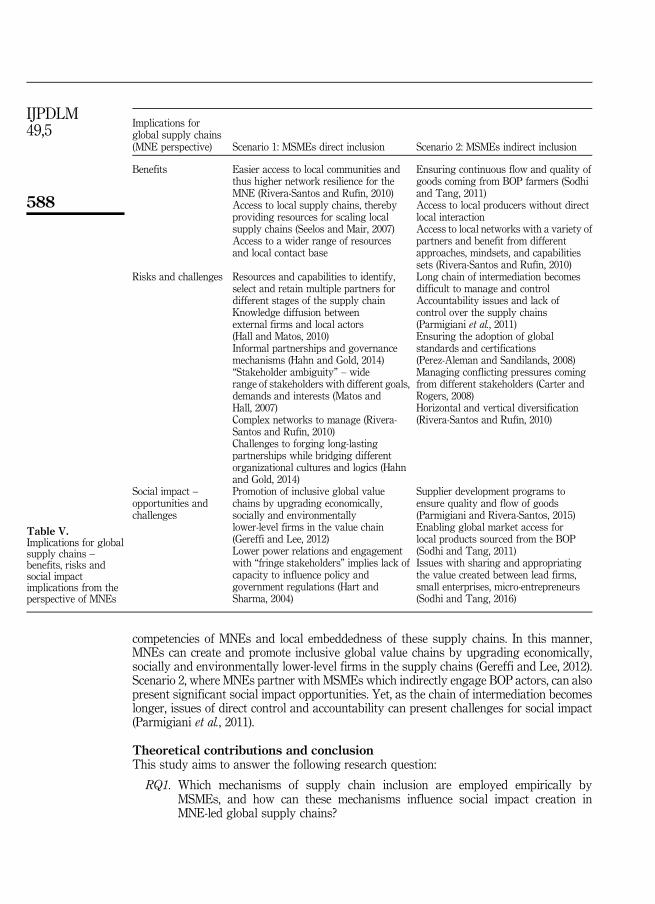
competencies of MNEs and local embeddedness of these supply chains. In this manner,MNEs can create and promote inclusive global value chains by upgrading economically,socially and environmentally lower-level firms in the supply chains (Gereffi and Lee, 2012).Scenario 2, where MNEs partner with MSMEs which indirectly engage BOP actors, can alsopresent significant social impact opportunities. Yet, as the chain of intermediation becomeslonger, issues of direct control and accountability can present challenges for social impact(Parmigiani et al., 2011).
Theoretical contributions and conclusionThis study aims to answer the following research question:
RQ1. Which mechanisms of supply chain inclusion are employed empirically byMSMEs, and how can these mechanisms influence social impact creation inMNE-led global supply chains?
Implications forglobal supply chains(MNE perspective) Scenario 1: MSMEs direct inclusion Scenario 2: MSMEs indirect inclusion
Benefits Easier access to local communities andthus higher network resilience for theMNE (Rivera-Santos and Rufín, 2010)Access to local supply chains, therebyproviding resources for scaling localsupply chains (Seelos and Mair, 2007)Access to a wider range of resourcesand local contact base
Ensuring continuous flow and quality ofgoods coming from BOP farmers (Sodhiand Tang, 2011)Access to local producers without directlocal interactionAccess to local networks with a variety ofpartners and benefit from differentapproaches, mindsets, and capabilitiessets (Rivera-Santos and Rufín, 2010)
Risks and challenges Resources and capabilities to identify,select and retain multiple partners fordifferent stages of the supply chainKnowledge diffusion betweenexternal firms and local actors(Hall and Matos, 2010)Informal partnerships and governancemechanisms (Hahn and Gold, 2014)“Stakeholder ambiguity” – widerange of stakeholders with different goals,demands and interests (Matos andHall, 2007)Complex networks to manage (Rivera-Santos and Rufín, 2010)Challenges to forging long-lastingpartnerships while bridging differentorganizational cultures and logics (Hahnand Gold, 2014)
Long chain of intermediation becomesdifficult to manage and controlAccountability issues and lack ofcontrol over the supply chains(Parmigiani et al., 2011)Ensuring the adoption of globalstandards and certifications(Perez-Aleman and Sandilands, 2008)Managing conflicting pressures comingfrom different stakeholders (Carter andRogers, 2008)Horizontal and vertical diversification(Rivera-Santos and Rufín, 2010)
Social impact –opportunities andchallenges
Promotion of inclusive global valuechains by upgrading economically,socially and environmentallylower-level firms in the value chain(Gereffi and Lee, 2012)Lower power relations and engagementwith “fringe stakeholders” implies lack ofcapacity to influence policy andgovernment regulations (Hart andSharma, 2004)
Supplier development programs toensure quality and flow of goods(Parmigiani and Rivera-Santos, 2015)Enabling global market access forlocal products sourced from the BOP(Sodhi and Tang, 2011)Issues with sharing and appropriatingthe value created between lead firms,small enterprises, micro-entrepreneurs(Sodhi and Tang, 2016)
Table V.Implications for globalsupply chains –benefits, risks andsocial impactimplications from theperspective of MNEs
588
IJPDLM49,5
The empirical results and literature investigation suggest that MSMEs engage in eitherdirect or indirect inclusion. The proposed distinction confirms and extends current studiesthat argue that collaboration with cross-sector partners can be sufficient to bring productsand services to BOP markets (Nahi, 2016; Hahn and Gold, 2014). The perspective of localsupply chain inclusion in MSMEs extends the proposed classification of agency- andcorporate-driven supply chains of MNEs by Parmigiani and Rivera-Santos (2015) byunraveling how inclusion of marginalized actors can materialize in local supply chains.
The findings suggest that MSMEs need to make important decisions with essentialimplications for SCM to include marginalized actors: direct or indirect inclusion mechanismsand tactics for handling complexity in diverse partnership networks. With this, the studycontributes a more fine-grained understanding of the inclusion of marginalized actors inlocal supply chains (the latter being frequently ignored by current studies in favor of globalsupply chain issues). Furthermore, it is proposed that MSMEs can serve as brokers betweenlocal BOP markets and global MNEs. In this sense, the study extends the perspective ofSodhi and Tang (2011), who propose that small enterprises can support local supply chainsin BOP markets. MNEs can further strengthen local supply chains by tapping into BOPmarkets through these MSMEs and thereby connecting global and local supply chains.By proposing alternative trajectories for local-global supply chain inclusion and bydiscussing the associated implications for social impact creation, the study at hand extendsthe debate on global supply chains in informal markets.
The exploratory insights from this study can enable theory development and testing innew settings. In order to further understand how MNEs choose to structure their globalsupply chain activities, manage the integration of BOP actors and select the appropriatepartnership configurations, the theory of intermediation can be employed (Spulber, 1999).It can elucidate how MNEs decide whether integration of BOP actors will be done internallyor externally, depending on the capabilities of selected partners (intermediaries), buyers andsellers with the goal to minimize transaction costs (Kistruck et al., 2013). BOP settingsprovide a fertile ground for theory extension and refinement to account for social aspects asadditional goals and constraints for social supply chain structuring decisions.
The empirical findings provide implications and research impulses for the debate on thenecessity, the feasibilit, and the antecedents of supply chain inclusion of marginalized actorsin BOP markets. The empirical findings confirm the distinction between the single vs themultiple activities type of inclusion suggested by the literature (Nahi, 2016). In particular,studies adopting the perspective of global supply chains often focus on inclusion inparticular activities, e.g. distribution, sourcing (see Gold et al., 2013; Hall and Matos, 2010).The findings suggest that some (but not all) MSMEs tend to include BOP at all stages oftheir operations, and are thus truly inclusive. This may mean that for MNEs, supply chaininclusion is “a means to an end,” while for some MSMEs, it is “the end.” From theperspective of MNEs, close partnerships with this type of MSMEs for whom inclusivity is“the end,” would enable synergistic combinations of interests and resources.
While current work suggests that value chain inclusion may be needed to drive socialimpact and is not necessary for economic performance (e.g. Nahi, 2016), and the relationshipbetween value chain inclusion and economic performance in BOP is more complex whenconsidered with different time horizons. While in the short run, it may be more economicallyviable to engage in BOP markets through local stakeholders, in the long run, the socialrelationship developed between the enterprises and the local BOP may be an importantdriver of economic performance. This may be because a firm-driven value chain can enablethe development of local relationships, and current research shows that in informal markets,social relationships are essential and can influence buying patterns (London et al., 2014).
The insights from this study confirm previous literature findings that the supply chaininclusion of marginalized actors requires a collaborativemindset (Rivera-Santos and Rufín, 2010).
589
Supply chaininclusion

Regardless of the inclusion mechanism employed, the enterprises in this sample seem tocollaborate closely with both business and non-business partners and develop wide and diversestakeholder networks (Yunus et al., 2010). This seems plausible, given previous insightssuggesting that there are severe power and knowledge asymmetries between farmers andsupply chainmembers, distrust towardMNEs, and a lack of understanding of local technical andbusiness knowledge (Hall and Matos, 2010).
The findings reveal that in contrast to traditional supply chains, where the focus is onphysical flows and economic concerns (Bals and Tate, 2017), in the BOP context, managingdiverse logics and modus operandi is a key aspect. While traditional supply chains tend tobe inclusive in terms of various suppliers, BOP supply chains tend to include non-businesspartners. Companies need to work together with local non-business partners in order to gaina “license to operate” in informal markets, where governance is often based on social norms,religious beliefs, language and local structures (De Soto, 2000). The question then arises:how does the diversity of members in the supply chain impact the creation of socialimpact for the BOP communities? This urgent question can be answered by drawing ontraditional theories of resource dependency or structural holes (social network analysis)(Dyer et al., 2008). Therefore, our empirical, problem-driven study points out that BOPcontext can be a suitable empirical context for theory development and refinement efforts, inparticular resource-based view, relational view or social network analysis.
This study also entails several limitations that open up avenues for further research.First, all data for clustering variables and external variables have been collected throughone survey and rather small sample. This methodological limitation may present biases inthe data collection processes. In order to account for limitations inherent to the data set, theinterpretation of the clusters draws on insights from the literature. Further research can beconducted in the form of empirical studies, specific to certain regions or countries, in order togeneralize our insights or explore in-depth different mechanisms of supply chain inclusion,their antecedents, processes and consequences for social impact.
Second, this study treats the entire BOP population as monolithic and ignores theheterogeneous nature of BOP across different contexts. Nevertheless, this study is valuablebecause it provides an avenue for segmenting the BOP market and relevant initiatives forfurther, targeted empirical studies. Further research can focus on particular groups of BOPmarkets to investigate the role of contextual factors, such as level of discrimination,economic exclusion and institutional environment. Moreover, studies of other groups ofmarginalized actors (e.g. women, disabled youth) can enable generalization of insightsacross different groups of marginalized actors.
Third, this study has not addressed directly and empirically the relationship betweeninclusion and social impact. Further research should investigate key questions such as howthe inclusion enables social impact creation in the long-term and who benefits from theinclusion and how (George et al., 2012). Furthermore, it is important to explore how differentstructures of global and local value chain configurations influence social impact creation.Understanding social impact and different inclusion mechanisms is important, becauseinclusion in BOP markets presents important exploitation risks, where companies canintensify social exclusion, marginalization and inequality (Zwick et al., 2008). Furtherresearch should investigate whether there are differences between the levels ofinclusiveness and the relationship between social impact and other types of sustainableimpact, i.e. economic and environmental. The underlying tenet of inclusive innovation(and development) is the engagement of firms in social innovation activities “to connectdisenfranchised individuals and communities with opportunities that foster social andeconomic growth” (George et al., 2012, p. 662). Similarly, the inclusion of marginalized actorsin supply chains can open up new avenues for research in emerging and developingeconomies with a focus on social innovation, responsibility and shared-value creation
590
IJPDLM49,5

between stakeholders (Lee and Tang, 2017). It can also set new industry trends and normsin managerial practice.
The findings provide several important implications for practice, society and policy.From a practice perspective, the study offers insights for MSMEs and MNEs. The studypoints out valuable mechanisms which MSMEs with limited resources and diverse supplychain partners can employ to effectively manage their supply chains. MSMEs need to maketwo important decisions to include BOP actors in their operations, namely selection of directand indirect mechanisms as well as optimal diversity of supply chain partners. Both decisionscan have important implications for supply chain complexity and social impact creation.For managers of MNEs, the study hints toward potential partnerships with synergistic effectswhich can support MNEs in their efforts to create opportunities and social impact formarginalized actors. For society in general and policy in particular, involvement of BOP actorsand non-business actors, especially NGOs, can be assessed and supported in more nuancedways. A better understanding of what kind of partnership is needed shows the way forimplementing better support structures for a range of inclusion formats.
Notes
1. We adopt the definition of MSMEs from the European Union (2003) which defines MSMEs asenterprises with fewer than 250 employees.
2. Examples of such databases include IBA ventures, 2SCALE, SEED, Change Makers, PractitionersHub for Inclusive Business, Siemens Stiftung, Ashden Awards, UNDP, Intellecap ImpactInvestment Network, USAID, UKAID, AEC Africa, Venture Capital for Africa, Sankalp Awardsand Ventures, VC4A, etc. These platforms list and continuously update their websites withnumerous BOP enterprises from around the world as part of different initiatives related to awards,showcasing of best practices and innovations, marketing and investment match-making.
3. For each instrument adopted/inspired from the literature, an exploratory factor analysis (EFA) hasbeen conducted in SPSS V23 following the guidelines of Field (2005) and obtained a good two-factor solution, consistent with the two instruments from the literature. There was one item frominstrument B which loaded on both factors: “Consumers have a high level of participation in ourvalue creation activities.” Since, conceptually, there was indeed overlap between this item and theother items from instrument A, this item was removed.
4. The Jaccard similarity index (coefficient) is a measure of similarity between two samples (or datasets) and the values ranges between 0 and 100 percent. The percentages are easy to interpret: thelarger the percentages, the more similar the two data sets are.
5. Gabriel’s test is a post hoc test that uses the assumption of local homogeneity of variances. Theprocedure is also known to have greater power when sample sizes are unequal (Field, 2013).
6. Games–Howell is a post hoc test, where homogeneity of variances cannot be assumed, and it seemsto offer the best performance (Field, 2013).
7. Levene’s test of homogeneity of variances assesses the assumption that variances of thepopulations from which different samples are drawn are equal. In this study, this assumptionneeds to be tested in order to determine the selection of post hoc techniques.
8. Cramér’s V index is a measure of association between two variables and it results in a valuebetween 0 and 1, where a value closer to 1 translates into higher association.
References
Armstrong, J.S. and Overton, T.S. (1977), “Estimating nonresponse bias in mail surveys”, Journal ofMarketing Research, Vol. 14 No. 3, pp. 396-402.
Bals, l. and Tate, W.L. (2017), “Sustainable supply chain design in social businesses: advancing thetheory of supply chain”, Journal of Business Logistics, Vol. 39 No. 1, pp. 57-79.
591
Supply chaininclusion
Bendul, J.C., Rosca, E. and Pivovarova, D. (2016), “Sustainable supply chain models for base of thepyramid”, Journal of Cleaner Production, Vol. 162, Supplement, pp. 107-120.
Black, T.R. (1999), Doing Quantitative Research in the Social Sciences: An Integrated Approach toResearch Design, Measurement and Statistics, Sage, London.
Brix-Asala, C., Hahn, R. and Seuring, S. (2016), “Reverse logistics and informal valorisation at the baseof the pyramid: a case study on sustainability synergies and trade-offs”, European ManagementJournal, Vol. 34 No. 4, pp. 414-423.
Brusco, M.J., Singh, R., Cradit, J.D. and Steinley, D. (2017), “Cluster analysis in empirical OM research:survey and recommendations”, International Journal of Operations & Production Management,Vol. 37 No. 3, pp. 300-320.
Caliński, T. and Harabasz, J. (1974), “A dendrite method for cluster analysis”, Communications inStatistics-theory and Methods, Vol. 3 No. 1, pp. 1-27.
Carter, C.R. and Rogers, D.S. (2008), “A framework of sustainable supply chain management: movingtoward new theory”, International Journal of Physical Distribution & Logistics Management,Vol. 38 No. 5, pp. 360-387.
Chan, K.W., Yim, C.K. and Lam, S.S. (2010), “Is customer participation in value creation a double-edgedsword? Evidence from professional financial services across cultures”, Journal of Marketing,Vol. 74 No. 3, pp. 48-64.
Davis, G.F. and Marquis, C. (2005), “Prospects for organization theory in the early twenty-first century:institutional fields and mechanisms”, Organization Science, Vol. 16 No. 4, pp. 332-343.
De Beule, F. and Verwaal, E. (2014), “Does the quality of institutions impact the profit motive to dogood for the poor? A contingent resource-based view on inclusive strategies at the ‘base of thepyramid’ ”, Technology: Corporate and Social Dimensions; Annual Conference: Technology:Corporate and Social Dimensions, Bangalore, pp. 357-388.
De Soto, H. (2000), “The mystery of capital: why capitalism triumphs in the West and fails everywhereelse”, Canadian Journal of Latin American and Caribbean Studies, Vol. 27 No. 53, pp. 172-174.
Dyer, J.H., Singh, H. and Kale, P. (2008), “Splitting the pie: rent distribution in alliances and networks”,Managerial and Decision Economics, Vol. 29 Nos 2-3, pp. 137-148.
European Union (2003), “What is an SME?”, available at: http://ec.europa.eu/growth/smes/business-friendly-environment/sme-definition_en (accessed June 4).
Fawcett, S.E. and Waller, M.A. (2015), “Designing the supply chain for success at the bottom of thepyramid”, Journal of Business Logistics, Vol. 36 No. 3, pp. 233-239.
Ferreira, L. and Hitchcock, D.B. (2009), “A comparison of hierarchical methods for clustering functionaldata”, Communications in Statistics – Simulation and Computation, Vol. 38 No. 9, pp. 1925-1949.
Field, A. (2005), Discovering Statistics with SPSS, Sage, London.
Field, A.P. (2013), Discovering Statistics Using IBM SPSS Statistics, Sage, London.
George, G., McGahan, A.M. and Prabhu, J. (2012), “Innovation for inclusive growth: towards atheoretical framework and a research agenda”, Journal of Management Studies, Vol. 49 No. 4,pp. 661-683.
Gereffi, G. and Lee, J. (2012), “Why the world suddenly cares about global supply chains”, Journal ofSupply Chain Management, Vol. 48 No. 3, pp. 24-32.
Gold, S., Hahn, R. and Seuring, S. (2013), “Sustainable supply chain management in ‘base of thepyramid’ food projects – a path to triple bottom line approaches for multinationals?”,International Business Review, Vol. 22 No. 5, pp. 784-799.
Hahn, R. and Gold, S. (2014), “Resources and governance in ‘base of the pyramid’ – partnerships:assessing collaborations between businesses and non-business actors”, Journal of BusinessResearch, Vol. 67 No. 7, pp. 1321-1333.
Hall, J. and Matos, S. (2010), “Incorporating impoverished communities in sustainable supply chains”,International Journal of Physical Distribution & Logistics Management, Vol. 40 Nos 1/2, pp. 124-147.
592
IJPDLM49,5

Hambrick, D.C. (1983), “An empirical typology of mature industrial-product environments”, Academyof Management Journal, Vol. 26 No. 2, pp. 213-230.
Hart, S., Sharma, S. and Halme, M. (2016), “Poverty, business strategy, and sustainable development”,Organization & Environment, Vol. 29 No. 4, pp. 401-415.
Hart, S.L. and Sharma, S. (2004), “Engaging fringe stakeholders for competitive imagination”, Academyof Management Executive, Vol. 18 No. 1, pp. 7-18.
Heeks, R. (2014), “From the MDGs to the post-2015 agenda: analysing changing development priorities”,IDPM Development Informatics Working Paper No.56, University of Manchester, Manchester.
Heeks, R., Foster, C. and Nugroho, Y. (2014), “New models of inclusive innovation for development”,Innovation & Development, Vol. 4 No. 2, pp. 175-185.
Hennig, C. (2007), “Cluster-wise assessment of cluster stability”, Computational Statistics & DataAnalysis, Vol. 52 No. 1, pp. 258-271.
Karnani, A. (2007), “The mirage of marketing to the bottom of the pyramid: how the private sector canhelp alleviate poverty”, California Management Review, Vol. 49 No. 4, pp. 90-111.
Ketchen, D.J. Jr and Shook, C.L. (1996), “The application of cluster analysis in strategic managementresearch: an analysis and critique”, Strategic Management Journal, Vol. 17 No. 6, pp. 441-458.
Kistruck, G.M., Beamish, P.W., Qureshi, I. and Sutter, C.J. (2013), “Social intermediation in base-of‐the-pyramid markets”, Journal of Management Studies, Vol. 50 No. 1, pp. 31-66.
Kolk, A., Rivera-Santos, M. and Rufín, C. (2014), “Reviewing a decade of research on the ‘base/bottom ofthe pyramid’(BOP) concept”, Business & Society, Vol. 53 No. 3, pp. 338-377.
Lattin, J.M., Carroll, J.D. and Green, P.E. (2003), Analyzing Multivariate Data, Thomson Brooks/Cole,Pacific Grove, CA.
Lau, A.K., Tang, E. and Yam, R. (2010), “Effects of supplier and customer integration on productinnovation and performance: empirical evidence in Hong Kong manufacturers”, Journal ofProduct Innovation Management, Vol. 27 No. 5, pp. 761-777.
Le Ber, M.J. and Branzei, O. (2010), “(Re) forming strategic cross-sector partnerships relationalprocesses of social innovation”, Business & Society, Vol. 49 No. 1, pp. 140-172.
Lee, H.L. and Tang, C.S. (2017), “Socially and environmentally responsible value chain innovations: newoperations management research opportunities”, Management Science, Vol. 64 No. 3, pp. 983-996.
London, T. (2009), “Making better investments at the base of the pyramid”, Harvard Business Review,Vol. 87 No. 5, pp. 106-113.
London, T., Anupindi, R. and Sheth, S. (2010), “Creating mutual value: lessons learned from venturesserving base of the pyramid producers”, Journal of Business Research, Vol. 63 No. 6, pp. 582-594.
London, T., Esper, H., Grogan‐Kaylor, A. and Kistruck, G.M. (2014), “Connecting poverty to purchase ininformal markets”, Strategic Entrepreneurship Journal, Vol. 8 No. 1, pp. 37-55.
Mair, J., Battilana, J. and Cardenas, J. (2012), “Organizing for society: a typology of socialentrepreneuring models”, Journal of Business Ethics, Vol. 111 No. 3, pp. 353-373.
Mair, J., Martí, I. and Ventresca, M.J. (2012), “Building inclusive markets in rural Bangladesh:how intermediaries work institutional voids”, Academy of Management Journal, Vol. 55 No. 4,pp. 819-850.
Matos, S. and Hall, J. (2007), “Integrating sustainable development in the supply chain: the case of lifecycle assessment in oil and gas and agricultural biotechnology”, Journal of OperationsManagement, Vol. 25 No. 6, pp. 1083-1102.
Möllering, G. (2003), “A typology of supplier relations: from determinism to pluralism in inter-firmempirical research”, Journal of Purchasing and Supply Management, Vol. 9 No. 1, pp. 31-41.
Nahi, T. (2016), “Cocreation at the base of the pyramid: reviewing and organizing the diverseconceptualizations”, Organization & Environment, Vol. 29 No. 4, pp. 416-437.
Olsen, M. and Boxenbaum, E. (2009), “Bottom-of-the-pyramid: organizational barriers toimplementation”, California Management Review, Vol. 51 No. 4, pp. 100-125.
593
Supply chaininclusion

Parmigiani, A. and Rivera-Santos, M. (2015), “Sourcing for the base of the pyramid: constructingsupply chains to address voids in subsistence markets”, Journal of Operations Management,Vols 33-34, pp. 60-70.
Parmigiani, A., Klassen, R.D. and Russo, M.V. (2011), “Efficiency meets accountability: performanceimplications of supply chain configuration, control, and capabilities”, Journal of OperationsManagement, Vol. 29 No. 3, pp. 212-223.
Perez-Aleman, P. and Sandilands, M. (2008), “Building value at the top and the bottom of theglobal supply chain: MNC-NGO partnerships”, California Management Review, Vol. 51 No. 1,pp. 24-49.
Prahalad, C.K. (2012), “Bottom of the pyramid as a source of breakthrough innovations”, Journal ofProduct Innovation Management, Vol. 29 No. 1, pp. 6-12.
Prahalad, C.K. and Hart, S.L. (2002), “The fortune at the bottom of the pyramid”, Strategy and Business,Vol. 20 No. 26, pp. 1-13.
Rivera-Santos, M. and Rufín, C. (2010), “Global village vs. small town: understanding networks at thebase of the pyramid”, International Business Review, Vol. 19 No. 2, pp. 126-139.
Rosca, E. and Bendul, J.C. (2018), “Value chain integration of base of the pyramid consumers: anempirical study of drivers and performance outcomes”, International Business Review, Vol. 28No. 1, pp. 162-176.
Rosca, E., Reedy, J. and Bendul, J.C. (2017), “Does frugal innovation enable sustainable development?A systematic literature review”, The European Journal of Development Research, Vol. 30 No. 1,pp. 136-157.
Seelos, C. and Mair, J. (2007), “Profitable business models and market creation in the contextof deep poverty: a strategic view”, The Academy of Management Perspectives, Vol. 21 No. 4,pp. 49-63.
Simanis, E. and Hart, S.L. (2008), The Base of the Pyramid Protocol: Toward Next Generation BoPStrategy (Version 2.0), Cornell University, Ithaca, NY.
Sodhi, M.S. and Tang, C.S. (2011), “Social enterprises as supply-chain enablers for the poor”,Socio-Economic Planning Sciences, Vol. 45 No. 4, pp. 146-153.
Sodhi, M.S. and Tang, C.S. (2016), “Supply chain opportunities at the bottom of the pyramid”,Decision, Vol. 43 No. 2, pp. 125-134.
Spulber, D.F. (1999), Market Microstructure: Intermediaries and the Theory of the Firm, CambridgeUniversity Press, Cambridge.
Venn, R. and Berg, N. (2013), “Building competitive advantage through social intrapreneurship”,South Asian Journal of Global Business Research, Vol. 2 No. 1, pp. 104-127.
Yunus, M., Moingeon, B. and Lehmann-Ortega, L. (2010), “Building social business models: lessonsfrom the Grameen experience”, Long Range Planning, Vol. 43 No. 2, pp. 308-325.
Zwick, D., Bonsu, S.K. and Darmody, A. (2008), “Putting consumers to work: co-creation and newmarketing govern-mentality”, Journal of Consumer Culture, Vol. 8 No. 2, pp. 163-196.
594
IJPDLM49,5

Appendix 1. Descriptive statistics of the sample
5%
21%
31%26%
17%
0%
5%
10%
15%
20%
25%
30%
35%
Less than 1 year Between 1 and 2years
Between 3 and 5years
Between 5 and 10years
More than 10years
Note: n=134 (in %)
Figure A1.Age, in years
595
Supply chaininclusion

43%
32%
16%
9%
0%
5%
10%
15%
20%
25%
30%
35%
40%
45%
50%
Africa Asia Central andSouth America
Others (EasternEurope, Global
reach)
Note: n=134 (local branches) (in %)
Figure A2.Location of MSME
596
IJPDLM49,5
Appendix 2. Items used to operationalize behavioral and value chain inclusion
Items: A. Value chain inclusion, Cronbach’s α¼0.785
• A1: our enterprise performs joint product/service innovation with consumers (e.g. regularmeetings, workshops);
• A2: our enterprise performs joint sourcing and raw materials acquisition with consumers(e.g. sourcing from local suppliers);
• A3: our enterprise performs joint product and service provision activities with consumers(e.g. local actors’ employment);
• A4: our enterprise performs joint distribution, customer service and return activities withconsumers (e.g. door-to-door deliveries); and
• A5: our enterprise performs joint promotional activities with consumers (e.g. local training).
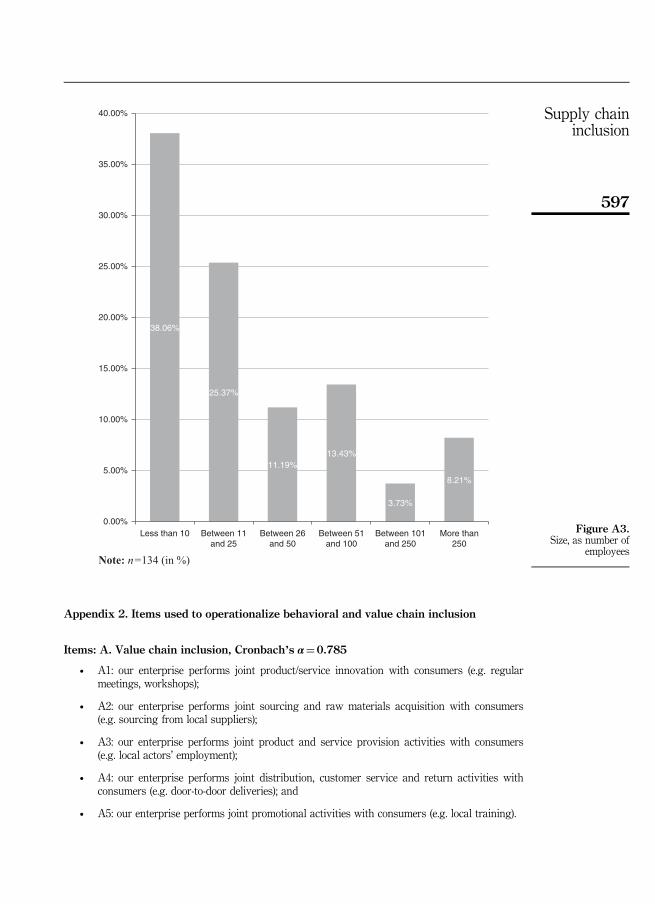
38.06%
25.37%
11.19%13.43%
3.73%
8.21%
Less than 10 Between 11and 25
Between 26and 50
Between 51and 100
Between 101and 250
More than250
0.00%
5.00%
10.00%
15.00%
20.00%
25.00%
30.00%
35.00%
40.00%
Note: n=134 (in %)
Figure A3.Size, as number of
employees
597
Supply chaininclusion

Items: B. Behavioral inclusion, Cronbach’s α¼0.874
• B1: consumers spend a lot of time-sharing information about their needs and opinions withour employees;
• B2: consumers put a lot of effort into expressing their personal needs to our employees; and
• B3: consumers always provide suggestions to our employees for improving the products andservices that we offer.
Appendix 3
Corresponding authorEugenia Rosca can be contacted at: [email protected]
ID/ID 1 2 3 4 5 6 7 8 9 10 11 12 13 14 15
1 0.002 4.79 0.003 4.47 4.59 0.004 4.83 5.18 5.80 0.005 4.10 3.16 4.65 4.11 0.006 1.95 4.75 4.39 3.72 4.29 0.007 4.97 3.75 4.42 4.92 4.88 4.36 0.008 5.82 3.82 4.99 7.98 5.54 6.41 5.23 0.009 5.65 3.33 5.11 7.53 5.54 6.01 5.09 3.58 0.0010 3.72 3.00 4.66 6.26 4.18 4.30 3.92 3.09 3.75 0.0011 4.64 5.18 6.94 4.49 5.15 3.79 4.62 7.58 7.29 5.05 0.0012 5.90 4.55 5.53 7.36 5.14 6.33 6.25 4.44 4.16 4.82 8.05 0.0013 6.10 6.40 7.69 5.04 6.57 5.37 6.21 8.92 7.92 6.93 5.12 7.80 0.0014 4.27 5.30 4.24 6.42 5.13 5.15 5.14 4.57 5.61 4.56 7.47 5.46 8.13 0.0015 2.68 4.41 3.73 3.24 3.91 1.93 3.53 5.96 6.05 4.37 4.31 6.22 5.66 4.11 0.00Note: A full version is available upon request
Table AI.Distance matrix forthe first 15observations
For instructions on how to order reprints of this article, please visit our website:www.emeraldgrouppublishing.com/licensing/reprints.htmOr contact us for further details: [email protected]
598
IJPDLM49,5