supplier evaluation and performance of large food …
TRANSCRIPT

SUPPLIER EVALUATION AND PERFORMANCE OF LARGE
FOOD AND BEVERAGE MANUFACTURING FIRMS IN
NAIROBI, KENYA
By
Kamenya Rose Bosibori: D61/72688/2012
A Research Project submitted in Partial Fulfillment of the
Requirements for the Degree of Master of Business Administration,
School of Business, University of Nairobi
November, 2014.

ii
DECLARATION
I declare that this research project is my original work and has never been submitted to any other
university for assessment or award of a degree.
Signature…………………………….. Date………………………………
Rose Bosibori Kamenya
D61/72688/2012
This project has been submitted for examination with my approval as The University supervisor.
Signature…………………………….. Date…………………………………
Kariuki C. Ngugi
Lecturer, Department of Management Science

iii
DEDICATION
To my late father Kamenya Morata who this study would have made so happy and mom Kerubo,
my sons Brian, Gavin and Kamenya whose time I used for the study.

iv
ACKNOWLEDGEMENT
I thank the Almighty God for the good health throughout the journey of this study .I also wish to
acknowledge the lecturers at The University of Nairobi, School of Business and especially my
supervisor Kariuki C. Ngugi for his unwavering guidance. My gratitude to my husband Peterson
Gwaro for his moral and financial support not forgetting my friends for their encouragement.
Finally I wish to thank the organizations that cooperated with me by filling the questionnaires.
Thank you and God bless you all.

v
TABLE OF CONTENTS
DECLARATION........................................................................................................................... ii
DEDICATION.............................................................................................................................. iii
ACKNOWLEDGEMENT ........................................................................................................... iv
LIST OF TABLES ...................................................................................................................... vii
LIST OF FIGURE ...................................................................................................................... vii
ABSTRACT .................................................................................................................................. ix
CHAPTER ONE: INTRODUCTION ..........................................................................................1
1.1 Background of the study ............................................................................................................1
1.2 Statement of the Problem ...........................................................................................................4
1.3 Objectives of the Study ..............................................................................................................6
1.4 Importance of the Study .............................................................................................................6
CHAPTER TWO: LITERATURE REVIEW .............................................................................8
2.1 Introduction ................................................................................................................................8
2.2 Supplier Evaluation ....................................................................................................................8
2.3 Organizational Performance ....................................................................................................13
2.4 Supplier Evaluation and Organizational Performance .............................................................16
2.5 Summary and Conceptual Framework.....................................................................................18
CHAPTER THREE: RESEARCH METHODOLOGY ..........................................................21
3.1 Research Design.......................................................................................................................21
3.2 Population ................................................................................................................................21
3.3 Sampling ..................................................................................................................................21
3.4 Data collection .........................................................................................................................21
3.5 Data Analysis ...........................................................................................................................22
CHAPTER FOUR: DATA ANALYSIS AND FINDINGS.......................................................23
4.1 Introduction ..............................................................................................................................23
4.2 Supplier evaluation criteria ......................................................................................................24
4.3 Organizational Performance ....................................................................................................25
4.4 Supplier evaluation criteria and performance ..........................................................................26
4.5 Discussion of Results ...............................................................................................................29

vi
CHAPTER FIVE: CONCLUSIONS AND RECOMMENDATIONS ....................................32
5.1 Introduction ..............................................................................................................................32
5.2 Conclusions ..............................................................................................................................32
5.3 Recommendations ....................................................................................................................32
5.4 Limitations of the study ...........................................................................................................33
5.5 Suggestions for Further Research ............................................................................................33
REFERENCES .............................................................................................................................34
APPENDICES ..............................................................................................................................37
Appendix I: Letter of Introduction .................................................................................................37
Appendix II: Questionnaire............................................................................................................38
Appendix III: Large Food and Beverage manufacturers in Nairobi .............................................41

vii
LIST OF TABLES
Table 4.1: Organizational evaluation of suppliers ........................................................................23
Table 4.2: Supplier evaluation period ...........................................................................................24
Table 4.3: Supplier evaluation criteria ..........................................................................................24
Table 4.4: Organizational Performance ........................................................................................25
Table 4.5: Summary data for performance and supplier evaluation criteria.................................27
Table 4.6: Correlation Analysis ....................................................................................................28
Table 4.7: Regression Analysis.....................................................................................................29

viii
LIST OF FIGURE
Figure 2.1: Conceptual Framework ...............................................................................................20

ix
ABSTRACT
This study was carried out to determine the relationship between supplier evaluation and
performance in large food and beverage manufacturing firms in Nairobi City County. The study
had three objectives, to establish the criteria used in evaluating suppliers, to establish the
performance levels and determine the relationship between supplier evaluation and performance.
The research design adopted was the descriptive. The study targeted all the 46 food and
beverage firms which were all sampled since it was a census. 27 successfully filled and returned
the questionnaires that were used for analysis. The questionnaires were administered through
drop and pick later method. Standard deviations and means were used to analyze objective one
and two whereas and correlation and regression analyses were used to determine the relationship
between supplier evaluation and performance in large food and beverage manufacturing firms in
Nairobi City County. The results are presented in tables.
The results show that food and beverage firms evaluate their suppliers. There is a positive
relationship between performance and the supplier evaluation criteria. Environmental
friendliness of the supplier, employee capabilities of the supplier and price factors are significant
while financial stability, quality issues, supplier’s organizational culture, production capacity of
the supplier and preference and reservation are insignificant.
The researcher recommends that supplier evaluation should be practiced in food and beverage
firms because it is associated with better performance at the same time other firms outside this
sector should be studied to ascertain whether the trend holds. Further research could also be
necessary in seeking to know why some criteria are insignificant.

1
CHAPTER ONE: INTRODUCTION
1.1 Background of the study
Supplier evaluation is a field that continues to attract significant focus in supply chain
management literature with effective evaluation and selection of suppliers considered to be one
of the critical roles of procurement officers (Narasimhan et al., 2001). A number of parameters
exist for the evaluation and selection of suppliers which include: quality, price, and on-time
delivery (Ning Pi et al., 2005). According to Lysons et al., (2008) suppliers can be appraised on
eight areas, namely: finance, production capacity, human resource, quality, performance,
environmental and ethical considerations, and organizational structure. The appraisal criteria is
summarized by Carter as the ‘seven Cs’ which represent: competency, capacity, commitment,
control systems, cash resources and financial stability, cost commensurate with quality and
service and consistency (CIPS, 2012).
The performance of suppliers substantially impacts on the efficiency and effectiveness of the
buying firm and is of great importance (Fredriksson et al., 2011). According to Handfield et al.,
(2009), one reason for supplier selection is that of product development process, meaning that as
the product development cycle reduces suppliers are also required to reduce the delivery cycle or
else competent ones will be sought for and those that do not meet the criteria set by firms are
supposed to be weeded out (Trevelen 1987). Dwyer (1993) is in agreement with Trevelen. He
argues that the goal of supplier evaluation is to secure valued resources and technologies of the
selected suppliers in situations that preclude the option of vertical integration due to resource
limitations and managerial constraints. Apart from being able to harness the strengths and skills
of suppliers to their advantage firms that conduct supplier evaluation also benefit from improved
quality and process performance and continuous cost reductions (Newman, 1988).
The Kenyan food-processing sector remains the largest component of the manufacturing industry
in terms of structure, economic contributions, and performance within the manufacturing sector
(KAM, 2014). However, according to the Kenya National Bureau of Statistics (KNBS, 2009),
the sector is contracting despite the fact that it still generates over a third (33.4 per cent) of the
total manufacturing production, and provides 89,319 jobs. The abstract blames the contraction on

2
high production and ingredient costs. With these and many other challenges the companies need
to evaluate their suppliers (Narasimhan et al., 2004)
1.1.1 Supplier Evaluation
According to Dobos et al., (2012), supplier evaluation is a management activity with the primary
aim of acquiring information to analyze and to manage supplier relationships and supply
situations. The process entails the simultaneous consideration of a number of critical supplier
performance features that include price, delivery lead-times, and quality (Narasimhan et al.,
2001.) The importance of supplier selection is seen from its impact on overall firm performance
and, more particularly, on finished product features such as cost, design, new product
development, quality, among other effects (Handfield et. al, 2009; Newman, 1988).
Current increased government regulations, a rapidly growing environmental awareness among
customer and increased competition drive companies to undertake initiatives to transform their
supply chain processes and their suppliers work (Nordling et al., 2010). The traditional approach
of supplier selection used to consider multiple suppliers and one main selection criterion, the
price. However, the market has moved towards contracting a single supplier selected by means
of a multiple criteria (Gallego et al., 2011). This trend makes the importance of objective
evaluation of supplier performance higher since a long-term supplier strategy is not only
important for an organization’s development and profitability but is also a crucial part of the
overall business strategy (Nordling et al., 2010).
A supplier in the current market often needs to fulfill requirements other than just those
concerning material and service, such as requirements that prove the supplier’s capability and
suitability to live up to a company’s long-term requirements and needs. It is vital to assure that
the supplier can guarantee sustained continuity of supply and to be aware of its performance,
strengths and weaknesses. Through implementing a structured approach gathering data of
supplier performance strict agreements can be negotiated about improving reject rates, reducing
total lead time and contributing to cost reduction (Nordling et al., 2010). According to Lysons et
al., (2008), what to appraise is related to the needs of a particular purchase. Lysons, however,
identifies eight major common supplier evaluation criteria including: finance, production
capacity, human resource, quality, performance, environmental and ethical considerations, and
organizational structure.

3
1.1.2 Organizational Performance
Performance is the level to which a supply chain fulfills the objectives of dependability, cost
speed, quality, and flexibility (Slack, 2007). The importance of supplier selection can be drawn
from its effect on firm performance and, more particularly, on final product features such as cost,
design, manufacturability, quality and so on (Narasimhan et al., 2004). Narasimhanfurther argues
that strategic evaluation of supplier performance helps buying organizations in improving their
operations in a number of ways including: aiding in supplier process improvement, which in turn
enhances firm’s overall performance; allows for optimal allocation of resources for supplier
development programs; and helps managers in re-engineering their supplier network on the basis
of performance.
Supplier performance measures, too, help improve efficiency and effectiveness of supply chain
(Handfield et al., 2008). As Lysons et al., (2009) points out financial and non-financial
performance measures which include: quality, time/ responsiveness, innovation, physical
environment and safety price performance, cost-effectiveness, revenue, administration
efficiency, internal customer satisfaction, supplier performance and strategic performance .
According to (Myla, 2010) organizational performance can be indicated by the cost effective
control alternatives applied to rectify cost inefficiencies or, in short, minimize costs while
maximizing profits. She further points out that the cost control initiatives should not impact the
customer’s perceived value, nor should they run afoul of safety laws.
1.1.3 Food and Beverage Firms in Nairobi
The food and beverage industry can be defined as the preparation of food and drink products for
sale and consumption. It involves the product research and design, testing sourcing of
ingredients, processing, and preservation, packaging and marketing (Villinus 2008). According
to the European e-business Market Watch (2005), the industry is divided into nine sub groups
including: meat, fish, fruit and vegetables, fats, dairy products, grain mill and starch products,
beverages and animal feed. The industry has a unique role to play in expanding economic
opportunities because it is universal to life and health (Krishnaswamy, 2007).
According to the Food and Beverage industry Global Report(2010), Europe accounts for the
largest share in the global food and beverage industry, generating revenues of $1.4 trillion in

4
2007 and employing 4 million workers, followed by the US, which contributed $1 trillion. In
Kenya the food-processing sector, including food, beverages and tobacco, remains the largest
component of the manufacturing industry in terms of structure, economic contributions, and
performance within the manufacturing sector, as it comprises of 1,200 businesses, encompassing
everything from small family organizations to large companies (KAM, 2014). Large firms are
those with a turnover of £ 5.75 million per annum or employ more than 250 employees
(www.investorwords.com).
(KAM,2013) indicates that there are 46 large food and beverage manufacturing firms in Nairobi
classified in terms of bottled water, carbonated drinks, food, herbs and spices, tobacco, and wine
and beer. The industry is of even more significance in developing countries where Agriculture
seems to be dominant in almost all sectors of the economy (Krishnaswamy, 2007).
The industry is affected by many challenges including the economic slump, rising food prices,
increasing transportation costs due to a rise in oil prices, and decline in consumers (Food and
Beverage Industry Global Report (2010). According to the Kenya National Bureau of Statistics
(2009) Statistical Abstract, in 2008, the sector declined by 3.9 percent from 2007, but still
generated over a third (33.4 per cent) of the total manufacturing production, and provided 89,319
jobs. High production and ingredient, high duty on inputs, duplication of laws and regulatory
agencies, competition from sectoral association, inadequate supplies of raw materials, high
material handling, distribution and marketing costs, slow development and implementation of
policies, and the use of obsolete technology and skills were partially blamed for this contraction
(KAM, 2014). With these and many other challenges the companies need to evaluate their
suppliers. The goal of supplier evaluation is to secure valued resources and technologies of the
selected suppliers in situations that preclude the option of vertical integration due to resource
limitations and managerial constraints (Dwyer, 1993).
1.2 Statement of the Problem
Selecting the most appropriate source of supplies has long been regarded as one of
procurement’s most important functions (Ogden et al., 2008). Organizations are therefore
moving from the adversarial kind of transactions to the use of a few qualified suppliers with
close relationships, a trend attributed to: the customers’ demand for higher quality; wider range

5
of products; shorter time to market; and faster deliveries (Karlsson, et al., 2011).The food and
beverage industry plays a unique role in expanding economic opportunities because it is
universal to life and health (Krishnaswamy, 2007).
However, the industry’s performance is below bar in Nairobi and is facing intense competition
from the imported food stuffs from overseas (Okello et al., 2014). To tackle these challenges the
food and beverage industry needs to evaluate their suppliers. The criticality of supplier selection
is evident from its impact on firm performance and, more specifically, on final product attributes
such as cost, design, manufacturability, quality, and so forth (Handfield et al., 2009).
A number of studies have been conducted on supplier evaluation. A study by Ho et al., (2007)
looked at Supplier Evaluation and Selection Criteria in the Construction Industry of Taiwan and
Vietnam and found out that non-quantifiable criteria play a very important role in the selection
process and that the construction companies of Taiwan and Vietnam have come to an agreement
in most of the appraisal criteria which include: product quality, product availability, delivery
reliability, product performance, product cost and service after sale. The study did not however
look at the relationship between evaluation and buyer performance. Other studies focused on
functions in the buying organization that are involved in the evaluation of supplier performance.
One such study was in the electronics industry in the USA where it was observed that
purchasing, engineering, and production/operations, R&D, and finance were the functions mostly
involved in evaluation (Pearson and Ellram, 1995). The study however falls short of looking at
the relationship between supplier evaluation and buyer performance.
Studies by Thairu et al., (2012) looked into what the traders in Dagoreti market, in Kiambu,
Kenya, thought about the concept of supplier appraisal and whether they practiced it. The study
found out that the traders considered location of supplier, adequate facilities, use of information
technology, financial strength, quality in operations and products, adequate production capacity,
and skilled personnel, corporate social responsibility and good ethics and environmental
friendliness as important supplier evaluation criteria. The study however did not look at the
relationship between supplier appraisal and performance. The researchers recommended that
further studies need to be carried out to find out the causal relationship between supplier
evaluation and performance of retail trader, a gap that this study would wish to fill. Studies by
Okello et al., (2014) focused on the influence of supply chain management practices of the

6
Nairobi Securities Exchange’s listed food and beverage manufacturing firms in Nairobi and
found out that product development processes, inventory management, lead time, technology and
innovation have a significant effect on performance of food and manufacturing firms in Nairobi.
The studies reviewed did not look at supplier evaluation as one of the supply chain management
practices that may affect performance of the food and beverage industry and the interest of this
study to find out whether this has an influence on performance of the firms. It is on this basis
that the study will seek to find out the relationship between supplier evaluation and buyer
performance. The study will seek to answer the following study question: which criteria are used
to evaluate suppliers in the large food and beverage manufacturing companies in Nairobi? what
are the performance levels of firms in the large food and beverage manufacturing firms in
Nairobi? what is the relationship between supplier evaluation and performance of large food and
beverage manufacturing firms in Nairobi?
1.3 Objectives of the Study
The objectives of the study are:
i. To establish the criteria used to evaluate suppliers in the large food and beverage
manufacturing companies in Nairobi City County
ii. To establish the performance levels of large food and beverage manufacturing firms in
Nairobi City County
iii. To determine the relationship between supplier evaluation and performance of large food
and beverage manufacturing firms in Nairobi City County
1.4 Importance of the Study
The study will be of importance to consumers of goods and services of the food and beverage
firms, in Nairobi, Kenya in three ways: price, delivery, and quality. Customers pay for value of
goods and services and for them to be satisfied there must be some form of utility. The study will
offer alternatives that will make firms improve customer service.
Food and beverage firms would use the findings and recommendations of this study to evaluate
their suppliers. Many supplier evaluation methods will be brought out and will be of significance
to buyers that have hitherto, not been evaluating suppliers.

7
The study will add to existing literature in the field of procurement and supply chain
management. Other scholars may validate the findings and use the study as a reference text.
Other researchers and institutions may follow the areas recommended for further research as a
means of increasing knowledge on supplier evaluation.

8
CHAPTER TWO: LITERATURE REVIEW
2.1 Introduction
This chapter will review some of the studies that have been conducted in the area of supplier
appraisal. It will seek to discuss: the criteria for supplier selection, performance, the relationship
between supplier appraisal and buyer performance and the conceptual framework.
2.2 Supplier Evaluation
Supplier evaluation is a management activity whose primary aim is acquiring information to
analyze and to manage supplier relationships and supply situations (Dobos et al., 2012). The
process entails the simultaneous consideration of a number of critical supplier performance
features that include price, delivery lead-times, and quality (Narasimhan et al., 2001.) The
importance of supplier selection is evident from its impact on firm performance and more
specifically on final product attributes such as cost, design, manufacturability, quality, and so
forth.
Due to the high costs involved in the appraisal processes Lysons et al., (2008) suggests that
appraisal should be used in the following situations: purchase of strategic high profit, high risk
items, where potential suppliers do not hold accreditation, purchase of non-standard items,
expenditure on capital items, global sourcing, outsourcing, placing of construction and similar
contracts, when entering into JIT arrangements among others. Suppliers may be appraised in
many ways: financial ability, quality, production facilities, environmental issues, supplier’s
organizational culture, cost factors production capacity and employee capabilities among others
(Lysons et al., 2008; CIPS, 2012).These appraisal criteria are explained as follows:
2.2.1 Financial Stability
Supplier’s financial condition need to be evaluated at the earliest stages of supplier appraisal.
Some purchasers view the processes as a prescreening exercise that a supplier must pass before a
detailed evaluation process can begin (Handfield et. al., 2008). According to the Chartered
Institute of Purchasing and Supplies (2012) financial status and stability are measured by factors
such as profitability, cash flows management, assets owned, debts owed among other factors.
The financial criterion is important since selection of a supplier with poor financial conditions

9
presents a number of dangers to the purchaser. To start with, is the danger that the supplier will
go out of business. Then suppliers with poor financial health will not have resources to invest in
plant, equipment, or research necessary for long-term performance improvements. Thirdly, the
supplier may become so financially dependent on purchaser. Lastly, financial weakness seems to
be an indication of underlying problems (Handfield et al., 2008).
The financial stability will equally reflect on the ability of suppliers to meet the current contract
with the purchaser and to ensure a secure future flow of supplies. The financial records may also
indicate the risk of delivery or quality problems and more disruptions to supply and more
complex legal issues if a supplier becomes insolvent. A supplier that is financially unstable poses
three nightmares to the buyer. A buyer may need to insist on quality but the supplier is forced to
cut on costs; a buyer may have a claim against the supplier but he may not have sufficient
working capital; to meet it and a buyer may wish to insist on speed delivery but supplier cannot
pay overtime (CIPS,2012; Lysons, 2008; Handfield et al., 2008).
A purchaser therefore needs to look at various sources of financial information to assist come up
with decision on financial stability of suppliers. The sources include: published financial
statements, the internet, the press among others (CIPS, 2012). The assessment of financial
stability will need to look at: asset turnover, profitability, value of capital assets, scale of firm’s
borrowing, possibility of merger or take-off among other factors (Handfield et al., 2008; CIPS,
2012).
2.2.2 Quality
The British Standards definition of quality is ‘the totality of features and characteristics of a
product of a product or service that bear on its ability to satisfy given need’ (CIPS, 2012). A
buyer needs to assess and ensure that a supplier has robust systems and procedures in place for
monitoring and managing its outputs. The systems for the detection and correction of defects are
called quality control while those for prevention of defects are known as quality assurance and a
buyer needs to check whether the supplier has these in place (Lysons et al., 2008). According to
Handfield et al., (2008) an important part of evaluation processes touches on a supplier’s quality
management systems and philosophy. According to Lysons et al., (2008) firms appraising quality
of suppliers will find themselves looking at the following issues: procedures for inspection and
testing of purchased materials, accreditation with national and international quality standards

10
bodies such company standards, Association of Trade Standards, International standards
organization (ISO) and British Standards Institution (BSI) (CIPS 2012; Lysons 2008). The
success of the buying organization is highly dependent on how well the suppliers perform. It is
also important that the supplier and the buyer have the same idea of what satisfactory quality is
(Gallego, 2011).
2.2.3 Production Facilities
According to Lysons et al., (2008) a buyer should also assess a supplier’s machinery with
attention paid to the following points: the availability of full range of machinery required to
produce a required product, mechanisms to overcome shortage of machinery, evidence of good
housekeeping, adoption of approaches such as computer aided designs, computer aided
manufacture, satisfaction on safety provisions and modernity and well maintenance of machines.
A buyer should focus on suppliers who have listed the name and location of the production
facility, whose facilities have complied with ISO 9001 standards, are socially compliant. The
supplier should have production experience documentation and the age of the equipment should
be assessed (CIPS 2012)
2.2.4 Environmental Issues
A buyer should also look at the environmental policies of the supplier and the ISO 14001
guidelines on environmental policies in its appraisal (Lysons et al., 2008). According to
Handfield et al., (2008) there is increased awareness of the impact of industry on environment
and buyers should look at compliance to environmental regulations by supplier to avoid stiff
penalties due non compliance. The most common environmental performance criteria used when
evaluating a supplier’s performance include: hazardous and toxic waste management, disclosure
of environmental infractions, recycle management, ISO 1400 certification and control of ozone–
depleting substances (Handfield et al., 2008). A buyer will equally include looking at other
issues like: allocation of environmental management responsibility, sustainable sourcing, and
energy saving effort (Lysons et al., 208).
A buyer also needs to look at sustainability issues including: supplier’s ethical policy, procedures
and guidelines relating to confidentiality of information, guidelines on gifts and hospitality,

11
principles with regard to conflict of interest (Lysons et al., 2008). Social responsibility, ethical
criteria and labor standards might include: the development of robust CSR policies and ethical
codes, evidence of responsible and ethical labor policies and practices, compliances with
International Labor Organization standardization, evidence of ethical trading policies and
practices, compliance with Fair Trade Standards and commitment to transparency and
improvements (CIPS, 2012).
2.2.5 Supplier’s Organizational Culture
Organizational culture (‘the way we do things around here’) is a reflection of common values,
beliefs, assumptions and norms of behavior that develop in an organization over time. Culture is
explicitly stated in organizational mission and value statements, but is also seen in the attitudes
expressed by managers and staff in their behavior, in the look of the premises, the neatness of
staff uniforms and all sorts of other expressions (CIPS, 2012). The buyer should therefore focus
on the supplier’s commitment to innovation, responsibility, ethics, quality consciousness, and
communication since this will be crucial indicators supplier’s commitment to working in
relationships. Evaluation of this will indicate whether there will be compatibility of the values,
beliefs and attitudes to quality of those of buyer and supplier.
Since management runs the business and makes decisions that affect the competitiveness of the
supplier, a buyer should look at the management competitiveness of the supplier taking into
account of the following managerial issues: management practice on long- range planning,
management’s commitment to TQM, the turnover of managers, professional experience and
educational backgrounds of the key managers, availability of vision about future direction among
other things (Handfield et al., 2009).
2.2.6 Cost Factors
A buyer should equally look at a supplier’s price and cost factors. Evaluating a supplier’s cost
structure needs a deep understanding of a supplier’s total costs, including: direct labor costs,
indirect labor costs, material costs, manufacturing costs and the general overhead costs.
Understanding cost structure of the supplier will help a buyer determine how efficiently a
supplier can produce an item and at the same time provide means for identification of areas of
cost improvement (Handfield et al., 2008).

12
According to CIPS, (2012) a buyer should be interested in: structure and allocation of costs,
competitive pricing, commitment to collaborative cost reduction initiatives, availability of credit
terms, the total cost of acquisition and ownership, ability by the supplier to propose an
innovative financial approach like gain sharing, warranty, satisfies best value analysis and
maintenance costs
2.2.7 Production Capacity
According to the CIPS, (2012) production capacity and technical capability refers to factors in
the supplier’s operational capacity and facilities, which acts as indicators of its ability to meet the
purchaser’s current and future requirements. The technical or operational capability factors that a
buyer needs to take into account when appraising suppliers include: age and maintenance of
plant and machinery, capabilities in operational areas such as engineering, innovation, design,
JIT, late customization, reverse logistics and recycling, capability of plant and machinery to
produce items within the tolerance set by specifications, volume that supplier may handle and
whether the supplier can produce the kind of items required.
Production capacity on the other hand refers to the volume that a supplier will be able to handle
and the number of units it can produce at a stated time period. This can be evaluated using the
following parameters: maximum productive capacity in a given working period, potential to
increase current capacity, percentage of capacity utilized by existing major customers and the
extent to which capacity is currently over or under committed (CIPS, 2012, Lysons, 2008).
2.2.8 Employee Capabilities
This evaluation criterion requires assessment of non-management personnel since there are
benefits associated with highly trained, stable, motivated workforce especially during periods of
labor shortage (Handfield et al., 2008). As Lysons et al., (2008) puts it, no organization is better
than its workforce. A purchaser should therefore consider the following when appraising
employee capability: the degree to which employees are committed to quality, the overall skills
and abilities of the workforce, employee-management relations, worker flexibility, employee
morale, workforce turnover, willingness of employees to contribute to improved operations, days
lost due to industrial dispute and worker representation and recognized trade unions among
others (Handfield et al., 2008; Lysons et al., 2008).

13
The evaluator equally needs to look at the staffing structure of the supplier, the experience in the
industry, state of technology being used and the past performance in order to get the right
supplier (Lysons et al., 2008).
2.2.9 Preference and Reservation
Another criterion for supplier selection is that of preference and reservations. According to the
Public Procurement Authority (PPOA) public procurement and disposal regulations (2011)
preference and reservations is the establishment of the extent of participation of SMEs’ and
disadvantage groups in Public Procurement and Development of a framework for their
participation with the idea of promoting local, national and regional industry and support socio-
economic development.
Buyers in the public sector, therefore, look at different groups such as: the disadvantaged groups,
local preference, micro-enterprises, preference, region, reservations, small enterprises, target
group, small enterprises, micro enterprises, disadvantaged groups, citizen contractors, local
contractors and joint-ventures or sub-contracting arrangements with foreign suppliers (PPOA,
2005). Preferences and reservations can have a positive effect on a country’s productive sectors
as found by studies in China which found out that government purchases can serve as policy
instruments (Baumol, 1974). The studies show that China has implemented a policy that
explicitly discriminates against foreign owned companies when purchasing high technology
products. This approach in public procurement is a component of catch up strategies aimed at
promoting innovative capacities of local firms.
Burkhart and Trionfetti (2000), in a study of EU economies countries argue that in most
developed countries found out that public sector purchases from the private sector account for
more than 10% of GDP and governments in developed countries will typically favor local
suppliers. In their analysis they postulate that determinants of industry location like factor
endowments, market access and intermediate inputs will have a strong impact on industry
location if the level of government purchase in that industry is low and vice versa
2.3 Organizational Performance
One performance measure is quality which is measured in a number of ways including: parts per
million, customer defects per supplier and field failure rates by purchase item and by supplier

14
(Lysons et al., 2009). Another measure is responsiveness/ time / delivery which measures the
amount of time in weeks or months from concept to first shipment or delivery of final product to
the market with the objective of continuous reduction of time to the market. The measures here
include: on time delivery, cycle time reduction, responsiveness to schedule changes, mix changes
and design or service changes and achieving new product introduction (Lysons et al., 2009;
Handfield et al., 2008).
There is need to also measure performance of production since it has a major impact on product
cost, quality, speed of delivery, and on delivery reliability and flexibility (Lack et al., 1995).
Another measure of production performance is range of product and services offered. According
to Mapes et al., (1997), a company that manufactures a wide range of products is likely to
introduce new products at a slower rate than companies with a narrow product range. According
to Fisher (1997), the selection of a right supply chain strategy depends upon the nature of
product variety and innovation. This also implies that the range of products and services acts as
an important strategic metric, and hence, it should be considered in performance evaluation.
Capacity utilization equally measures performance of a supply chain and according to Wild
(1995) all the operations planning takes place within the framework set by capacity decisions.
From the above statement, the role of capacity in determining the level of all supply chain
activities is clear. This highlights the importance of measuring and controlling the capacity
utilization. Capacity utilization directly impacts on the speed of response to customers' demand
and thus measuring capacity, gains in flexibility, lead-time and deliverability will be achieved
(Slack et al. 1995).
Delivery of goods and services is another measure of performance in a supply chain management
and since it directly deals with customers it is referred to as ``driver of customer satisfaction''
(Gunasekaran, 2001). Some of the measure of delivery include: on-time delivery, delivery-to-
request date; delivery-to-commit date; and order fill lead-time. Supply performance
measurement must be linked to customer satisfaction (Lee and Billington, 1992). There is
therefore need for measurement of integration of the customer specification in design, to set the
dimensions of quality, for cost control, and as a feedback for the control of process. The
following are some of the related performance metrics: flexibility, customer query time (time it
takes for a firm to respond to a customer inquiry with the required information), reduction in

15
warranty claims, and number of customer complaints and percentage of orders with complaints,
customer satisfaction, and order entry accuracy (Pohlen, 2003; Handfield et al., 2009; Lapide,
2013).
The financial performance of a supply chain can be assessed by customer sales growth and
profitability which parameters look at the sale and profits generated each year with sales
expected to grow each year or remain constant at the worst (Makori,2013). The Return on supply
chain investment is another measure used to gauge supply chain performance. Return on supply
chain investment is worked out on operating profits in excess of capital employed (Pohlen, 2003;
Lapide, 2013). Performance be measured through inventory performance or fill rate which can
be measured in terms of: number of Stock-keeping units, order cycle time, percentage of quality
rejections, average safety inventory, percentage fraction of time out of stocks, percentage of
seasonal inventory and inventory turn-over (Pohlen, 2003; Lapide, 2013).
Transportation performance can be measured through: total transportation costs, number of
vehicles operated, percentage of outbound shipments, average outbound shipment size,
percentage of inbound shipments, percentage average inbound shipment size, fraction of
transportation mode, percentage on timely delivery, percentage of accidents , average kilometers
vehicles running full load or empty per day ( Lyson et al., 2006). Cash conversion cycle and
percentage of internal and external complaints for data unavailability also measure optimization
(Lapide, 2013).Cash to cash cycle measures the time it takes from point of purchase of raw
material to conversion of raw materials and to sales and final collection of cash from sales
(Makori,2013).
Other performance measures include price and cost with common price performance looking at
actual purchase price against planned purchase price (CIPS, 2012) and cost looking at cost
changes and cost avoidance. A cost change is the increase or decrease in cost resulting from a
change in purchasing strategy while cost avoidance represents the difference between a price
paid and a potentially higher price which might have occurred if a purchase had not been
obtained at a lower price (Handfield et al., 2009).

16
2.4 Supplier Evaluation and Organizational Performance
Supplier selection is largely seen as the most vital role of the procurement function since the
organization’s suppliers can affect the price, quality, delivery reliability and availability of its
products (Li, 2008). Organizations feel that proper supplier selection would assist reduce product
and material costs whilst ensuring a high degree of quality and after-sales services (Sonmez,
2006). The implication here is that an efficient appraisal should be in place for the successful
supply chain management (Li. 2008).
There are a number of benefits of supplier appraisal these include: ability to harness the strengths
and skills of suppliers to the advantage of buyers (Dwyer, Schurr and Oh 1987), improved
quality and process performance and continuous cost reductions among others (Newman 1988;
Wilson, Dant, and Han). According to CIPS, (2007) supplier appraisal is also important in
strategic sourcing, supplier management and the achievement of competitive advantage. Firms
that appraise their suppliers discover that they have improved visibility into supplier
performance, unmask and deal with hidden cost drivers, lower risk, increase competitive
advantage through reducing order cycle times and stock, have insight on how to best leverage
their supply base, and align practices between themselves and their suppliers (Gordon, 2006).
Companies pursuing supplier appraisal commonly see over a 20% improvement in supplier
performance metrics such as on-time delivery, quality, and cost.
Supply chains can be full of inefficiencies some due to poor policies and strategies at the
supplier’s, that results to hidden costs such as stock-outs, carrying costs of overstocking,
incorrect payments of invoices, slow acknowledgement and reporting of shipment and lost sales
which in turn affects productivity, quality issues, increased wasteful costs (extra inspections,
additional freight fees, overtime, buffer stocks, obsolete inventory, multiple sourcing) and slow
movement of goods which can be improved by supplier evaluation and better communications
between buyers and suppliers (Pisello, 2006;Gordon, 2006). Evaluating and improving supplier
performance using the quality and production capacity criteria can lead to the resultant reduction
in supplier quality problems eliminates wasteful steps in a firm’s own processes and at the same
time helps improve understanding of supplier performance and supplier’s business policies and
processes and thus assisting the buyer help suppliers drive waste and inefficiency out of supply

17
chain, resulting in higher-quality suppliers and lower costs which in turn improves the
profitability of the buyer (CIPS, 2007; Lysons et al., 2008; Handfield et al., 2008)
Supplier appraisal aims at reducing purchases from marginal or poor performing suppliers while
increasing and concentrating purchases among their more desirable top-performing suppliers
(Wisner, 2008). Appraisal of suppliers and consequent reduction of supply base has implication
performance in terms of cost, design, manufacturability and quality(ISM, 2005). Rationalizing
the supply base equally leads to buying from world class suppliers, reduction of supply base
risks, use of full-service suppliers and ability to pursue complex supply management strategies
(Handfield, et al., 2009). According to Gordon, (2006) supplier appraisal can set a threshold for
its suppliers that can lead to higher-quality results, better plan new products and services based
on a good understanding of its suppliers’ capabilities and performance levels and help
understand if local suppliers are capable of reducing total costs enough to outperform offshore
suppliers.
Supplier evaluation to ensure compatibility between buyer and supplier in terms of shared
business ethics, similar standards of excellence, commitment to continuous improvement are
important in performance of suppliers (CIPS, 2012). Compatibility is of concern especially in
adoption of supply chain best practices such as lean enterprise or any high performance system
that drives shorter delivery times, higher quality, and lower prices which could actually have an
adverse effect on a supplier who is not aligned with these practices. According to Gordon (2006)
a supplier who is unused to pursuing continuous improvement may be unable to keep up with its
buyers’ increasing requirements for better, cheaper, faster goods and services. Supplier appraisal
is therefore important to ensure compatibility and reduce risk of failure of supplies (Handfield et.
al., 2008; Lysons et al., 2008)
The financial criteria of supplier appraisal can give an important insight into supplier
performance and supplier business practices which help reduce business risk, especially given
firms’ increasing dependence on its key suppliers. Some of the supplier risks that appraisal can
mitigate on include: financial, operational, increased geographic distance and the performance of
sub-tier suppliers whom the prime supplier has no contact with or knowledge of Gordon (2006).

18
The quality criteria help the supplier in performance improvement (Gordon, 2006). Supplier
appraisal is an effective motivation tool when it leads to continuous improvement activities and
real supplier performance improvement. A buyer that appraises its suppliers helps them
motivated to improve on quality, delivery, and costs especially if these are used as yardsticks to
reward performing suppliers (CIPS, 2012). As Gordon, (2006) posits, supplier evaluation can:
unearth the causes of performance difficulties; improve understanding of business operations;
cultural factors and the leadership at the supplier which lead to follow-up activities, such as
supplier training and development, and corrective actions that deal with supplier evaluation
findings hence coming up with the best ways to obtain measurable and positive results which
will at the end improve profitability and quality performance of buying firm.
2.5 Summary and Conceptual Framework
This section looks at the summary of the literature review and the conceptual framework. It
summarizes the literature that has been reviewed highlighting on the important studies done and
their findings and also the conceptual framework.
2.5.1 Summary of the literature review
This study is to investigate the relationship between supplier evaluation and the performance of
the food and beverage manufacturing firms in Nairobi, Kenya. According to the National Bureau
of Statistics (2009) the food and beverage manufacturing firms in Kenya contribute immensely
to economic growth generating over a third (33.4 per cent) of total production in the country.
Given such unique role the sector plays in expanding economic opportunities, supplier
evaluation is necessary (Krishnaswamy, 2007).
Many studies have been conducted in the area of supplier evaluation Ho et al., (2007) for
instance investigated the contribution of Supplier Evaluation and Selection Criteria in the
Construction Industry in Taiwan and Vietnam and found out that non-quantifiable criteria play a
very important role in the selection process and that the construction companies with the
common appraisal criteria being product quality, product availability, delivery reliability,
product performance, product cost and service after sale. Other studies locally include: Thairu et
al., (2012) and Okello et al., (2014) looked into what the traders in Dagoreti market, in Kiambu

19
Kenya thought about the concept of supplier appraisal and whether they practiced it and the
influence of supply chain management practices of the Nairobi Securities Exchange’s listed food
and beverage manufacturing firms in Nairobi respectively.
The studies reveal that the supplier evaluation criteria include: location of supplier, adequate
facilities, use of information technology, financial strength, quality in operations and products,
adequate production capacity, and skilled personnel, corporate social responsibility and good
ethics and environmental. There is also the review of performance with a review of performance
measures such as quality, delivery, profitability, price among many others (Narasimhan et al.,
2004). As several studies have been done in this area, it is important to investigate the conclusion
made by these studies to establish whether similar conclusion can be reached when using
different methodology and researcher to conduct the study. Equally since most studies did not
investigate causal relationships between evaluation criteria and performance it is necessary to
find out this.
2.5.2 Conceptual Framework
A conceptual framework assists to simplify the proposed relationships between the dependent
variable and the independent variables in a study and allows the same to be depicted
diagrammatically. The conceptual framework explains the relationship between independent and
dependent variables in the study. In this study performance is the dependent variable since its
success depends on individual outcomes of supplier evaluation which is the independent
variables: quality, environment, organizational culture, employee competence, financial ability,
production facilities, production capacity and cost factors. The success of supplier evaluation
impacts on firm performance: profit margin, lead time and customer satisfaction as shown in
Figure 2.1.

20
Figure 2.1: Conceptual Framework
Supplier Evaluation Criteria Organizational Performance
Independent Variable Dependent variable
Source: Researcher, (2014)
Financial stability
Quality issues
Environmental issues
Organizational culture
Price factors
Production capacity
Employee competence
Production capacity
Preference and Reservation
Profit margin
Lead time
Customer satisfaction

21
CHAPTER THREE: RESEARCH METHODOLOGY
3.1 Research Design
The study adopted a descriptive survey of all the large food and beverage manufacturing
companies operating in Nairobi, Kenya. This survey approach allowed the researcher to collect a
large amount of data from a sizable population in an economical way.
3.2 Population
The study targeted all the large food and beverage manufacturing firms in Nairobi, Kenya. There
are 46 large food and beverage manufacturing firms in Nairobi Kenya as can be seen in the
appendix attached (KAM, 2013). All these comprised the population of the study.
3.3 Sampling
This study sampled all the 46 large scale food and beverage manufacturers firms in Nairobi
County. This was census form of sampling which is used when the entire population is
sufficiently small and involves sampling every member in the population (Statpak, 2013). The
respondents to the questionnaire were the chairs of the supplier evaluation committees from the
sampled food and beverage manufacturing firms in Nairobi, Kenya
3.4 Data collection
Primary data was used in this study to research specific objectives by means of closed ended
questionnaires. Section A, dealt with general information of the organization. Section B, sought
to establish the criteria used to evaluate suppliers in the large food and beverage manufacturing
firms in Nairobi, Section C sought to establish the performance levels of the large food and
beverage manufacturing firms in Nairobi in the food and beverage industry in Nairobi.
The questionnaire was self-administered by drop and pick later method at the food and beverage
firms in Nairobi City County to give the respondents time to fill.

22
3.5 Data Analysis
Since the data collected was qualitative and quantitative in form, the study adopted both
qualitative and quantitative methods of data analysis.
In order to establish the criteria used to evaluate suppliers in the large food and beverage
manufacturing companies in Nairobi. Means and standard deviations tables were used to show
the evaluation criteria that is commonly used and in establishing the performance levels of the
firms. This is presented in tables.
Correlation and multiple regression analyses were applied to determine the relationship between
supplier evaluation and performance of large food and beverage manufacturing firms in Nairobi.
The following regression model was used to establish the relationship between supplier
evaluation and performance of large food and beverage manufacturing firms in Nairobi:
y = α+ β1x1 +β2x2 + β3x3 +β4x4+ β5x5 +β6x6 + β7x7 +β8x8+ ℇ
Where y represented firm performance; a is the constant; x1 is financial stability; x2 is quality ; x3
is environmental issues; x4 is supplier’s organizational culture; x5 is cost; x6 is production
capacity, x7 is employee capacity; x8 preference and reservations; β1 to β8 are the weights of each
independent variable.

23
CHAPTER FOUR: DATA ANALYSIS AND FINDINGS
4.1 Introduction
This chapter presents data analysis, findings, and discussion of the results. Interpretation is in
line with study findings. The respondents were drawn from large food and beverage
manufacturing firms in Nairobi City County. The expected sample population was 46
respondents of which 27 successfully completed and returned the questionnaires for analysis.
This represents 63% of the respondents.
The researcher sought to find out the organizational profile of the large food and beverage
manufacturing firms in terms of whether they practice supplier evaluation and for how long in
years.
4.1.1 Organizational evaluation of suppliers
From Table 4.1 it is clear that all the respondents indicated that the organizations evaluate their
suppliers. This means that the study topic is relevant.
Table 4.1: Organizational evaluation of suppliers
Response Frequency Percentage Valid
Percentage
Cumulative
Percentage
Yes 27 100.0 100.0 100.0
No 0 0.0 0.0 0.0
Source: Researcher, (2014)
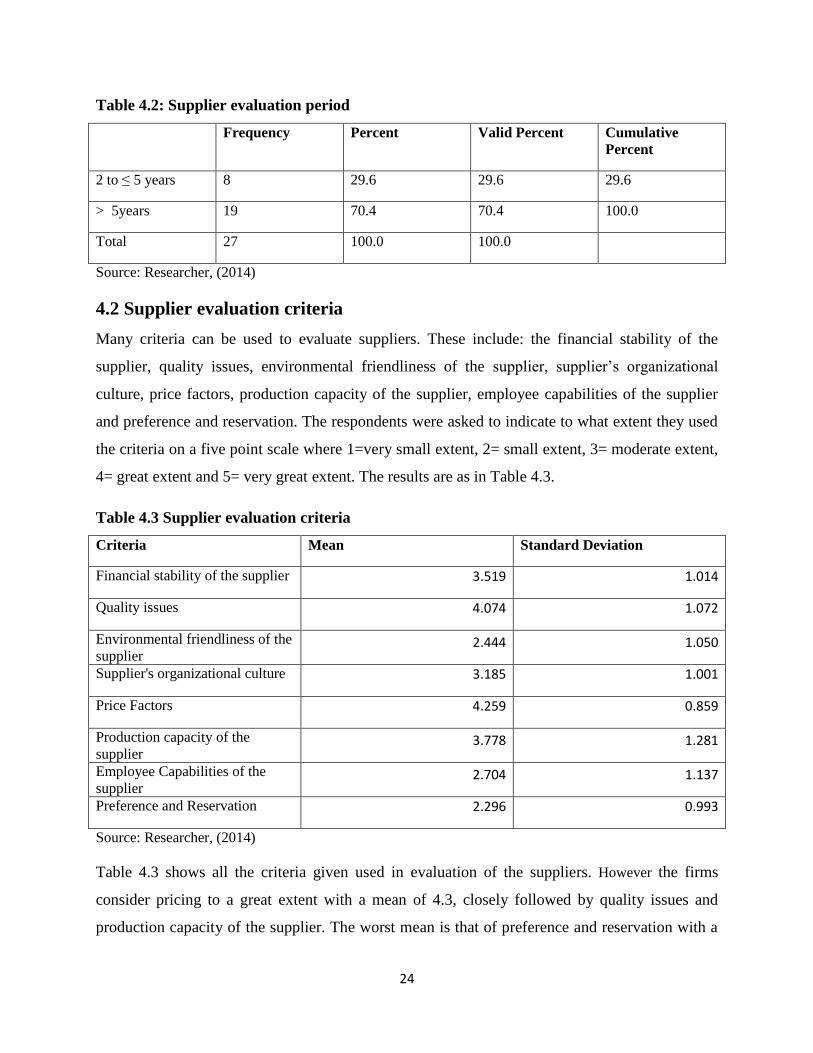
4.1.2 The supplier evaluation period
All the firms that responded evaluate their suppliers with majority of them having done it for
more than five years as Table 4.2 shows. Hence supplier evaluation is not a new concept in the
food and beverage manufacturing firms.
24
Table 4.2: Supplier evaluation period
Frequency Percent Valid Percent Cumulative
Percent
2 to ≤ 5 years 8 29.6 29.6 29.6
> 5years 19 70.4 70.4 100.0
Total 27 100.0 100.0
Source: Researcher, (2014)
4.2 Supplier evaluation criteria
Many criteria can be used to evaluate suppliers. These include: the financial stability of the
supplier, quality issues, environmental friendliness of the supplier, supplier’s organizational
culture, price factors, production capacity of the supplier, employee capabilities of the supplier
and preference and reservation. The respondents were asked to indicate to what extent they used
the criteria on a five point scale where 1=very small extent, 2= small extent, 3= moderate extent,
4= great extent and 5= very great extent. The results are as in Table 4.3.
Table 4.3 Supplier evaluation criteria
Criteria Mean Standard Deviation
Financial stability of the supplier 3.519 1.014
Quality issues 4.074 1.072
Environmental friendliness of the
supplier 2.444 1.050
Supplier's organizational culture 3.185 1.001
Price Factors 4.259 0.859
Production capacity of the
supplier 3.778 1.281
Employee Capabilities of the
supplier 2.704 1.137
Preference and Reservation 2.296 0.993
Source: Researcher, (2014)
Table 4.3 shows all the criteria given used in evaluation of the suppliers. However the firms
consider pricing to a great extent with a mean of 4.3, closely followed by quality issues and
production capacity of the supplier. The worst mean is that of preference and reservation with a

25
mean of 2.3 indicating that the private sector is yet to embrace the criterion. The standard
deviations are smaller to mean supplier evaluation is practiced.
4.3 Organizational Performance
This section aimed at knowing the organizational performance of the firms using the
performance measures summed as lead time and customer satisfaction.
Table 4.4: Organizational Performance
Organization Mean Standard Deviation
1 4.038462 0.52769455
2 3.846154 0.543492976
3 4.230769 0.429668924
4 4.115385 0.431455497
5 3.961538 0.196116135
6 4.307692 0.549125178
7 4.192308 0.401918476
8 4 0.282842712
9 3.884615 0.515901004
10 4.230769 0.429668924
11 4.115385 0.431455497
12 3.961538 0.196116135
13 4.307692 0.549125178
14 4.192308 0.401918476
15 3.961538 0.196116135
16 4.307692 0.549125178
17 3.884615 0.515901004
18 3.807692 0.401918476
19 3.961538 0.598716576
20 3.846154 0.464095481
21 4.230769 0.429668924
22 4.115385 0.431455497
23 3.961538 0.196116135
24 4.307692 0.549125178
25 4.192308 0.401918476
26 3.961538 0.196116135
27 4.307692 0.549125178
Source: Researcher, (2014)

26
The means and standard deviations show that the firms studied are doing in performance. The
mean is averagely 4 which imply that to a great extent the performance measures are achieved.
The means are concentrated together to show that it is not one but all the organizations have
embraced initiatives that enable them measure their performance.
Further this is an indication that the lead time is reduced through being responsive to time in
ensuring on time delivery, quick to act to emerging issues and reduction of cycle time as well as
keeping the customers satisfied by providing quality products and handling the customers well
in responding to their complaints.
4.4 Supplier evaluation criteria and performance
This section seeks to establish the relationship between supplier evaluation and performance of
the firms studied. These relationships are tested using correlation and regression analyses. Table
4.5 shows the summary data for performance and supplier evaluation criteria variables used in
correlation and regression analyses.

27
Table 4.5: Summary data for performance and supplier evaluation criteria C
om
pa
ny
Per
form
an
ce
Fin
an
cia
l
sta
bil
ity
of
the
sup
pli
er
Qu
ali
ty i
ssu
es
En
vir
on
men
tal
frie
nd
lin
ess
of
the
sup
pli
er
Su
pp
lier
's
org
an
iza
tio
nal
cult
ure
Pri
ce f
act
ors
P
rod
uct
ion
cap
aci
ty o
f th
e
sup
pli
er
Em
plo
yee
cap
ab
ilit
ies
of
the
sup
pli
er
Pre
fere
nce
an
d
rese
rva
tio
n
1 4.038462 4 4 2 4 4 5 4 3
2 3.846154 2 4 3 4 4 4 3 2
3 4.230769 4 4 4 5 4 4 4 4
4 4.115385 4 4 3 4 5 5 5 4
5 3.961538 4 4 2 5 4 4 4 5
6 4.307692 4 5 4 4 4 4 5 5
7 4.192308 4 4 4 4 5 5 5 4
8 4 4 5 4 5 4 4 4 5
9 3.884615 2 4 2 3 4 4 3 3
10 4.230769 4 4 4 5 4 4 4 4
11 4.115385 4 4 3 4 5 5 5 4
12 3.961538 4 4 2 5 4 4 4 5
13 4.307692 4 5 4 4 4 4 5 5
14 4.192308 4 4 4 4 5 5 5 4
15 3.961538 4 4 2 5 4 4 4 5
16 4.307692 4 5 4 4 4 4 5 5
17 3.884615 2 4 3 3 5 4 3 3
18 3.807692 3 3 2 2 4 4 3 3
19 3.961538 2 4 2 3 4 4 3 3
20 3.846154 3 3 2 2 4 5 3 3
21 4.230769 4 4 4 5 4 4 4 4
22 4.115385 4 4 3 4 5 5 5 4
23 3.961538 4 4 2 5 4 4 4 5
24 4.307692 4 5 4 4 4 4 5 5
25 4.192308 4 4 4 4 5 5 5 4
26 3.961538 4 4 2 5 4 4 4 5
27 4.307692 4 5 4 4 4 4 5 5
Source: Researcher, (2014)

28
Table 4.6 shows the correlation between supplier evaluation criteria and performance together with the significance (sig) of the correlation.
Table 4.6: Correlation Analysis
Correlations
perf
Financial
stability
of the supplier
Quality issues
Environmental
friendliness of the supplier
Supplier's
organisational culture
Price Factors
Production
capacity
of the supplier
Employee
Capabilities
of the supplier
Preference
and Reservation
Pearson
Correlation (r)
1 .614** .522** .822** .247 .319 .373 .785** .278
Sig. (2-
tailed)
.001 .005 .000 .213 .105 .055 .000 .161
N 27 27 27 27 27 27 27 27 27
Source: Researcher, (2014)
The Pearson correlation r indicates the strength of the relationship between the supplier
evaluation criteria and performance. When 0 < r 1 it indicates a positive relationship between
supplier evaluation criteria and performance. When r=0 it indicates that there is no relationship
between supplier evaluation criteria and performance. When -1 r < 0 it indicates a negative
relationship between the supplier evaluation criteria and performance. The value shown as sig
indicates the significance between supplier evaluation criteria and performance.
The results indicate that only four supplier evaluation criteria: Financial stability of the supplier,
Quality issues, Environmental friendliness of the supplier and Employee Capabilities of the
supplier are related to performance with a p-value (Sig. 2-tailed) < 0.05. Among the supplier
evaluation criteria significantly related to performance, Environmental friendliness of the
supplier has the greatest positive relationship to performance with r=0.8. Quality issues criterion
contributes least towards the performance with the least correlation value (r=0.5) among the
significant criteria variables.
The regression analysis was done on Eviews and Table 4.7 shows the output.

29
Table 4.7: Regression Analysis
Variable Coefficient Std. Error t-Statistic Prob.
C 4.087049 0.308232 13.25964 0.0000
X1 FSS? -0.019139 0.067992 -0.281493 0.7815
X2 QIS? -0.045541 0.058109 -0.783713 0.4434
X3 EFS? 0.085888 0.023657 3.630561 0.0019
X4 SOC? 0.000942 0.023668 0.039810 0.9687
X5 PFR? -0.125058 0.060334 -2.072762 0.0528
X6 PCS? -0.050244 0.069428 -0.723694 0.4786
X7 ECS? 0.207247 0.056064 3.696614 0.0017
X8 PRS? -0.032263 0.041737 -0.773023 0.4495
R-squared 0.913844 Mean dependent var 4.082741
Adjusted R-squared 0.875553 S.D. dependent var 0.166489
S.E. of regression 0.058732 Sum squared resid 0.062091
F-statistic 23.86547 Prob(F-statistic) 0.000000
Source: Researcher, (2014)
FSS - Financial stability of the supplier
QIS - Quality issues EFS - Environmental friendliness of the supplier
SOC- Supplier’s organizational culture
PFR - Price factors
PCS - Production capacity of the supplier
ECS - Employee capabilities of the supplier
PRS - Preference and Reservation
Table 4.8 shows the regression analysis from which the regression is summarized as:
Y=0.086EFS+0.207ECS-0.125PFR-0.019FSS-0.046QIS-0.0009SOC-0.050PCS-0.032PRS
The model’s F-statistic ( p=0.000) indicates 100% significance. The R squared is 0.914 which
means that the model’s explaining power is 91.4% therefore the results are reliable.
The regression analysis shows that Employee capabilities of the supplier has the highest
significance (P=0.0017,) at significance level of 5%, Environmental friendliness of the supplier
follows closely (P=0.0019) at 5% significance level and Price factors (P=0.528) at 10%

30
significance level. This implies that these criteria are the life spring of performance in food and
beverage firms.
Supplier’s organizational culture, financial stability, Quality issues, Product capacity of the
supplier and Preference and Reservation are insignificant given that their probabilities are
>10% significance level hence they do not influence performance.
4.5 Discussion of Results
The results showed that suppliers are evaluated using the preset criteria which are; the financial
stability of the supplier, quality issues, environmental friendliness of the supplier, supplier’s
organizational culture, price factors, production capacity of the supplier, employee capabilities
of the supplier and preference and reservation. This concurs with Dobos et al., (2012) who posits
that supplier evaluation is a management activity which help in acquiring information to analyze
supply situations.
The findings indicate that the food and beverage firms that were studied are doing well in
performance that is realized by the reduction in lead time as well as having the customers
satisfied .This is indicated by the rise in number of the customers satisfied. Similarly, time to
market is reduced, the returns inwards are reduced, capacity is utilized well and supply base risks
were reduced. This is similar to Lee and Billington, (1992) who posit that supply performance
measurement is linked to customer satisfaction hence growth in sales. (Lapide, 2013).
The correlation results show that among the given criteria, environmental friendliness of the
supplier, employee capabilities of the supplier, quality issues and financial stability of the
supplier have a strong positive correlation (0.522≤ r≤ 0.822). This implies that once a supplier is
environmentally friendly he will tend to follow the environmental regulations hence the products
will be acceptable in the society. This concurs with earlier assertions that point out that there is
increased awareness on the impact of industry on environment and compliance to environmental
regulations, that financial records can indicate the risk of delivery, quality problems and more
disruptions to supply including legal issues if the supplier becomes insolvent and that the
products bear the ability to satisfy needs. (Handfield et al., 2008, CIPS, 2012).

31
The correlation also shows that price factors, organizational culture of the supplier, production
capacity of the supplier and preference and reservation do not relate to performance (r <0.5).This
is contrary to facts that the cost structure and allocation information is necessary for the buyer for
telling whether there are chances of price improvement, that the norm of an organization is
expressed in the employees attitude and behavior (CIPS,2012).
The regression analysis indicates that employee capabilities is significant P=0.0017 at 1%
significance. This means that the best the employees are the best the performance which is
similar to Lysons et al., (2008) where it is noted that no organization is better than its employees.
At the same time environmental friendliness is significant (p=0.0019) meaning it positively
influences performance which concurs with Handfield et al., (2008) that there is increased
awareness by industries to comply to environmental regulations. Price factors are significant
(p=0.528) at 10% significance level. It concurs with CIPS, ( 2012) asserting that it is important
to know the supplier’s cost structure and cost allocation.
The other criteria are insignificant. They are supplier’s organizational culture, financial stability,
production capacity, quality issues and preference and reservation which have
0.443≤p≤0.968.This is contrary to assertions that an organization’s culture defines that the
supplier and buyer organizations should be compatible in their values and beliefs , that financial
stability is a prescreening exercise that a supplier must pass, that the supplier has the right
machinery and equipment that can produce the likely demands, that products have the ability to
satisfy the needs presented (CIPS,2012, Handfield et al., 2008 Lysons, et al.,2008)

32
CHAPTER FIVE: CONCLUSIONS AND RECOMMENDATIONS
5.1 Introduction
This chapter presents the conclusions and recommendations based on findings and suggestions
for further research. The study had three main objectives: to establish the criteria used to evaluate
suppliers in the large food and beverage manufacturing companies in Nairobi City County, to
establish the performance levels of large food and beverage manufacturing firms in Nairobi City
County and to determine the relationship between supplier evaluation and performance of large
food and beverage manufacturing firms in Nairobi City County.
5.2 Conclusions
From this study it can be concluded that large food and beverage firms in Nairobi City County
evaluate their suppliers using the criteria established: The financial stability of the supplier,
quality issues, price factors, environmental friendliness of the supplier, production capacity of
the supplier, employee capabilities of the supplier and preference and reservation.
Environmental friendliness of the supplier, employ capabilities and price factors of the supplier
are the most domineering criteria which mean that firms are keen on producing at minimum
costs and the right volumes employing the right expertise to be able to satisfy the available
market while being compliant to environmental issues.
It can also be concluded that firms that practice supplier evaluation as one of the supply chain
practices are able to reap from the benefits associated with it. For instance reduction in number
of complaints is associated with a firm’s organizational culture, stock out levels reduce with
embracing preference and reservation which at the same times aids in distributing resources to all
citizens.
5.3 Recommendations
Based on the findings, this study presents pertinent recommendations as follows:
The food and beverage firms should train their supplier evaluation committees or procurement
managers on how best to evaluate the suppliers. This will enable the firms to get the right
suppliers which will lead to harnessing the benefits associated with the practice that is shortened
lead times, customer satisfaction and higher profit margins.

33
In measuring performance firms should be aware of all the performance measures and
understanding what factors influence them to be able to deal with each one of them as it
demands. For instance firms should take into consideration what criteria is related to
performance and capitalize on them like the employee capabilities will lead to production of
quality products.
Supplier evaluation is greatly influencing performance because of the positive relationship that
the study unraveled therefore it could be useful for firms to take the practice to another level
majorly embracing the highest scorers of positive relationship like environmental friendliness
and employee capabilities and including those lagging like preference and reservation in order to
equitably spread the available resources to everyone in the citizenly.
5.4 Limitations of the study
The study had the following limitations:
The respondents may not have disclosed important information probably for fear of victimization
in case they were being spied or fearing to be copied by competitors hence limiting the
researchers recommendations.
Some respondents did not fill and return the questionnaires. This affected the research since all
the firms were expected to fill to make the results more plausible. At the same time, it could have
been better if firms in areas within the country were included for divergent responses.
5.5 Suggestions for Further Research
The study indicates that supplier evaluation as a supply chain practice helps in improving the
performance in large food and beverage manufacturing firms in Nairobi City County. It would be
important to study other sectors to ascertain whether this still holds.
Financial stability of the supplier, supplier’s organizational culture, quality issues and preference
and reservation are insignificant in this study. It would be necessary to carry out a study to
explain why each of them does not influence performance.
34
REFERENCES
CIPS, (2007). How to Appraise Suppliers. Retrieved from www.cips.org.
CIPS,(2012). Sourcing in Procurement and Supply. Pretoria: Profex Publishing.
Farrington, B., & Lysons, K. (2009).Purchasing and Supply Chain Management. London:
Prentice Hall
Gordon, S. R. (2006). Supplier Evaluation: Benefits, Barriers and Best Practices. 91st Annual
International Supply Management Conference. Emptoris, Inc.
Hald, K. S., &Ellegaard, C. (2011). Supplier Evaluation Processes: the Shaping `and Reshaping
of Supplier Performance. International Journal of Operations & Production Management,
Vol. 31 (Iss: 8,), 888 - 910.
Hult, G. T., Talluri, S., & DeCampos, H. A. (2013). Supplier Rationalization: A Sourcing
Decision Model. Decision Sciences Journal, 44.
Kenya National Bureau of Statistics.(2012). Kenya Economic Survey 2011.G.o.K.,. Nairobi
Kothari, C. (2011). Research Methodology- Methods and Techniques. New Dhelhi: New Age
International Publishers
Monczka, R., Giunipero, L., Patterson, R .& Handfield, R. (2009). Sourcing and Supply Chain
Management. New Dehli: South Western
Mondini, L. C., Machado, D. D. P. N., Scarpin, M. R. S (2014). Dyad Buyer-Supplier and its
Relation to Financial Performance ISSN: 1984-3046 . Journal of Operations and Supply
Chain Management Volume 7 Number 1 pp 30 – 46
Okello, J. O. & Were, S. (2014). Influence of supply chain management practices on
performance of the Nairobi Securities Exchange’s listed, food manufacturing companies
in Nairobi. International Journal of Social Sciences and Entrepreneurship, 1 (11), 107-
128.

35
Pasandideh, S. H., Niaki, S.T., and Nia, A.R.,. (2011). A Genetic Algorithm for Vendor
Managed Inventory Control System of Multi-Product Multi-Constraint Economic Order
Quantity Model. Expert Systems with Applications, 38, 2708-2716
Pearson, J.N. and Ellram L.M. (1995). Suppliers Selection and Evaluation in Small versus Large
Electronics Firms, Journal of Small Business Management, October, pp. 53-65.
Petersen, K. J., Handfield, R.B., Lawson, B., Cousins, P.D. (2008). Buyer Dependency And
Relational Capital Formation: The Mediating Effects Of Socialization Processes And
Supplier Integration. Journal of Supply Chain Management, 44(4), 53-65.
Pfitzer, M., & Krishnaswamy, R. (2011). The Role of the Food and Beverage Sector in
Expanding Economic Opportunity corporate social responsibility report nuber 20.
Cambridge: FSC Social Impact Advisors and Fellows of Havard College.
Pisello, T. (2006). Shrinking the Supply Chain Expand the Returns: the ROI of RFID in
SupplyChain.(AlineanWhitePaper).Retrievedfromhttp://www.motorolasolutions.com/we
b/Business/Solutions/Industry%20Solutions/RFID%20Solutions/Documents/Static%20Fl
ies/Alinean_ROI_WP_0917_final.pdf
Pishvaee, M. S., and Torabi, S.A. (2010). A Possibilistic Programming Approach for Closed-
Loop Supply Chain Network Design Under Uncertainty. Fuzzy Sets and Systems, 161,
2668-2683.
Prahinski, C. & Benton, W.C. (2004). Supplier evaluations: communication strategies to improve
supplier performance. Journal of Operations Management, 22(1), 39-62.
Ross, S. (1973). The Economic Theory of Agency: The Principals Problem. American Economic
Review, 63, 134-139.
Ruiz-Torressa, A. J., and Mahmoodi, F. (2007).The Optimal Number of Suppliers Considering
the Costs of Individual Supplier Failures. Omega, 35, 104-115
Sauders, M. (2009). Research Methods for Business Students, New Delhi, Prentice Hall
Shahadat, K. (2003). Supplier Choice Criteria of Executing Agencies in Developing Country.
International Journal of Public Sector Management, 16, 261-285.

36
Simpson, P. M., Siguaw, J. A. and White, S. C. (2002). Measuring the Performance of Suppliers:
An Analysis of Evaluation Processes, The Journal of Supply Chain Management, Winter,
pp. 29-41
Southard, P.B. & Swenseth, S.R. (2008).Evaluating Vendor-Managed Inventory (VMI) in Non-
Traditional Environments Using Simulation. International Journal of Production
Economics, 116, 275-287.
Srinivasan, M., Mukherjee, D., & S. Gaur, A. (2011). Buyer-Supplier Partnership Quality and
Supply Chain Performance: Moderating Role of Risk, and Environmental Uncertainty.
European Management Journal, 29, 260-271
Stueland, V. J. (2004). Supplier Evaluations: Best Practices and Creating or Improving Your
Own Evaluation. 89th Annual International Supply Management Conference.
Thairu et al., (2012).Business and Management Review Vol. 2(5) pp. 61 – 74 July, 2012 ISSN:
2047 - 0398 Available online at http://www.businessjournalz.org/bmr

37
APPENDICES
Appendix I: Letter of Introduction

38
APPENDIX II: QUESTIONNAIRE
This questionnaire seeks to collect information on the criteria used to evaluate suppliers and its
relationship to performance in food and beverage manufacturing companies in Nairobi city
County. Any information given will be exclusively used for this study and will be treated with
utmost confidentiality.
Kindly fill it as sincerely as possible.
SECTION A: ORGANIZATIONAL PROFILE
Please tick ( ) appropriately for better understanding of your organization
Does your company evaluate suppliers? YES NO
For how long has your organization been evaluating suppliers?
1 to less than 2 years
2 to less than 5 years
5 years and over
How would you classify the products your firm manufactures?
Food Beverages
SECTION B: SUPPLIER EVALUATION CRITERIA
Kindly indicate on a scale of 1-5 the extent to which the followingsupplier evaluation criteria are
used by your firm where 1= very small extent; 2= small extent; 3= moderate extent; 4=to a great
extent and = very great extent
Supplier evaluation criteria Extent
1 2 3 4 5
Financial Stability of the supplier
Quality issues
Environmental friendliness of the supplier

39
Supplier’s Organizational Culture
Price Factors
Production Capacity of the supplier
Employee Capabilities of the supplier
Preference and Reservation
SECTION C: Performance levels
Please indicate to what extent your firm realized the following performance levels by
implementing supplier evaluation where; 1=very small extent; 2=small extent; 3= moderate
extent;4=great extent; 5= very great extent.
Performance levels Extent realized
1 2 3 4 5
Reduced the number of defects
Reduced the number of reworks
Reduced the number of returns inwards
Reduced the overall cost of handling inventory
Increased number of customer satisfied with service/year
Reduced the administrative/ transactions cost due to reduced base
Improved on time delivery
Reduced time to the market of products
Increased rate of new product introduction
Led to cycle time reduction
Reduced the number of customer complaints in a year
Reduced stock-out level

40
Increased number of on time delivery in a year
Reduced number of warranty claims
Reduced number of orders with complaint in a year
Increased supply chain delivery reliability
Utilize capacity well
Reduced product cost
Reduced overtime costs
Reduced inspection costs
Reduced supply base risks
Reduced total manufacturing costs
Increased compatibility with lean supply
Motivated suppliers to improve quality
Motivates supplier to reduce costs
Improves collaboration between supplier and your organization
THANK YOU VERY MUCH

41
Appendix III: Large Food and Beverage manufacturers in Nairobi
Aberdares Water Ltd Kevian Limited
Alpine Coolers Ltd Melvin Marsh International
Aqual Ltd Mombasa Maize Millers Ltd
Aquamist Ltd Nairobi Bottlers Ltd
Bio Foods Kenya Nakumatt Healthy Foods ltd
Blue Label Nestle Foods Kenya Ltd
Breakfast Cereal Company Kenya Ltd New Kenya Cooperative Creameries Ltd
Buseki Dairies Pembe Industries Ltd
Cardbury Kenya and East Africa Ltd Pepsi Cola
Chirag Ltd Premier food Industries Ltd
Coca Cola Juices Ltd Pristine Ltd
Deepys Industries Ltd Proctor and Allan East Africa Ltd
East Africa Sea Foods Ltd Safari Ltd
East African Breweries Ltd Sameer Agriculture & Livestock Ltd
Energy Foods Ltd Sierra Brewery
Excel Industries Ltd The good water company Ltd
Farmers Choice Ltd Tropical Heat Industries Ltd
House of Manji Ltd Tru foods
Kapa oil refineries Unga Ltd
Ken chic Ltd Unilever Kenya Ltd
Kenafric Industries Ltd Uzuri Foods Ltd
Kenya Sweets Ltd W.E Tilly Ltd
Kenya Wines Agency Ltd Wrigleys Company
Source (KAM, 2013