supplementary tables - qimr berghofer medical … · supplementary tables ... bipolar disorder, ......
TRANSCRIPT
Supplementary Tables Supplementary Table S1: ENIGMA - Major Depressive Disorder Working Group Demographics. Age (in years), sex, and MDD patients-control breakdown for participating sites Supplementary Table S2: ENIGMA - Major Depressive Disorder Working Group Clinical characteristics of MDD patients. Percentage of MDD patients using antidepressant medication, percentage of first episode and recurrent episode MDD patients, percentage of acutely depressed and remitted MDD patients, severity of symptoms, and age of onset of MDD breakdown for participating sites Supplementary Table S3: Instrument for diagnosing Major Depressive Disorder and exclusion criteria by site. Supplementary Table S4: Image acquisition and processing by site. Supplementary Table S5: Full meta-analytic results for each mean structure for the first episode MDD patients versus Controls comparison controlling for age, sex, scan center and ICV. Adjusted Cohen's d is reported. Supplementary Table S6: Full meta-analytic results for each mean structure for the recurrent MDD patients versus Controls comparison controlling for age, sex, scan center and ICV. Adjusted Cohen's d is reported. Supplementary Table S7: Full meta-analytic results for each mean structure for the first episode MDD patients versus recurrent MDD patients comparison controlling for age, sex, scan center and ICV. Adjusted Cohen's d is reported. Supplementary Table S8: Full meta-analytic results for each mean structure for the early age of onset (≤ 21) MDD patients versus Controls comparison controlling for age, sex, scan center and ICV. Adjusted Cohen's d is reported. Supplementary Table S9: Full meta-analytic results for each mean structure for the late age of onset (> 21) MDD patients versus Controls comparison controlling for age, sex, scan center and ICV. Adjusted Cohen's d is reported. Supplementary Table S10: Full meta-analytic results for each mean structure for the late age of onset (> 21) MDD patients versus early age of onset (≤ 21) MDD patients comparison controlling for age, sex, scan center and ICV. Adjusted Cohen's d is reported. Supplementary Table S11: Full meta-analytic results for each mean structure for the association between symptom severity and brain volumes within MDD patients based on the HDRS-17 questionnaire controlling for age, sex, scan center and ICV. Adjusted Cohen's d is reported.

Supplementary Table S12: Full meta-analytic results for each mean structure for the association between symptom severity and brain volumes within MDD patients based on the BDI-2 questionnaire controlling for age, sex, scan center and ICV. Adjusted Cohen's d is reported. Supplementary Table S13: Full meta-analytic results for each mean structure for the MDD patients versus Controls comparison (excluding remitted patients) controlling for age, sex, scan center and ICV. Adjusted Cohen's d is reported. Supplementary Table 14: Adjusted means and standard errors for each site including the total number of subjects (N) for each structure and split into MDD patients and controls (CTL). Means are adjusted for age, sex, scan center, and ICV using the lsmeans package in R. Supplementary Table 15: Full results from the moderator analyses of mean age, field strength of scanner, percent of acute patients, FreeSurfer version used for processing, percent of patients taking antidepressants, and percent of patients taking antipsychotics. Effect sizes for the meta-regression models were available from all 15 sites (percent of patients taking antipsychotics was not available in MMDP 1.5T and MMDP 3T). Supplementary Table S16: Meta-analytic results for each mean structure for the diagnosis * sex interactive effect in the full sample of MDD patients and Controls while controlling for age, sex, diagnosis, scan center and ICV. Adjusted Cohen's d is reported.
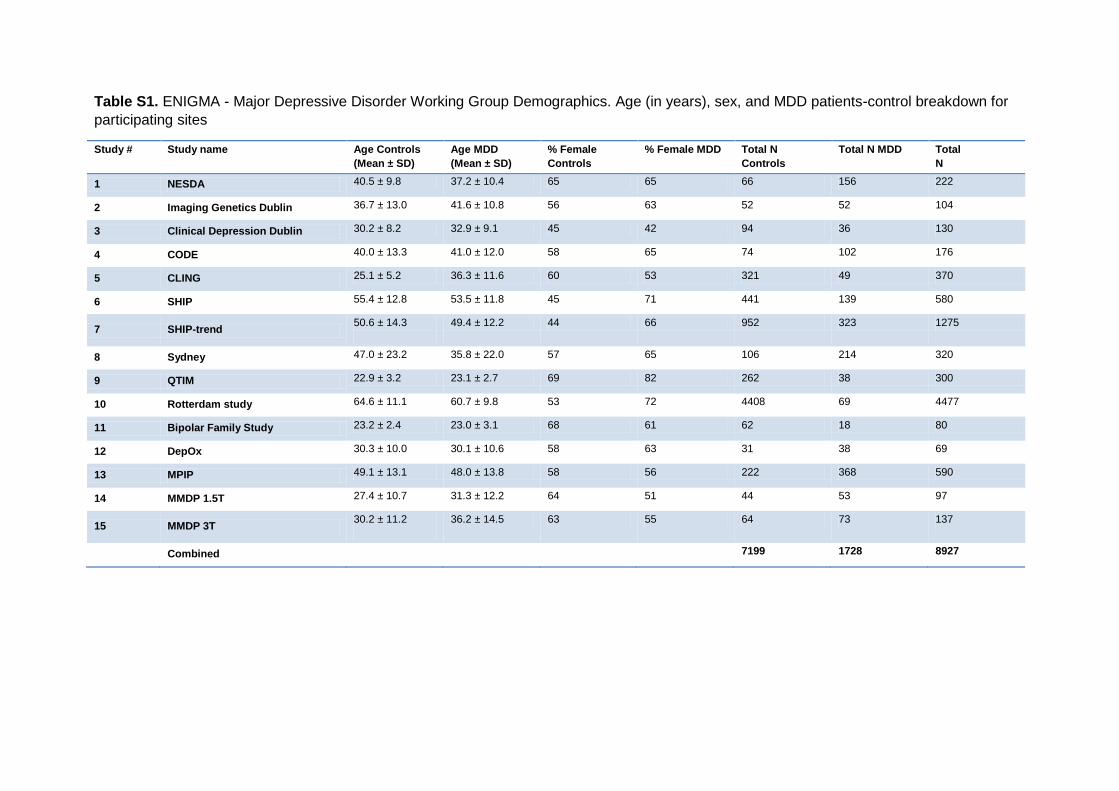
Table S1. ENIGMA - Major Depressive Disorder Working Group Demographics. Age (in years), sex, and MDD patients-control breakdown for participating sites
Study # Study name Age Controls (Mean ± SD)
Age MDD (Mean ± SD)
% Female Controls
% Female MDD Total N Controls
Total N MDD Total N
1 NESDA 40.5 ± 9.8 37.2 ± 10.4 65 65 66 156 222
2 Imaging Genetics Dublin 36.7 ± 13.0 41.6 ± 10.8 56 63 52 52 104
3 Clinical Depression Dublin 30.2 ± 8.2 32.9 ± 9.1 45 42 94 36 130
4 CODE 40.0 ± 13.3 41.0 ± 12.0 58 65 74 102 176
5 CLING 25.1 ± 5.2 36.3 ± 11.6 60 53 321 49 370
6 SHIP 55.4 ± 12.8 53.5 ± 11.8 45 71 441 139 580
7 SHIP-trend 50.6 ± 14.3
49.4 ± 12.2 44 66 952 323 1275
8 Sydney 47.0 ± 23.2 35.8 ± 22.0 57 65 106 214 320
9 QTIM 22.9 ± 3.2 23.1 ± 2.7 69 82 262 38 300
10 Rotterdam study 64.6 ± 11.1 60.7 ± 9.8 53 72 4408 69 4477
11 Bipolar Family Study 23.2 ± 2.4 23.0 ± 3.1 68 61 62 18 80
12 DepOx 30.3 ± 10.0 30.1 ± 10.6 58 63 31 38 69
13 MPIP 49.1 ± 13.1 48.0 ± 13.8 58 56 222 368 590
14 MMDP 1.5T 27.4 ± 10.7 31.3 ± 12.2 64 51 44 53 97
15 MMDP 3T 30.2 ± 11.2
36.2 ± 14.5 63 55 64 73 137
Combined 7199 1728 8927
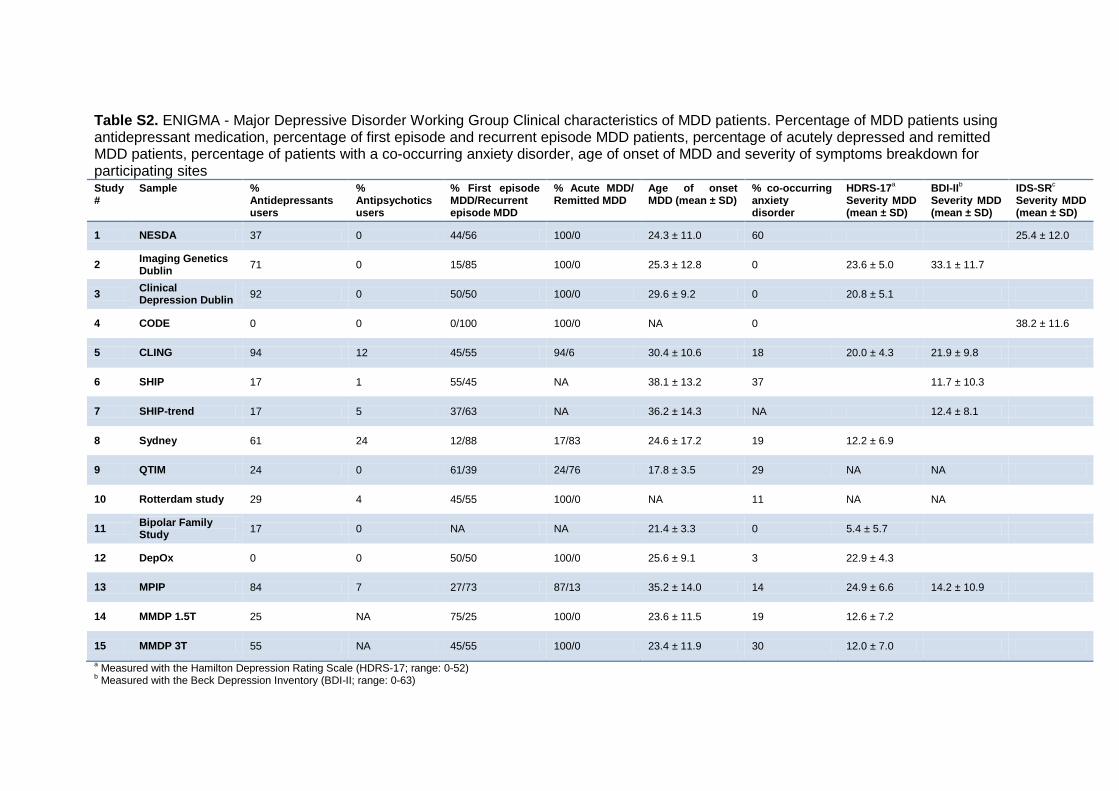
Table S2. ENIGMA - Major Depressive Disorder Working Group Clinical characteristics of MDD patients. Percentage of MDD patients using antidepressant medication, percentage of first episode and recurrent episode MDD patients, percentage of acutely depressed and remitted MDD patients, percentage of patients with a co-occurring anxiety disorder, age of onset of MDD and severity of symptoms breakdown for participating sites Study #
Sample % Antidepressants users
% Antipsychotics users
% First episode MDD/Recurrent episode MDD
% Acute MDD/ Remitted MDD
Age of onset MDD (mean ± SD)
% co-occurring anxiety disorder
HDRS-17a Severity MDD (mean ± SD)
BDI-IIb Severity MDD (mean ± SD)
IDS-SRc Severity MDD (mean ± SD)
1 NESDA 37 0 44/56 100/0 24.3 ± 11.0 60 25.4 ± 12.0
2 Imaging Genetics Dublin 71 0 15/85 100/0 25.3 ± 12.8 0 23.6 ± 5.0 33.1 ± 11.7
3 Clinical Depression Dublin 92 0 50/50 100/0 29.6 ± 9.2 0 20.8 ± 5.1
4 CODE 0 0 0/100 100/0 NA 0 38.2 ± 11.6
5 CLING 94 12 45/55 94/6 30.4 ± 10.6 18 20.0 ± 4.3 21.9 ± 9.8
6 SHIP 17 1 55/45 NA 38.1 ± 13.2 37 11.7 ± 10.3
7 SHIP-trend 17 5 37/63 NA 36.2 ± 14.3 NA 12.4 ± 8.1
8 Sydney 61 24 12/88 17/83 24.6 ± 17.2 19 12.2 ± 6.9
9 QTIM 24 0 61/39 24/76 17.8 ± 3.5 29 NA NA
10 Rotterdam study 29 4 45/55 100/0 NA 11 NA NA
11 Bipolar Family Study 17 0 NA NA 21.4 ± 3.3 0 5.4 ± 5.7
12 DepOx 0 0 50/50 100/0 25.6 ± 9.1 3 22.9 ± 4.3
13 MPIP 84 7 27/73 87/13 35.2 ± 14.0 14 24.9 ± 6.6 14.2 ± 10.9
14 MMDP 1.5T 25 NA 75/25 100/0 23.6 ± 11.5 19 12.6 ± 7.2
15 MMDP 3T 55 NA 45/55 100/0 23.4 ± 11.9 30 12.0 ± 7.0 a Measured with the Hamilton Depression Rating Scale (HDRS-17; range: 0-52) b Measured with the Beck Depression Inventory (BDI-II; range: 0-63)
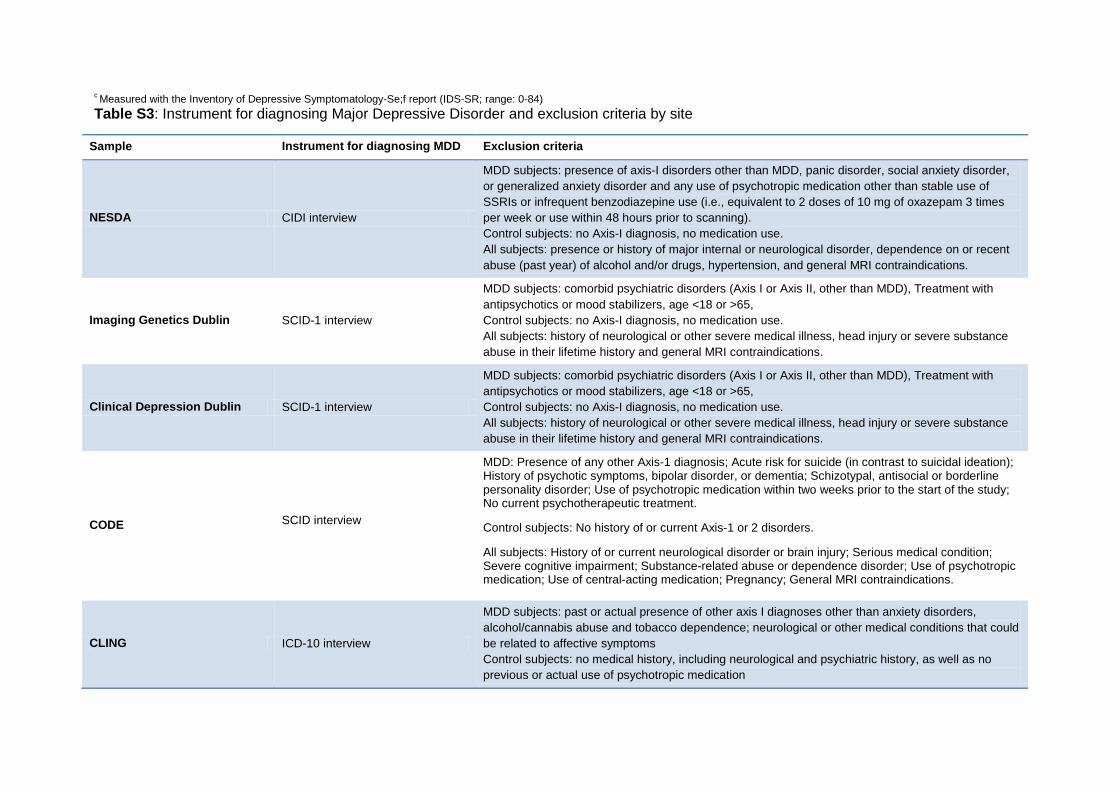
c Measured with the Inventory of Depressive Symptomatology-Se;f report (IDS-SR; range: 0-84) Table S3: Instrument for diagnosing Major Depressive Disorder and exclusion criteria by site
Sample Instrument for diagnosing MDD Exclusion criteria
NESDA CIDI interview
MDD subjects: presence of axis-I disorders other than MDD, panic disorder, social anxiety disorder, or generalized anxiety disorder and any use of psychotropic medication other than stable use of SSRIs or infrequent benzodiazepine use (i.e., equivalent to 2 doses of 10 mg of oxazepam 3 times per week or use within 48 hours prior to scanning). Control subjects: no Axis-I diagnosis, no medication use. All subjects: presence or history of major internal or neurological disorder, dependence on or recent abuse (past year) of alcohol and/or drugs, hypertension, and general MRI contraindications.
Imaging Genetics Dublin SCID-1 interview
MDD subjects: comorbid psychiatric disorders (Axis I or Axis II, other than MDD), Treatment with antipsychotics or mood stabilizers, age <18 or >65, Control subjects: no Axis-I diagnosis, no medication use. All subjects: history of neurological or other severe medical illness, head injury or severe substance abuse in their lifetime history and general MRI contraindications.
Clinical Depression Dublin SCID-1 interview
MDD subjects: comorbid psychiatric disorders (Axis I or Axis II, other than MDD), Treatment with antipsychotics or mood stabilizers, age <18 or >65, Control subjects: no Axis-I diagnosis, no medication use. All subjects: history of neurological or other severe medical illness, head injury or severe substance abuse in their lifetime history and general MRI contraindications.
CODE SCID interview
MDD: Presence of any other Axis-1 diagnosis; Acute risk for suicide (in contrast to suicidal ideation); History of psychotic symptoms, bipolar disorder, or dementia; Schizotypal, antisocial or borderline personality disorder; Use of psychotropic medication within two weeks prior to the start of the study; No current psychotherapeutic treatment.
Control subjects: No history of or current Axis-1 or 2 disorders.
All subjects: History of or current neurological disorder or brain injury; Serious medical condition; Severe cognitive impairment; Substance-related abuse or dependence disorder; Use of psychotropic medication; Use of central-acting medication; Pregnancy; General MRI contraindications.
CLING ICD-10 interview
MDD subjects: past or actual presence of other axis I diagnoses other than anxiety disorders, alcohol/cannabis abuse and tobacco dependence; neurological or other medical conditions that could be related to affective symptoms Control subjects: no medical history, including neurological and psychiatric history, as well as no previous or actual use of psychotropic medication

SHIP M-CIDI interview
MDD subjects: presence of axis-I disorders other than MDD, anxiety disorders, conversion, somatization and eating disorder. Control subjects: no lifetime diagnosis of depression, no antidepressiva, and severity index=0 All subjects: We removed subjects with medical conditions (e.g. a history of cerebral tumor, stroke, Parkinson’s diseases, multiple sclerosis, epilepsy, hydrocephalus, enlarged ventricles, pathological lesions) or due to technical reasons (e.g. severe movement artifacts or inhomogeneity of the magnetic field).
SHIP-trend M-CIDI interview
MDD subjects: no special exclusion criteria Control subjects: no lifetime diagnosis of depression, no antidepressiva, and severity index=0 All subjects: We removed subjects with due to medical conditions (e.g. a history of cerebral tumor, stroke, Parkinson’s diseases, multiple sclerosis, epilepsy, hydrocephalus, enlarged ventricles, pathological lesions) or due to technical reasons (e.g. severe movement artifacts or inhomogeneity of the magnetic field).
Sydney SCID interview
MDD subjects: presence of axis-I disorders other than MDD, panic disorder, social anxiety disorder, or generalized anxiety disorder. Control subjects: no Axis-I diagnosis, no medication use. Exclusion criteria for all subjects included medical instability (as determined by a psychiatrist), history of neurological disease (e.g. tumour, head trauma, epilepsy), medical illness known to impact cognitive and brain function (e.g. cancer), intellectual and/or developmental disability and insufficient English for neuropsychological assessment. All subjects were asked to abstain from drug or alcohol use for 48 hours prior to testing and informed about a drug screen protocol.
QTIM CIDI interview
MDD subjects: presence of axis-I disorders other than MDD, anxiety disorders Control subjects: antidepressant use, psychiatric disorders All subjects: relatedness between subjects, left handedness, history of neurological or other severe medical illness, head injury or current or past diagnosis of substance abuse, use of cognition affecting medication and general MRI contraindications
Rotterdam study SCAN interview
MDD subjects: Persons who screened positive for depressive symptoms on CESD but did not meet criteria for MDD from SCAN interview. Persons who screened positive for depressive symptoms on CESD and then did not undergo SCAN interview. Presence of axis-I disorders other than MDD and anxiety disorders (DSM-IV). Persons with MRI contraindications. Control subjects: use of psychoanaleptics, MRI contraindications.
Bipolar Family Study SCID interview MDD subjects: presence of other axis I diagnoses. Control subjects: no medical history, including neurological and psychiatric history, as well as no previous or actual use of psychotropic medication
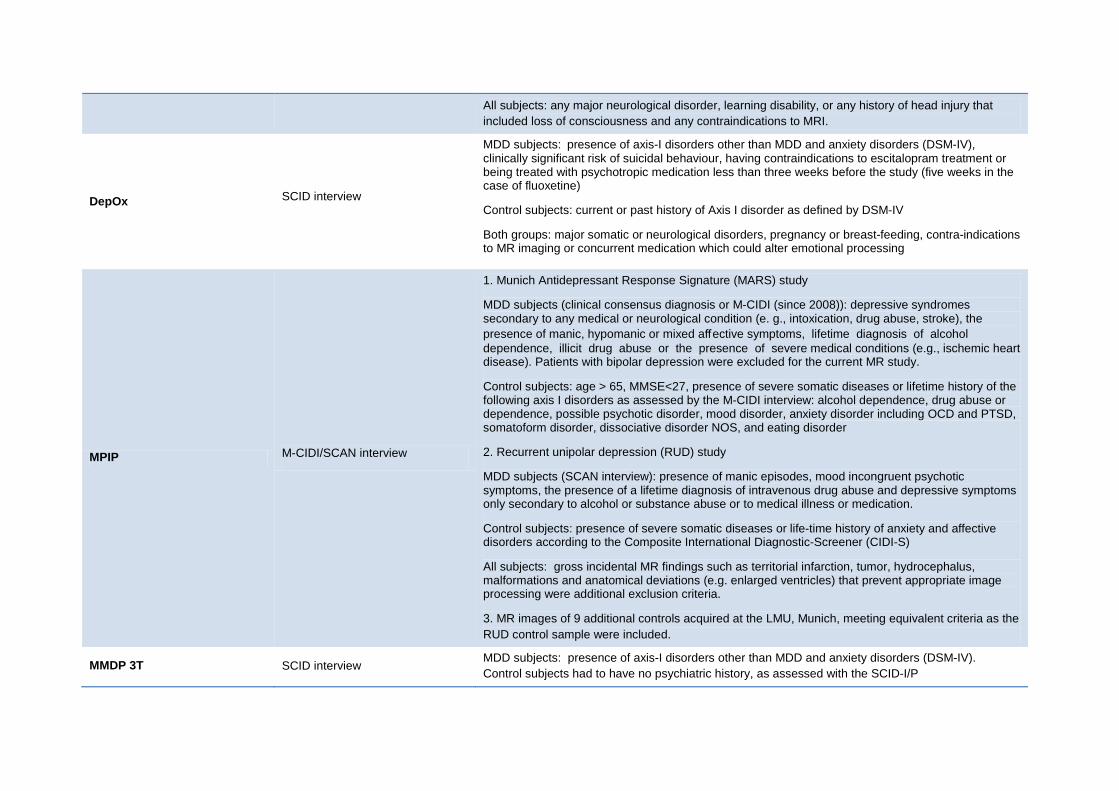
All subjects: any major neurological disorder, learning disability, or any history of head injury that included loss of consciousness and any contraindications to MRI.
DepOx SCID interview
MDD subjects: presence of axis-I disorders other than MDD and anxiety disorders (DSM-IV), clinically significant risk of suicidal behaviour, having contraindications to escitalopram treatment or being treated with psychotropic medication less than three weeks before the study (five weeks in the case of fluoxetine)
Control subjects: current or past history of Axis I disorder as defined by DSM-IV
Both groups: major somatic or neurological disorders, pregnancy or breast-feeding, contra-indications to MR imaging or concurrent medication which could alter emotional processing
MPIP M-CIDI/SCAN interview
1. Munich Antidepressant Response Signature (MARS) study
MDD subjects (clinical consensus diagnosis or M-CIDI (since 2008)): depressive syndromes secondary to any medical or neurological condition (e. g., intoxication, drug abuse, stroke), the presence of manic, hypomanic or mixed affective symptoms, lifetime diagnosis of alcohol dependence, illicit drug abuse or the presence of severe medical conditions (e.g., ischemic heart disease). Patients with bipolar depression were excluded for the current MR study.
Control subjects: age > 65, MMSE<27, presence of severe somatic diseases or lifetime history of the following axis I disorders as assessed by the M-CIDI interview: alcohol dependence, drug abuse or dependence, possible psychotic disorder, mood disorder, anxiety disorder including OCD and PTSD, somatoform disorder, dissociative disorder NOS, and eating disorder
2. Recurrent unipolar depression (RUD) study
MDD subjects (SCAN interview): presence of manic episodes, mood incongruent psychotic symptoms, the presence of a lifetime diagnosis of intravenous drug abuse and depressive symptoms only secondary to alcohol or substance abuse or to medical illness or medication.
Control subjects: presence of severe somatic diseases or life-time history of anxiety and affective disorders according to the Composite International Diagnostic-Screener (CIDI-S)
All subjects: gross incidental MR findings such as territorial infarction, tumor, hydrocephalus, malformations and anatomical deviations (e.g. enlarged ventricles) that prevent appropriate image processing were additional exclusion criteria.
3. MR images of 9 additional controls acquired at the LMU, Munich, meeting equivalent criteria as the RUD control sample were included.
MMDP 3T SCID interview MDD subjects: presence of axis-I disorders other than MDD and anxiety disorders (DSM-IV). Control subjects had to have no psychiatric history, as assessed with the SCID-I/P
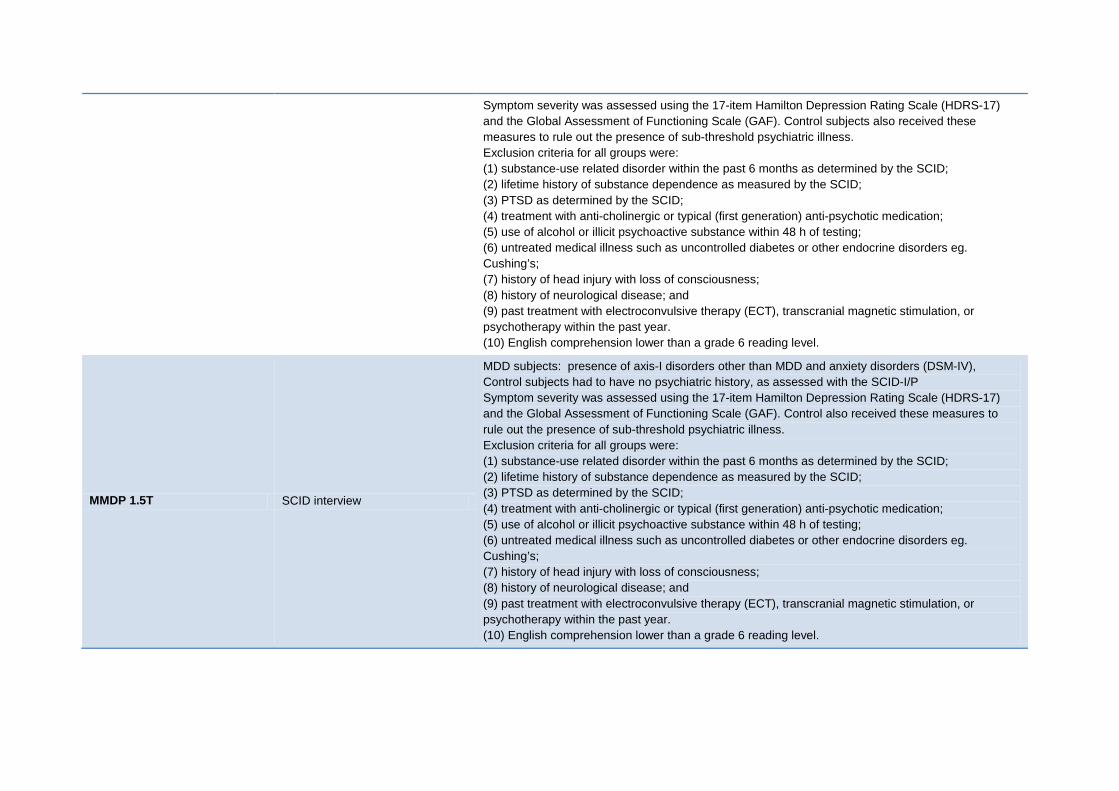
Symptom severity was assessed using the 17-item Hamilton Depression Rating Scale (HDRS-17) and the Global Assessment of Functioning Scale (GAF). Control subjects also received these measures to rule out the presence of sub-threshold psychiatric illness. Exclusion criteria for all groups were: (1) substance-use related disorder within the past 6 months as determined by the SCID; (2) lifetime history of substance dependence as measured by the SCID; (3) PTSD as determined by the SCID; (4) treatment with anti-cholinergic or typical (first generation) anti-psychotic medication; (5) use of alcohol or illicit psychoactive substance within 48 h of testing; (6) untreated medical illness such as uncontrolled diabetes or other endocrine disorders eg. Cushing’s; (7) history of head injury with loss of consciousness; (8) history of neurological disease; and (9) past treatment with electroconvulsive therapy (ECT), transcranial magnetic stimulation, or psychotherapy within the past year. (10) English comprehension lower than a grade 6 reading level.
MMDP 1.5T SCID interview
MDD subjects: presence of axis-I disorders other than MDD and anxiety disorders (DSM-IV), Control subjects had to have no psychiatric history, as assessed with the SCID-I/P Symptom severity was assessed using the 17-item Hamilton Depression Rating Scale (HDRS-17) and the Global Assessment of Functioning Scale (GAF). Control also received these measures to rule out the presence of sub-threshold psychiatric illness. Exclusion criteria for all groups were: (1) substance-use related disorder within the past 6 months as determined by the SCID; (2) lifetime history of substance dependence as measured by the SCID; (3) PTSD as determined by the SCID; (4) treatment with anti-cholinergic or typical (first generation) anti-psychotic medication; (5) use of alcohol or illicit psychoactive substance within 48 h of testing; (6) untreated medical illness such as uncontrolled diabetes or other endocrine disorders eg. Cushing’s; (7) history of head injury with loss of consciousness; (8) history of neurological disease; and (9) past treatment with electroconvulsive therapy (ECT), transcranial magnetic stimulation, or psychotherapy within the past year. (10) English comprehension lower than a grade 6 reading level.
MDD: Major Depressive Disorder; CIDI: the Composite International Diagnostic Interview; SCID: Structured Clinical Interview for DSM disorders; SCAN: Schedules for Clinical Assessment in Neuropsychiatry; CESD: Center for Epidemiologic Studies Depression scale; DSM: Diagnostic and Statistical Manual of Mental Disorders; MRI: Magnetic Resonance Imaging; OCD: Obsessive Compulsive Disorder; PTSD: Posttraumatic Stress Disorder.
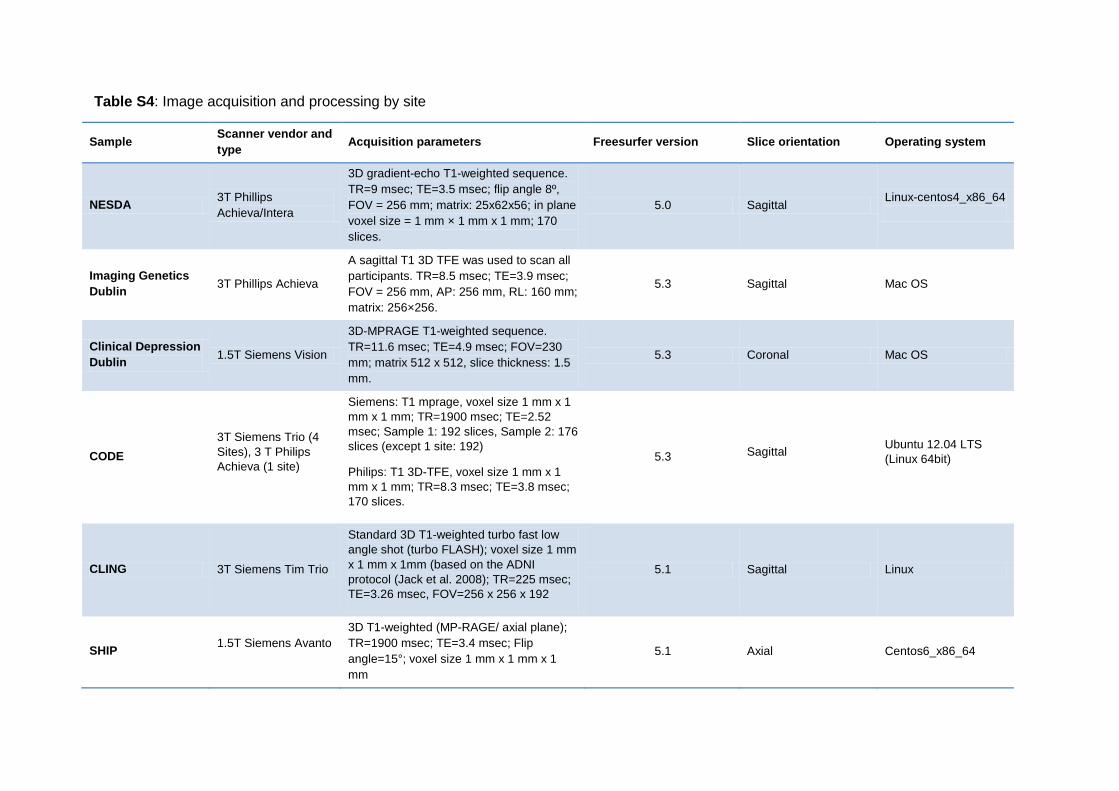
Table S4: Image acquisition and processing by site
Sample Scanner vendor and type Acquisition parameters Freesurfer version Slice orientation Operating system
NESDA 3T Phillips Achieva/Intera
3D gradient-echo T1-weighted sequence. TR=9 msec; TE=3.5 msec; flip angle 8º, FOV = 256 mm; matrix: 25x62x56; in plane voxel size = 1 mm × 1 mm x 1 mm; 170 slices.
5.0 Sagittal Linux-centos4_x86_64
Imaging Genetics Dublin 3T Phillips Achieva
A sagittal T1 3D TFE was used to scan all participants. TR=8.5 msec; TE=3.9 msec; FOV = 256 mm, AP: 256 mm, RL: 160 mm; matrix: 256×256.
5.3 Sagittal Mac OS
Clinical Depression Dublin 1.5T Siemens Vision
3D-MPRAGE T1-weighted sequence. TR=11.6 msec; TE=4.9 msec; FOV=230 mm; matrix 512 x 512, slice thickness: 1.5 mm.
5.3 Coronal Mac OS
CODE 3T Siemens Trio (4 Sites), 3 T Philips Achieva (1 site)
Siemens: T1 mprage, voxel size 1 mm x 1 mm x 1 mm; TR=1900 msec; TE=2.52 msec; Sample 1: 192 slices, Sample 2: 176 slices (except 1 site: 192)
Philips: T1 3D-TFE, voxel size 1 mm x 1 mm x 1 mm; TR=8.3 msec; TE=3.8 msec; 170 slices.
5.3 Sagittal Ubuntu 12.04 LTS (Linux 64bit)
CLING 3T Siemens Tim Trio
Standard 3D T1-weighted turbo fast low angle shot (turbo FLASH); voxel size 1 mm x 1 mm x 1mm (based on the ADNI protocol (Jack et al. 2008); TR=225 msec; TE=3.26 msec, FOV=256 x 256 x 192
5.1 Sagittal Linux
SHIP 1.5T Siemens Avanto
3D T1-weighted (MP-RAGE/ axial plane); TR=1900 msec; TE=3.4 msec; Flip angle=15°; voxel size 1 mm x 1 mm x 1 mm
5.1 Axial Centos6_x86_64
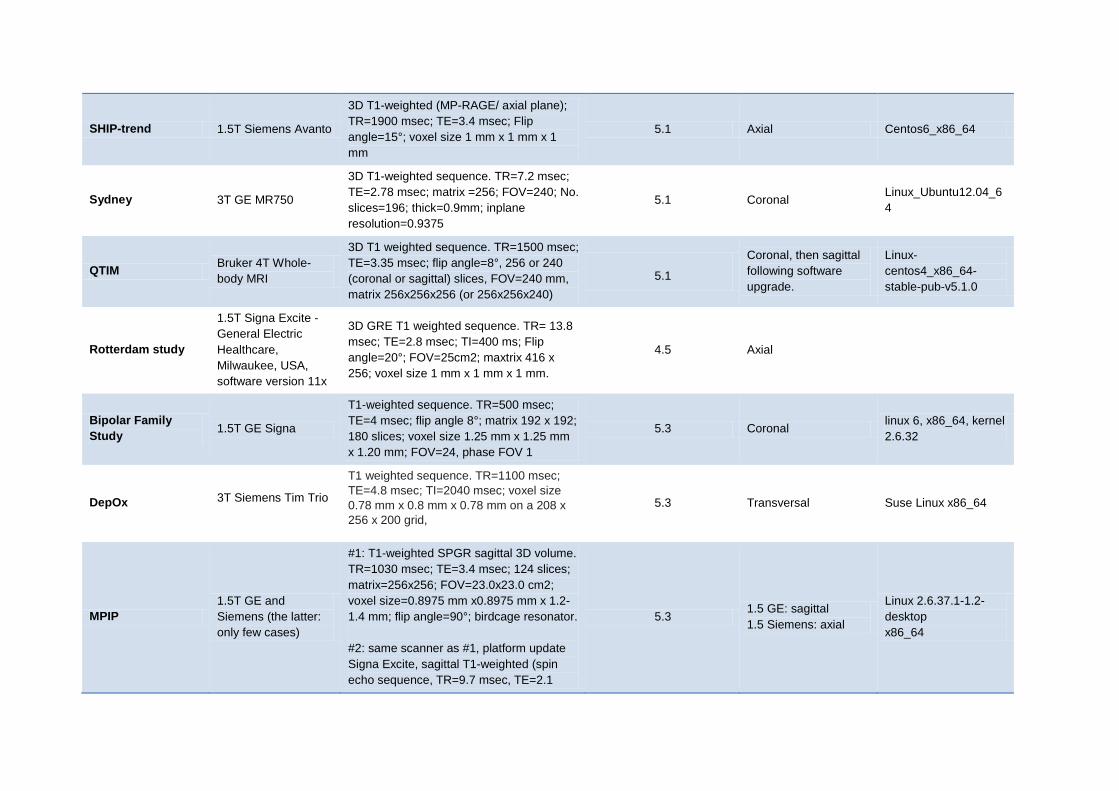
SHIP-trend 1.5T Siemens Avanto
3D T1-weighted (MP-RAGE/ axial plane); TR=1900 msec; TE=3.4 msec; Flip angle=15°; voxel size 1 mm x 1 mm x 1 mm
5.1 Axial Centos6_x86_64
Sydney 3T GE MR750
3D T1-weighted sequence. TR=7.2 msec; TE=2.78 msec; matrix =256; FOV=240; No. slices=196; thick=0.9mm; inplane resolution=0.9375
5.1 Coronal Linux_Ubuntu12.04_64
QTIM Bruker 4T Whole-body MRI
3D T1 weighted sequence. TR=1500 msec; TE=3.35 msec; flip angle=8°, 256 or 240 (coronal or sagittal) slices, FOV=240 mm, matrix 256x256x256 (or 256x256x240)
5.1
Coronal, then sagittal following software upgrade.
Linux-centos4_x86_64-stable-pub-v5.1.0
Rotterdam study
1.5T Signa Excite -General Electric Healthcare, Milwaukee, USA, software version 11x
3D GRE T1 weighted sequence. TR= 13.8 msec; TE=2.8 msec; TI=400 ms; Flip angle=20°; FOV=25cm2; maxtrix 416 x 256; voxel size 1 mm x 1 mm x 1 mm.
4.5 Axial
Bipolar Family Study 1.5T GE Signa
T1-weighted sequence. TR=500 msec; TE=4 msec; flip angle 8°; matrix 192 x 192; 180 slices; voxel size 1.25 mm x 1.25 mm x 1.20 mm; FOV=24, phase FOV 1
5.3 Coronal linux 6, x86_64, kernel 2.6.32
DepOx 3T Siemens Tim Trio
T1 weighted sequence. TR=1100 msec; TE=4.8 msec; TI=2040 msec; voxel size 0.78 mm x 0.8 mm x 0.78 mm on a 208 x 256 x 200 grid,
5.3 Transversal Suse Linux x86_64
MPIP 1.5T GE and Siemens (the latter: only few cases)
#1: T1-weighted SPGR sagittal 3D volume. TR=1030 msec; TE=3.4 msec; 124 slices; matrix=256x256; FOV=23.0x23.0 cm2; voxel size=0.8975 mm x0.8975 mm x 1.2-1.4 mm; flip angle=90°; birdcage resonator. #2: same scanner as #1, platform update Signa Excite, sagittal T1-weighted (spin echo sequence, TR=9.7 msec, TE=2.1
5.3 1.5 GE: sagittal 1.5 Siemens: axial
Linux 2.6.37.1-1.2-desktop x86_64
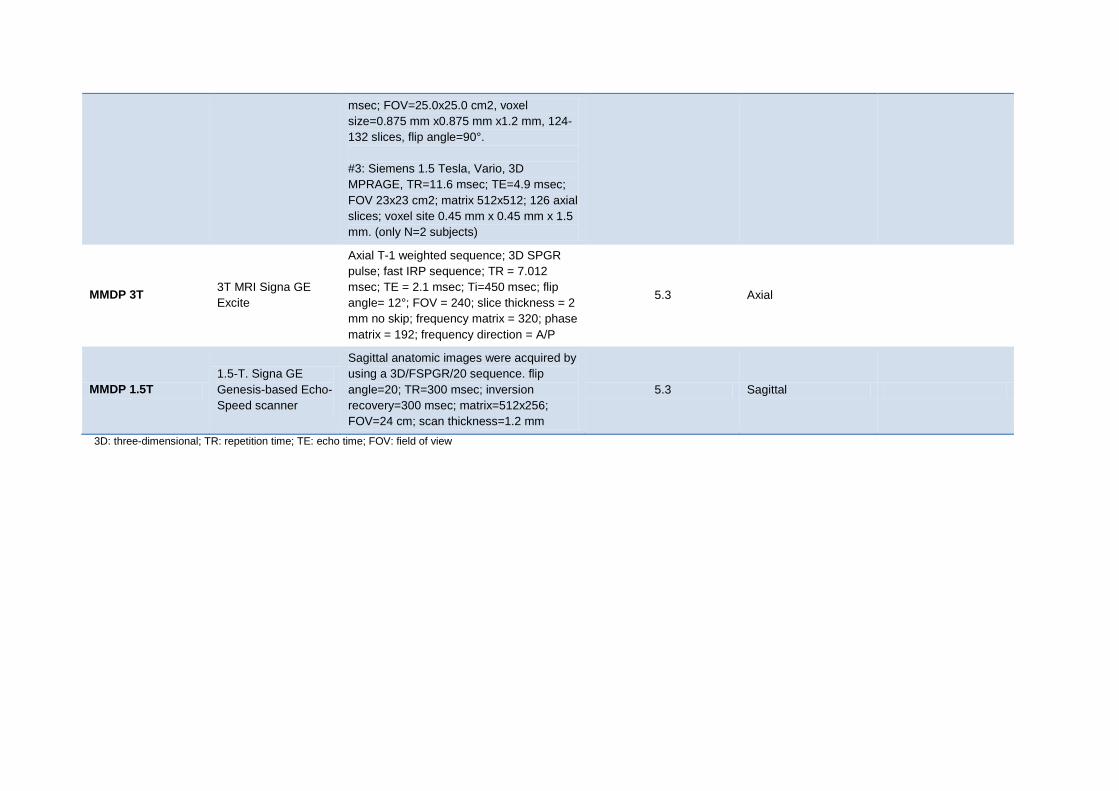
3D: three-dimensional; TR: repetition time; TE: echo time; FOV: field of view
msec; FOV=25.0x25.0 cm2, voxel size=0.875 mm x0.875 mm x1.2 mm, 124-132 slices, flip angle=90°. #3: Siemens 1.5 Tesla, Vario, 3D MPRAGE, TR=11.6 msec; TE=4.9 msec; FOV 23x23 cm2; matrix 512x512; 126 axial slices; voxel site 0.45 mm x 0.45 mm x 1.5 mm. (only N=2 subjects)
MMDP 3T 3T MRI Signa GE Excite
Axial T-1 weighted sequence; 3D SPGR pulse; fast IRP sequence; TR = 7.012 msec; TE = 2.1 msec; Ti=450 msec; flip angle= 12°; FOV = 240; slice thickness = 2 mm no skip; frequency matrix = 320; phase matrix = 192; frequency direction = A/P
5.3 Axial
MMDP 1.5T 1.5-T. Signa GE Genesis-based Echo-Speed scanner
Sagittal anatomic images were acquired by using a 3D/FSPGR/20 sequence. flip angle=20; TR=300 msec; inversion recovery=300 msec; matrix=512x256; FOV=24 cm; scan thickness=1.2 mm
5.3 Sagittal

Supplementary Table S5: Full meta-analytic results for each mean structure for the first episode MDD patients versus Controls comparison controlling for age, sex, scan center and ICV. Adjusted Cohen's d is reported.
Cohen's d a
(First episode MDD - CTL)
Std. Err. 95% CI % Difference P-value I2 # Controls # Patients
Lateral Ventricles 0.034 0.049 [-0.061 - 0.129] 0.601 0.485 <0.001 6922 567
Thalamus -0.047 0.049 [-0.142 - 0.049] -0.575 0.339 <0.001 6910 566
Caudate -0.009 0.088 [-0.181 - 0.164] -0.542 0.923 65.118 6898 573
Putamen -0.032 0.061 [-0.151 - 0.088] -0.652 0.605 27.697 6821 557
Pallidum -0.008 0.049 [-0.104 - 0.089] -0.286 0.876 <0.001 6882 558
Hippocampus -0.073 0.074 [-0.219 - 0.073] -0.762 0.325 51.155 6904 572
Amygdala -0.041 0.057 [-0.153 - 0.072] -0.317 0.478 20.999 6924 570
Accumbens 0.012 0.066 [-0.117 - 0.142] -0.117 0.853 37.094 6831 550
ICV -0.005 0.055 [-0.113 - 0.103] -0.071 0.930 17.697 7063 583 a Included Samples: NESDA, Clinical Depression Dublin, CLING, SHIP, SHIP-trend, Sydney, QTIM, Rotterdam study, DepOx, MPIP, MMDP 3T, MMDP 1.5T. ICV: Intracranial Volume; MDD: Major Depressive Disorder; CTL: Controls.

Supplementary Table S6: Full meta-analytic results for each mean structure for the recurrent MDD patients versus Controls comparison controlling for age, sex, scan center and ICV. Adjusted Cohen's d is reported.
Cohen's d a
(Recurrent MDD - CTL)
Std. Err. 95% CI % Difference P-value I2 # Controls # Patients
Lateral Ventricles 0.067 0.040 [-0.01 - 0.145] 2.096 0.089 <0.001 6996 1096
Thalamus 0.001 0.040 [-0.078 - 0.079] -0.042 0.990 <0.001 6984 1090
Caudate 0.015 0.052 [-0.086 - 0.117] 0.268 0.768 29.644 6972 1082
Putamen 0.045 0.043 [-0.039 - 0.128] 0.404 0.294 5.850 6895 1073
Pallidum 0.010 0.040 [-0.069 - 0.089] 0.114 0.799 <0.001 6956 1073
Hippocampus -0.174 0.040 [-0.252 - -0.096] -1.443 1.12E-05 <0.001 6978 1102
Amygdala -0.070 0.040 [-0.148 - 0.008] -0.814 0.077 <0.001 6998 1100
Accumbens -0.043 0.040 [-0.121 - 0.036] -0.612 0.288 <0.001 6905 1076
ICV 0.017 0.046 [-0.074 - 0.108] 0.135 0.712 18.621 7137 1119
a Included Samples: NESDA, Imaging Genetics Dublin, Clinical Depression Dublin, CODE, CLING, SHIP, SHIP-trend, Sydney, QTIM, Rotterdam study, DepOx, MPIP, MMDP 3T, MMDP 1.5T. ICV: Intracranial Volume; MDD: Major Depressive Disorder; CTL: Controls.
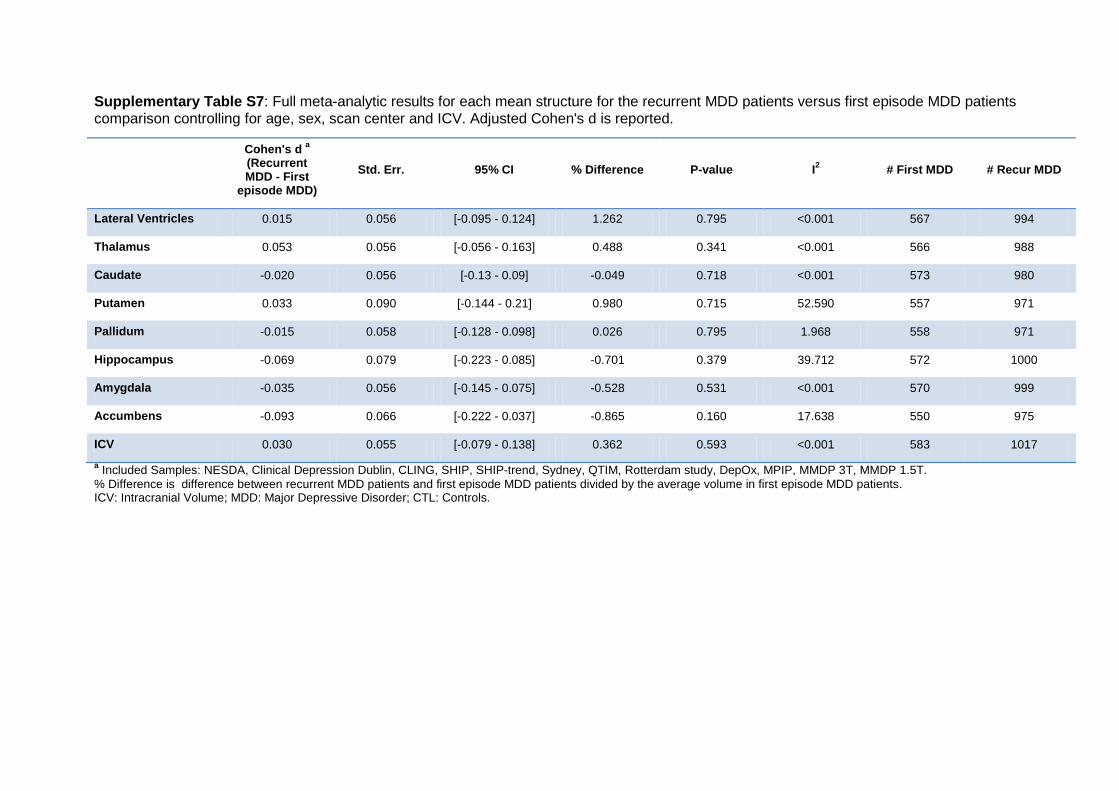
Supplementary Table S7: Full meta-analytic results for each mean structure for the recurrent MDD patients versus first episode MDD patients comparison controlling for age, sex, scan center and ICV. Adjusted Cohen's d is reported.
Cohen's d a (Recurrent MDD - First
episode MDD)
Std. Err. 95% CI % Difference P-value I2 # First MDD # Recur MDD
Lateral Ventricles 0.015 0.056 [-0.095 - 0.124] 1.262 0.795 <0.001 567 994
Thalamus 0.053 0.056 [-0.056 - 0.163] 0.488 0.341 <0.001 566 988
Caudate -0.020 0.056 [-0.13 - 0.09] -0.049 0.718 <0.001 573 980
Putamen 0.033 0.090 [-0.144 - 0.21] 0.980 0.715 52.590 557 971
Pallidum -0.015 0.058 [-0.128 - 0.098] 0.026 0.795 1.968 558 971
Hippocampus -0.069 0.079 [-0.223 - 0.085] -0.701 0.379 39.712 572 1000
Amygdala -0.035 0.056 [-0.145 - 0.075] -0.528 0.531 <0.001 570 999
Accumbens -0.093 0.066 [-0.222 - 0.037] -0.865 0.160 17.638 550 975
ICV 0.030 0.055 [-0.079 - 0.138] 0.362 0.593 <0.001 583 1017 a Included Samples: NESDA, Clinical Depression Dublin, CLING, SHIP, SHIP-trend, Sydney, QTIM, Rotterdam study, DepOx, MPIP, MMDP 3T, MMDP 1.5T. % Difference is difference between recurrent MDD patients and first episode MDD patients divided by the average volume in first episode MDD patients. ICV: Intracranial Volume; MDD: Major Depressive Disorder; CTL: Controls.

Supplementary Table S8: Full meta-analytic results for each mean structure for the early age of onset (≤ 21) MDD patients versus Controls comparison controlling for age, sex, scan center and ICV. Adjusted Cohen's d is reported.
Cohen's d a (EAO MDD -
CTL) Std. Err. 95% CI % Difference P-value I2 # Controls # Patients
Lateral Ventricles 0.145 0.055 [0.037 - 0.253] 5.107 8.50E-03 <0.001 2628 533
Thalamus -0.067 0.055 [-0.175 - 0.042] -0.678 0.228 0.003 2603 531
Caudate 0.020 0.073 [-0.123 - 0.163] 0.093 0.783 36.502 2597 529
Putamen 0.020 0.067 [-0.111 - 0.151] 0.075 0.763 24.492 2533 525
Pallidum 0.047 0.060 [-0.071 - 0.165] 0.538 0.434 10.892 2572 526
Hippocampus -0.205 0.056 [-0.314 - -0.096] -1.846 2.31E-04 0.579 2603 533
Amygdala -0.117 0.055 [-0.225 - -0.01] -1.228 0.033 <0.001 2612 537
Accumbens -0.058 0.056 [-0.167 - 0.052] -0.830 0.302 <0.001 2504 526
ICV 0.041 0.080 [-0.116 - 0.199] -0.173 0.607 48.751 2717 541
a Included Samples: NESDA, Imaging Genetics Dublin, CLING, SHIP, SHIP-trend, Sydney, QTIM, DepOx, MPIP, MMDP 3T, MMDP 1.5T. ICV: Intracranial Volume; EAO: Early Age of Onset; MDD: Major Depressive Disorder; CTL: Controls.
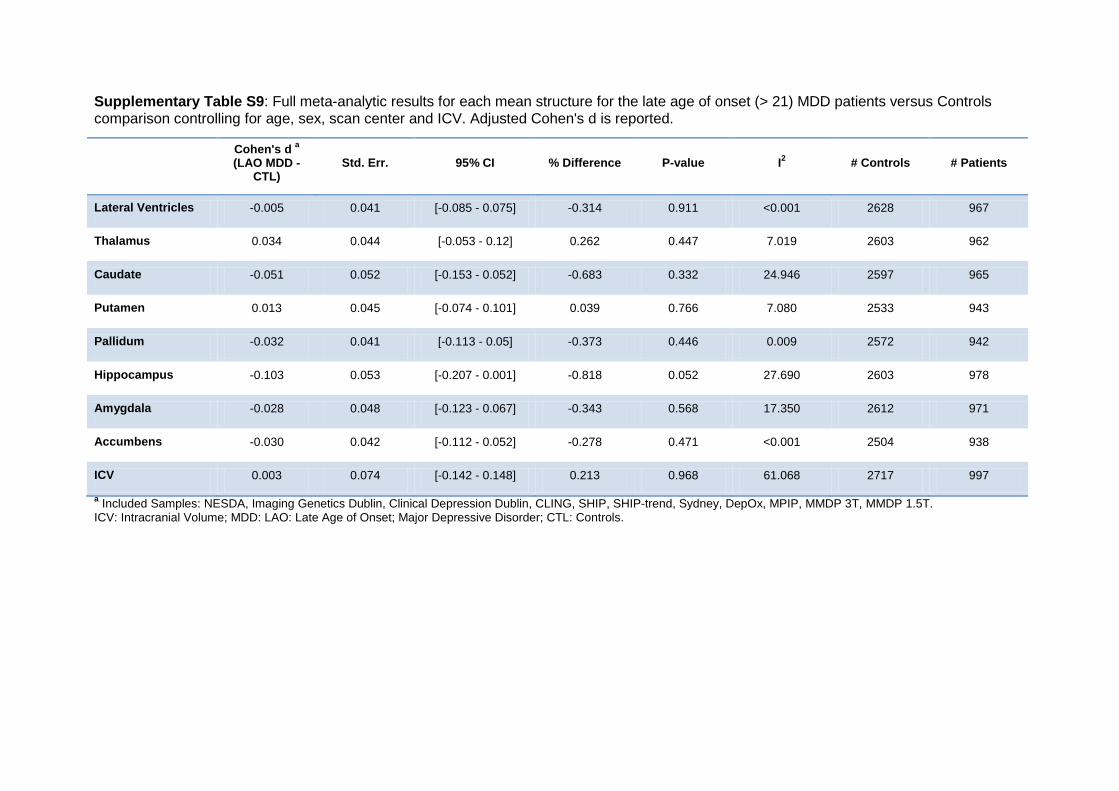
Supplementary Table S9: Full meta-analytic results for each mean structure for the late age of onset (> 21) MDD patients versus Controls comparison controlling for age, sex, scan center and ICV. Adjusted Cohen's d is reported.
Cohen's d a (LAO MDD -
CTL) Std. Err. 95% CI % Difference P-value I2 # Controls # Patients
Lateral Ventricles -0.005 0.041 [-0.085 - 0.075] -0.314 0.911 <0.001 2628 967
Thalamus 0.034 0.044 [-0.053 - 0.12] 0.262 0.447 7.019 2603 962
Caudate -0.051 0.052 [-0.153 - 0.052] -0.683 0.332 24.946 2597 965
Putamen 0.013 0.045 [-0.074 - 0.101] 0.039 0.766 7.080 2533 943
Pallidum -0.032 0.041 [-0.113 - 0.05] -0.373 0.446 0.009 2572 942
Hippocampus -0.103 0.053 [-0.207 - 0.001] -0.818 0.052 27.690 2603 978
Amygdala -0.028 0.048 [-0.123 - 0.067] -0.343 0.568 17.350 2612 971
Accumbens -0.030 0.042 [-0.112 - 0.052] -0.278 0.471 <0.001 2504 938
ICV 0.003 0.074 [-0.142 - 0.148] 0.213 0.968 61.068 2717 997
a Included Samples: NESDA, Imaging Genetics Dublin, Clinical Depression Dublin, CLING, SHIP, SHIP-trend, Sydney, DepOx, MPIP, MMDP 3T, MMDP 1.5T. ICV: Intracranial Volume; MDD: LAO: Late Age of Onset; Major Depressive Disorder; CTL: Controls.

Supplementary Table S10: Full meta-analytic results for each mean structure for the late age of onset (> 21) MDD patients versus early age of onset (≤ 21) MDD patients comparison controlling for age, sex, scan center and ICV. Adjusted Cohen's d is reported.
Cohen's d a (LAO MDD – EAO MDD)
Std. Err. 95% CI % Difference P-value I2 # Controls # Patients
Lateral Ventricles -0.133 0.062 [-0.254 - -0.011] -7.101 0.032 <0.001 533 967
Thalamus 0.096 0.070 [-0.042 - 0.234] 1.554 0.173 15.429 531 962
Caudate -0.059 0.077 [-0.21 - 0.092] -1.209 0.442 26.757 529 965
Putamen -0.028 0.070 [-0.164 - 0.109] -0.625 0.691 13.196 525 943
Pallidum -0.082 0.090 [-0.258 - 0.094] -2.064 0.359 43.465 526 942
Hippocampus 0.143 0.066 [0.013 - 0.272] 2.228 0.031 8.355 533 978
Amygdala 0.120 0.065 [-0.008 - 0.247] 1.940 0.066 5.954 537 971
Accumbens 0.074 0.063 [-0.049 - 0.198] 1.079 0.238 <0.001 526 938
ICV -0.074 0.096 [-0.262 - 0.114] -0.609 0.439 52.258 541 997
a Included Samples: NESDA, Imaging Genetics Dublin, CLING, SHIP, SHIP-trend, Sydney, DepOx, MPIP, MMDP 3T, MMDP 1.5T. % Difference is difference between late age of onset (> 21) MDD patients and early age of onset (≤ 21) MDD patients divided by the average volume in late age of onset (> 21) MDD patients. ICV: Intracranial Volume; LAO: Late Age of Onset; EAO: Early Age of Onset; MDD: Major Depressive Disorder.

Supplementary Table S11: Full meta-analytic results for each mean structure for the association between symptom severity and brain volumes within MDD patients based on the HDRS-17 questionnaire controlling for age, sex, scan center and ICV. Adjusted Cohen's d is reported.
Pearson's r a Std. Err. 95% CI P-value I2 # Patients
Lateral Ventricles -0.013 0.066 [-0.142 - 0.117] 0.847 59.501 659
Thalamus 0.018 0.039 [-0.058 - 0.094] 0.640 0.003 658
Caudate 0.076 0.039 [-0.001 - 0.152] 0.053 <0.001 654
Putamen 0.005 0.039 [-0.072 - 0.081] 0.900 <0.001 657
Pallidum -0.018 0.039 [-0.095 - 0.058] 0.639 <0.001 656
Hippocampus 0.109 0.068 [-0.024 - 0.241] 0.109 62.572 664
Amygdala 0.022 0.050 [-0.075 - 0.119] 0.659 29.854 667
Accumbens 0.017 0.039 [-0.059 - 0.093] 0.663 0.020 658
ICV 0.002 0.039 [-0.073 - 0.078] 0.956 <0.001 667
a Included samples: Imaging Genetics Dublin, Clinical Depression Dublin, CLING, Sydney, Bipolar Family Study, DepOx, MPIP, MMDP 3T, MMDP 1.5T. HDRS-17: Hamilton Rating Scale for Depression 17 items; ICV: Intracranial Volume; MDD: Major Depressive Disorder.
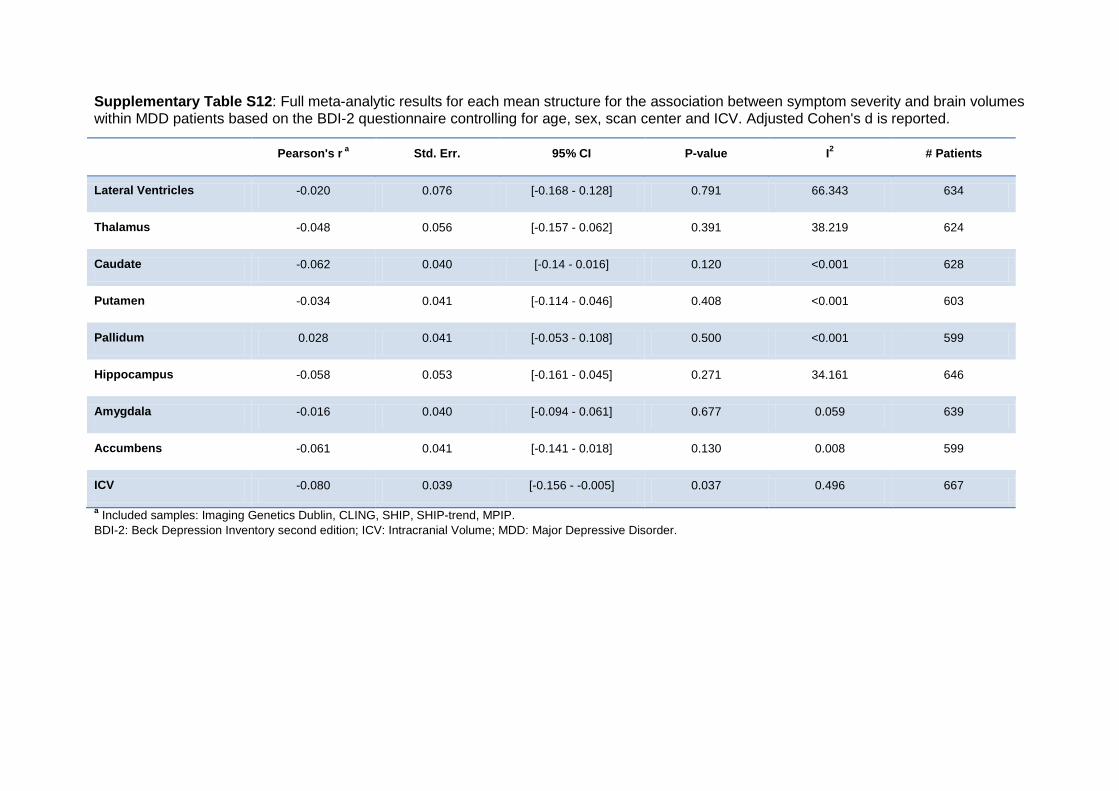
Supplementary Table S12: Full meta-analytic results for each mean structure for the association between symptom severity and brain volumes within MDD patients based on the BDI-2 questionnaire controlling for age, sex, scan center and ICV. Adjusted Cohen's d is reported.
Pearson's r a Std. Err. 95% CI P-value I2 # Patients
Lateral Ventricles -0.020 0.076 [-0.168 - 0.128] 0.791 66.343 634
Thalamus -0.048 0.056 [-0.157 - 0.062] 0.391 38.219 624
Caudate -0.062 0.040 [-0.14 - 0.016] 0.120 <0.001 628
Putamen -0.034 0.041 [-0.114 - 0.046] 0.408 <0.001 603
Pallidum 0.028 0.041 [-0.053 - 0.108] 0.500 <0.001 599
Hippocampus -0.058 0.053 [-0.161 - 0.045] 0.271 34.161 646
Amygdala -0.016 0.040 [-0.094 - 0.061] 0.677 0.059 639
Accumbens -0.061 0.041 [-0.141 - 0.018] 0.130 0.008 599
ICV -0.080 0.039 [-0.156 - -0.005] 0.037 0.496 667
a Included samples: Imaging Genetics Dublin, CLING, SHIP, SHIP-trend, MPIP. BDI-2: Beck Depression Inventory second edition; ICV: Intracranial Volume; MDD: Major Depressive Disorder.

Supplementary Table S13: Full meta-analytic results for each mean structure for the MDD patients versus Controls comparison (excluding remitted patients) controlling for age, sex, scan center and ICV. Adjusted Cohen's d is reported.
Cohen's d a (MDD - CTL) Std. Err. 95% CI % Difference P-value I2 # Controls # Patients
Lateral Ventricles 0.081 0.060 [-0.036 - 0.198] 1.179 0.175 <0.001 4779 570
Thalamus -0.108 0.075 [-0.256 - 0.04] -1.040 0.152 33.014 4780 569
Caudate -0.015 0.061 [-0.135 - 0.106] -0.258 0.808 3.435 4782 563
Putamen 0.022 0.066 [-0.108 - 0.153] 0.146 0.737 15.933 4766 568
Pallidum -0.011 0.060 [-0.128 - 0.107] -0.174 0.855 <0.001 4788 567
Hippocampus -0.189 0.060 [-0.306 - -0.072] -1.534 0.002 <0.001 4787 575
Amygdala -0.036 0.064 [-0.162 - 0.09] -0.373 0.577 12.667 4798 576
Accumbens -0.034 0.060 [-0.151 - 0.083] -0.538 0.569 <0.001 4812 572
ICV -0.046 0.061 [-0.165 - 0.073] -0.446 0.449 3.571 4833 579
a Included samples: NESDA, Imaging Genetics Dublin, Clinical Depression Dublin, CODE, Rotterdam study, DepOx, MMDP 1.5T and MMDP 3T ICV: Intracranial Volume; MDD: Major Depressive Disorder; CTL: Controls.

Supplementary Table 14: Adjusted means and standard errors for each site including the total number of subjects (N) for each structure and split into MDD patients and controls (CTL). Means are adjusted for age, sex, scan center, and ICV using the lsmeans package in R.
Lateral Ventricles Thalamus Caudate Putamen Pallidum Hippocampus Amygdala Accumbens ICV
Mean
(Std Err) N
Mean
(Std Err) N Mean
(Std Err) N Mean
(Std Err) N Mean
(Std Err) N Mean (Std Err) N Mean
(Std Err) N Mean (Std Err) N
Mean
(Std Err) N
Bipolar Family Study
CTL 5889.994 (310.279) 62 6598.157
(61.08) 62 3761.069 (54.768) 62 5891.301
(76.594) 62 1893.376 (27.259) 62 3570.397
(42.926) 62 1878.994 (28.872) 62 709.989
(17.126) 62 1478595.321 (15147.359) 62
MDD 5564.152 (565.765) 19 6407.857
(111.373) 19 3549.248 (99.865) 19 5635.256
(139.662) 19 1905.38 (49.703) 19 3454.205
(78.272) 19 1826.493 (52.646) 19 742.377
(31.227) 19 1429565.795 (27391.122) 19
CLING
CTL 6942.48 (211.514) 321 8169.268
(36.942) 321 4038.22 (23.439) 321 5694.382
(30.049) 321 1830.209 (10.654) 321 4320.772
(18.88) 321 1511.964 (7.769) 321 600.179
(4.461) 321 1591240.917 (8643.52) 321
MDD 7237.454 (608.396) 49 8076.854
(106.259) 49 4037.733 (67.419) 49 5744.305
(86.431) 49 1828.344 (30.646) 49 4228.621
(54.308) 49 1545.63 (22.348) 49 585.005
(12.832) 49 1528713.378 (24731.27) 49
Clinical Depression
Dublin
CTL 6988.118 (353.937) 93 8016.539
(53.974) 92 3811.332 (38.635) 94 5441.171
(48.265) 92 1660.76 (15.822) 94 4356.998
(31.401) 94 1579.756 (14.264) 94 549.138
(6.435) 94 1589222.261 (13006.95) 94
MDD 6941.056 (572.299) 36 7899.126
(88.14) 35 3745.882 (62.793) 36 5371.409
(77.645) 36 1628.905 (25.715) 36 4353.172
(51.036) 36 1586.111 (23.183) 36 533.528
(10.458) 36 1607308.54 (21120.33) 36
CODE
CTL 7976.951 (344.051) 74 8184.291
(64.931) 74 3677.004 (43.3) 74 5090.771
(56.463) 74 1461.715 (19.857) 74 4504.577
(40.154) 74 1612.084 (18.493) 74 483.598
(8.869) 74 1548828.284 (15376.579) 74
MDD 7739.908 (292.603) 102 8042.78
(55.221) 102 3661.025 (36.825) 102 5171.045
(48.019) 102 1466.824 (16.888) 102 4432.727
(34.149) 102 1599.804 (15.802) 101 496.076
(7.58) 101 1540359.872 (13078.319) 102
DepOx
CTL 6664.878 (534.892) 31 8675.676
(132.515) 30 4048.715 (81.239) 31 5478.909
(105.135) 31 1746.877 (32.757) 31 4124.748
(56.534) 31 1385.321 (25.847) 31 526.116
(15.71) 31 1362278.954 (29042.624) 31
MDD 6999.747 (488.697) 37 8398.466
(117.587) 38 4144.386 (73.267) 38 5424.366
(94.818) 38 1741.563 (29.542) 38 4156.386
(51.682) 37 1396.384 (23.311) 38 527.716
(14.169) 38 1310535.09 (26227.952) 38
Imaging Genetics
Dublin
CTL 6679.671 (332.052) 52 7813.388
(109.202) 41 3736.322 (53.219) 46 5615.651
(80.859) 46 1592.106 (22.241) 43 4442.311
(44.762) 51 1702.007 (24.781) 52 585.418
(12.733) 51 1474215.129 (27484.837) 52
MDD 6445.497 (346.033) 48 7699.211
(105.262) 44 3767.299 (57.183) 40 5759.584
(81.777) 45 1595.575 (22.513) 42 4385.849
(44.762) 51 1734.793 (24.781) 52 581.516
(12.996) 49 1443020.948 (27484.837) 52
MMDP 1.5T CTL 6791.453 44 7022.211 44 3695.889 44 5583.459 44 1641.016 44 3284.799 44 1218.104 44 566.467 44 1324071.785 44

(410.328) (92.464) (62.307) (96.093) (31.318) (57.458) (33.778) (14.881) (16810.368)
MDD 6956.363 (376.762) 52 7170.824
(84.073) 53 3642.837 (56.653) 53 5768.374
(87.373) 53 1595.806 (28.476) 53 3309.866
(52.244) 53 1274.021 (30.713) 53 580.716
(13.531) 53 1318317.763 (15285.375) 53
MMDP 3T
CTL 6896.163 (551.065) 63 7190.513
(84.787) 64 3773.774 (63.633) 64 5701.727
(97.508) 63 1586.822 (34.388) 64 4101.055
(74.291) 64 1552.397 (31.698) 63 687.643
(24.293) 63 1334270.65 (20454.624) 64
MDD 7094.725 (518.085) 71 7287.834
(79.224) 73 3676.387 (59.89) 72 5799.168
(91.698) 71 1621.507 (32.365) 72 3915.255
(69.416) 73 1489.517 (29.377) 73 672.536
(22.841) 71 1317098.334 (19114.304) 73
MPIP
CTL 8818.892 (307.642) 222 7073.492
(38.931) 222 3523.561 (24.625) 222 4799.981
(35.187) 222 1424.726 (12.855) 222 4157.692
(24.707) 222 1300.625 (9.879) 222 536.087
(5.525) 222 1488615.256 (9114.622) 222
MDD 9038.434 (233.636) 368 7134.62
(29.566) 368 3566.813 (18.701) 368 4854.76
(26.723) 368 1435.139 (9.762) 368 4069.651
(18.793) 367 1304.765 (7.502) 368 534.338
(4.196) 368 1519925.444 (6932.068) 368
NESDA
CTL 7603.141 (424.098) 66 7128.616
(77.535) 66 3726.262 (46.938) 66 5427.6
(59.58) 66 1656.268 (20.11) 66 3977.239
(43.535) 66 1671.812 (20.174) 66 534.181
(10.025) 66 1403332.576 (21205.533) 66
MDD 7737.325 (272.951) 156 7140.999
(49.902) 156 3645.383 (30.21) 156 5314.881
(38.346) 156 1663.002 (12.943) 156 3869.517
(28.118) 155 1623.787 (13.03) 155 515.112
(6.452) 156 1447890.846 (13687.025) 156
QTIM
CTL 5953.172 (162.994) 262
7369.803 (44.326) 259
3998.126 (25.534) 260
6304.493 (33.373) 258
1706.745 (12.131) 258
4064.651 (20.285) 259
1767.142 (13.887) 260
771.597 (6.508) 260
1250942.494 (12205.945) 262
MDD 6156.33 (430.333) 38
7296.289 (116.389) 38
3883.602 (68.022) 37
6244.967 (87.457) 38
1686.245 (31.779) 38
4034.612 (54.739) 36
1742.808 (36.519) 38
770.1 (17.118) 38
1208587.409 (32164.565) 38
Rotterdam study
CTL 12852.092 (91.357) 4356 6410.049
(6.77) 4369 3444.598 (6.641) 4363 4740.189
(7.24) 4350 1540.048 (2.721) 4372 4067.812
(5.103) 4363 1403.836 (2.045) 4374 548.964
(1.117) 4389 1489885.576 (1945.914) 4408
MDD 14864.288 (732.799) 68 6300.27
(54.405) 68 3557.156 (54.109) 66 4717.23
(58.48) 67 1540.473 (21.865) 68 3977.368
(40.966) 68 1405.81 (16.436) 68 549.663
(8.994) 68 1467863.014 (15585.051) 69
SHIP
CTL 9728.093 (209.644) 422 7102.279
(24.194) 411 3578.507 (16.767) 408 4855.628
(21.313) 384 1552.076 (7.773) 397 3904.607
(16.157) 408 1480.362 (6.219) 408 457.687
(2.855) 386 1571014.869 (6143.991) 441
MDD 9768.208 (385.635) 129 7091.613
(44.867) 123 3538.137 (30.413) 128 4901.653
(39.029) 117 1542.359 (14.463) 119 3922.065
(28.503) 135 1466.248 (11.229) 129 459.48
(5.312) 115 1590808.94 (11103.52) 139
SHIP-trend
CTL 8821.668 (139.014) 884 7254.004
(18.827) 885 3622.718 (12.413) 873 4929.271
(15.066) 838 1576.587 (5.581) 865 3979.707
(10.353) 875 1498.57 (4.288) 883 472.71
(2.086) 798 1586377.419 (3941.202) 952
MDD 8701.92 (239.646) 303 7252.366
(32.491) 303 3599.847 (21.191) 305 4907.621
(26.098) 285 1575.163 (9.843) 284 3973.491
(17.664) 306 1480.291 (7.372) 304 473.698
(3.54) 282 1586590.378 (6829.382) 323

Sydney
CTL 7747.358 (463.926) 106
7146.326 (61.633) 106
4168.19 (58.437) 106
6393.662 (72.337) 106
1635.336 (18.616) 105
4208.748 (39.453) 106
1577.017 (17.808) 106
532.778 (8.548) 106
1499287.583 (12294.367) 106
MDD 9079.575 (323.319) 214
7173.986 (42.953) 214
4332.366 (40.806) 213
6379.102 (50.525) 213
1649.354 (12.911) 214
4110.809 (27.496) 214
1549.776 (12.41) 214
524.398 (6.006) 210
1500726.805 (8568.216) 214
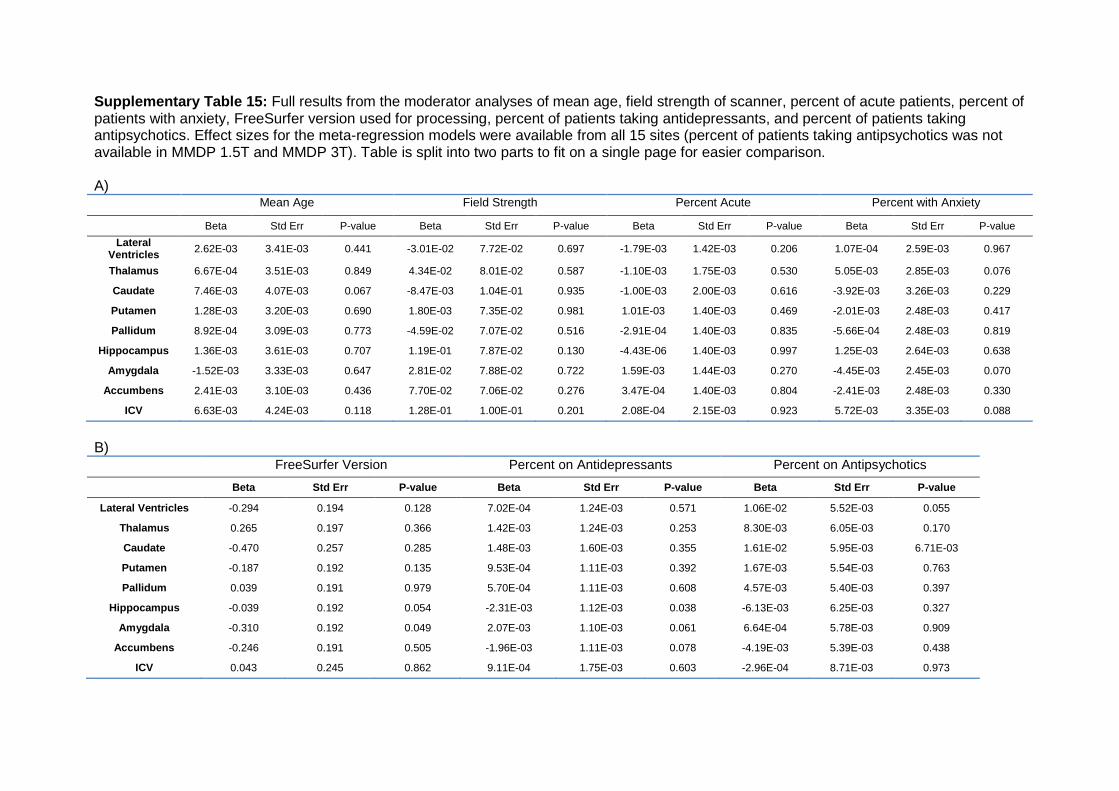
Supplementary Table 15: Full results from the moderator analyses of mean age, field strength of scanner, percent of acute patients, percent of patients with anxiety, FreeSurfer version used for processing, percent of patients taking antidepressants, and percent of patients taking antipsychotics. Effect sizes for the meta-regression models were available from all 15 sites (percent of patients taking antipsychotics was not available in MMDP 1.5T and MMDP 3T). Table is split into two parts to fit on a single page for easier comparison. A) Mean Age Field Strength Percent Acute Percent with Anxiety
Beta Std Err P-value Beta Std Err P-value Beta Std Err P-value Beta Std Err P-value Lateral
Ventricles 2.62E-03 3.41E-03 0.441 -3.01E-02 7.72E-02 0.697 -1.79E-03 1.42E-03 0.206 1.07E-04 2.59E-03 0.967
Thalamus 6.67E-04 3.51E-03 0.849 4.34E-02 8.01E-02 0.587 -1.10E-03 1.75E-03 0.530 5.05E-03 2.85E-03 0.076
Caudate 7.46E-03 4.07E-03 0.067 -8.47E-03 1.04E-01 0.935 -1.00E-03 2.00E-03 0.616 -3.92E-03 3.26E-03 0.229
Putamen 1.28E-03 3.20E-03 0.690 1.80E-03 7.35E-02 0.981 1.01E-03 1.40E-03 0.469 -2.01E-03 2.48E-03 0.417
Pallidum 8.92E-04 3.09E-03 0.773 -4.59E-02 7.07E-02 0.516 -2.91E-04 1.40E-03 0.835 -5.66E-04 2.48E-03 0.819
Hippocampus 1.36E-03 3.61E-03 0.707 1.19E-01 7.87E-02 0.130 -4.43E-06 1.40E-03 0.997 1.25E-03 2.64E-03 0.638
Amygdala -1.52E-03 3.33E-03 0.647 2.81E-02 7.88E-02 0.722 1.59E-03 1.44E-03 0.270 -4.45E-03 2.45E-03 0.070
Accumbens 2.41E-03 3.10E-03 0.436 7.70E-02 7.06E-02 0.276 3.47E-04 1.40E-03 0.804 -2.41E-03 2.48E-03 0.330
ICV 6.63E-03 4.24E-03 0.118 1.28E-01 1.00E-01 0.201 2.08E-04 2.15E-03 0.923 5.72E-03 3.35E-03 0.088
B) FreeSurfer Version Percent on Antidepressants Percent on Antipsychotics
Beta Std Err P-value Beta Std Err P-value Beta Std Err P-value
Lateral Ventricles -0.294 0.194 0.128 7.02E-04 1.24E-03 0.571 1.06E-02 5.52E-03 0.055
Thalamus 0.265 0.197 0.366 1.42E-03 1.24E-03 0.253 8.30E-03 6.05E-03 0.170
Caudate -0.470 0.257 0.285 1.48E-03 1.60E-03 0.355 1.61E-02 5.95E-03 6.71E-03
Putamen -0.187 0.192 0.135 9.53E-04 1.11E-03 0.392 1.67E-03 5.54E-03 0.763
Pallidum 0.039 0.191 0.979 5.70E-04 1.11E-03 0.608 4.57E-03 5.40E-03 0.397
Hippocampus -0.039 0.192 0.054 -2.31E-03 1.12E-03 0.038 -6.13E-03 6.25E-03 0.327
Amygdala -0.310 0.192 0.049 2.07E-03 1.10E-03 0.061 6.64E-04 5.78E-03 0.909
Accumbens -0.246 0.191 0.505 -1.96E-03 1.11E-03 0.078 -4.19E-03 5.39E-03 0.438
ICV 0.043 0.245 0.862 9.11E-04 1.75E-03 0.603 -2.96E-04 8.71E-03 0.973
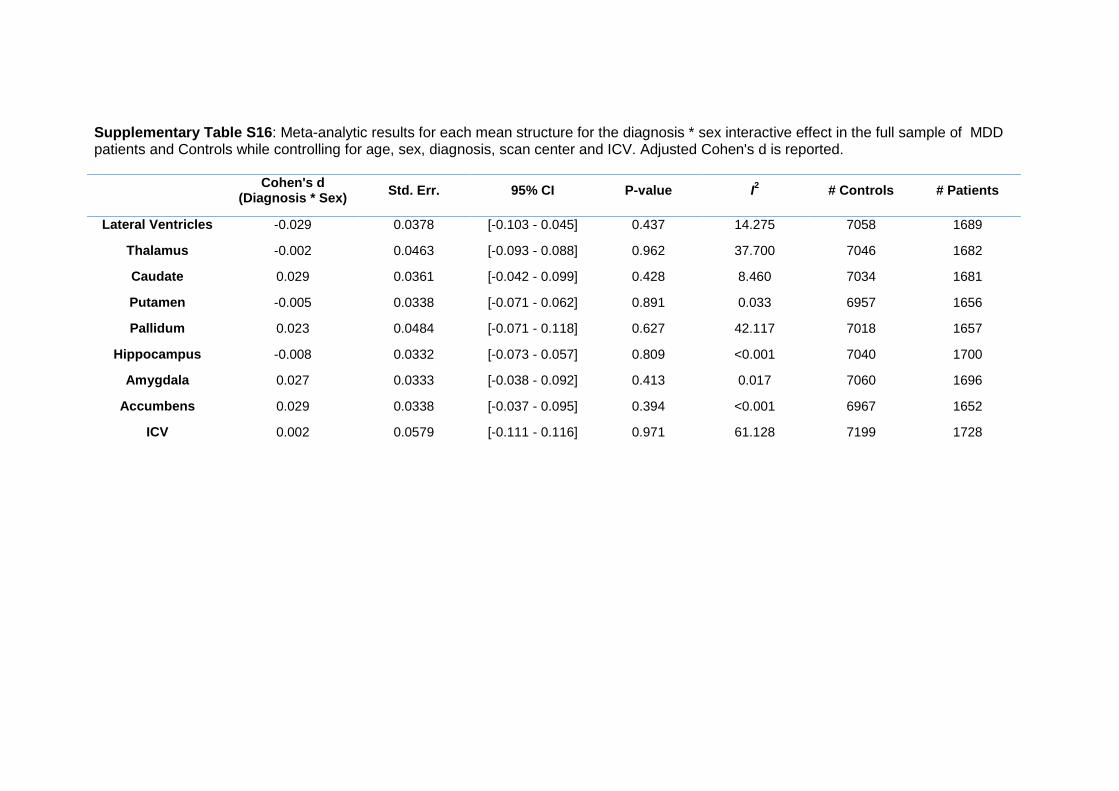
Supplementary Table S16: Meta-analytic results for each mean structure for the diagnosis * sex interactive effect in the full sample of MDD patients and Controls while controlling for age, sex, diagnosis, scan center and ICV. Adjusted Cohen's d is reported.
Cohen's d
(Diagnosis * Sex) Std. Err. 95% CI P-value I2 # Controls # Patients
Lateral Ventricles -0.029 0.0378 [-0.103 - 0.045] 0.437 14.275 7058 1689
Thalamus -0.002 0.0463 [-0.093 - 0.088] 0.962 37.700 7046 1682
Caudate 0.029 0.0361 [-0.042 - 0.099] 0.428 8.460 7034 1681
Putamen -0.005 0.0338 [-0.071 - 0.062] 0.891 0.033 6957 1656
Pallidum 0.023 0.0484 [-0.071 - 0.118] 0.627 42.117 7018 1657
Hippocampus -0.008 0.0332 [-0.073 - 0.057] 0.809 <0.001 7040 1700
Amygdala 0.027 0.0333 [-0.038 - 0.092] 0.413 0.017 7060 1696
Accumbens 0.029 0.0338 [-0.037 - 0.095] 0.394 <0.001 6967 1652
ICV 0.002 0.0579 [-0.111 - 0.116] 0.971 61.128 7199 1728
