supplementary materials: soft x-ray second harmonic ... · supplementary materials: soft x-ray...
TRANSCRIPT

Supplementary Materials: Soft X-Ray Second Harmonic Generation as an InterfacialProbe
R. K. Lam,1, 2 S. L. Raj,1, 2 T. A. Pascal,3 C. D. Pemmaraju,4 L. Foglia,5 A. Simoncig,5 N. Fabris,6, 7 P.
Miotti,6, 7 C. J. Hull,1, 2 A. M. Rizzuto,1, 2 J. W. Smith,1, 2 R. Mincigrucci,5 C. Masciovecchio,5 A. Gessini,5 E.
Allaria,5 G. De Ninno,5, 8 B. Diviacco,5 E. Roussel,5 S. Spampinati,5 G. Penco,5 S. Di Mitri,5 M. Trovo,5 M.
Danailov,5 S. T. Christensen,9 D. Sokaras,10 T.-C. Weng,11 M. Coreno,5, 12 L. Poletto,6 W. S. Drisdell,2
D. Prendergast,3 L. Giannessi,5, 13 E. Principi,5 D. Nordlund,10 R. J. Saykally,1, 2 and C. P. Schwartz3, 10
1Department of Chemistry, University of California, Berkeley, California 94720, USA2Chemical Sciences Division, Lawrence Berkeley National Laboratory, Berkeley, California 94720, USA
3The Molecular Foundry, Lawrence Berkeley National Laboratory, Berkeley, California 94720, USA4Theory Institute for Materials and Energy Spectroscopies,
SLAC National Accelerator Laboratory, Menlo Park, California 94025, USA5Elettra-Sincrotrone Trieste S.C.p.A., Strada Statale 14 - km 163.5, 34149 Trieste, Italy
6Institute of Photonics and Nanotechnologies, National Research Council of Italy, via Trasea 7, I-35131 Padova, Italy7Department of Information Engineering, University of Padova, via Gradenigo 6/B, I-35131 Padova, Italy
8Laboratory of Quantum Optics, University of Nova Gorica, 5001 Nova Gorica, Slovenia9National Renewable Energy Laboratory, Golden, Colorado, 80401, USA
10SLAC National Accelerator Laboratory, Menlo Park, California 94025, USA11Center for High Pressure Science & Technology Advanced Research, Pudong, Shanghai 201203, China
12ISM-CNR, Elettra Laboratory, Basovizza; I-34149 Trieste, Italy13ENEA, C.R. Frascati, Via E. Fermi 45, 00044 Frascati (Rome), Italy
SAMPLES
Unsupported nanocrystalline graphite thin films (thickness: 100, 300, 500, 720 nm), mounted onto L1.0 rings (10mm diameter), were purchased from Lebow Company (Goleta, CA).
EXPERIMENTAL DESIGN
The soft x-ray SHG experiment was performed at EIS-TIMEX end-station of the Elastic and Inelastic Scattering(EIS) beamline [1, 2] at the FERMI FEL-2 free electron laser [3, 4]. FEL-2 is based on a double high gain harmonicgeneration (HGHG) conversion scheme. The HGHG scheme consists in preparing the electron beam phase space ina first undulator (modulator), where the interaction with an external laser (seed) induces a controlled and periodicmodulation in the beam longitudinal energy distribution. The beam propagates through a dispersive section convertingthe energy modulation into a density modulation. The density modulated beam is then injected in a long undulator(amplifier) where the FEL amplification process is enhanced by the presence of the modulation. This sequence isrepeated twice in FERMI FEL-2 in order to achieve high harmonic multiplication factors [4]. The input seed used inthis experiment corresponds to the third harmonic of a Ti:Sa oscillator followed by a regenerative amplifier. A furtherpulse temporal compression stage was set up in the UV to reduce the duration of the seed to 67 fs.
TABLE S1: FERMI FEL pulse characteristics: wavelength (nm), harmonic number, Fourier limited spectral width(σ, nm), measured spectral width (σ, nm), coherence length (µm) and number of shots for various data sets.
Wavelength(nm)
n x mEstimatedduration
(FWHM, fs)
Fourier limitedspectral width
(σ, nm)
Measured(most probable)spectral width
(σ, nm)
Coherencelength
(FWHM, µm)Shots
4.02 65 22.7 4.5 · 10−4 1.1 · 10−3 2.7 33984.36 60 23.3 5.1 · 10−4 2.0 · 10−3 1.8 7944.76 55 24 5.9 · 10−4 2.2 · 10−3 1.9 479
When the FEL is optimized for maximizing the peak power, in the HGHG process the frequency upshift to harmonicn typically shortens the output pulse by a factor ∼7/(6n1/3) [5]. The three wavelengths used in the experiment
2
500
400
300
200
100
0
Cou
nt
4.0x10-33.53.02.52.01.51.0Spectral width (σ, nm)
4.0x10⁻³
3.5
3.0
2.5
2.0
1.5
1.0
Spec
tral w
idth
(σ, n
m)
300025002000150010005000Shot number
Number of shots: 3398Mean: 0.0016SD: 0.00053
Wavelength (nm)4.014.024.03
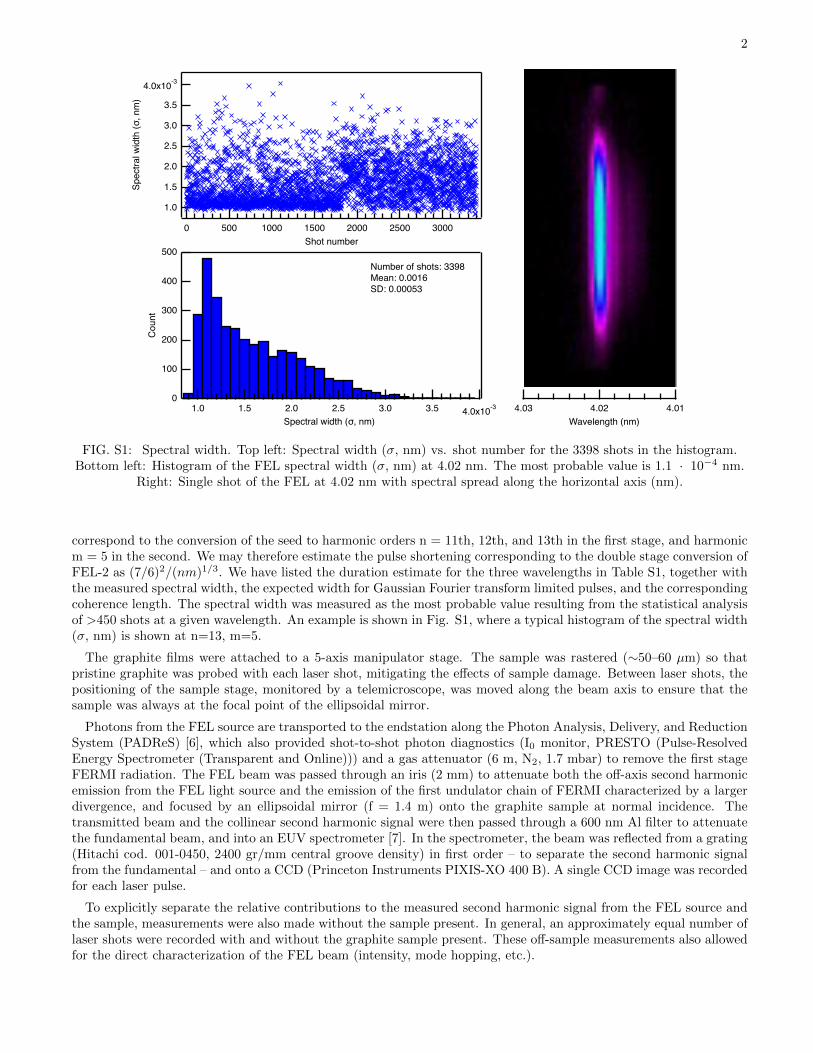
FIG. S1: Spectral width. Top left: Spectral width (σ, nm) vs. shot number for the 3398 shots in the histogram.Bottom left: Histogram of the FEL spectral width (σ, nm) at 4.02 nm. The most probable value is 1.1 · 10−4 nm.
Right: Single shot of the FEL at 4.02 nm with spectral spread along the horizontal axis (nm).
correspond to the conversion of the seed to harmonic orders n = 11th, 12th, and 13th in the first stage, and harmonicm = 5 in the second. We may therefore estimate the pulse shortening corresponding to the double stage conversion ofFEL-2 as (7/6)2/(nm)1/3. We have listed the duration estimate for the three wavelengths in Table S1, together withthe measured spectral width, the expected width for Gaussian Fourier transform limited pulses, and the correspondingcoherence length. The spectral width was measured as the most probable value resulting from the statistical analysisof >450 shots at a given wavelength. An example is shown in Fig. S1, where a typical histogram of the spectral width(σ, nm) is shown at n=13, m=5.
The graphite films were attached to a 5-axis manipulator stage. The sample was rastered (∼50–60 µm) so thatpristine graphite was probed with each laser shot, mitigating the effects of sample damage. Between laser shots, thepositioning of the sample stage, monitored by a telemicroscope, was moved along the beam axis to ensure that thesample was always at the focal point of the ellipsoidal mirror.
Photons from the FEL source are transported to the endstation along the Photon Analysis, Delivery, and ReductionSystem (PADReS) [6], which also provided shot-to-shot photon diagnostics (I0 monitor, PRESTO (Pulse-ResolvedEnergy Spectrometer (Transparent and Online))) and a gas attenuator (6 m, N2, 1.7 mbar) to remove the first stageFERMI radiation. The FEL beam was passed through an iris (2 mm) to attenuate both the off-axis second harmonicemission from the FEL light source and the emission of the first undulator chain of FERMI characterized by a largerdivergence, and focused by an ellipsoidal mirror (f = 1.4 m) onto the graphite sample at normal incidence. Thetransmitted beam and the collinear second harmonic signal were then passed through a 600 nm Al filter to attenuatethe fundamental beam, and into an EUV spectrometer [7]. In the spectrometer, the beam was reflected from a grating(Hitachi cod. 001-0450, 2400 gr/mm central groove density) in first order – to separate the second harmonic signalfrom the fundamental – and onto a CCD (Princeton Instruments PIXIS-XO 400 B). A single CCD image was recordedfor each laser pulse.
To explicitly separate the relative contributions to the measured second harmonic signal from the FEL source andthe sample, measurements were also made without the sample present. In general, an approximately equal number oflaser shots were recorded with and without the graphite sample present. These off-sample measurements also allowedfor the direct characterization of the FEL beam (intensity, mode hopping, etc.).
3
Sign
al (p
hoto
ns)
Sign
al (p
hoto
ns)
(a)
(b)
Off-sample fundamental
On-sample fundamental
4x10⁸
3
2
1
0
86420
Drain current (arb. units)
8x10⁵
6
4
2
0
86420
Drain current (arb. units)Si
gnal
(pho
tons
)Si
gnal
(pho
tons
)
(c)
(d)
Off-sample second harmonic
On-sample second harmonic
5x10⁴
4
3
2
1
0
86420
Drain current (arb. units)
1.5x10⁴
1.0
0.5
0.0
86420
Drain current (arb. units)
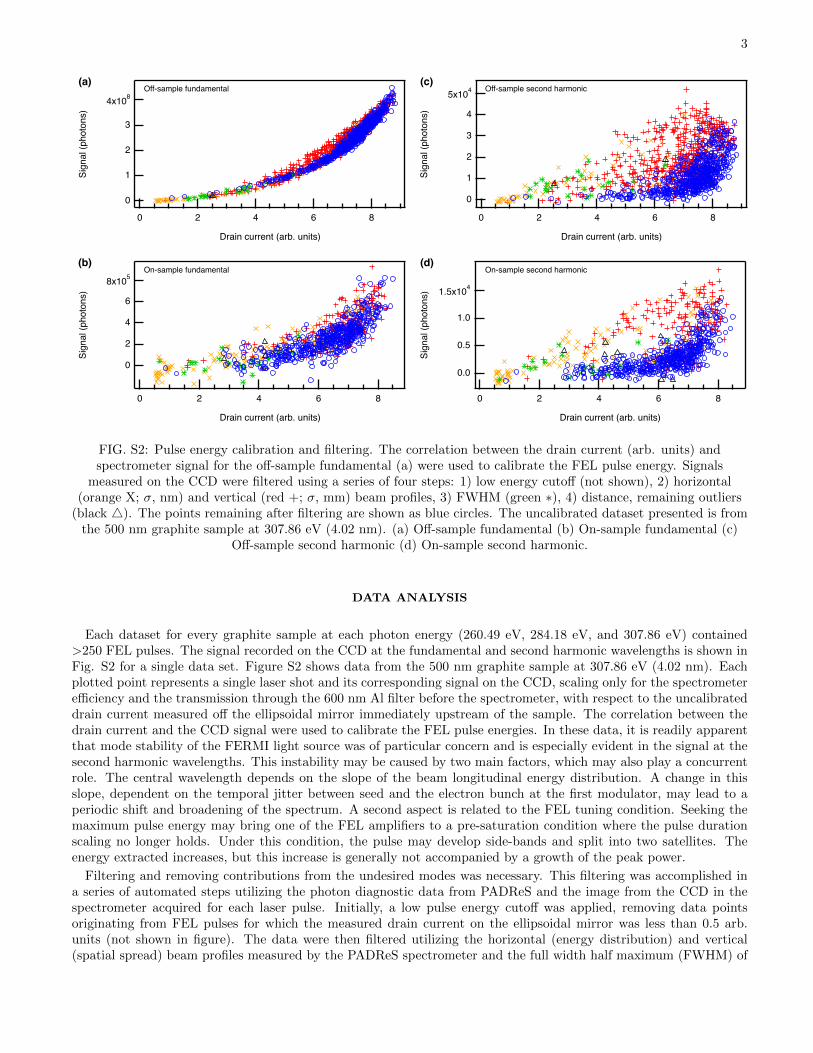
FIG. S2: Pulse energy calibration and filtering. The correlation between the drain current (arb. units) andspectrometer signal for the off-sample fundamental (a) were used to calibrate the FEL pulse energy. Signals
measured on the CCD were filtered using a series of four steps: 1) low energy cutoff (not shown), 2) horizontal(orange X; σ, nm) and vertical (red +; σ, mm) beam profiles, 3) FWHM (green ∗), 4) distance, remaining outliers
(black 4). The points remaining after filtering are shown as blue circles. The uncalibrated dataset presented is fromthe 500 nm graphite sample at 307.86 eV (4.02 nm). (a) Off-sample fundamental (b) On-sample fundamental (c)
Off-sample second harmonic (d) On-sample second harmonic.
DATA ANALYSIS
Each dataset for every graphite sample at each photon energy (260.49 eV, 284.18 eV, and 307.86 eV) contained>250 FEL pulses. The signal recorded on the CCD at the fundamental and second harmonic wavelengths is shown inFig. S2 for a single data set. Figure S2 shows data from the 500 nm graphite sample at 307.86 eV (4.02 nm). Eachplotted point represents a single laser shot and its corresponding signal on the CCD, scaling only for the spectrometerefficiency and the transmission through the 600 nm Al filter before the spectrometer, with respect to the uncalibrateddrain current measured off the ellipsoidal mirror immediately upstream of the sample. The correlation between thedrain current and the CCD signal were used to calibrate the FEL pulse energies. In these data, it is readily apparentthat mode stability of the FERMI light source was of particular concern and is especially evident in the signal at thesecond harmonic wavelengths. This instability may be caused by two main factors, which may also play a concurrentrole. The central wavelength depends on the slope of the beam longitudinal energy distribution. A change in thisslope, dependent on the temporal jitter between seed and the electron bunch at the first modulator, may lead to aperiodic shift and broadening of the spectrum. A second aspect is related to the FEL tuning condition. Seeking themaximum pulse energy may bring one of the FEL amplifiers to a pre-saturation condition where the pulse durationscaling no longer holds. Under this condition, the pulse may develop side-bands and split into two satellites. Theenergy extracted increases, but this increase is generally not accompanied by a growth of the peak power.
Filtering and removing contributions from the undesired modes was necessary. This filtering was accomplished ina series of automated steps utilizing the photon diagnostic data from PADReS and the image from the CCD in thespectrometer acquired for each laser pulse. Initially, a low pulse energy cutoff was applied, removing data pointsoriginating from FEL pulses for which the measured drain current on the ellipsoidal mirror was less than 0.5 arb.units (not shown in figure). The data were then filtered utilizing the horizontal (energy distribution) and vertical(spatial spread) beam profiles measured by the PADReS spectrometer and the full width half maximum (FWHM) of

4
Inte
nsity
(arb
. uni
ts)
4.044.034.024.014.003.99Wavelength (nm)
FIG. S3: Spectral profile of FEL pulses. Typical spectra of pulses removed by filtering (top, dashed lines) vs pulsesremaining after filtering (bottom, blue).
the peak corresponding to the fundamental beam in the projection of the CCD image along the energy axis. Pointswere removed from the dataset if the standard deviation (σ) was greater than 0.006 nm or less than 0.58 mm forthe horizontal and vertical profiles, respectively. Note that when the FEL enters a regime wherein spectral splittingoccurs, a spatial narrowing of the pulse is also observed. For the FWHM filtering, points were removed if they weredetermined to be outliers with respect to the remaining dataset following the removal of points by the horizontaland vertical profile filtering. Finally, the remaining outliers, determined by a distance filter, were removed. Thedistance filter was implemented by renormalizing the pulse energy and signal axes (min: 0, max: 1) and calculatingthe distance between the points and (0.2, 0.75). The distribution of distances was then used in the determination ofthe outliers. Outliers were determined using a simple box plot model wherein an outlier was defined as those pointslying beyond the whiskers 1.5xIQR (interquartile range) below or above the first and third quartile, respectively.Examples of pulses removed by and remaining after filtering are shown in Fig. S4.
Following the filtering, the remaining points were binned. As the sampling of pulse energies were not uniform, thebin positions were determined by the centroid of the dataset. The appropriate scaling factors were then applied toaccount for attenuation through the graphite sample and for the portion of the signal blocked by the entrance slitsto the spectrometer. The proportion of the signal blocked by the spectrometer entrance slits was determined usingthe spatial profile of the fundamental beam on the spectrometer, along with the size of the horizontal and verticalentrance slits. From this, utilizing the shadow cast on the CCD from the slits, the percentage of the flux transmittedthrough the slits can be calculated, providing a direct measurement of the fundamental beam intensity. The differencebetween the on- and off-sample curves then yields the power dependence curves shown in Fig. 2.
THEORETICAL METHODS
First-principles density functional theory (DFT) [8, 9] simulations were carried out using the exciting [10] all-electron full-potential computer package which employs (linearized) augmented planewave + local orbital [(L)APW+lo]methods. In order to investigate second harmonic generation at the (0001) surface of graphite, a supercell comprisingof an eight-layer slab of AB stacked hexagonal graphite was set up (see Fig. 3d). The slab model was generatedvia a 1x1x4 repetition of a unit cell of AB stacked graphite with the experimentally determined [11] in-plane andout-of-plane lattice parameters: 2.464 A and 6.711 A, respectively. A vacuum region of 10 A was chosen to separateperiodic images of the slab along the z direction perpendicular to the slab surface. No additional geometry opti-
5
mization was carried out as previous DFT calculations [12] of the (0001) surface have indicated insignificant surfacerelaxation with interlayer separation at the surface very similar to the bulk value. The parameter rgkmax, whichrepresents the product of the minimum muffin-tin radius and maximum length of G+k vectors in the basis, was setto 7. The Brillouin zone of the two-dimensional slab was sampled using a 30x30x1 Γ-centered k-point grid. Exchangecorrelation effects within DFT were modeled at the level of the Perdew-Zunger Local Density Approximation (LDA)[13]. In order to facilitate response calculations near C K edge frequencies, the 1s core-orbitals of carbon wereexplicitly included in the valence self-consistent field treatment so that their Kohn-Sham eigenvalues and eigenvectorsare self-consistently updated within the simulation.
To calculate the second-order susceptibility tensor relevant to SHG at the C K edge, we employed the second-orderresponse formalism from Sharma et al. [14] which is implemented within exciting [10]. Within this approach, thesecond-order susceptibility X(2)(2ω, ω, ω) involves contributions arising from excitation energies resonant with ω aswell as 2ω (see equations 49-51 of Sharma et al.) [14]. We employ the independent particle approximation, whereinthe excitation energy ωmn between electronic states m and n (m 6= n) is given by ωmn = εm−εn where εm, εn are theirrespective Kohn-Sham eigenvalues. The linear spectrum was calculated within the same non-interacting formalism tobe consistent. Since C 1s core electrons are situated ∼280 eV below the Fermi energy, for excitation energies at the CK edge, ω is roughly 280 eV. Therefore, in order to capture contributions to involving C 1s excitations resonant near2ω, we included 2400 empty Kohn-Sham eigenstates whose energies extend up to ∼320 eV above the Fermi energy.However, the electronic density of states (DOS) several hundred eV above the Fermi energy, calculated using finite k-point grids, exhibits a highly oscillatory structure which converges extremely slowly with k-point density. For realistick-point densities, this in turn leads to very noisy response functions in which the underlying resonance structure isobscured, making the calculation of X(2) at high energies impractical. In reality, the energies of excited states highabove the Fermi energy are characterized by significant lifetime broadening. This fact can be utilized to effectivelysmooth out the density of states and mitigate numerical noise in the response function calculation. Therefore, inthe same spirit as the work of Klinkusch et al. [15] in the context of photoemission, we added a heuristic energydependent imaginary part to the unoccupied Kohn-Sham energies to take into account lifetime broadening at highenergies. Accordingly, we treat unoccupied Kohn-Sham eigenstates with eigenvalues above the Fermi energy (EF ) asquasiparticle energies and set:
εm → εm + iΓ(εm) with Γ(E) =1
λ
√E − EF (1)
The imaginary part Γ(E) has a square root dependence on the energy and the λ parameter is related to the inelasticmean free path of electrons [16], which is ∼92 A in graphite [17]. This yields a lifetime broadening of ∼0.35 eVfor electronic states ∼280 eV above the Fermi energy. Incorporating the modified complex eigen-energies εm forthe unoccupied states into the excitation frequencies ωmn entering into the calculation of the second-order response
functions [14] eliminates numerical noise at high energies and leads to numerical convergence of X(2)zzz(2ω, ω, ω) with
k-point sampling density. The broadening in the calculated spectra only assumes lifetime (virtual state: 0.35 eV,core-hole: 0.1 eV) and thermal broadening (0.25 eV). The thermal broadening is based on the average fluctuationsin the atomic positions from ab initio molecular dynamics simulations of an eight-layer graphite slab. Experimentalspectra will be broadened significantly by sample imperfections, atomic motions and experimental conditions.
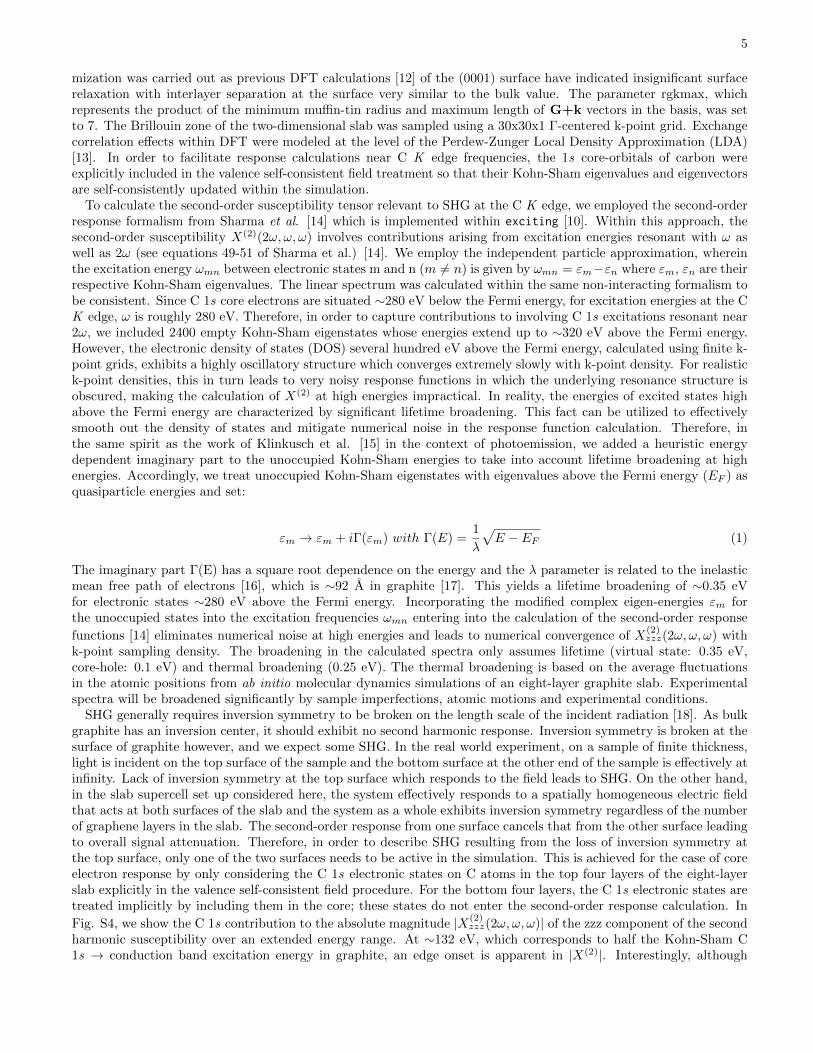
SHG generally requires inversion symmetry to be broken on the length scale of the incident radiation [18]. As bulkgraphite has an inversion center, it should exhibit no second harmonic response. Inversion symmetry is broken at thesurface of graphite however, and we expect some SHG. In the real world experiment, on a sample of finite thickness,light is incident on the top surface of the sample and the bottom surface at the other end of the sample is effectively atinfinity. Lack of inversion symmetry at the top surface which responds to the field leads to SHG. On the other hand,in the slab supercell set up considered here, the system effectively responds to a spatially homogeneous electric fieldthat acts at both surfaces of the slab and the system as a whole exhibits inversion symmetry regardless of the numberof graphene layers in the slab. The second-order response from one surface cancels that from the other surface leadingto overall signal attenuation. Therefore, in order to describe SHG resulting from the loss of inversion symmetry atthe top surface, only one of the two surfaces needs to be active in the simulation. This is achieved for the case of coreelectron response by only considering the C 1s electronic states on C atoms in the top four layers of the eight-layerslab explicitly in the valence self-consistent field procedure. For the bottom four layers, the C 1s electronic states aretreated implicitly by including them in the core; these states do not enter the second-order response calculation. In
Fig. S4, we show the C 1s contribution to the absolute magnitude |X(2)zzz(2ω, ω, ω)| of the zzz component of the second
harmonic susceptibility over an extended energy range. At ∼132 eV, which corresponds to half the Kohn-Sham C1s → conduction band excitation energy in graphite, an edge onset is apparent in |X(2)|. Interestingly, although

6
|(2
) zzz|
(x 1
0-14 ) e
su
Photon energy (eV)
Edge onset
20
15
10
5
0
300250200150100
FIG. S4: Extended Range SH response. Calculated C 1s contribution to the absolute magnitude |X(2)zzz(2ω, ω, ω)| of
the zzz component of the second harmonic susceptibility over an extended energy range. An edge onset is apparent
in |X(2)zzz| at ∼132 eV, which corresponds to half the Kohn-Sham C 1s → conduction band excitation energy in
graphite (∼264 eV in the theory). Note that for the theoretical spectra, presented in Fig. 3, a rigid shift of 20 eVwas applied.
some signal enhancement is also observed near 270 eV, the magnitude of the SHG response is higher at ω near halfthe C K edge energy than near the edge itself. This suggests that in this instance, the contribution to from the 2ωresonance terms is stronger than the ω resonance terms [14]. Note that in LDA the C 1s core state binding energiesare underestimated by roughly 20 eV. Therefore, in order to align the energy axis with experiment, a rigid shift of 20eV is applied to the spectra shown in Fig. 3. The exponential decay observed in the magnitude of the SHG responsewith increasing layer depth shown in Fig. 3(c) indicates that an eight-layer slab is sufficient to simulate SHG at thegraphite surface.
[1] A. Simoncig, R. Mincigrucci, E. Principi, F. Bencivenga, A. Calvi, L. Foglia, G. Kurdi, L. Raimondi, M. Manfredda,N. Mahne, R. Gobessi, S. Gerusina, C. Fava, M. Zangrando, A. Matruglio, S. Dal Zilio, V. Masciotti, and C. Masciovecchio,in Proc. SPIE, Vol. 10243, edited by A. Klisnick and C. S. Menoni (2017) p. 102430L.
[2] C. Masciovecchio, A. Battistoni, E. Giangrisostomi, F. Bencivenga, E. Principi, R. Mincigrucci, R. Cucini, A. Gessini,F. D’Amico, R. Borghes, M. Prica, V. Chenda, M. Scarcia, G. Gaio, G. Kurdi, A. Demidovich, M. B. Danailov, A. Di Cicco,A. Filipponi, R. Gunnella, K. Hatada, N. Mahne, L. Raimondi, C. Svetina, R. Godnig, A. Abrami, and M. Zangrando,Journal of Synchrotron Radiation 22, 553 (2015).
[3] E. Allaria, R. Appio, L. Badano, W. Barletta, S. Bassanese, S. Biedron, A. Borga, E. Busetto, D. Castronovo, P. Cinque-grana, S. Cleva, D. Cocco, M. Cornacchia, P. Craievich, I. Cudin, G. D’Auria, M. Dal Forno, M. Danailov, R. De Monte,G. De Ninno, P. Delgiusto, A. Demidovich, S. Di Mitri, B. Diviacco, A. Fabris, R. Fabris, W. Fawley, M. Ferianis, E. Ferrari,S. Ferry, L. Froehlich, P. Furlan, G. Gaio, F. Gelmetti, L. Giannessi, M. Giannini, R. Gobessi, R. Ivanov, E. Karantzoulis,M. Lonza, A. Lutman, B. Mahieu, M. Milloch, S. Milton, M. Musardo, I. Nikolov, S. Noe, F. Parmigiani, G. Penco,M. Petronio, L. Pivetta, M. Predonzani, F. Rossi, L. Rumiz, A. Salom, C. Scafuri, C. Serpico, P. Sigalotti, S. Spampinati,C. Spezzani, M. Svandrlik, C. Svetina, S. Tazzari, M. Trovo, R. Umer, A. Vascotto, M. Veronese, R. Visintini, M. Zaccaria,D. Zangrando, and M. Zangrando, Nat. Photonics 6, 699 (2012).
[4] E. Allaria, D. Castronovo, P. Cinquegrana, P. Craievich, M. Dal Forno, M. B. Danailov, G. D’Auria, A. Demidovich, G. DeNinno, S. Di Mitri, B. Diviacco, W. M. Fawley, M. Ferianis, E. Ferrari, L. Froehlich, G. Gaio, D. Gauthier, L. Giannessi,R. Ivanov, B. Mahieu, N. Mahne, I. Nikolov, F. Parmigiani, G. Penco, L. Raimondi, C. Scafuri, C. Serpico, P. Sigalotti,S. Spampinati, C. Spezzani, M. Svandrlik, C. Svetina, M. Trovo, M. Veronese, D. Zangrando, and M. Zangrando, Nat.Photonics 7, 913 (2013).
[5] P. Finetti, H. Hoppner, E. Allaria, C. Callegari, F. Capotondi, P. Cinquegrana, M. Coreno, R. Cucini, M. B. Danailov,A. Demidovich, G. De Ninno, M. Di Fraia, R. Feifel, E. Ferrari, L. Frohlich, D. Gauthier, T. Golz, C. Grazioli, Y. Kai,

7
G. Kurdi, N. Mahne, M. Manfredda, N. Medvedev, I. P. Nikolov, E. Pedersoli, G. Penco, O. Plekan, M. J. Prandolini, K. C.Prince, L. Raimondi, P. Rebernik, R. Riedel, E. Roussel, P. Sigalotti, R. Squibb, N. Stojanovic, S. Stranges, C. Svetina,T. Tanikawa, U. Teubner, V. Tkachenko, S. Toleikis, M. Zangrando, B. Ziaja, F. Tavella, and L. Giannessi, Phys. Rev. X7, 021043 (2017).
[6] M. Zangrando, D. Cocco, C. Fava, S. Gerusina, R. Gobessi, N. Mahne, E. Mazzucco, L. Raimondi, L. Rumiz, andC. Svetina, J. Synchrotron Radiat. 22, 565 (2015).
[7] L. Poletto, F. Frassetto, P. Miotti, A. Di Cicco, P. Finetti, C. Grazioli, F. Iesari, A. Kivimaki, S. Stagira, and M. Coreno,Rev. Sci. Instrum. 85, 103112 (2014).
[8] P. Hohenberg and W. Kohn, Phys. Rev. 136, B864 (1964).[9] W. Kohn and L. J. Sham, Phys. Rev. 140, A1133 (1965).
[10] A. Gulans, S. Kontur, C. Meisenbichler, D. Nabok, P. Pavone, S. Rigamonti, S. Sagmeister, U. Werner, and C. Draxl, J.Phys. Condens. Matter 26, 363202 (2014).
[11] P. Trucano and R. Chen, Nature 258, 136 (1975).[12] N. Ooi, A. Rairkar, and J. B. Adams, Carbon 44, 231 (2006).[13] J. P. Perdew and A. Zunger, Phys. Rev. B 23, 5048 (1981).[14] S. Sharma and C. Ambrosch-Draxl, Phys. Scr. T109, 128 (2004).[15] S. Klinkusch, P. Saalfrank, and T. Klamroth, J. Chem. Phys. 131, 114304 (2009).[16] A. P. Sorini, J. J. Kas, J. J. Rehr, M. P. Prange, and Z. H. Levine, Phys. Rev. B 74, 165111 (2006).[17] C. Kunz, B. Cowie, W. Drube, T.-L. Lee, S. Thiess, C. Wild, and J. Zegenhagen, J. Electron Spectros. Relat. Phenomena
173, 29 (2009).[18] A. Nazarkin, S. Podorov, I. Uschmann, E. Forster, and R. Sauerbrey, Phys. Rev. A 67, 41804 (2003).