supplementary materials for -...
TRANSCRIPT

Originally published 25 February 2016; corrected 31 March 2016
www.sciencemag.org/cgi/content/full/science.aad2156/DC1
Supplementary Materials for
Mouse oocytes differentiate through organelle enrichment from sister
cyst germ cells
Lei Lei* and Allan C. Spradling*
*Corresponding author. E-mail: [email protected] (A.C.S.); [email protected] (L.L.)
Published 25 February 2016 on Science First Release
DOI: 10.1126/science.aad2156
This PDF file includes:
Materials and Methods
Figs. S1 to S6
Tables S1 and S2
Full Reference List
Correction: Table S2 was inadvertently omitted from the previous version. It has been
added here. Also, a statement about the frequency analysis of germ cells has been
added to the section on statistics.

SUPPLEMENTARY MATERIAL
Supplementary Materials and Methods
Materials
Animals
CAG-CreER mice (004682) and R26R EYFP mice (006148) were acquired from the
Jackson Laboratory. All mice were genotyped according the protocols from the JAX®
Mice database.
Antibodies
Antibodies used are summarized in Table S1.
Methods
Single-cell lineage labeling
Tamoxifen-induced single primordial germ cell (PGC) lineage labeling was performed as
described (9). To obtain fetuses with lineage-labeled germ cells, adult female R26R-
EYFP mice were mated with male CAG-creER mice. 12 PM on the day a vaginal plug
appeared was designated as embryonic day 0.5 (E 0.5). Birth usually occurred between
E19 and E20. The day of the birth designated as postnatal day 0 (P0). Pregnant female
R26R-EYFP mice at E10.5 received a single intraperitoneal injection of Tamoxifen
(Sigma), 0.2 mg per 40g body weight, to label on average one PGC per ovary. All
procedures were approved by IACUC.
Whole-mount immuno-staining of mouse fetal ovaries
Fetal ovaries were dissected in cold phosphate buffered saline (PBS), and fixed
immediately in cold 4% paraformaldehyde (PFA) for 2-5 hours. After washing in PBST2
(PBS with 0.1% Tween-20 and 0.5% Triton X-100) for 1 hour, fetal ovaries were then
incubated with primary antibodies overnight. After secondary antibody incubation on the
next day, ovaries were washed in PBST2 and stained with DAPI to visualize cell nuclei.
Ovaries were analyzed using confocal microscopy (Leica SP5) and stacks of serial
images of each germ cell clone were acquired. Three-dimensional models were
generated using Imaris software (Bitplane).
Single-cell apoptosis assay
Ovaries from P0 fetuses were dissected and digested in 500 μl PBS with 0.25% trypsin
and 2.5 mg/ml colleganase at room temperature. Disassociated tissue was centrifuged at
500 g for 5 minutes to collect cells. Cells were then resuspended and washed with PBS.
Cells were centrifuged again and resuspended with 500 μl DMEM-F12 media with 3
mg/ml bovine serum albumin (BSA). Annexin-V antibody was added into the media
with cells at a dilution of 1:10. A poly-L-lysine coated cover slip (BD biosciences) was
then placed into one well of a 4-well cell culture plate. The cell suspention was added on
the cover slip and the cells were cultured for one hour. Afterwards, the cell culture media
was removed and the cover slip with adherent cells was washed with PBS beriefly and
fixed using 4% PFA for 30 minutes. After fixation, cells were washed with PBST2 and
incubated with GM130 antibody to stain Golgi and MVH (VASA) antibody to stain germ
cells.
Fetal ovarian culture
Mouse fetal ovaries were dissected on E17.5 and cultured in 500 μl basal cell culture
media: DMEM-F12 media supplemented with 3 mg/ml bovine serum albumin (BSA).
Each culture contained three ovaries on a membrane insert (Millipore) in one well of a
24-well cell culture plate. After incubation for two days with or without inhibitor, the
ovaries were removed, washed with basal media three times, and then placed onto a new
membrane with fresh basal media and incubation was continued. After 6 total days in
culture, corresponding to postnatal day 4 in vivo, ovaries were fixed in 4% PFA for
further analysis. The inhibitors used were Ciliobrevin D (25 μM) and Colchicine (10
nM).
Quantifying germ cell number
The determine the number of germ cells per ovary, fetal ovaries cultured as described
above were fixed in 4% PFA at 4 degree for 3 hours. After washing in PBS for 10
minutes, the ovaries were placed in 30% sucrose at 4 degree overnight. On the next day,
the ovaries were embeded in optimal cutting temperature medium (OCT) and sectioned at
10 μm. Serial sections of a whole ovary were collected and stained with MVH antibody
to stain germ cells. To calculate the total germ cell number in each ovary, every 5th
section was counted throughout the entire ovary, beginning with the first section, and the
final count was multiplied by 5 as a correction factor (19, 20).
Centrosome quantification
Centrosomes were stained with anti-pericentrin and anti-γ-tubulin antibodies. The amount
of pericentriolar material within clusters in a germ cell was measured using serial
confocal images of each pericentrin-immunostaining cluster by using Image J. The x, y
diameter of the biggest optical cross section and the z diameter of each pericentrin cluster
were measured to calculate three radii (Rx, Ry and Rz). The volume of a centrosome
cluster (Vcen) was then calculated using Vcen =4/3*3.14* Rx* Ry*Rz. For germ cells with
multiple pericentrin-positive clusters, only foci the size of clusters in E14.5 germ cells or
larger were measured and sumed to get the total volumes of pericentriolar material in the

cell. The amount of centrosomal material in each germ cell was also quantified based on
γ-tubulin staining using the same method. All γ-tubulin positive foci in the germ cell were
measured and summed to get the total volume. About 100 germ cells at each stage were
measured.
Golgi quantification:
The approximate surface area of Golgi membranes in each germ cell was quantified as
follows. Serial confocal images of GM130 immunostaining were analyzed using Image
J. Golgi were modeled as ellipsoids, hence the x and y diameters of the biggest cross
section and the z diameter of each Golgi segment were measured, and the x,y, and z radii
calculated by diving the diameters by 2. The surface area was then calculated by using
the equation:
Sgol= 4*3.14*(((Rx*Ry)^1.6+(Rx*Rz)^1.6+(Ry*Rz)^1.6)/3)^0.63
For germ cells in P0 and P4 ovaries, only germ cells with a large Golgi sphere (Balbiani
body) were analyzed. About 100 germ cells at each stage were measured.
Mitochondial quantification:
The number of mitochondria per germ cell at different ages was counted and calculated
using EM images. Germ cell sections of near maximal cross section based on nuclear
diameter were selected and the number of mitochondria counted (Nmit s). Germ cells
whose nuclear diameters in section were larger than 8 μm at E14.5, and 10 μm at E17.5
were analyzed. For germ cells at P0 and P4, only cells with a Balbiani body were
counted. The diameter of about 100 mitochondira were also measured at each stage to
calculate the average (Dave mit ). The volume of the germ cells stained with VASA at each
stage was calculated based on confocal images. The diameter of 100 germ cells was

measured to calculate the average radius of germ cells (Rave gc), the volume of germ cells
(Vgc), Vgc=4/3*3.14*Rave gc^3 and the surface area of the largest cross section (Slgc),
Slgc=3.14* Rave gc^2. For germ cells in P0 and P4 ovaries, only cells with a Balbiani body
(Golgi sphere by GM130 staining) were measured. The number of total mitochondia in a
germ cell (Nmit total) was then calculated by using the equation: Nmit total = Vgc /(Slgc* Dave mit)*
Nmit s. About 100 germ cells at each stage were measured.
Statistics:
Data are presented as mean±SD. One-way ANOVA was used to analyze the difference
between to experimental groups. A level of P< 0.05 was considered to be statistically
sigificant. For the frequency analysis of germ cells with > 3 bridges in Fig. 1F, only
cysts with at least 4 cells were considered, to mitigate the effects of apoptosis and bridge
loss.

Supplementary Tables
Table S1. Antibodies
Antibody Vendor Dilution
AnnexinV Santa Cruz (SC-1929) 1:100
AIF Cell Signaling (#4642) 1:100
Fibrillarin Cell Singaling (#2639) 1:100
Gamma-tubulin Abcam (ab179503) 1:100
GFP Aves Labs (GFP-1020) 1:1000
GM130 BD biosciences (610822) 1:100
HP1beta Abcam (ab10811) 1:100
MVH Abcam (ab13840)
Pericentrin Dr. Yixian Zheng (Carnegie
Institution for Science)
1:1000
Phalloidin Life Technology 1:500
Tex14 Abcam (ab41733) 1:100

Table S2. Cyst structures determined by reconstruction.
Cyst totalcells 4bcells 3bcells 2bcells 1bcells 0bcellsE14.51 12 0 2 5 4 1
2 14 1 2 6 5 03 14 0 2 7 5 04 15 0 3 5 7 05 18 1 4 3 8 26 251 1 10 13 07 30 0 7 9 12 28 8 1 1 0 5 19 8 0 0 5 2 1
10 2 0 0 0 2 011 22 0 3 9 8 212 16 0 1 6 8 113 16 0 0 6 5 514 5 0 0 3 2 015 30 1 2 13 11 216 6 0 1 4 1 017 12 0 3 3 4 218 14 0 2 7 5 019 4 0 0 2 2 020 4 0 0 2 2 021 5 0 0 1 4 022 7 0 0 3 3 123 8 0 3 0 5 0
E17.5*1 2
0 2 12
3
3 6
1 4 2
0
5 2
0 6 2
0
7 3
0 8 11
3
9 3
1

10 7
3 11 3
0
12 3
1 13 5
2
14 2
0 15 2
0
16 13
4 17 7
1
18 2
0 19 2
0
20 2
1 21 3
0
22 4
1 23 6
1
24 2
0 25 2
0
26 15
2 27 4
1
28 8
1 29 8
1
30 5
1 31 2
0
32 7
2 33 9
3
34 25
3 E18.51 4 0 0 4 0 0
2 2 0 0 0 2 03 2 0 0 0 2 04 2 0 0 0 2 05 2 0 0 1 1 06 3 1 0 0 2 07 3 0 1 1 1 08 6 0 0 4 2 09 5 0 1 2 2 0
10 6 2 1 1 2 0Lineage-labeled ovaries of the indicated age were stained with Tex14 and the
interconnection patterns of cysts were determined following modeling using Imaris
software *E17.5 data are presented as “number of the germ cells with ≥ 3 bridges”

Supplementary Figure Legends
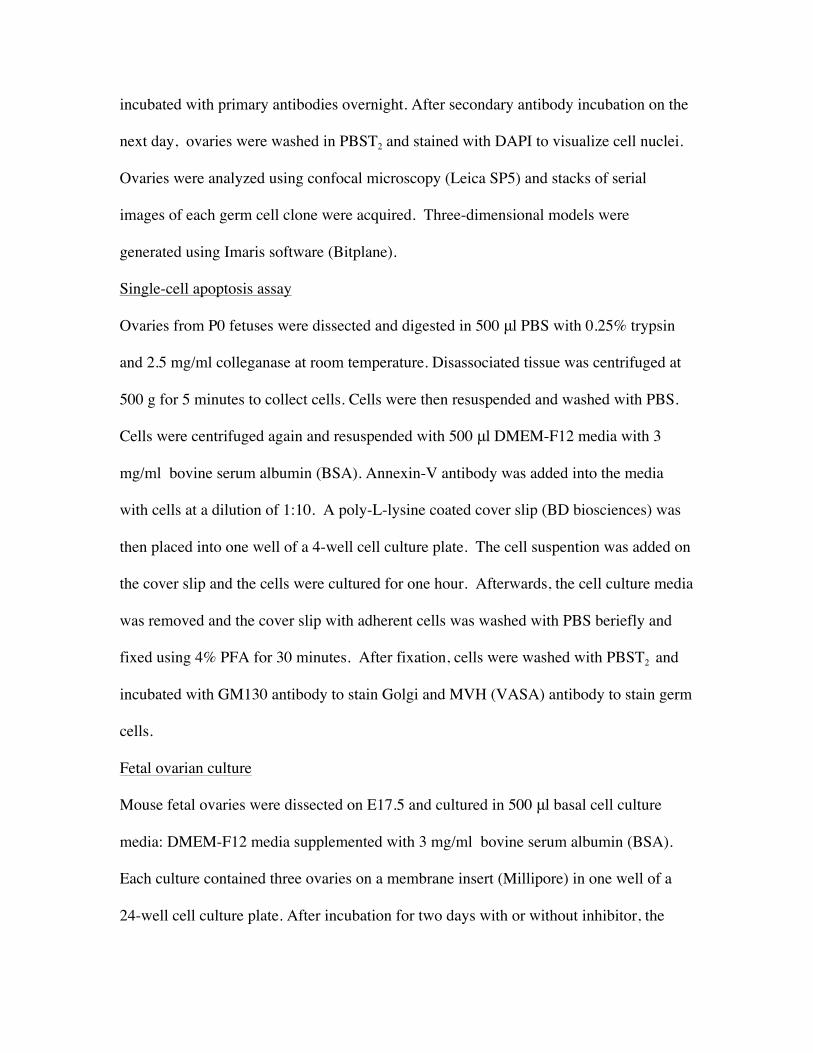
Figure S1. Tex14 is not found on ring canals prior to E14.5. A representative mouse
ovarian cyst is shown at E12.5 stained for lineage (YFP, green) and Tex14 (pink). Small
aggregates (arrows), but no ring structures are seen until the end of cyst formation at
E14.5.
Figure S2. Putative transferred centrosome(s) are morphologically distinct from the
bipartite meiotic centrosome. Arrowhead indicates meiotic centrosomes, which remain
distinct form a putative transferred centrosome (arrow) in a lineage-labeled (red) E18.5
germ cell. The germ cell in the lower right shows the same two types of centrosome.
Pericentrin (green).
Figure S3. Transfer of nurse cell cytoplasm and Balbiani body formation. (A, B) B-
body containing cells preferentially lack expression of the apoptosis marker AnnexinV
(p<0.001; Fisher’s exact test). (C) B-body containing cells are selectively preserved. (D)
Electron micrographs of an E17.5 (upper) and a P0 (lower) fetal germ cell in which the
cytoplasm and nuclei appear to be separating.
Figure S4. In vitro ovarian culture recapitulates normal development. (A,B) The

number of germ cells per ovary in normal ovaries in vivo (A) is about the same as in
E17.5 ovaries cultured in vivo for the indicated times (B). (C) The average germ cell
volume of E17.5 cells, and subsequently of Balbinai-body containing cells, following
culture for indicated times, resemble the volumes of germ cells developing for
corresponding times in vivo. D) The amount of Pericentrin per cell of E17.5 cells, and
subsequently of Balbinai-body containing cells, following culture for indicated times,
resemble the amount in germ cells developing for corresponding times in vivo.
Figure S5. Analysis of microtubule-dependent oocyte differentiation in vitro.� (A)
Microtubule inhibitor treatment does not significantly impact the rate of somatic cell
division in vitro. Percentage of KI67 positive somatic cells in cultured mouse fetal
ovaries after a two-day inhibitor treatment (E17.5-E19.5). �(B) Treating ovaries with
microtubule inhibitors beginning at E19.5 causes a small but significant reduction in
Balbiani body formation. Percentage of germ cells with a Balbiani body in mouse fetal
ovaries after 6-day culture (from E17.5) with the inhibitor treatment from E19.5(P0) to
P2.� (C) During prolonged culture in vitro without inhibitors, many follicles begin to
grow. Growth is blocked by microtubule inhibitors. Histological sections of the ovaries
after 9-day culture (from E17.5). (D-E) Quatification of the effect of inhibitors on germ
cell number and growth in fetal ovaries cultured for 9 days (from E17.5). (F) Histogram
showing the total oocyte volume and Balbiani body volume in wild type oocytes at P4.
Considerable heterogeneity is observed.
Figure S6. Summary model of mouse oocyte differentiation based on organelle and
cytoplasm transport from sister germ cells within germline cysts. Mouse oocyte
differentiation initiates at E10.5, when primordial germ cells (PGCs) start incomplete

cytokinesis to form germline cysts. Germ cells in cysts are connected by intercellular
bridges. Around E17.5, organelles in cyst germ cells reorganize and transport through the
intercellular connections into the germ cells with a forming Balbiani body (curved
magenta). Note bridges are found dissociated from the cell connections during large scale
organelle (centrosomes in green; Golgi in magenta; mitochondira in blue) and cytoplasm
transport. Germ cells with a Balbiani body (magenta circle), which is the highly orgnized
organlle cluster, differentiate into primary oocytes with enriched cytoplasm. Germ cells
that donate organelles undergo apopotsis mostly from P0 to P4.
Fig. S1
Fig. S1

Fig. S2

Fig. S3
Fig. S3

Fig. S4

Fig. S5

Fig. S6
Fig. S6

References and Notes
1. Y.-C. Sun, S. F. Cheng, R. Sun, Y. Zhao, W. Shen, Reconstitution of gametogenesis in vitro:
Meiosis is the biggest obstacle. J. Genet. Genomics 41, 87–95 (2014). Medline
doi:10.1016/j.jgg.2013.12.008
2. J. Büning, The Insect Ovary (Chapman and Hall, 1994).
3. N. Matova, L. Cooley, Comparative aspects of animal oogenesis. Dev. Biol. 231, 291–320
(2001). Medline doi:10.1006/dbio.2000.0120
4. R. T. Cox, A. C. Spradling, A Balbiani body and the fusome mediate mitochondrial
inheritance during Drosophila oogenesis. Development 130, 1579–1590 (2003). Medline
doi:10.1242/dev.00365
5. V. K. Jenkins, A. K. Timmons, K. McCall, Diversity of cell death pathways: Insight from the
fly ovary. Trends Cell Biol. 23, 567–574 (2013). Medline doi:10.1016/j.tcb.2013.07.005
6. O. Alexandrova, M. Schade, A. Böttger, C. N. David, Oogenesis in Hydra: Nurse cells
transfer cytoplasm directly to the growing oocyte. Dev. Biol. 281, 91–101 (2005).
Medline doi:10.1016/j.ydbio.2005.02.015
7. J. R. Huynh, D. St Johnston, The origin of asymmetry: Early polarisation of the Drosophila
germline cyst and oocyte. Curr. Biol. 14, R438–R449 (2004). Medline
doi:10.1016/j.cub.2004.05.040
8. M. E. Pepling, A. C. Spradling, Female mouse germ cells form synchronously dividing cysts.
Development 125, 3323–3328 (1998). Medline
9. L. Lei, A. C. Spradling, Mouse primordial germ cells produce cysts that partially fragment
prior to meiosis. Development 140, 2075–2081 (2013). Medline doi:10.1242/dev.093864
10. M. E. Pepling, J. E. Wilhelm, A. L. O’Hara, G. W. Gephardt, A. C. Spradling, Mouse
oocytes within germ cell cysts and primordial follicles contain a Balbiani body. Proc.
Natl. Acad. Sci. U.S.A. 104, 187–192 (2007). Medline doi:10.1073/pnas.0609923104
11. M. P. Greenbaum, N. Iwamori, J. E. Agno, M. M. Matzuk, Mouse TEX14 is required for
embryonic germ cell intercellular bridges but not female fertility. Biol. Reprod. 80, 449–
457 (2009). Medline doi:10.1095/biolreprod.108.070649
12. A. P. Mahowald, J. M. Strassheim, Intercellular migration of centrioles in the germarium of
Drosophila melanogaster. An electron microscopic study. J. Cell Biol. 45, 306–320
(1970). Medline doi:10.1083/jcb.45.2.306
13. C. M. Rose, S. van den Driesche, R. R. Meehan, A. J. Drake, Epigenetic reprogramming:
Preparing the epigenome for the next generation. Biochem. Soc. Trans. 41, 809–814
(2013). Medline doi:10.1042/BST20120356
14. M. Kloc, L. D. Etkin, Two distinct pathways for the localization of RNAs at the vegetal
cortex in Xenopus oocytes. Development 121, 287–297 (1995). Medline
15. A. K. Lim, C. Lorthongpanich, T. G. Chew, C. W. Tan, Y. T. Shue, S. Balu, N. Gounko, S.
Kuramochi-Miyagawa, M. M. Matzuk, S. Chuma, D. M. Messerschmidt, D. Solter, B. B.
Knowles, The nuage mediates retrotransposon silencing in mouse primordial ovarian
follicles. Development 140, 3819–3825 (2013). Medline doi:10.1242/dev.099184

16. A. A. Aravin, G. W. van der Heijden, J. Castañeda, V. V. Vagin, G. J. Hannon, A. Bortvin,
Cytoplasmic compartmentalization of the fetal piRNA pathway in mice. PLOS Genet. 5,
e1000764 (2009). Medline doi:10.1371/journal.pgen.1000764
17. S. Malki, G. W. van der Heijden, K. A. O’Donnell, S. L. Martin, A. Bortvin, A role for
retrotransposon LINE-1 in fetal oocyte attrition in mice. Dev. Cell 29, 521–533 (2014).
Medline doi:10.1016/j.devcel.2014.04.027
18. K. Hayashi, S. Ogushi, K. Kurimoto, S. Shimamoto, H. Ohta, M. Saitou, Offspring from
oocytes derived from in vitro primordial germ cell-like cells in mice. Science 338, 971–
975 (2012). Medline doi:10.1126/science.1226889
19. S. Zuckerman, The number of oocytes in the mature ovary. Recent Prog. Horm. Res. 6, 63–
109 (1951).
20. M. J. Faddy, E. Telfer, R. G. Gosden, The kinetics of pre-antral follicle development in
ovaries of CBA/Ca mice during the first 14 weeks of life. Cell Tissue Kinet. 20, 551–560
(1987). Medline