supplementary materials for...2018/02/07 · digital pulse generator (tgp110, tti) to obtain square...
TRANSCRIPT
www.sciencemag.org/content/359/6376/679/suppl/DC1
Supplementary Materials for
Near-infrared deep brain stimulation via upconversion nanoparticle–mediated optogenetics
Shuo Chen,* Adam Z. Weitemier, Xiao Zeng, Linmeng He, Xiyu Wang, Yanqiu Tao, Arthur J. Y. Huang, Yuki Hashimotodani, Masanobu Kano, Hirohide Iwasaki, Laxmi Kumar Parajuli, Shigeo Okabe, Daniel B. Loong Teh, Angelo H. All, Iku Tsutsui-Kimura, Kenji F. Tanaka,
Xiaogang Liu,* Thomas. J. McHugh*
*Corresponding author. E-mail: [email protected] (S.C.); [email protected] (X.L.);
[email protected] (T.J.M.)
Published 9 February 2018, Science 359, 679 (2018) DOI: 10.1126/science.aaq1144
This PDF file includes:
Materials and Methods Supplementary Text Figs. S1 to S18 Tables S1 and S2 References

2
Materials and Methods Synthetic reagents
All chemicals were used without further purification. Y(CH3CO2)3•xH2O (99.9%), Yb(CH3CO2)3•xH2O (99.9%), Tm(CH3CO2)3•xH2O (99.9%), Er(CH3CO2)3•xH2O (99.9%), oleic acid (90%), 1-octadecene (90%), NaOH (98+%), NH4F (99+%), ammonium (28.0−30.0%), HCl (37%), tetraethyl orthosilicate (98%), poly(acrylic acid sodium salt) (Mw = 5,100), N-(3-Dimethylaminopropyl)-N′-ethylcarbodiimide hydrochloride (98%) and polyvinylpyrrolidone (Mw = 40,000) were purchased from Sigma-Aldrich. Amine-terminated poly(ethylene glycol) (Mw = 5,000) was obtained from Laysan Bio, Inc. Methanol (AR grade), ethanol (AR grade) and cyclohexane (AR grade) were from VWR. Synthesis of UCNPs
UCNPs with a chemical composition of NaYF4:Yb/Tm were synthesized by a co-precipitation method (36). In a typical synthesis of blue-emitting UCNPs, 0.278 mmol of Y(CH3CO2)3, 0.12 mmol of Yb(CH3CO2)3 and 0.002 mmol of Tm(CH3CO2)3 lanthanide precursors were mixed with 3 mL of oleic acid and 7 mL of 1-octadecene and heated at 150°C for 1.5 h to remove any moisture content. After cooling the reaction solution down to 50°C, a methanol solution containing 1 mmol of NaOH and 1.6 mmol of NH4F was quickly added and the reaction mixture was further stirred at 50°C for another 0.5 h. Thereafter, the reaction was heated to 100°C under vacuum for 0.5 h to remove any low boiling point solvent. After three times of N2 purge at 100°C, the reaction was heated to 280°C and maintained at this temperature for 2 h to allow nanoparticle growth. Once the reaction was cooled down to room temperature, UCNP products were purified twice by ethanol washing which requires centrifugation at 6,000 rpm for 10 min followed by ethanol re-dispersion. Purified UCNPs were dispersed into 4 mL of cyclohexane.
For synthesizing UCNPs with a chemical composition of NaYF4:Yb/Er, experimental procedure was the same as that for synthesizing NaYF4:Yb/Tm-based UCNPs except that 0.272 mmol of Y(CH3CO2)3, 0.12 mmol of Yb(CH3CO2)3 and 0.008 mmol of Er(CH3CO2)3 were used as lanthanide precursors.
To suppress surface quenching causing luminescence weakening, an optically-inert shell layer of NaYF4 was grown epitaxially onto the as-synthesized UCNPs. Specifically, 0.4 mmol of Y(CH3CO2)3 was mixed with 3 mL of oleic acid and 7 mL of 1-octadecene and heated at 150°C for 1.5 h. After cooling to 80°C, all the UCNP products from the previous step (in 4 mL of cyclohexane) were added to the reaction mixture. The solution was further stirred at 80°C for 1 h to evaporate the cyclohexane content. Subsequently, a methanol solution containing 1 mmol of NaOH and 1.6 mmol of NH4F was added to the reaction solution at 50°C. After 0.5 h of continuous stirring at 50°C, the reaction was heated to 100°C under vacuum for 0.5 h. After three rounds of N2 purging at 100°C, the reaction temperature was ramped to 280°C and maintained at 280°C for 2 h. Once the reaction was cooled down to room temperature, core-shell UCNP products were washed twice with ethanol and dispersed into 4 mL of cyclohexane.
The as-synthesized UCNPs were transferred into aqueous phase through an acid-induced ligand removal process. 4 mL of the cyclohexane was added with 4 mL of ethanol and centrifuged at 14,800 rpm for 5 min. The pellet was re-dispersed with a

3
mixture of 4 mL of ethanol and 4 mL of HCl aqueous solution (2 M) by sonication. The acid-treated UCNPs were thereafter washed three times with ethanol to remove excess acid content. The ligand-free UCNPs were dispersed into 4 mL of DI H2O for subsequent surface modification. Surface modification of UCNPs
Ligand-free UCNPs were over-coated with two types of bio-compatible materials, namely silica and poly(acrylic acid) (PAA).
For silica coating, 4 mL of the ligand-free UCNPs were slowly added to 18 mL of polyvinylpyrrolidone aqueous solution (50 mg/mL). The solution was sonicated for 20 min and subsequently stirred for 1 h. After adding 80 mL of ethanol, the reaction mixture was further sonicated for 20 min and stirred for 2 h. 3.2 mL of ammonium was added to adjust the solution pH, followed by 20 min additional sonication. Subsequently, 80 µL of tetraethyl orthosilicate was added to the solution to initiate silica growth on the surface of UCNPs. The reaction solution was kept stirring for 12 h before the silica coated UCNP products were purified by three rounds of ethanol washing and dispersed in DI H2O. The final concentration of silica coated UCNPs were kept at 200 mg/mL.
For synthesizing PAA-coated UCNPs, 4 mL of ligand-free UCNPs were dropwise added to 80 mL of poly(acrylic acid sodium salt) solution (10 mg/mL) while stirring. The solution was stirred overnight and thereafter purified by three rounds of H2O washing. PAA-coated UCNPs were dispersed in DI H2O at 200 mg/mL for further use. Characterization of UCNPs
Transmission electron microscopy (TEM) measurements were carried out on a JEOL-JEM 2010F field emission transmission electron microscope operated at an acceleration voltage of 200 kV. The hydrodynamic sizes of UCNPs were measured by dynamic light scattering means on Malvern Nano-ZS Particle Sizer. Upconversion luminescence spectra were recorded at room temperature with an Edinburgh FLS920 fluorescence spectrometer in conjunction with a 980-nm diode laser. For the time-dependent upconversion luminescence recording, the excitation laser was modulated by a digital pulse generator (TGP110, TTi) to obtain square wave laser output at 10 Hz, 50 ms pulse duration. Meanwhile, photons were collected by a PMT conjugated to the Edinburgh FLS920 fluorescence spectrometer. For NIR conversion efficiency measurement, 0.18 mg of UCNPs were dropped on glass (the amount is on par with the injection dose). 980 nm laser was guided to excite the UCNPs. Upconversion emission (blue light) was filtered by an 800 nm shortpass filter and thereafter measured with a power meter. The light conversion efficiency was calculated by dividing the blue emission output power by the 980 nm laser input power. Subjects
All mice were aged between 1.5 to 6 months prior to commencement of experiments and were maintained on a 12-h light-dark cycle with ad libitum access to food and water. For behavioral experiments (Fig. 4, I to O), only male mice were used. For all other experiments, both female and male mice were used. All procedures were approved by the RIKEN Institutional Animal Care and Use Committee and conformed to NIH and institutional guidelines. We used wild-type C57BL/6J mice and four transgenic lines in
4
this study, all maintained in a C57BL/6 background and genotyped as previously reported. The transgenic lines are TH-Cre (European Mutant Mouse Archives, B6.129X1-Thtm1(cre)Te/Kieg, Stock#00254) (37), CamKII-Cre (Tg(Camk2a-cre)CW2Stl, Mouse Genome Informatics ID#3530562) (38), PV-Cre (Jackson Labs, B6;129P2-Pvalbtm1(cre)Arbr/J, Stock#008069) (39) and c-fos:tTA (Jackson Labs, B6.Cg-Tg(FostTA,Fos-EGFP*)1Mmay/J, Stock#018306) (40). Adeno-associated viruses (AAV) vector construction
The pAAV.DIO.hChR2(H134R).EYFP and pAAV.DIO.eArchT3.0.EYFP recombinant AAV vectors were obtained from the Deisseroth Laboratory (Stanford University).
The recombinant AAV vectors pAAV.TRE.hChR2(H134R).EYFP and pAAV.TRE.EYFP were generated within our laboratory. For the construction of pAAV.TRE.hChR2(H134R).EYFP, the TRE promoter fragment was generated using the high fidelity Phusion DNA Polymerase (NEB). At the 5’ end of the DNA fragment, the MluI restriction enzyme site is followed by start of the TRE promoter from the pTight plasmid (Clontech). The 3’ end of the TRE promoter contains the XbaI restriction enzyme site. The PCR-generated cassette was digested with MluI (NEB) and XbaI (NEB). The vector backbone for this construct was the pAAV.EF1a.hChR2(H134R).EYFP plasmid (Generated In House) digested with MluI and XbaI and treated with calf intestine phosphate (NEB). The approximately 5.7 kB DNA fragment containing the vector backbone was ligated to the digested TRE promoter DNA fragment with T4 DNA ligase buffer (NEB) and transformed into One Shot Stbl3 Chemically Competent Cells (Invitrogen) and colonies were screened by restriction digest analysis. The putative positive colonies were submitted for DNA sequencing and one clone with the correct DNA sequence was designated as pAAV.TRE.hChR2.EYFP.
For the construction of pAAV.TRE.EYFP, the TRE promoter fragment was generated using high-fidelity PCR as described above. At the 5’ end of the DNA fragment, the MluI restriction enzyme site is followed by start of the TRE promoter from the pTight plasmid (Clontech). The 3’ end of the TRE promoter contains the XbaI restriction enzyme site. The PCR-generated cassette was digested with MluI (NEB) and XbaI (NEB). The vector backbone for this construct was the pAAV.EF1a.EYFP plasmid (Generated In House) digested with MluI and XbaI and treated with calf intestine phosphate (NEB). The approximately 4.8 kB DNA fragment containing the vector backbone was ligated to the digested TRE promoter DNA fragment with T4 DNA ligase buffer (NEB) and transformed into One Shot Stbl3 Chemically Competent Cells (Invitrogen) and colonies were screened by restriction digest analysis. The putative positive colonies were submitted for DNA sequencing and one clone with the correct DNA sequence was designated as pAAV.TRE.EYFP. AAV production
For AAV production, we used the AAV Helper Free System (Agilent Technologies). The adeno-associated virus vector (pAAV.EF1a.DIO.hChR2(H134R).EYFP, pAAV.EF1a.DIO.ArchT3.0.EYFP, pAAV.TRE.hChR2(H134R).EYFP, or pAAV.TRE.EYFP) was co-transfected with pAAV-DJ/8 (Cell Biolabs), which supplies AAV2 replication proteins and AAV-DJ/8

5
capsid proteins, and pHelper (Agilent Technologies) which supplies the necessary adenovirus gene products required for the AAV production into the 293FT cell line (Invitrogen) utilizing the 293fectin transfection reagent (Invitrogen). After 72 hours, the supernatant was collected and centrifuged at 3,000 rpm for 30 minutes and then filtered through a 0.45µM filtration unit (Millipore). Purification of the AAV was carried out by ultracentrifugation (87,000 g, 4°C, 2 h) with a 20 % sucrose cushion. After ultracentrifugation, the supernatant was removed and the pellet was resuspended in phosphate-buffered saline (PBS), aliquoted and stored at -80°C for long term storage. The AAV stocks were titered using a custom ordered AAV stock purchased from Virovek (Hayward, CA) as the reference standard. AAV titer quantification was performed using qPCR with the StepOne Plus Real Time PCR System (Applied Biosystems), FastStart Universal SYBR Green Master (Roche, Basel), and QPCR primers for an approximately 100 bp fragment of the woodchuck hepatitis virus posttranscriptional response element (WPRE) found in all our adeno-associated virus vectors. The titers for the five AAV stocks ranged between 7.89×10¹¹ to 1.18×10¹³ viral genome (vg)/mL. Stereotactic injection
All surgeries were performed in a stereotaxic frame (Narishige, Tokyo). Mice were anaesthetized using 500 mg/kg avertin unless mentioned otherwise. AAVs and UCNPs were injected using a 10 μL Hamilton microsyringe (701LT, Hamilton) with a beveled 33 gauge needle (NF33BL, WPI). A microsyringe pump (UMP3, WPI) and its controller (Micro4, WPI) were used to control the speed of the injection. The needle was slowly lowered to the target site and remained in place for 10 min before the beginning of the injection. AAVs were typically injected at a speed of 100 nL/min, while UCNPs at 30 nL/min. The needle was removed 5 min after infusion was complete. Fiber photometry for confirming in vivo upconversion emission
C57BL/6 mice were anesthetized by isoflurane and 900 nL of 200 mg/mL NaYF4:Yb/Tm@SiO2 UCNPs were injected into the VTA (AP: −3.5 mm, ML: +0.4 mm, DV: −4.2 mm). The tip of a NIR-transmitting optic fiber was positioned at various distances from the VTA target to deliver excitation NIR light, and a second optic fiber was inserted to VTA for the collection of upconversion emission. A customized fiber photometric system (Olympus Engineering) was used to detect upconversion emission from the UCNPs. Pulsed NIR laser (25 ms pulses at 20 Hz over 1 s, 2.0 W peak power) was generated by a 980 nm laser resource (MDL-980, Changchun New Industries CNI Laser) under control of a function generator. Emitted light from UCNPs was collected, divided by a dichroic mirror (DM515YFP, Olympus) into cyan (483/32 nm band-path filters, Semrock) and yellow (542/27 nm), and detected by each photomultiplier tube (H10722-210, Hamamatsu Photonics). The optical signals were digitized by a data acquisition module (NI USB-6211, National Instruments) and simultaneously recorded by using a custom-made LabVIEW program (National Instruments) at a sampling frequency of 1 kHz. The recording data of the cyan channel was used for further analysis to evaluate in vivo NIR upconversion by UCNPs. A blue light emitting diode (LED) irradiating 0.13 mW/mm2 light was used for calibrating the detected blue light intensity.

6
Transmission electron microscopy
900 nL of 100 mg/mL NaYF4:Yb/Tm@SiO2 UCNPs were injected bilaterally into mouse VTA. Two days after UCNP injection, mice were transcardially perfused with 4% paraformaldehyde (PFA)/0.25% glutaraldehyde in 0.1 M sodium phosphate buffer (PB). Brains were postfixed in the same fixative for 1 day and 100μm-thick vibratome sections were prepared. After several washes in 0.1M cacodylate buffer (pH7.4), sections were postfixed with 1% osmium tetroxide (Sigma) and 1.5% potassium ferrocyanide in 0.1 M cacodylate buffer for 1 h and 1% osmium tetroxide in 0.1M cacodylate buffer for 1 h. Thereafter, sections were en block counterstained with 1% uranyl acetate (made up in MilliQ) for 1 h and dehydrated through graded ethanol series of 50%, 70%, 80%, 90%, 95% and 100% for 10 min each. Sections were treated with propylene oxide for 10 min and then immersed in freshly prepared Durcupan resin overnight for resin infiltration (Sigma). Sections were transferred to glass slide for flat embedding and left in 60°C oven for 2 overnights for resin curing. The VTA was excised out from the flat-embedded sections and glued onto resin block for ultrathin sectioning. 70 nm ultrathin sections were cut with a diamond knife (Diatome) using a Reichert-Jung ultracut E ultramicrotome, collected in formvar-coated single-slot copper grid and briefly counterstained with 2% uranyl acetate in 50% ethanol and 0.4 % lead citrate. Sections were observed under electron microscope (JEM-1010, JEOL) and images were captured using a CCD camera (TemCam-216, TVIPS). In vitro whole-cell patch-clamp recording under NIR stimulation
300 nL of AAV.EF1a.DIO.hChR2(H134R).EYFP (3×10⁸ vg) was injected bilaterally into the VTA of ~10 week-old TH-Cre mice. Four weeks later 900 nL of 200 mg/mL NaYF4:Yb/Tm@SiO2 UCNPs were injected bilaterally into the same area. For UCNP(−) controls, the same volume of saline was injected instead of UCNPs. Acute horizontal slices (220 μm thick) including the VTA were prepared. Mice were decapitated under isoflurane anesthesia. Briefly, the brain was isolated and cut using a vibratome (Leica, VT2000S) in an ice-cold cutting solution containing (in mM): 215 sucrose, 20 D-glucose, 2.5 KCl, 26 NaHCO3, 1.6 NaH2PO4, 1 CaCl2, 4 MgCl2, and 4 MgSO4. Slices were then transferred to 33.5°C cutting solution. After 30 min, the cutting solution was switched to 33.5°C extracellular artificial cerebrospinal (ACSF) recording solution containing (in mM): 124 NaCl, 2.5 KCl, 26 NaHCO3, 1 NaH2PO4, 2.5 CaCl2, 1.3 MgSO4 and 10 D-glucose. Slices were kept at room temperature for at least 1 h before recording.
Whole-cell voltage-clamp and current-clamp recordings were performed using an EPC10 amplifier (HEKA Electronik). EYFP-expressing DA neurons were patched with a patch-type pipette electrode (~3−4 MΩ) containing (in mM): 136 K-gluconate, 4 KCl, 10 HEPES, 0.16 CaCl2, 2 MgCl2, 0.5 EGTA, 4 Na2ATP, 0.4 Na2GTP, pH 7.3 (286 mOsm). For voltage-clamp recordings, DA neurons were voltage-clamped at −60 mV, and 100 ms IR pulses at various intensities were delivered through an optic fiber (200 μm in diameter) positioned close to the slice. For current-clamp recordings, the membrane potentials were held at −60 ~ −70 mV. Trains of 10 pulses (8.22 W/mm2 peak power) were applied at 10, 20 and 50 Hz. Durations of NIR at each pulse were 20 ms for 10 Hz and 20 Hz, and 10 ms for 50 Hz. Spike probability was calculated by the percentage of

7
the number of spikes among 10 pulses. All experiments were performed at 28 ± 1°C in a submersion-type recording chamber perfused with ACSF supplemented with 10 μM NBQX, 50 μM D-AP5 and 100 μM picrotoxin at ~2 mL/min. Series resistance (~5−15 MΩ) was uncompensated and monitored throughout experiments with a −5 mV, 50 ms voltage step, and cells that exhibited a significant change in series resistance (>20%) were excluded from analysis. Data were filtered at 2.9 kHz and sampled at 20 kHz. In vivo NIR stimulation of VTA
300 nL of AAV.EF1a.DIO.hChR2(H134R).EYFP (3×10⁸ vg) was injected bilaterally into the VTA of ~10 week-old TH-Cre mice. For ChR2(−) controls, the same volume of saline was injected instead of AAV. Four weeks later 900 nL of 200 mg/mL NaYF4:Yb/Tm@SiO2 UCNPs were injected bilaterally into the same area under isoflurane anesthesia. For UCNP(−) controls, the same volume of saline was injected instead of UCNPs. The tip of a NIR-transmitting optic fiber (200 μm in diameter) was placed 2 mm above the skull at an angle to target the NIR laser (MDL-980, Changchun New Industries CNI Laser) to the UCNP injection site in the VTA. 15 ms pulses of transcranial NIR irradiation at 20 Hz and 3.0 W (peak power) was delivered 3 s every 3 min over the course of 30 min (average power 15 mW). Mice were sacrificed 90 min later for examining NIR-induced c-Fos expression. In vivo fast-scan cyclic voltammetry (FSCV)
300 nL of AAV.EF1a.DIO.hChR2(H134R).EYFP (3×10⁸ vg) was injected bilaterally into the VTA of ~10 week-old TH-Cre mice. For ChR2(−) controls, the same volume of saline was injected instead of AAV. Four weeks later the mice were used for in vivo FSCV recording of dopamine release.
Mice were anesthetized with 500 mg/kg avertin and placed in the stereotaxic frame. Anesthesia was maintained with 0.5−1% isoflurane inhalation. 900 nL of 200 mg/mL NaYF4:Yb/Tm@SiO2 UCNPs were injected bilaterally into the same area under isoflurane anesthesia. For UCNP(−) controls, the same volume of saline was injected instead of UCNPs.
A carbon fiber electrode was lowered into the ventral striatum (AP: +1.3 mm, ML: +0.8 mm, DV: −4.2 mm). One Ag wire (auxiliary electrode) and one Ag/AgCl wire (reference electrode) were inserted into the cortex of the contralateral hemisphere. An optic fiber for blue and NIR light delivery was lowered to VTA.
A commercial counter electrode-grounded type potentiostat (Model HECS-972E, Huso Electrochemical Systems, Kawasaki, Japan) was used for FSCV recordings. Data acquisition was performed by a commercial control/recording system (TH-1; ESA Biosciences, Inc., MA, USA) with two multifunction boards (NI-PCI-6221, National Instruments, TX, USA) implemented on a Windows PC. The amplifier gain was 500 nA/V and the low-pass filter time-constant was 0.2 ms. Voltage sweeps from −0.4 V to 1.3 V and back vs Ag/AgCl reference were applied to the carbon fiber electrode. This triangle-positive waveform was repeated at 10 Hz.
To compare the distance-dependence of dopamine release between blue and NIR irradiation, blue (2 ms pulses at 50 Hz over 2 s, 20 mW peak power) and NIR irradiation (15 ms pulses at 20 Hz over 2 s, 700 mW peak power) was alternately applied at

8
increasing distances until reaching the brain surface while dopamine release was recorded by FSCV.
To assess the ability of extracranial application of NIR light to elicit dopamine release, the fiber was elevated 1 mm above the skull. To enhance dopamine release, 10 mg/kg nomifensine (dopamine transporter blocker, Sigma, St. Louis MO) was administered to the animals via intraperitoneal injection. NIR irradiation (15 ms pulses at 20 Hz over 2 s, 700 mW peak power) was applied during FSCV.
All recording sessions were 20 seconds, with stimulation applied at second five. Voltammetric data was first output in the software as background-subtracted currents relative to the mean of 10 waveform applications 1 second before stimulation. The background-subtracted currents were then analyzed against calibration templates of known values of DA, pH and adenosine using principal component regression to isolate the DA signal from other electroactive factors and convert it to concentration values. In vivo NIR inhibition of hippocampal activity
300 nL of AAV.EF1a.DIO-eArch3.0-EYFP (3×10⁸ vg) was injected into the hippocampus (AP: −2.0 mm, ML: +1.2 mm, DV: −1.5 mm) of ~10 week-old CamKII-Cre mice. For ChR2(−) controls, the same volume of saline was injected instead of AAV. Four weeks later 900 nL of 100 mg/mL NaYF4:Yb/Er@SiO2 UCNPs were injected into the same area under isoflurane anesthesia. For UCNP(−) controls, the same volume of saline was injected instead of UCNPs. Mice were then administered an intraperitoneal injection of kainic acid (SigmaAldrich, 15 mg/kg in saline). The tip of a NIR-transmitting optic fiber (200 μm in diameter) was placed 2 mm above the skull at an angle to target the NIR laser (MDL-980, Changchun New Industries CNI Laser) to the UCNP injection site in the hippocampus. 3 ms pulses of transcranial NIR irradiation at 10 Hz (750 mW peak power, 22.5 mW average power) was delivered over the course of 120 min before mice were sacrificed. In vivo NIR stimulation of medial septum for theta entrainment
300 nL of AAV.EF1a.DIO.hChR2(H134R).EYFP (3×10⁸ vg) was injected into the medial septum ( AP: +0.9 mm, ML: +0.1 mm, DV: −4.1 mm) of ~10 week-old PV-Cre mice. For ChR2(−) controls, the same volume of saline was injected instead of AAV. Four weeks later mice were anaesthetized with urethane (1.3−1.5 g/kg) and 900 nL of 200 mg/mL NaYF4:Yb/Tm@SiO2 UCNPs were injected into the same area. For UCNP(−) controls, the same volume of saline was injected instead of UCNPs. Then, the tip of a NIR-transmitting optic fiber (200 μm in diameter) was placed 2 mm above the skull at an angle to target the NIR laser (MDL-980, Changchun New Industries CNI Laser) to the UCNP injection site in the medial septum.
Recordings were conducted with a 32-channel single-shank silicon linear probe (NeuroNexus model no. A1-32-10mm-50-413-A32) lowered into the CA1 region of the right dorsal hippocampus (AP: −1.9 mm, ML: +1.5 mm, DV: −1.5 mm). The signal was referenced to the most superficial cortical recording site and grounded to a skull screw. Proximity of the probe to the hippocampus was calculated by the depth of the probe via the micromanipulator and verified by the presence of complex spike bursts and occasional ripple oscillations. The site with maximum spiking activity was designated as the pyramidal cell layer and the anatomical location of all other sites was based on their
9
relative spacing. Local field potential (LFP, sampled at 32 kHz and filtered between 0.1 Hz and 6 kHz) was acquired on all 32 channels of the probe simultaneously using a 32-channel Digital Lynx4S system running Cheetah v5.6.0 acquisition software (Neuralynx). In a typical experiment to examine NIR entrainment of hippocampal theta, 15 ms pulses of transcranial NIR irradiation at 6–12 Hz (3.0 W peak power, 270–540 mW average power) was delivered to the medial septum over 10 s during recording.
The raw LFP data were downsampled using custom software written in C to 1627.8 Hz (a factor of 20), followed by quality control measures and channel selection via visual inspection. A low-pass filter with a cut-off frequency equal to half the target sampling frequency was applied to the LFP prior to downsampling to prevent signal distortion. Data was then sorted into 30 s trials with 10 s of prestimulation, 10 s of NIR stimulation and 10 s of poststimualiton. LFP signal was prewhitened (2-100 Hz) prior to computation of wavelet transform to damp lower frequencies. For the calculation of the wavelet power spectrum, the continuous wavelet transform (CWT) was applied to the LFP using complex Morlet wavelets returning amplitudes at 226 intervals between 2-100 Hz. Amplitude values were then z-scored in the frequency band of 2-15 Hz. For the wavelet decomposition the algorithm of Torrence and Compo was used (41).
In vivo NIR stimulation of hippocampal engram for fear memory recall
300 nL of AAV.TRE.hChR2(H134R).EYFP (3×10⁸ vg) was injected bilaterally into the DG (AP: −2.2 mm, ML: +/−1.3 mm, DV: −2.0 mm) of ~10 week-old c-fos-tTA transgenic mice. For ChR2(−) controls, the same volume of AAV.TRE.EYFP was injected instead of AAV.TRE.hChR2(H134R).EYFP. Four weeks later, 600 nL of 200 mg/mL NaYF4:Yb/Tm@SiO2 UCNPs were injected bilaterally into the same area of the hippocampus. For UCNP(−) controls, the same volume of saline was injected instead of UCNPs. Fiber optic sleeves were glued onto the skull bilaterally using Loctite 401 instant adhesive at an angle that allowed targeting of the NIR laser (MDL-980, Changchun New Industries CNI Laser) from a connecting optic fiber to the UCNP injection site in the hippocampus of free-moving mice.
The protocol of the behavior assay is identical to that described in previous work (34), except that we delivered 980 nm NIR light transcranially instead of delivering blue light through fiber implants to the DG during light-on sessions. In brief, during the 5-day habituation session, each mouse was introduced to context A daily for a 12 min exploration session while on 40 mg/kg doxycycline (Dox) food. The 12 min session was divided into four 3-min epochs, with the first and third epochs as the NIR-off epochs, and the second and fourth epochs as the NIR-on epochs. During the NIR-on epochs, the mouse received 15 ms transcranial NIR pulses at 20 Hz (250 mW peak power, 75 mW average power). Following the habituation session, the mouse was taken off Dox for two days and on the second day, the mouse received three fear conditioning trials in a distinct novel chamber, context B. For each trial, the mouse was kept in the conditioning chamber in context B for 500 s. A tone (20 s, 75 dB, 2,000 Hz) was presented at 180 s, 260 s, 340 s and 420 s, each of which co-terminated with a foot shock (2 s, 0.75 mA). After three trials, the mouse was put on food containing 1 g/kg Dox overnight. The test sessions started the next day, and the mouse was put back to food containing 40 mg/kg Dox. The procedure for the 5-day test session in context A was the same as the habituation session. Freezing behavior of animals was recorded with a digital camera and the freezing of these
10
sessions was manually scored by observers blind to experimental groups. The freezing level of each mouse was averaged over the testing days. In vivo cytotoxicity assay
900 nL of 200 mg/mL UCNPs were injected into mouse VTA. In a control experiment, an optic fiber (200 μm in diameter) was implanted into the same brain region. After various periods (1 day, 2 weeks and 4 weeks) following the surgery, mice were transcardially perfused with 4% PFA in 0.1 M PBS. Brains were postfixed in 4% PFA and 50 μm-thick vibratome sections were prepared. Immunohistochemistry was performed with Iba1 and GFAP antibodies. The numbers of Iba1+ microglia and GFAP+ astrocytes in a 200 µm vicinity of the UCNP injection or fiber implantation site were counted and their percentages in cell population indicated by DAPI were calculated. Immunohistochemistry
Mice were transcardially perfused with 4% PFA in 0.1 M PBS. Brains were postfixed in 4% PFA and 50 μm-thick vibratome sections were prepared. After 3×10 min PBS rinses, the sections were blocked in PBST (PBS + 0.3% Triton X-100) with 3% normal donkey serum for 1.5 h, and incubated in primary antibody at 4°C for 20 h (Table S1). After 3×10 min washes in PBST, the sections were incubated with secondary antibody (Table S1) for 2 h at room temperature followed by 3×10 min washes in PBST.
Confocal fluorescence images were acquired on an Olympus IX81 confocal laser scanning microscope with a 20× objective. Luminescent images of UCNPs were collected on a Leica DM6000B epifluorescence microscope with a 20× objective under 25 W/mm2 980 nm NIR excitation and merged with confocal fluorescence images of same sections.
To analyze the overlap between fluorescent markers (e.g. anti-cFos and DAPI, Iba1 and DAPI etc.), a z-stack function was used to montage 5 optical stacks (1 μm each, step size 4 μm). Filtered fluorescent images were digitally combined to produce composite images and the number of cells with overlapping signals was counted in a region of interest (ROI) of 200 μm with ImageJ. Three ROIs were selected on each section and then averaged. For statistics, slices from at least 3 animals were obtained, imaged and analyzed. All imaging and analyses were performed blind to the experimental conditions.
Evaluation of NIR penetration in mouse brain
C57BL/6 mice were euthanized in accordance with institutional regulations under isofluorane anesthesia. The fresh brain with the skull intact was immediately extracted and horizontally placed on a microscope slide. For evaluating the penetration of extracranially delivered NIR light through mouse skull and brain, the tip of a NIR-transmitting optic fiber (200 μm in diameter) was placed 2 mm above the skull, where the brain thickness was approximately 5 mm. While pulsed NIR laser (15 ms at 20 Hz) at various intensities was vertically delivered from above the skull, the intensity of NIR light that penetrated the skull and brain tissue was measured below (on the other side of the microscope slide) by a laser power sensor (12A P/N 7Z01550, Ophir) connected to a power meter (12A P/N 7Z02638, Ophir). Because the microscope slide was validated not to cause any loss of NIR intensity, the measured data was directly used to calculate the NIR penetrating ratio across the skull and brain tissue. For evaluating the NIR penetration ratio as a function of brain tissue thickness, the same setup was used except that the tip of

11
the NIR-transmitting optic fiber was inserted to various depths into the brain and the NIR intensities that penetrated defined thicknesses of brain tissue were measured. Evaluation of NIR heating effect in mouse brain
C57BL/6 mice were anesthetized with 500 mg/kg avertin and placed in the stereotaxic frame. Anesthesia was maintained with 0.5−1% isoflurane inhalation. The tip of a NIR-transmitting optic fiber (200 μm in diameter) was placed 2 mm above the skull at an angle to target NIR pulses to the brain region of interest. An ultra-fine sheathed thermocouple sensor (K-type, Aeropak Nano, Okazaki, outer diameter: 150 μm, sheath length: 50 mm) connected to a K-type thermocouple thermometer (AD-5601A, A&D) via a miniature thermocouple connector (SMPW-KJ-M-ROHS, Omega) was inserted into the target brain region or placed at the brain surface for local temperature detection. For measuring brain temperature change as a function of depth, the tip of the thermocouple sensor was elevated stepwise in a series of measurements. For measuring brain temperature change as a function of the NIR power, the intensity of NIR laser was elevated stepwise in a series of measurements. Temperature changes of brain tissue under four different conditions of transcranial NIR irradiation used in this study (Table S2) were systematically examined.
12
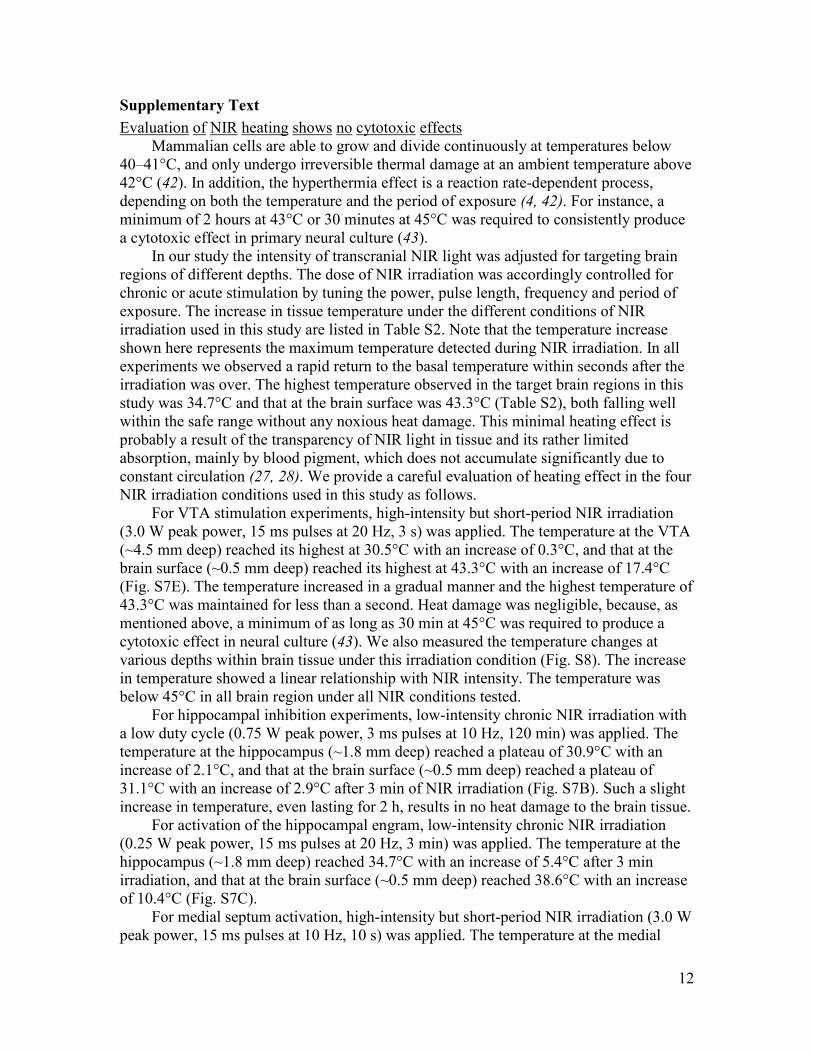
Supplementary Text Evaluation of NIR heating shows no cytotoxic effects
Mammalian cells are able to grow and divide continuously at temperatures below 40–41°C, and only undergo irreversible thermal damage at an ambient temperature above 42°C (42). In addition, the hyperthermia effect is a reaction rate-dependent process, depending on both the temperature and the period of exposure (4, 42). For instance, a minimum of 2 hours at 43°C or 30 minutes at 45°C was required to consistently produce a cytotoxic effect in primary neural culture (43).
In our study the intensity of transcranial NIR light was adjusted for targeting brain regions of different depths. The dose of NIR irradiation was accordingly controlled for chronic or acute stimulation by tuning the power, pulse length, frequency and period of exposure. The increase in tissue temperature under the different conditions of NIR irradiation used in this study are listed in Table S2. Note that the temperature increase shown here represents the maximum temperature detected during NIR irradiation. In all experiments we observed a rapid return to the basal temperature within seconds after the irradiation was over. The highest temperature observed in the target brain regions in this study was 34.7°C and that at the brain surface was 43.3°C (Table S2), both falling well within the safe range without any noxious heat damage. This minimal heating effect is probably a result of the transparency of NIR light in tissue and its rather limited absorption, mainly by blood pigment, which does not accumulate significantly due to constant circulation (27, 28). We provide a careful evaluation of heating effect in the four NIR irradiation conditions used in this study as follows.
For VTA stimulation experiments, high-intensity but short-period NIR irradiation (3.0 W peak power, 15 ms pulses at 20 Hz, 3 s) was applied. The temperature at the VTA (~4.5 mm deep) reached its highest at 30.5°C with an increase of 0.3°C, and that at the brain surface (~0.5 mm deep) reached its highest at 43.3°C with an increase of 17.4°C (Fig. S7E). The temperature increased in a gradual manner and the highest temperature of 43.3°C was maintained for less than a second. Heat damage was negligible, because, as mentioned above, a minimum of as long as 30 min at 45°C was required to produce a cytotoxic effect in neural culture (43). We also measured the temperature changes at various depths within brain tissue under this irradiation condition (Fig. S8). The increase in temperature showed a linear relationship with NIR intensity. The temperature was below 45°C in all brain region under all NIR conditions tested.
For hippocampal inhibition experiments, low-intensity chronic NIR irradiation with a low duty cycle (0.75 W peak power, 3 ms pulses at 10 Hz, 120 min) was applied. The temperature at the hippocampus (~1.8 mm deep) reached a plateau of 30.9°C with an increase of 2.1°C, and that at the brain surface (~0.5 mm deep) reached a plateau of 31.1°C with an increase of 2.9°C after 3 min of NIR irradiation (Fig. S7B). Such a slight increase in temperature, even lasting for 2 h, results in no heat damage to the brain tissue.
For activation of the hippocampal engram, low-intensity chronic NIR irradiation (0.25 W peak power, 15 ms pulses at 20 Hz, 3 min) was applied. The temperature at the hippocampus (~1.8 mm deep) reached 34.7°C with an increase of 5.4°C after 3 min irradiation, and that at the brain surface (~0.5 mm deep) reached 38.6°C with an increase of 10.4°C (Fig. S7C).
For medial septum activation, high-intensity but short-period NIR irradiation (3.0 W peak power, 15 ms pulses at 10 Hz, 10 s) was applied. The temperature at the medial

13
septum (~4.0 mm deep) reached its highest at 31.9°C with an increase of 2.6°C, and that at the brain surface (~0.5 mm deep) reached 36.3°C with an increase of 10.0°C (Fig. S7D).
Therefore, the temperature in the brain or at the brain surface never exceeded 43.3°C under all NIR conditions used in our study. This temperature increase profile suggests negligible heating damage to the brain tissue.
To further confirm this conclusion, we performed immunohistochemistry on the cortices overlying the target brain regions to evaluate the cytotoxic effect of NIR irradiation. NIR stimulation under all conditions did not alter the density of cleaved Caspase-3- or Iba1-positive cells (Fig. S9), suggesting a lack of increased apoptosis or reactive microglia due to the NIR irradiation.
Nonetheless, a careful optimization of NIR parameters, including power, pulse length, frequency and period of exposure, should always be performed before a NIR DBS strategy is adopted, especially when deep brain structures are targeted, to avoid possible thermal damage of the tissue. Simulation of in vivo upconversion emission of transcranial NIR irradiation
We used the Kubelka-Munk model to stimulate the transmittance of NIR light in brain tissue by assuming that the brain is a homogeneous diffuser and transmission loss from scattering is much greater than that from absorption (25). This model was previously used to predict the transmittance of visible light in rodent brain and made a good fit (44, 45). The transmittance T at a distance d from the NIR source is calculated as
2
2( 1)( )T
Sd dρ
ρ=
+ + (1)
where 2( ) 1
NAnrρ = − (2)
and d is the distance from the NIR source, S is the scattering coefficient (~5.226 mm-1 for 980 nm NIR) (46), r is the radius of the optic fiber (100 μm in our case), n (1.36) is the index of refraction of gray matter, and NA (0.37) is the numerical aperture of the optic fiber. The obtained T value is further used for calculating the local blue emission by UCNPs,
blue NIR L( ) (0)I d I T kφ= × × × (3) where
2NIR NIR(0) /I P rπ= (4)
and Iblue(d) is the blue emission intensity at the distance of d from the NIR source, INIR(0) is the NIR intensity at the fiber tip, ϕ is the conversion yield from NIR to blue light (2.5% for 0.18 mg NaYF4:Yb/Tm@SiO2 UCNPs), and PNIR is the NIR power applied. Note that kL is an empirical loss coefficient defined by us to reflect the difference between the theoretical intensity of upconversion emission with the measured value caused by (i) the incomplete detection of emitted photons by fiber photometry and (ii) the incomplete upconversion of tissue-penetrating NIR by UCNPs. The empirical value of kL derived from our experimental data was ~0.3.
The model makes a good fit with the experimental data of upconversion emission at the VTA when 2.0 W 980 nm NIR was irradiated from various distances (Fig.1H and Fig.

14
S5). For example, when a 2.0 W 980 nm laser was delivered through an optic fiber (200 μm in diameter), 13.8 mW/mm2 NIR was estimated to penetrate 4.5 mm in the brain tissue and converted locally by 0.18 mg UCNPs to 0.34 mW/mm2 blue emission. Multiplying this simulated value by kL gives 0.10 mW/mm2, close to the measured emission intensity of 0.064 mW/mm2 (Fig.1H and Fig. S5). Therefore, the model may be used for estimating the intensity of upconversion emission at a certain depth in the brain upon transcranial NIR delivery.

15

16
Fig. S1. Characterization of two types of UCNPs. (A and D) TEM images of NaYF4:Yb/Tm@PAA (A) and NaYF4:Yb/Er@SiO2 (D) particles. (Right) High-resolution TEM images of one nanoparticle. (B and E) Emission spectra of the NaYF4:Yb/Tm@PAA (B) and NaYF4:Yb/Er@SiO2 (E) particles under excitation at 980 nm. (C and F) Size distribution of the NaYF4:Yb/Tm@PAA (C) and NaYF4:Yb/Er@SiO2 (F) particles measured by dynamic light scattering. No aggregation is observed for both UCNPs in either water or PBS.

17
Fig. S2. Size distribution of the UCNPs in saline and bovine serum albumin (BSA, 1 mg/mL in PBS) solution measured by dynamic light scattering. No aggregation is observed for NaYF4:Yb/Tm@SiO2 (A) and NaYF4:Yb/Er@SiO2 (B) particles in either saline or BSA solution. Slight aggregation is observed for NaYF4:Yb/Tm@PAA (C) particles in saline but not in BSA solution.
18
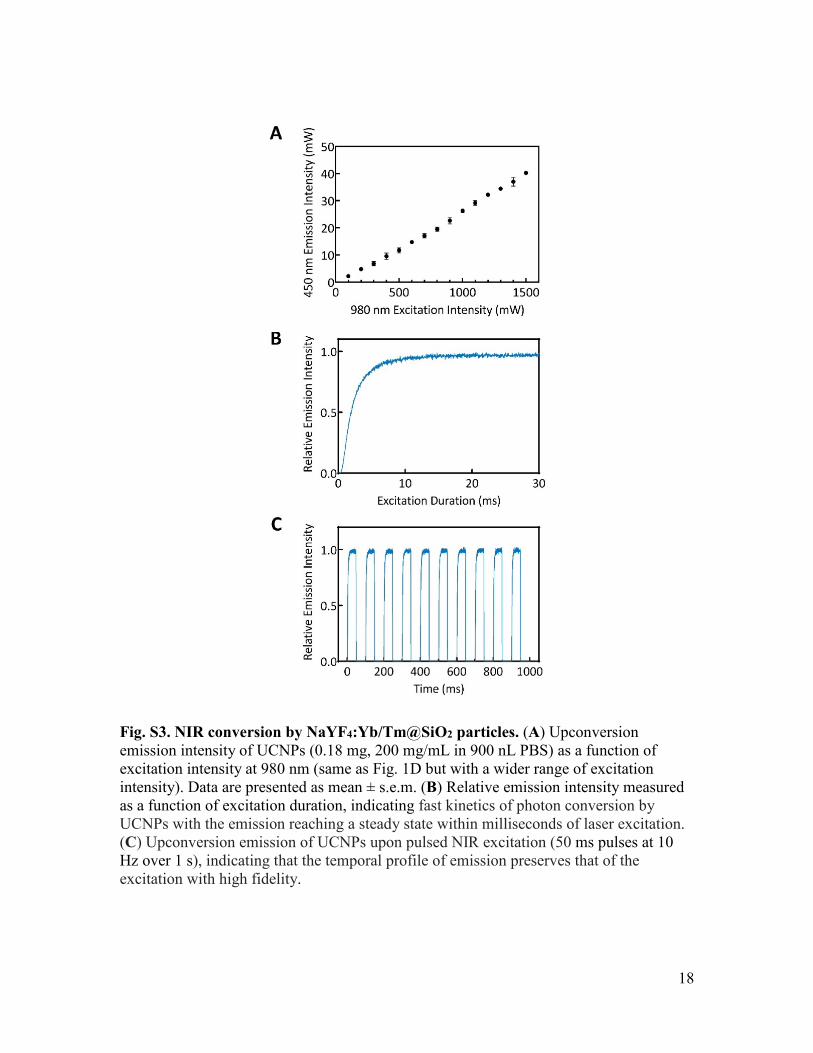
Fig. S3. NIR conversion by NaYF4:Yb/Tm@SiO2 particles. (A) Upconversion emission intensity of UCNPs (0.18 mg, 200 mg/mL in 900 nL PBS) as a function of excitation intensity at 980 nm (same as Fig. 1D but with a wider range of excitation intensity). Data are presented as mean ± s.e.m. (B) Relative emission intensity measured as a function of excitation duration, indicating fast kinetics of photon conversion by UCNPs with the emission reaching a steady state within milliseconds of laser excitation. (C) Upconversion emission of UCNPs upon pulsed NIR excitation (50 ms pulses at 10 Hz over 1 s), indicating that the temporal profile of emission preserves that of the excitation with high fidelity.
19
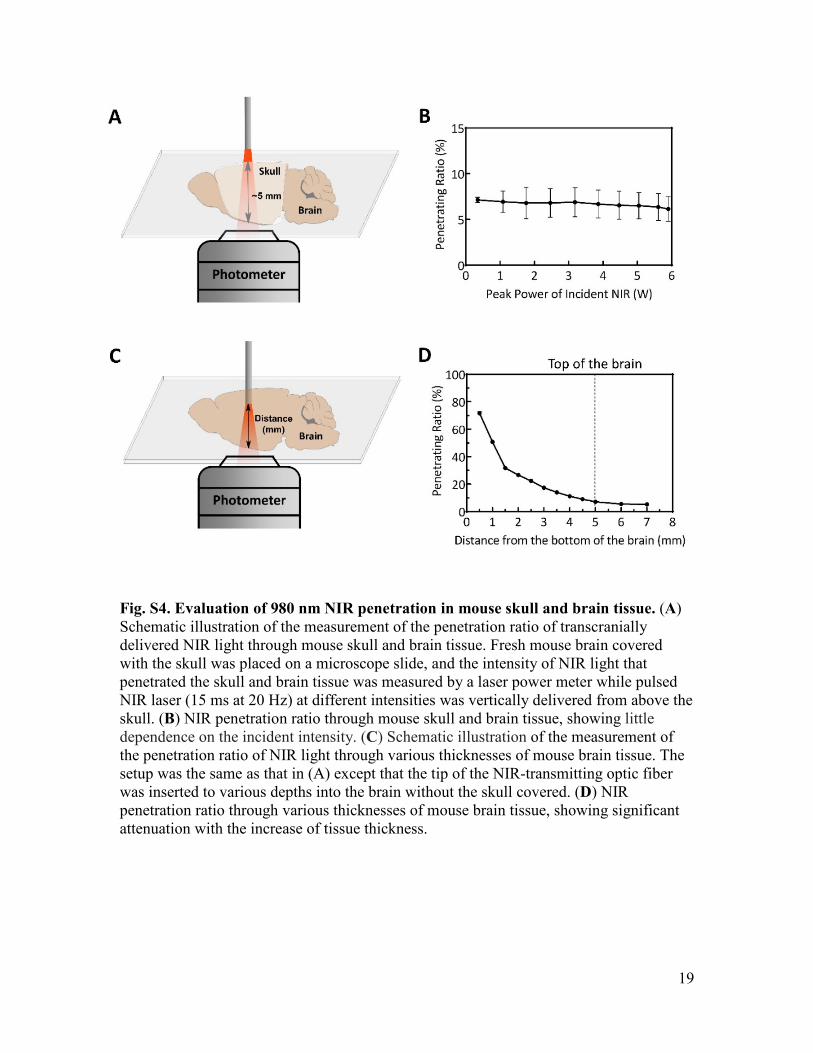
Fig. S4. Evaluation of 980 nm NIR penetration in mouse skull and brain tissue. (A) Schematic illustration of the measurement of the penetration ratio of transcranially delivered NIR light through mouse skull and brain tissue. Fresh mouse brain covered with the skull was placed on a microscope slide, and the intensity of NIR light that penetrated the skull and brain tissue was measured by a laser power meter while pulsed NIR laser (15 ms at 20 Hz) at different intensities was vertically delivered from above the skull. (B) NIR penetration ratio through mouse skull and brain tissue, showing little dependence on the incident intensity. (C) Schematic illustration of the measurement of the penetration ratio of NIR light through various thicknesses of mouse brain tissue. The setup was the same as that in (A) except that the tip of the NIR-transmitting optic fiber was inserted to various depths into the brain without the skull covered. (D) NIR penetration ratio through various thicknesses of mouse brain tissue, showing significant attenuation with the increase of tissue thickness.

20
Fig. S5. Simulated and measured intensity of upconversion emission by 0.18 mg NaYF4:Yb/Tm@SiO2 particles in the VTA as a function of the distance from the source of 2.0 W 980 nm NIR irradiation. (Inset) Magnified view of the area within the box with dotted border. See also Fig. 1H. See supplementary text for simulation detail.

21
Fig. S6. In vitro optogenetic excitation of VTA DA neurons by minimal blue light stimulation. (A) Representative voltage-clamp traces of a DA neuron in response to 5 ms blue light (473 nm) stimulation at minimal intensities. Brief blue lines indicate blue laser pulses. (B) Increase in photocurrent amplitude with elevated intensity of blue light stimulus. (C) Representative voltage-clamp traces of a DA neuron in response to 5 ms blue light stimulation at even lower intensities. The numbers on the right indicate the average amplitudes of photocurrents triggered by blue light stimuli at the two minimal intensities shown on the left. Data are presented as mean ± s.e.m.

22
Fig. S7. Evaluation of the heating effect on brain tissue of various NIR conditions used in this study. (A) Schematic illustration of the measurement of temperature change at the target brain region, e.g. the VTA, and the brain surface above it upon transcranial NIR irradiation. (B-E) Temporal change of temperature under transcranial NIR irradiation used for hippocampal inhibition (B), activation of hippocampal engram (C), induction of theta oscillations (D), and activation of the VTA (E) in this study. The orange lines indicate the NIR-on periods. Data are presented as mean ± s.e.m (n = 3 for all experiments).

23
Fig. S8. Evaluation of NIR heating effect on brain tissue at various depths. (A) Schematic illustration of the measurement of temperature change at various depths in the brain upon transcranial 980 nm NIR irradiation. (B) Local temperature change as a function of the depth in brain under transcranial NIR irradiation at various intensities. Only the maximum temperature recorded was presented under each condition. Data are presented as mean ± s.e.m (n = 3 for all experiments).

24
Fig. S9. Evaluation of the cytotoxic effects on cortical tissue of 980 nm NIR irradiation by Iba1 (A) and cleaved Caspase-3 (B) immunochemistry. Mice were anesthetized, treated with or without transcranial irradiation, and sacrificed two days after the treatment. Left panels are confocal images of overlying cortices above target brain regions. The right panel is the percentage of Iba1+ (the microglial marker) or cleaved Caspase-3+ (the apoptotic marker) cells within cell population indicated by DAPI. The NIR conditions used were: 15-ms pulses at 20 Hz, 3 s every 3 min for 9 min, 3.0 W peak

25
power for stimulation of the VTA; 15 ms pulses at 10 Hz, 10 s, 3.0 W peak power for stimulation of the medial septum; 3 ms pulses at 10 Hz, 120 min, 750 mW peak power for stimulation of the hippocampus, marked with “Condition 1” in the confocal image and “(1)” in the column graph; 15 ms pulses at 20 Hz, 3 min, 250 mW peak power for stimulation of the hippocampus, marked with “Condition 2” in the confocal image and “(2)” in the column graph. Scale bar: 100 μm. Data are presented as mean ± s.e.m (n = 3 for all experiments).

26
Fig. S10. Evaluation of in vivo chronic biocompatibility of UCNPs by Iba1 immunochemistry. (A) Confocal images of VTA regions at different periods after the injection of silica- or PAA-coated UCNPs or the implantation of a 200 µm-diameter optic fiber, stained for Iba1+ microglia. (B) Percentage of Iba1+ microglia within cell population indicated by DAPI in a 200 µm vicinity of the UCNP injection or fiber implantation site at different periods after the surgery. Data are presented as mean ± s.e.m.

27
Fig. S11. Evaluation of in vivo chronic biocompatibility of UCNPs by GFAP immunochemistry. (A) Confocal images of VTA regions at different periods after the injection of silica- or PAA-coated UCNPs or the implantation of a 200 µm-diameter optic fiber, stained for GFAP+ astrocytes. (B) Percentage of GFAP+ astrocytes within cell population indicated by DAPI in a 200 µm vicinity of the UCNP injection or fiber implantation site at different periods after the surgery. Data are presented as mean ± s.e.m.

28

29
Fig. S12. Electron micrographs of UCNPs distributed in VTA tissue. (A) Distribution of the majority of UCNPs in extracellular space. Two examples are given here. Right are magnified views of the areas within the white boxes in the left images. See also Fig. 2B. (B) Uptake of UCNPs by axons. Two examples are given here. See also Fig. 2B. (C) Uptake of UCNPs by microglia. Right is the magnified view of the area within the white box in the left image.
30
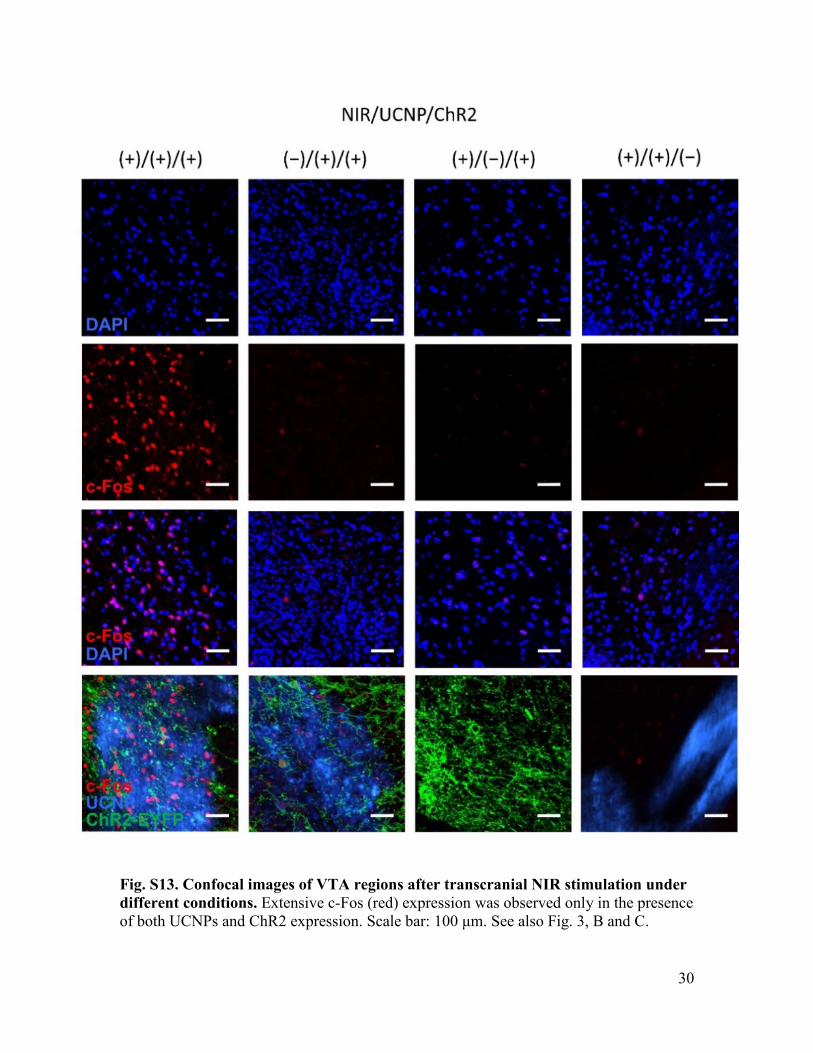
Fig. S13. Confocal images of VTA regions after transcranial NIR stimulation under different conditions. Extensive c-Fos (red) expression was observed only in the presence of both UCNPs and ChR2 expression. Scale bar: 100 μm. See also Fig. 3, B and C.
31
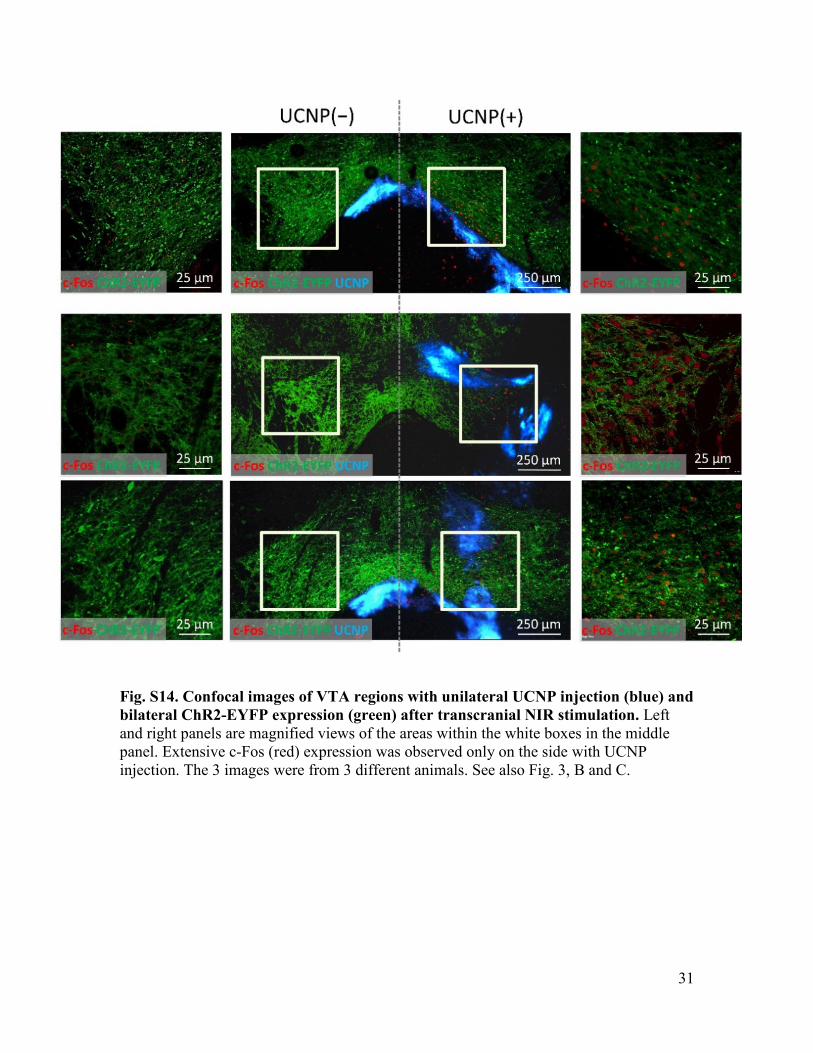
Fig. S14. Confocal images of VTA regions with unilateral UCNP injection (blue) and bilateral ChR2-EYFP expression (green) after transcranial NIR stimulation. Left and right panels are magnified views of the areas within the white boxes in the middle panel. Extensive c-Fos (red) expression was observed only on the side with UCNP injection. The 3 images were from 3 different animals. See also Fig. 3, B and C.

32
Fig. S15. Transcranial NIR stimulation of VTA DA neurons activates postsynaptic neurons in ventral striatum. (A) Confocal images of ventral striatum after transcranial NIR stimulation of VTA under different conditions. Significant c-Fos (red) expression was observed only in the ventral striatum of animals with all three factors, NIR irradiation, UCNP injection and ChR2 expression, at VTA. Scale bar: 500 μm. (B) Percentage of c-Fos-positive cells within cell population indicated by DAPI in ventral striatum corresponding to the four conditions presented in (A). (n = 3 subjects each, F3,8 = 81.83, P < 0.0001).
33
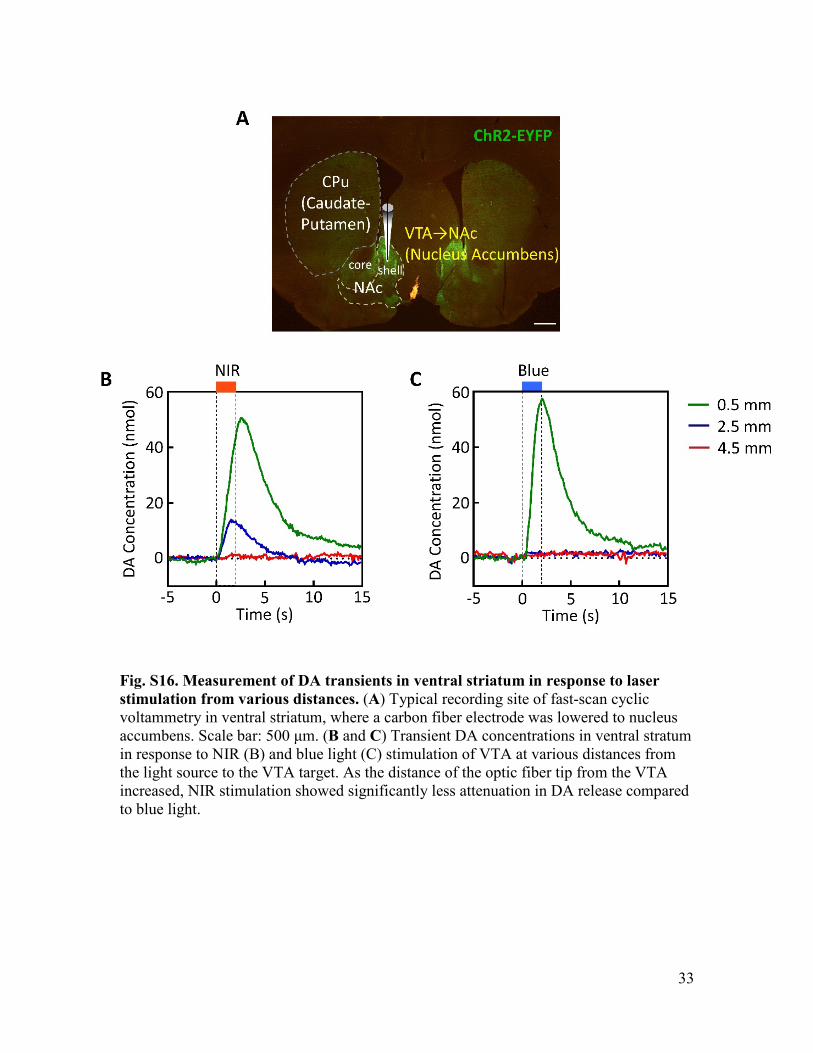
Fig. S16. Measurement of DA transients in ventral striatum in response to laser stimulation from various distances. (A) Typical recording site of fast-scan cyclic voltammetry in ventral striatum, where a carbon fiber electrode was lowered to nucleus accumbens. Scale bar: 500 μm. (B and C) Transient DA concentrations in ventral stratum in response to NIR (B) and blue light (C) stimulation of VTA at various distances from the light source to the VTA target. As the distance of the optic fiber tip from the VTA increased, NIR stimulation showed significantly less attenuation in DA release compared to blue light.

34
Fig. S17. Confocal images of mouse hippocampus with unilateral Arch expression/bilateral UCNP injection/bilateral NIR delivery (A) and bilateral Arch expression/bilateral UCNP injection/unilateral NIR delivery (B) after transcranial NIR stimulation during chemically induced seizure. Significant decrease in c-Fos (red) expression was only observed on the side with Arch expression, UCNP injection and NIR delivery. Scale bar: 400 μm. See also Fig. 4, C and D.
35
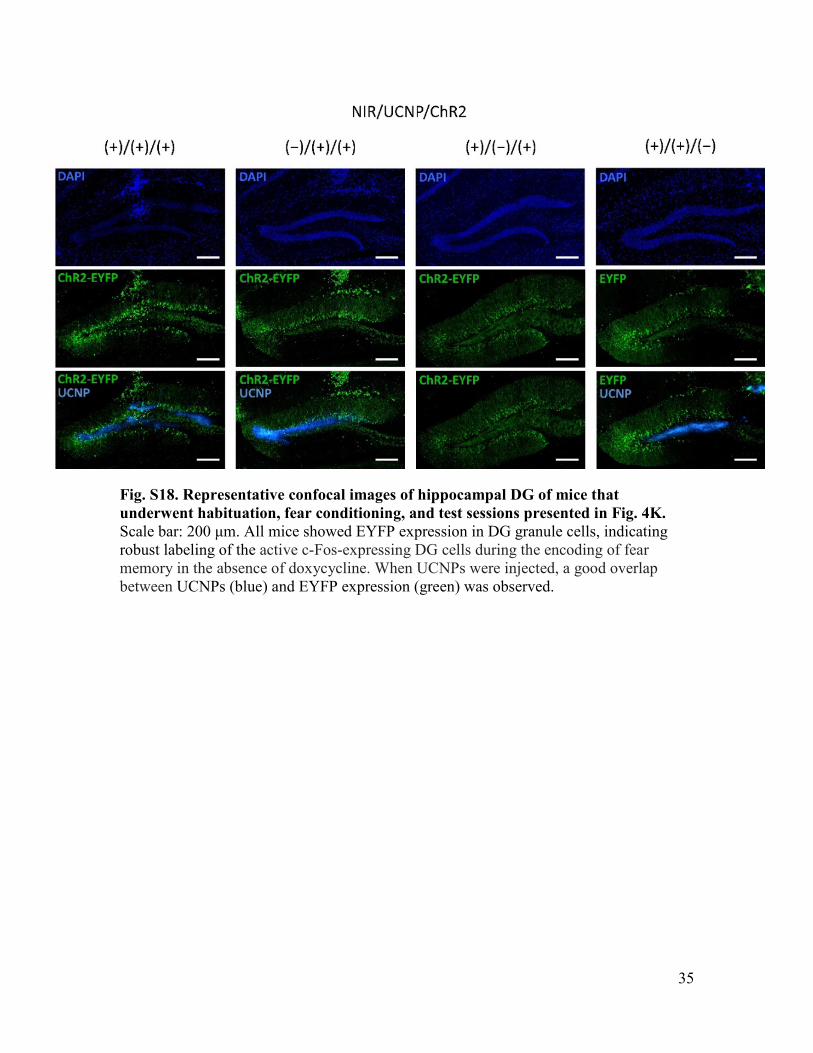
Fig. S18. Representative confocal images of hippocampal DG of mice that underwent habituation, fear conditioning, and test sessions presented in Fig. 4K. Scale bar: 200 μm. All mice showed EYFP expression in DG granule cells, indicating robust labeling of the active c-Fos-expressing DG cells during the encoding of fear memory in the absence of doxycycline. When UCNPs were injected, a good overlap between UCNPs (blue) and EYFP expression (green) was observed.

36
Table S1. Antibodies used in this study.
Primary Antibody Secondary Antibody
Rabbit anti-c-Fos (1:1000, SYSY) Donkey anti-rabbit, Alexa Fluor 594 (1:500, Life Technologies)
Rabbit anti-GFAP (1:1000, abcam) Donkey anti-rabbit, Alexa Fluor 594 (1:500, Life Technologies)
Rabbit anti-Iba1 (1:2000, Wako) Donkey anti-rabbit, Alexa Fluor 594 (1:500, Life Technologies)
Rabbit anti-Cleaved Caspase 3
(1:1000, Cell Signaling) Donkey anti-rabbit, Alexa Fluor 594 (1:500, Life Technologies)

37
Table S2. Brain tissue heating under different conditions of transcranial NIR delivery in this study.
Peak Power
(W) Pulse Length
(ms) Frequency
(Hz) Duration Location Max. Temp. (Temp. Increase) (°C)
3.0 15 20 3 s VTA 30.5 (0.3)
Brain Surface 43.3 (17.4)
0.75 3 10 120 min Hippocampus 30.9 (2.1)
Brain Surface 31.1 (2.9)
0.25 15 20 3 min Hippocampus 34.7 (5.4)
Brain Surface 38.6 (10.4)
3.0 15 10 10 s Medial Septum 31.9 (2.6)
Brain Surface 36.3 (10.0)

38
References and Notes 1. A. M. Lozano, N. Lipsman, Probing and regulating dysfunctional circuits using deep brain
stimulation. Neuron 77, 406–424 (2013). doi:10.1016/j.neuron.2013.01.020 Medline
2. E. Dayan, N. Censor, E. R. Buch, M. Sandrini, L. G. Cohen, Noninvasive brain stimulation: From physiology to network dynamics and back. Nat. Neurosci. 16, 838–844 (2013). doi:10.1038/nn.3422 Medline
3. N. Grossman, D. Bono, N. Dedic, S. B. Kodandaramaiah, A. Rudenko, H.-J. Suk, A. M. Cassara, E. Neufeld, N. Kuster, L.-H. Tsai, A. Pascual-Leone, E. S. Boyden, Noninvasive deep brain stimulation via temporally interfering electric fields. Cell 169, 1029–1041.e16 (2017). doi:10.1016/j.cell.2017.05.024 Medline
4. R. Chen, G. Romero, M. G. Christiansen, A. Mohr, P. Anikeeva, Wireless magnetothermal deep brain stimulation. Science 347, 1477–1480 (2015). doi:10.1126/science.1261821 Medline
5. S. A. Stanley, L. Kelly, K. N. Latcha, S. F. Schmidt, X. Yu, A. R. Nectow, J. Sauer, J. P. Dyke, J. S. Dordick, J. M. Friedman, Bidirectional electromagnetic control of the hypothalamus regulates feeding and metabolism. Nature 531, 647–650 (2016). doi:10.1038/nature17183 Medline
6. W. Legon, T. F. Sato, A. Opitz, J. Mueller, A. Barbour, A. Williams, W. J. Tyler, Transcranial focused ultrasound modulates the activity of primary somatosensory cortex in humans. Nat. Neurosci. 17, 322–329 (2014). doi:10.1038/nn.3620 Medline
7. R. Airan, Neuromodulation with nanoparticles. Science 357, 465 (2017). doi:10.1126/science.aao1200 Medline
8. M. R. Hamblin, Shining light on the head: Photobiomodulation for brain disorders. BBA Clin. 6, 113–124 (2016). doi:10.1016/j.bbacli.2016.09.002 Medline
9. L. Fenno, O. Yizhar, K. Deisseroth, The development and application of optogenetics. Annu. Rev. Neurosci. 34, 389–412 (2011). doi:10.1146/annurev-neuro-061010-113817 Medline
10. J. Y. Lin, P. M. Knutsen, A. Muller, D. Kleinfeld, R. Y. Tsien, ReaChR: A red-shifted variant of channelrhodopsin enables deep transcranial optogenetic excitation. Nat. Neurosci. 16, 1499–1508 (2013). doi:10.1038/nn.3502 Medline
11. F. Zhang, M. Prigge, F. Beyrière, S. P. Tsunoda, J. Mattis, O. Yizhar, P. Hegemann, K. Deisseroth, Red-shifted optogenetic excitation: A tool for fast neural control derived from Volvox carteri. Nat. Neurosci. 11, 631–633 (2008). doi:10.1038/nn.2120 Medline
12. O. Yizhar, L. E. Fenno, M. Prigge, F. Schneider, T. J. Davidson, D. J. O’Shea, V. S. Sohal, I. Goshen, J. Finkelstein, J. T. Paz, K. Stehfest, R. Fudim, C. Ramakrishnan, J. R. Huguenard, P. Hegemann, K. Deisseroth, Neocortical excitation/inhibition balance in information processing and social dysfunction. Nature 477, 171–178 (2011). doi:10.1038/nature10360 Medline
13. A. S. Chuong, M. L. Miri, V. Busskamp, G. A. C. Matthews, L. C. Acker, A. T. Sørensen, A. Young, N. C. Klapoetke, M. A. Henninger, S. B. Kodandaramaiah, M. Ogawa, S. B. Ramanlal, R. C. Bandler, B. D. Allen, C. R. Forest, B. Y. Chow, X. Han, Y. Lin, K. M.

39
Tye, B. Roska, J. A. Cardin, E. S. Boyden, Noninvasive optical inhibition with a red-shifted microbial rhodopsin. Nat. Neurosci. 17, 1123–1129 (2014). doi:10.1038/nn.3752 Medline
14. N. C. Klapoetke, Y. Murata, S. S. Kim, S. R. Pulver, A. Birdsey-Benson, Y. K. Cho, T. K. Morimoto, A. S. Chuong, E. J. Carpenter, Z. Tian, J. Wang, Y. Xie, Z. Yan, Y. Zhang, B. Y. Chow, B. Surek, M. Melkonian, V. Jayaraman, M. Constantine-Paton, G. K.-S. Wong, E. S. Boyden, Independent optical excitation of distinct neural populations. Nat. Methods 11, 338–346 (2014). doi:10.1038/nmeth.2836 Medline
15. P. Rajasethupathy, S. Sankaran, J. H. Marshel, C. K. Kim, E. Ferenczi, S. Y. Lee, A. Berndt, C. Ramakrishnan, A. Jaffe, M. Lo, C. Liston, K. Deisseroth, Projections from neocortex mediate top-down control of memory retrieval. Nature 526, 653–659 (2015). doi:10.1038/nature15389 Medline
16. R. Prakash, O. Yizhar, B. Grewe, C. Ramakrishnan, N. Wang, I. Goshen, A. M. Packer, D. S. Peterka, R. Yuste, M. J. Schnitzer, K. Deisseroth, Two-photon optogenetic toolbox for fast inhibition, excitation and bistable modulation. Nat. Methods 9, 1171–1179 (2012). doi:10.1038/nmeth.2215 Medline
17. G. Chen, H. Qiu, P. N. Prasad, X. Chen, Upconversion nanoparticles: Design, nanochemistry, and applications in theranostics. Chem. Rev. 114, 5161–5214 (2014). doi:10.1021/cr400425h Medline
18. B. Zhou, B. Shi, D. Jin, X. Liu, Controlling upconversion nanocrystals for emerging applications. Nat. Nanotechnol. 10, 924–936 (2015). doi:10.1038/nnano.2015.251 Medline
19. K. A. Deisseroth, P. Anikeeva, Upconversion of light for use in optogenetic methods. United States Patent PCT/US2011/059287 (2011).
20. S. Hososhima, H. Yuasa, T. Ishizuka, M. R. Hoque, T. Yamashita, A. Yamanaka, E. Sugano, H. Tomita, H. Yawo, Near-infrared (NIR) up-conversion optogenetics. Sci. Rep. 5, 16533 (2015). doi:10.1038/srep16533 Medline
21. S. Shah, J.-J. Liu, N. Pasquale, J. Lai, H. McGowan, Z. P. Pang, K.-B. Lee, Hybrid upconversion nanomaterials for optogenetic neuronal control. Nanoscale 7, 16571–16577 (2015). doi:10.1039/C5NR03411F Medline
22. X. Wu, Y. Zhang, K. Takle, O. Bilsel, Z. Li, H. Lee, Z. Zhang, D. Li, W. Fan, C. Duan, E. M. Chan, C. Lois, Y. Xiang, G. Han, Dye-sensitized core/active shell upconversion nanoparticles for optogenetics and bioimaging applications. ACS Nano 10, 1060–1066 (2016). doi:10.1021/acsnano.5b06383 Medline
23. A. Bansal, H. Liu, M. K. Jayakumar, S. Andersson-Engels, Y. Zhang, Quasi-continuous wave near-infrared excitation of upconversion nanoparticles for optogenetic manipulation of C. elegans. Small 12, 1732–1743 (2016). doi:10.1002/smll.201503792 Medline
24. X. Ai, L. Lyu, Y. Zhang, Y. Tang, J. Mu, F. Liu, Y. Zhou, Z. Zuo, G. Liu, B. Xing, Remote regulation of membrane channel activity by site-specific localization of lanthanide-doped upconversion nanocrystals. Angew. Chem. Int. Ed. Engl. 56, 3031–3035 (2017). doi:10.1002/anie.201612142 Medline

40
25. T. Vo-Dinh, Ed., Biomedical Photonics Handbook (CRC Press, Boca Raton, FL, 2003).
26. L. A. Gunaydin, L. Grosenick, J. C. Finkelstein, I. V. Kauvar, L. E. Fenno, A. Adhikari, S. Lammel, J. J. Mirzabekov, R. D. Airan, K. A. Zalocusky, K. M. Tye, P. Anikeeva, R. C. Malenka, K. Deisseroth, Natural neural projection dynamics underlying social behavior. Cell 157, 1535–1551 (2014). doi:10.1016/j.cell.2014.05.017 Medline
27. A. Bozkurt, B. Onaral, Safety assessment of near infrared light emitting diodes for diffuse optical measurements. Biomed. Eng. Online 3, 9 (2004). doi:10.1186/1475-925X-3-9 Medline
28. T. A. Henderson, L. D. Morries, Near-infrared photonic energy penetration: Can infrared phototherapy effectively reach the human brain? Neuropsychiatr. Dis. Treat. 11, 2191–2208 (2015). doi:10.2147/NDT.S78182 Medline
29. J. N. Liu, W. B. Bu, J. L. Shi, Silica coated upconversion nanoparticles: A versatile platform for the development of efficient theranostics. Acc. Chem. Res. 48, 1797–1805 (2015). doi:10.1021/acs.accounts.5b00078 Medline
30. E. S. Boyden, F. Zhang, E. Bamberg, G. Nagel, K. Deisseroth, Millisecond-timescale, genetically targeted optical control of neural activity. Nat. Neurosci. 8, 1263–1268 (2005). doi:10.1038/nn1525 Medline
31. M. J. Wanat, I. Willuhn, J. J. Clark, P. E. Phillips, Phasic dopamine release in appetitive behaviors and drug addiction. Curr. Drug Abuse Rev. 2, 195–213 (2009). doi:10.2174/1874473710902020195 Medline
32. R. Boyce, S. D. Glasgow, S. Williams, A. Adamantidis, Causal evidence for the role of REM sleep theta rhythm in contextual memory consolidation. Science 352, 812–816 (2016). doi:10.1126/science.aad5252 Medline
33. L. L. Colgin, Mechanisms and functions of theta rhythms. Annu. Rev. Neurosci. 36, 295–312 (2013). doi:10.1146/annurev-neuro-062012-170330 Medline
34. X. Liu, S. Ramirez, P. T. Pang, C. B. Puryear, A. Govindarajan, K. Deisseroth, S. Tonegawa, Optogenetic stimulation of a hippocampal engram activates fear memory recall. Nature 484, 381–385 (2012). Medline
35. D. Ni, J. Zhang, W. Bu, H. Xing, F. Han, Q. Xiao, Z. Yao, F. Chen, Q. He, J. Liu, S. Zhang, W. Fan, L. Zhou, W. Peng, J. Shi, Dual-targeting upconversion nanoprobes across the blood-brain barrier for magnetic resonance/fluorescence imaging of intracranial glioblastoma. ACS Nano 8, 1231–1242 (2014). doi:10.1021/nn406197c Medline
36. J. H. Zeng, J. Su, Z. H. Li, R. X. Yan, Y. D. Li, Synthesis and upconversion luminescence of hexagonal-phase NaYF4: Yb, Er3+, phosphors of controlled size and morphology. Adv. Mater. 17, 2119–2123 (2005). doi:10.1002/adma.200402046
37. J. Lindeberg, D. Usoskin, H. Bengtsson, A. Gustafsson, A. Kylberg, S. Söderström, T. Ebendal, Transgenic expression of Cre recombinase from the tyrosine hydroxylase locus. Genesis 40, 67–73 (2004). doi:10.1002/gene.20065 Medline
38. H. Zeng, S. Chattarji, M. Barbarosie, L. Rondi-Reig, B. D. Philpot, T. Miyakawa, M. F. Bear, S. Tonegawa, Forebrain-specific calcineurin knockout selectively impairs bidirectional synaptic plasticity and working/episodic-like memory. Cell 107, 617–629

41
(2001). doi:10.1016/S0092-8674(01)00585-2 Medline
39. S. Hippenmeyer, E. Vrieseling, M. Sigrist, T. Portmann, C. Laengle, D. R. Ladle, S. Arber, A developmental switch in the response of DRG neurons to ETS transcription factor signaling. PLOS Biol. 3, e159 (2005). doi:10.1371/journal.pbio.0030159 Medline
40. L. G. Reijmers, B. L. Perkins, N. Matsuo, M. Mayford, Localization of a stable neural correlate of associative memory. Science 317, 1230–1233 (2007). doi:10.1126/science.1143839 Medline
41. C. Torrence, G. P. Compo, A practical guide to wavelet analysis. Bull. Am. Meteorol. Soc. 79, 61–78 (1998). doi:10.1175/1520-0477(1998)079<0061:APGTWA>2.0.CO;2
42. J. R. Lepock, Cellular effects of hyperthermia: Relevance to the minimum dose for thermal damage. Int. J. Hyperthermia 19, 252–266 (2003). doi:10.1080/0265673031000065042 Medline
43. M. G. White, M. Emery, D. Nonner, J. N. Barrett, Caspase activation contributes to delayed death of heat-stressed striatal neurons. J. Neurochem. 87, 958–968 (2003). doi:10.1046/j.1471-4159.2003.02077.x Medline
44. A. M. Aravanis, L.-P. Wang, F. Zhang, L. A. Meltzer, M. Z. Mogri, M. B. Schneider, K. Deisseroth, An optical neural interface: In vivo control of rodent motor cortex with integrated fiberoptic and optogenetic technology. J. Neural Eng. 4, S143–S156 (2007). doi:10.1088/1741-2560/4/3/S02 Medline
45. O. Yizhar, L. E. Fenno, T. J. Davidson, M. Mogri, K. Deisseroth, Optogenetics in neural systems. Neuron 71, 9–34 (2011). doi:10.1016/j.neuron.2011.06.004 Medline
46. L. Shi, L. A. Sordillo, A. Rodríguez-Contreras, R. Alfano, Transmission in near-infrared optical windows for deep brain imaging. J. Biophotonics 9, 38–43 (2016). doi:10.1002/jbio.201500192 Medline