supplementary material for -...
TRANSCRIPT

www.sciencemag.org/content/349/6251/aac4716/suppl/DC1
Supplementary Material for
Estimating the reproducibility of psychological science
Open Science Collaboration*
*Corresponding author. E-mail: [email protected]
Published 28 August 2015, Science 349, aac4716 (2015) DOI: 10.1126/science.aac4716
This PDF file includes:
Materials and Methods Figs. S1 to S7 Tables S1 to S4

Reproducibility Project 1
Supplemental Information for
Estimating the Reproducibility of Psychological Science
Open Science Collaboration
Table of Contents
1. Method a. Replication Teams b. Replication Protocol
2. Measures and Moderators a. Characteristics of Original Study b. Characteristics of Replication
3. Guide to the Information Commons 4. Results
a. Preliminary Analyses b. Evaluating replication against null hypothesis c. Evaluating replication against original effect size d. Comparing original and replication effect sizes e. Combining original and replication effect sizes for cumulative evidence f. Subjective assessment: Did it replicate? g. Meta-analysis of all original study effect, and of all replication study effects h. Meta-analysis of difference of effect size between original and replication study i. Moderator analyses

Reproducibility Project 2
Method
Two articles have been published on the methodology of the Reproducibility Project: Psychology.
1. Open Science Collaboration, An open, large-scale, collaborative effort to estimate the reproducibility of psychological science. Perspect. Psychol. Sci.7, 657-660 (2012).
2. Open Science Collaboration, The Reproducibility Project: A Model of Large-Scale Collaboration for Empirical Research on Reproducibility. In Implementing Reproducible Computational Research (A Volume in The R Series), V. Stodden, F. Leisch, R. Peng, Eds. (Taylor & Francis, New York, 2014) pp. 299-323.
The first introduced the project aims and basic design. The second provided detail on the methodology and mechanisms for maintaining standards and quality control. The methods sections in the main text and below summarize the key aspects of the methodology and provide additional information, particularly concerning the latter stages of the project that were not addressed in the prior articles. Replication Teams RPP was introduced publicly as a crowdsourcing research project in November 2011. Interested researchers were invited to get involved to design the project, conduct a replication, or provide other kinds of research support such as coding articles. A total of 270 individuals contributed sufficiently to earn co-authorship on this report.
Of the 100 replications completed, 85 unique senior members were identified—several of whom led multiple replications. Among those senior members, 72 had a PhD or equivalent, 9 had a master’s degree or equivalent, 1 had some graduate school, and 3 had or were near completing a bachelor’s degree or equivalent. By occupation, 62 were faculty members or equivalent, 8 were post-docs, 13 were graduate students, 1 was an undergraduate student, and 1 was a private sector researcher. By domain, 36 identified social psychology as their primary domain, 22 identified cognitive psychology, 6 identified quantitative psychology, and 21 identified other domains. Replication Protocol Sloppy or underpowered replication attempts would provide uninteresting reasons for irreproducibility. Replication teams followed an extensive protocol to maximize quality, clarity, and standardization of the replications. Full documentation of the protocol is available at https://osf.io/ru689/. Power analysis. After identifying the key effect, power analyses estimated the sample sizes needed to achieve 80%, 90%, and 95% power to detect the originally reported effect size. Teams were required to propose a study design that would achieve at least 80% power and were encouraged to obtain higher power if feasible to do so. All protocols proposed 80% power

Reproducibility Project 3
or greater, however, after corrections to power analyses, three fell short in their planning, with 56%, 69%, and 76% power. On average, 92% power was proposed (median = 95%). Three replication teams were unable to conduct power analyses based on available data—their method for planning sample size is detailed in their replication reports. Following data collection, 90 of the 97 achieved 80% or greater power to detect the original effect size. Post-hoc calculations showed an average of 92% power to detect an effect size equivalent to the original studies’. The median power was 95% and 57 had 95% power or better. Note that these power estimates do not account for the possibility that the published effect sizes are overestimated because of publication biases. Indeed, this is one of the potential challenges for reproducibility. Obtaining or creating materials. Project coordinators or replication teams contacted original authors for study materials in order to maximize the consistency between the original and replication effort. Of the completed replications, 89 were able to obtain some or all of the original materials. In 8 cases, the original materials were not available, and in only 3 cases the original authors did not share materials or provide information about where the materials could be obtained. Replication teams prepared materials, adapting or creating them for the particular data collection context. If information available from the original report or author contacts was insufficient, teams noted deviations or inferences in their written protocols.
Writing study protocols. The protocols included a brief introduction explaining the main idea of the study, the key finding for replication, and any other essential information about the study. Then, they had a complete methods section describing the power analysis, sampling plan, procedure, materials, and analysis plan. Analysis plans included details of data exclusion rules, data cleaning, inclusion of covariates in the model, and the inferential test/model that would be used. Finally, the protocol listed known differences from the original study in sampling, setting, procedure, and analysis plan. The objective was to minimize differences that are expected to alter the effect, but report transparently about them to provide a means of identifying possible reasons for variation in observed effects, and to identify factors for establishing generalizability of the results when similar effects are obtained. All replication teams completed a study protocol in advance of data collection.
Replication teams were encouraged to apply for funding for the replication to the Center for Open Science (http://cos.io/). A grants committee comprised of members of the collaboration reviewed study protocols made award recommendations.
Reviewing study protocols. The written protocols were shared with original authors for critique prior to initiating data collection. Also, protocols were reviewed by another member of the RPP team for quality assurance and consistency with the reporting template. Feedback from the original authors was incorporated into the study design. If the replication team could not address the feedback, the original author comments were included in the protocol so that readers could identify the a priori comments by original authors about the design. Replication teams recorded whether the original authors endorsed the design (69 replications), maintained concerns based on informed judgment/speculation (8 replications), maintained concerns based on published empirical evidence for constraints on the effect (3 replications), or did not respond (18 replications). Two replications did not seek and receive feedback prior to data collection.
Uploading the study protocol. Once finalized, the protocol and shareable materials were posted publicly on the Open Science Framework (OSF; https://osf.io/ezcuj/) following a standard format. If the original author requested to keep materials private, replication teams

Reproducibility Project 4
noted this and indicated how to contact the original author to obtain the materials. After upload, the replication team could begin data collection.
Reporting. Following data collection, teams initiated report writing and data sharing. If there were any deviations from the registered protocol, teams noted those in the final report. Also, teams posted anonymized datasets and a codebook to the OSF project page. Teams conducted the planned data analysis from the protocol as a confirmatory analysis. Following completion of the confirmatory analysis phase, teams were encouraged to conduct follow-up exploratory analysis if they wished and report both—clearly distinguished—in their final report. After writing the results section of the final report, teams added discussion with open-ended commentary about insights gained from exploratory analysis, an overall assessment of the outcome of the replication attempt, and discussion of any objections or challenges raised by the original authors’ review of the protocol. At least one other RPP member then conducted a review of the final report to maximize consistency in reporting format, identify errors, and improve clarity. Following review, replication teams shared their report directly with the original authors and publicly on the OSF project page. If additional issues came up following posting of the report, teams could post a revision of the report. The OSF offers version control so all prior versions of posted reports can be retrieved in order to promote transparent review of edits and improvements.
Measures and Moderators
Characteristics of Original Study
Original study effect size, p-value, and sample size. Qualities of the original
statistical evidence may predict reproducibility. All else being equal, results with larger effect sizes and smaller p-values ought to be more reproducible than others. Also, larger sample sizes are a factor for increasing the precision of estimating effects; all else being equal, larger sample sizes should be associated with more reproducible results. A qualification of this expectation is that some study designs use very few participants and gain substantial power via repeated measurements.
Importance of the result. Some effects are more important than others. This variable was the aggregate of the citation impact of the original article and coder ratings of the extent to which the article was exciting and important. Effect importance could be a positive predictor of reproducibility because findings that have a strong impact on the field do so, in part, because they are reproducible and spur additional innovation. If they were not reproducible, then they may not have a strong impact on the field. On the other hand, exciting or important results are appealing because they advance an area of research, but they may be less reproducible than mundane results because true advances are difficult and infrequent, and theories and methodologies employed at the fringe of knowledge are often less refined or validated making them more difficult to reproduce.
Citation impact of original article. Project coordinators used Google Scholar data to calculate the citation impact of the original article at the time of conducting the project analysis (March 2015).

Reproducibility Project 5
Exciting/important effect. Coders independent from the replication teams reviewed the methodology for the replication studies and answered the following prompt: “To what extent is the key effect an exciting and important outcome?” To answer this question, coders read the pre-data collection reports that the replication teams had created. These reports included a background on the topic, a description of the effect, a procedure, and analysis plan. Responses were provided on a scale from 1 = Not at all exciting and important, 2 = Slightly exciting and important, 3 = Somewhat exciting and important, 4 = Moderately exciting and important, 5 = Very exciting and important, 6 = Extremely exciting and important. One-hundred twenty nine coders were presented effect reports and these questions for 112 studies (100 replications reported in the main text + others for which data collection was in progress) in a random order, and coders rated as many as they wished. Each effect was rated an average of 4.52 times (median = 4). Ratings were averaged across coders.
Surprising result. Counterintuitive results are appealing because they violate one’s priors, but they may be less reproducible if priors are reasonably well-tuned to reality. The same coders that rated the extent to which the effect was exciting/important reviewed the methodology for the replication studies and answered the following prompt: “To what extent is the key effect a surprising or counterintuitive outcome?” Responses were provided on a scale from 1 = Not at all surprising, 2 = Slightly surprising, 3 = Somewhat surprising, 4 = Moderately surprising, 5 = Very surprising, 6 = Extremely surprising.
Experience and expertise of original team. Higher quality teams may produce more reproducible results. Quality is multi-faceted and difficult to measure. In the present study, after standardizing we averaged four indicators of quality - the rated prestige of home institutions of the 1st and senior authors, and the citation impact of the 1st and senior authors. Other means of assessing quality could reveal results quite distinct from those obtained by these indicators.
Institution prestige of 1st author and senior author. Authors were coded as being 1st and most senior; their corresponding institutions were also recorded. The resulting list was presented to two samples (Mechanical Turk participants n = 108; Project team members n = 70) to rate institution prestige on a scale from 7 = never heard of this institution, 6 = not at all prestigious, 5 = slightly prestigious, 4 = moderately prestigious, 3 = very prestigious, 2 = extremely prestigious, 1 = one of the few most prestigious. MTurk participants rated institution prestige in general. Project team members were randomly assigned to rate institution prestige in psychology (n = 33) or in general (n = 37). Correlations of prestige ratings among the three samples were very high (r’s range .849 to .938). As such, before standardizing, we averaged the three ratings for a composite institution prestige score.
Citation impact of 1st author and senior author. Project members used Google Scholar data to estimate the citation impact of first authors and senior authors. These indicators identified citation impact at the time of writing this report, not at the time the original research was conducted.
Characteristics of Replication
Replication power and sample size. All else equal, lower power and smaller sample tests ought to be less likely to reproduce results than higher power and larger sample tests.

Reproducibility Project 6
The caveat above on sample size for original studies is the same as for replication studies. Replications were required to achieve at least 80% power based on the effect size of the original study. This narrows the range of actual power in replication tests to maximize likelihood of obtaining effects, but nonetheless offers a range that could be predictive of reproducibility. A qualification of this expectation is that power estimates are based on original effects. If publication bias or other biases produce exaggerated effect sizes in the original studies, then the power estimates would be less likely to provide predictive power for reproducibility.
Challenge of conducting replication. Reproducibility depends on effective implementation and execution of the research methodology. However, some methodologies are more challenging or prone to error and bias than others. As a consequence, variation in the challenges of conducting replications may be a predictor of reproducibility. This indicator includes coders’ assessments of expertise required, opportunity for experimenter expectations to influence outcomes, and opportunity for lack of diligence to influence outcomes. Of course these issues apply to conducting the original study and interpreting its results, but we treated these as characteristics of the replication for the present purposes.
For these variables, a small group of coders were trained on evaluating original reports and a single coder evaluated each study.
Perceived expertise required. Reproducibility might be lower for study designs that require specialized expertise. Coders independent from the replication teams reviewed the methodology for the replication studies and answered the following prompt: “To what extent does the methodology of the study require specialized expertise to conduct effectively? [Note: This refers to data collection, not data analysis]” Responses were provided on a scale from 1 = no expertise required, 2 = slight expertise required, 3 = moderate expertise required, 4 = strong expertise required, 5 = extreme expertise required.
Perceived opportunity for expectancy biases. The expectations of the experimenter can influence study outcomes (38). Study designs that provide opportunity for researchers’ beliefs to influence data collection may be more prone to reproducibility challenges than study designs that avoid opportunity for influence. Coders independent from the replication teams reviewed the methodology for the replication studies and answered the following prompt: “To what extent does the methodology of the study provide opportunity for the researchers’ expectations about the effect to influence the results? (i.e., researchers belief that the effect will occur could elicit the effect, or researchers belief that the effect will not occur could eliminate the effect) [Note: This refers to data collection, not data analysis].” Responses were provided on a scale from 1 = No opportunity for researcher expectations to influence results, 2 = Slight opportunity for researcher expectations to influence results, 3 = Moderate opportunity for researcher expectations to influence results, 4 = Strong opportunity for researcher expectations to influence results, 5 = Extreme opportunity for researcher expectations to influence results.
Perceived opportunity for impact of lack of diligence. Studies may be less likely to be reproducible if they are highly reliant on experimenters’ diligence to conduct the procedures effectively. Coders independent from the replication teams reviewed the methodology for the replication studies and answered the following prompt: “To what extent could the results be affected by lack of diligence by experimenters in collecting the data? [Note: This refers to data collection, not creating the materials].” Responses were provided on a scale from 1 = No opportunity for lack of diligence to affect the results, 2 = Slight opportunity for lack of diligence to

Reproducibility Project 7
affect the results, 3 = Moderate opportunity for lack of diligence to affect the results, 4 = Strong opportunity for lack of diligence to affect the results, 5 = Extreme opportunity for lack of diligence to affect the results.
Experience and expertise of replication team. Just as experience and expertise may be necessary to obtain reproducible results, expertise and experience may be important for conducting effective replications. We focused on the senior member of the replication team and created an aggregate by standardizing and averaging scores on 7 characteristics: position (undergraduate to professor), highest degree (high school to PhD or equivalent), self-rated domain expertise, self-rated method expertise, total number of publications, total number of peer-reviewed empirical articles, and citation impact.
Position of senior member of replication team. Reproducibility may be enhanced by having more seasoned researchers guiding the research process. Replication teams reported the position of the senior member of the team from: 7 = Professor (or equivalent), 6 = Associate Professor (or equivalent), 5 = Assistant Professor (or equivalent), 4 = Post-doc, Research Scientist, or Private Sector Researcher, 3 = Ph.D. student, 2 = Master’s student, 1 = Undergraduate student, or other.
Highest degree of replication team’s senior member. Replication teams reported the highest degree obtained by the senior member of the team from 4 = PhD/equivalent, 3 = Master’s/equivalent, 2 = some graduate school, 1 = Bachelor’s/equivalent.
Replication team domain expertise. Reproducibility may be stronger if the replication team is led by a person with high domain expertise in the topic of study. Replication teams self-rated the domain expertise of the senior member of the project on the following scale: 1 = No expertise - No formal training or experience in the topic area, 2 = Slight expertise - Researchers exposed to the topic area (e.g., took a class), but without direct experience researching it, 3 = Some expertise - Researchers who have done research in the topic area, but have not published in it, 4 = Moderate expertise - Researchers who have previously published in the topic area of the selected effect, and do so irregularly, 5 = High expertise - Researchers who have previously published in the topic area of the selected effect, and do so regularly.
Replication team method expertise. Reproducibility may be stronger if the replication team is led by a person with high expertise in the methodology used for the study. Replication teams self-rated the domain expertise of the senior member of the project on the following scale: 1 = No expertise - No formal training or experience with the methodology, 2 = Slight expertise - Researchers exposed to the methodology, but without direct experience using it, 3 = Some expertise - Researchers who have used the methodology in their research, but have not published with it, 4 = Moderate expertise - Researchers who have previously published using the methodology of the selected effect, and use the methodology irregularly, 5 = High expertise - Researchers who have previously published using the methodology of the selected effect, and use the methodology regularly.
Replication team senior member's total publications and total number of peer-reviewed articles. All else being equal, more seasoned researchers may be better prepared to reproduce research results than more novice researchers. Replication teams self-reported the total number of publications and total number of peer-reviewed articles by the senior member of the team.

Reproducibility Project 8
Institution prestige of replication 1st author and senior author. We followed the same methodology for computing institution prestige for replication teams as we did for original author teams.
Citation impact of replication 1st author and senior author. Researchers who have conducted more research that has impacted other research via citation may have done so because of additional expertise and effectiveness in conducting reproducible research. Project members calculated the total citations of the 1st author and most senior member of the team via Google Scholar.
Self-assessed quality of replication. Lower quality replications may produce results less similar to original effects than higher quality replications. Replication teams are in the best position to know the quality of project execution, but are also likely to be ego invested in reporting high quality. Nonetheless, variation in self-assessed quality across teams may provide a useful indicator of quality. Also, some of our measures encouraged variation in quality reports by contrasting directly with the original study, or studies in general. After standardizing, we created an aggregate score by averaging four variables: self-assessed quality of implementation, self-assessed quality of data collection, self-assessed similarity to original, and self-assessed difficulty of implementation. Future research may assess additional quality indicators from the public disclosure of methods to complement this assessment.
Self-assessed implementation quality of replication. Sloppy replications may be less likely to reproduce original results because of error and inattention. Replication teams self-assessed the quality of the replication study methodology and procedure design in comparison to the original research by answering the following prompt: “To what extent do you think that the replication study materials and procedure were designed and implemented effectively? Implementation of the replication materials and procedure…” Responses were provided on a scale from 1 = was of much higher quality than the original study, 2 = was of moderately higher quality than the original study, 3 = was of slightly higher quality than the original study, 4 = was about the same quality as the original study, 5 = was of slightly lower quality than the original study, 6 = was of moderately lower quality than the original study, 7 = was of much lower quality than the original study.
Self-assessed data collection quality of replication. Sloppy replications may be less likely to reproduce original results because of error and inattention. Replication teams self-assessed the quality of the replication study data collection in comparison to the average study by answering the following prompt: “To what extent do you think that the replication study data collection was completed effectively for studies of this type?” Responses were provided on a scale from 1 = Data collection quality was much better than the average study, 2 = Data collection quality was better than the average study, 3 = Data collection quality was slightly better than the average study, 4 = Data collection quality was about the same as the average study, 5 = Data collection quality was slightly worse than the average study, 6 = Data collection quality was worse than the average study, 7 = Data collection quality was much worse than the average study.
Self-assessed replication similarity to original. It can be difficult to reproduce the conditions and procedures of the original research for a variety of reasons. Studies that are more similar to the original research may be more reproducible than those that are more dissimilar. Replication teams self-evaluated the similarity of the replication with the original by

Reproducibility Project 9
answering the following prompt: “Overall, how much did the replication methodology resemble the original study?” Responses were provided on a scale from 1 = Not at all similar, 2 = Slightly similar, 3 = Somewhat similar, 4 = Moderately similar, 5 = Very similar, 6 = Extremely similar, 7 = Essentially identical.
Self-assessed difficulty of implementation. Another indicator of adherence to the original protocol is the replication team’s self-assessment of how challenging it was to conduct the replication. Replication teams responded to the following prompt: “How challenging was it to implement the replication study methodology?” Responses were provided on a scale from 1 = Extremely challenging, 2 = Very challenging, 3 = Moderately challenging, 4 = Somewhat challenging, 5 = Slightly challenging, 6 = Not at all challenging.
Other variables. Some additional variables were collected and appear in the tables not aggregated with other indicators, or are not reported at all in the main text. They are nonetheless available for additional analysis. Below are highlights and a comprehensive summary of additional variables is available in the Master Data File.
Replication team surprised by outcome of replication. The replication team rated the extent to which they were surprised by the results of their replication. Teams responded to the following prompt: “To what extent was the replication team surprised by the replication results?” Responses were provided on a scale from 1 = Results were exactly as anticipated, 2 = Results were slightly surprising, 3 = Results were somewhat surprising, 4 = Results were moderately surprising, 5 = Results were extremely surprising. Results are reported in Table S5. Across reproducibility criteria, there was a moderate relationship such that greater surprise with the outcome was associated with weaker reproducibility.
Effect similarity. In addition to the subjective “yes/no” assessment of replication in the main text, replication teams provided another rating of the extent to which the key effect in the replication was similar to the original result. Teams responded to the following prompt: “How much did the key effect in the replication resemble the key effect in the original study?” Responses were provided on a scale from: 7 = virtually identical (12), 6 = extremely similar (16), 5 = very similar (8), 4 = moderately similar (12), 3 = somewhat similar (14), 2 = slightly similar (9), 1 = not at all similar (28). Replication results of key effects were deemed between somewhat and moderately similar to the original results, M = 3.60, SD = 2.18.
Findings similarity. Replication teams assessed the extent to which the overall findings of the study, not just the key result, were similar to the original study findings. Teams responded to the following prompt: “Overall, how much did the findings in the replication resemble the findings in the original study?” Responses were provided on a scale from: 7 = virtually identical (5), 6 = extremely similar (13), 5 = very similar (21), 4 = moderately similar (20), 3 = somewhat similar (13), 2 = slightly similar (13), 1 = not at all similar (15). Replication results of overall findings were deemed between somewhat and moderately similar to the original results, M = 3.78, SD = 1.78.
Internal conceptual and direct replications. Original articles may have contained replications of the key effect in other studies. Coders evaluated whether other studies contained replications of the key result, and whether those replications were direct or conceptual. There were few of both (M = .91 for conceptual replications, M = .06 for direct replications).
Reproducibility Project 10
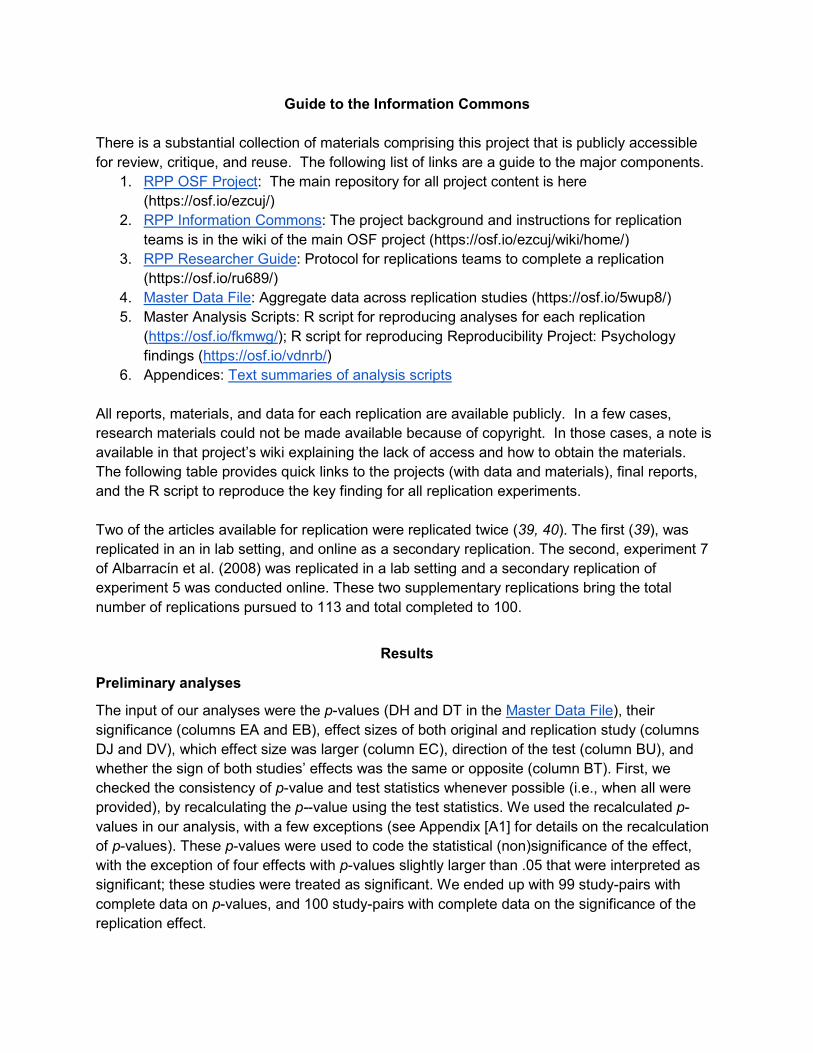
Guide to the Information Commons There is a substantial collection of materials comprising this project that is publicly accessible for review, critique, and reuse. The following list of links are a guide to the major components.
1. RPP OSF Project: The main repository for all project content is here (https://osf.io/ezcuj/)
2. RPP Information Commons: The project background and instructions for replication teams is in the wiki of the main OSF project (https://osf.io/ezcuj/wiki/home/)
3. RPP Researcher Guide: Protocol for replications teams to complete a replication (https://osf.io/ru689/)
4. Master Data File: Aggregate data across replication studies (https://osf.io/5wup8/) 5. Master Analysis Scripts: R script for reproducing analyses for each replication
(https://osf.io/fkmwg/); R script for reproducing Reproducibility Project: Psychology findings (https://osf.io/vdnrb/)
6. Appendices: Text summaries of analysis scripts All reports, materials, and data for each replication are available publicly. In a few cases, research materials could not be made available because of copyright. In those cases, a note is available in that project’s wiki explaining the lack of access and how to obtain the materials. The following table provides quick links to the projects (with data and materials), final reports, and the R script to reproduce the key finding for all replication experiments. Two of the articles available for replication were replicated twice (39, 40). The first (39), was replicated in an in lab setting, and online as a secondary replication. The second, experiment 7 of Albarracín et al. (2008) was replicated in a lab setting and a secondary replication of experiment 5 was conducted online. These two supplementary replications bring the total number of replications pursued to 113 and total completed to 100.
Results
Preliminary analyses
The input of our analyses were the p-values (DH and DT in the Master Data File), their significance (columns EA and EB), effect sizes of both original and replication study (columns DJ and DV), which effect size was larger (column EC), direction of the test (column BU), and whether the sign of both studies’ effects was the same or opposite (column BT). First, we checked the consistency of p-value and test statistics whenever possible (i.e., when all were provided), by recalculating the p--value using the test statistics. We used the recalculated p-values in our analysis, with a few exceptions (see Appendix [A1] for details on the recalculation of p-values). These p-values were used to code the statistical (non)significance of the effect, with the exception of four effects with p-values slightly larger than .05 that were interpreted as significant; these studies were treated as significant. We ended up with 99 study-pairs with complete data on p-values, and 100 study-pairs with complete data on the significance of the replication effect.
Reproducibility Project 11
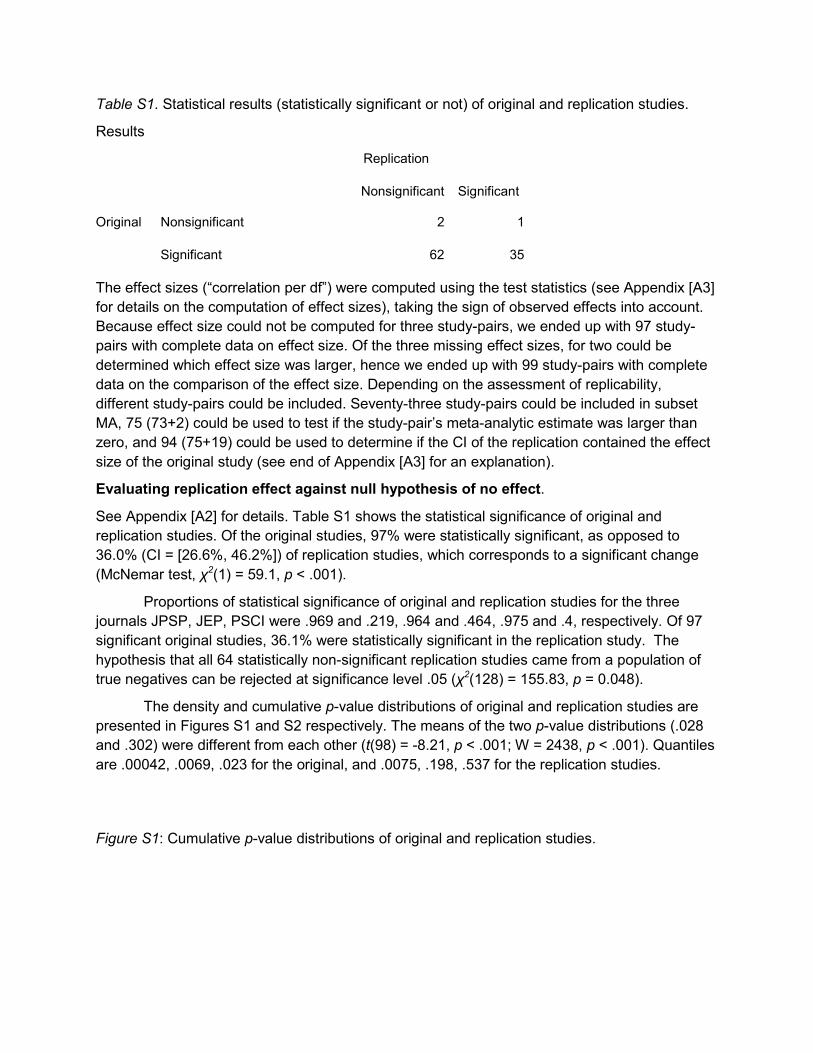
Table S1. Statistical results (statistically significant or not) of original and replication studies.
Results
Replication
Nonsignificant Significant
Original Nonsignificant 2 1
Significant 62 35
The effect sizes (“correlation per df”) were computed using the test statistics (see Appendix [A3] for details on the computation of effect sizes), taking the sign of observed effects into account. Because effect size could not be computed for three study-pairs, we ended up with 97 study-pairs with complete data on effect size. Of the three missing effect sizes, for two could be determined which effect size was larger, hence we ended up with 99 study-pairs with complete data on the comparison of the effect size. Depending on the assessment of replicability, different study-pairs could be included. Seventy-three study-pairs could be included in subset MA, 75 (73+2) could be used to test if the study-pair’s meta-analytic estimate was larger than zero, and 94 (75+19) could be used to determine if the CI of the replication contained the effect size of the original study (see end of Appendix [A3] for an explanation).
Evaluating replication effect against null hypothesis of no effect.
See Appendix [A2] for details. Table S1 shows the statistical significance of original and replication studies. Of the original studies, 97% were statistically significant, as opposed to 36.0% (CI = [26.6%, 46.2%]) of replication studies, which corresponds to a significant change (McNemar test, χ2(1) = 59.1, p < .001).
Proportions of statistical significance of original and replication studies for the three journals JPSP, JEP, PSCI were .969 and .219, .964 and .464, .975 and .4, respectively. Of 97 significant original studies, 36.1% were statistically significant in the replication study. The hypothesis that all 64 statistically non-significant replication studies came from a population of true negatives can be rejected at significance level .05 (χ2(128) = 155.83, p = 0.048).
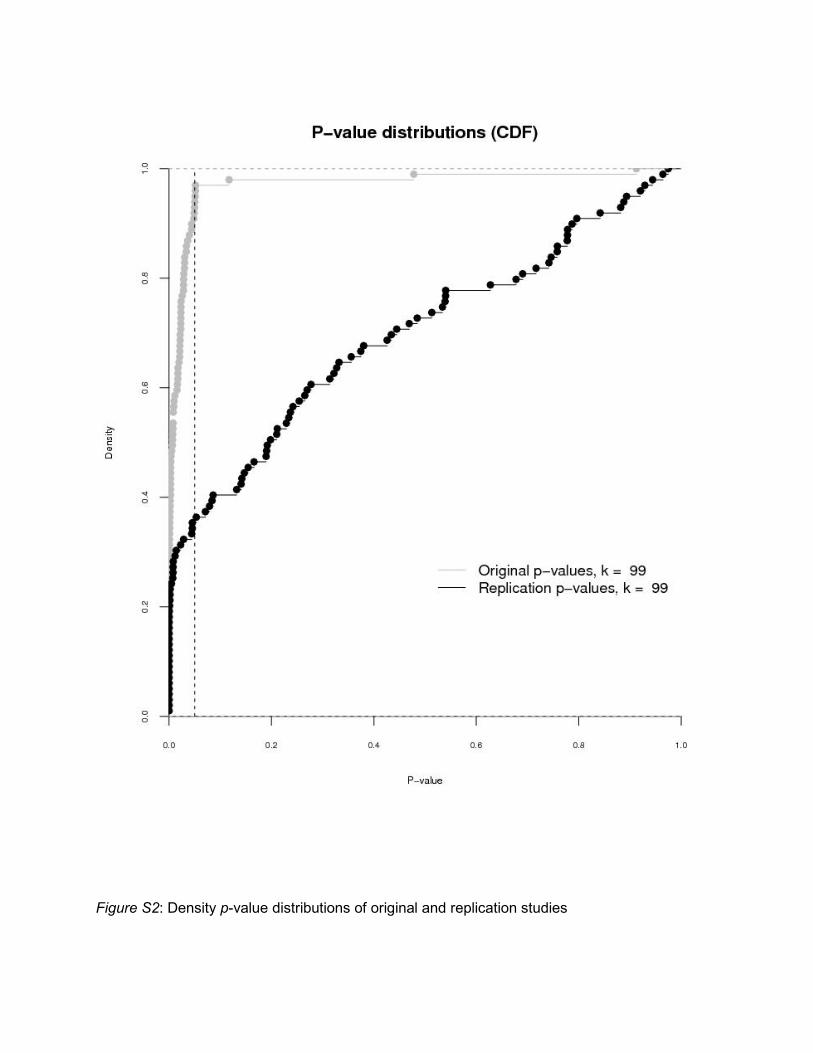
The density and cumulative p-value distributions of original and replication studies are presented in Figures S1 and S2 respectively. The means of the two p-value distributions (.028 and .302) were different from each other (t(98) = -8.21, p < .001; W = 2438, p < .001). Quantiles are .00042, .0069, .023 for the original, and .0075, .198, .537 for the replication studies.
Figure S1: Cumulative p-value distributions of original and replication studies.
Reproducibility Project 12
Figure S2: Density p-value distributions of original and replication studies

Reproducibility Project 13

Reproducibility Project 14
Comparing original and replication effect sizes.
See Appendix [A3] and Appendix [A6] for details. For 97 study pairs effect size correlations could be computed. Figure S3 (left) shows the distribution of effect sizes of original and replication studies, and the corresponding cumulative distribution functions (right). The mean effect sizes of both distributions (M = .403 [SD = .188]; M = .197 [SD = .257]) were different from each other (t(96) = 9.36, p < .001; W = 7137, p < .001). Of those 99 studies that reported an(y) effect size in both original and replication study, 82 reported a larger effect size in the original study (82.8%; p < .001, binomial test). Original and replication effect sizes were positively correlated (Spearman’s r = .51, p < .001). Figure S3: Distributions (left) and cumulative distribution functions of effect sizes of original and replication studies.
Evaluating replication effect against original effect size.
For the subset of 73 studies where the standard error of the correlation could be computed, it was expected that 78.5% of CIs of the replication study contained the effect size of the original study; however, only 41.1% (30 out of 73) of CIs contained the original effect size (p < .001) (see [A4] for details). For the subset of 18 and 4 studies with test statistics F(df1 > 1, df2) and χ2, respectively, 68.2% of the confidence intervals contained the effect size of the original study (see [A5] for details). This results in an overall success rate of 47.4%. Figure S4 depicts effect sizes of study-pairs for which correlations could be calculated, and codes significance of effect sizes as well.

Reproducibility Project 15
Figure S4: Correlations of both original and replication study, coded by statistical significance. Identical values are indicated by the black diagonal line, whereas the blue and dotted line show the replication correlations as predicted by a linear model and loess, respectively.

Reproducibility Project 16
Combining original and replication effect sizes for cumulative evidence. See Appendix [A7] for details. For 75 study-pairs a meta-analysis could be conducted on the Fisher-transformed correlation scale. In 51 out of 75 pairs the null-hypothesis of no effect was rejected (68%). The average correlation, after transforming back the Fisher-transformed estimate, was .310 (SD = .223). However, the results differed across discipline; average effect size was smaller for JPSP (M = .138, SD = .087) than for the other four journal/discipline categories, and the percentage of meta-analytic effects rejecting the null-hypothesis was also lowest for JPSP (42.9%; see Table 1). As noted in the main text, the interpretability of these meta-analytic estimates is qualified by the possibility of publication bias inflating the original effect sizes. Subjective assessment of “Did it replicate?” Replication teams provided a dichotomous yes/no assessment of whether the effect replicated or not (Column BX). Assessments were very similar to evaluations by significance testing (p < .05) including two original null results being interpreted as successful replications when the replication was likewise null, and one original null result being interpreted as a failed replication when the replication showed a significant effect. Overall, there were 39 assessments of successful replication (39 of 100; 39%). There are three subjective variables assessing replication success. Additional analyses can be conducted on replication teams’ assessments of the extent to which key effect and overall findings resemble the original results (Columns CR and CQ). Meta-analysis of all original study effects, and of all replication study effects. Two random-effects meta-analyses were run (on studies in set MA) using REML estimation for estimating the amount of heterogeneity, one on effect sizes of original and one on effect sizes of replication studies. We ran four models; one without any predictor, one with discipline as predictor, one with studies’ standard error as predictor, and one with standard error and discipline as predictor. Discipline is a categorical variable with categories JPSP-social (= reference category), JEP:LMC-cognitive, PSCI-social, and PSCI-cognitive. Standard error was added to examine small-study effects. A positive effect of standard error on effect size indicates that studies’ effect sizes are positively associated with their sample sizes. The results of this one-tailed test, also known as Egger’s test, is often used as test of publication bias. However, a positive effect of standard error on effect size may also indicate the use of power analysis or using larger sample sizes in fields where smaller effect sizes are observed.
See Appendix [A7] for details. The meta-analysis on all original study effect sizes showed significant (Q(72) = 302.67, p < .001) and large heterogeneity (�̂�𝜏=.19, I2 = 73.3%), with average effect size equal to .42 (z = 14.74, p < .001). The average effect size differed across disciplines (QM(3) = 14.70, p = .0021), with effect size in JPSP (.29) being significantly smaller than in JEP:LMC (.52; z = 3.17, p = .0015) and PSCI-Cog (.57; z = 3.11, p = .0019), but not PSCI-Soc (.40; z = 1.575, p = .12). The effect of the original studies’ standard error on effect size was

Reproducibility Project 17
large and highly significant (b = 2.24, z = 5.66, p < .001). Figure S5 shows the funnel plot of the meta-analysis without predictors. After controlling for study’s standard error, there was no longer an effect of discipline on effect size (χ2(3) = 5.36, p = .15); at least part of the differences in effect sizes across disciplines was associated with studies in JEP:LMC and PSCI-Cog using smaller sample sizes than JPSP and PSCI-Soc.
Figure S5: Funnel plot of the meta-analysis on the original study’s effect size.
The same meta-analysis on replication studies’ effect sizes showed significant (Q(72) = 454.00, p < .001) and large heterogeneity (�̂�𝜏=.26, I2 = 90.1%), with average effect size equal to .20 (z = 5.77, p < .001). The average effect size again differed across disciplines (QM(3) = 12.78, p = .0051). Average effect size in JPSP did not differ from 0 (.036; z = .63, p = .53), and was significantly smaller than average effect size in JEP:LMC (.28; z = 2.91, p = .0036), PSCI-Cog (.35; z = 2.95, p = .0032), and PSCI-Soc (.22; z = 2.23, p = .026). The effect of the standard error of the replication study was large and highly significant (b = 1.62, z = 3.47, p < .001). Because publication bias was absent, this positive effect of standard error was likely caused by

Reproducibility Project 18
using power analysis for replication studies, i.e., generally larger replication samples were used for smaller true effects. Figure S6 shows the corresponding funnel plot. The effect of discipline did not remain statistically significant after controlling for the standard error of the replication study (χ2(3) = 6.488, p = .090); similar to the results of original studies, at least part of the differences in effect sizes across disciplines was associated with studies in JEP:LMC and PSCI-Cog using smaller sample sizes than JPSP and PSCI-Soc.
Figure S6: Funnel plot of the meta-analysis on the replication study’s effect size.
Meta-analysis of difference of effect size between original and replication study
The dependent variable was the difference of Fisher-transformed correlations (original – replication), with variance equal to the sum of variances of the correlation of the original and of the replication study. Several random-effect meta-analyses were run using REML estimation for estimating the amount of heterogeneity in metafor. First, the intercept-only model was estimated; the intercept denotes the average difference effect size between original and replication study. Second, to test for small study effects, we added the standard error of the

Reproducibility Project 19
original study as a predictor, akin to Egger’s test; a positive effect is often interpreted as evidence for publication bias. Our third model tested the effect of discipline.
The null-model without predictors yielded an average estimated difference in effect size equal to .21 (z = 7.55, p < .001) in favor of the original study. The null-hypothesis of homogeneous difference in effect sizes was rejected (Q(72) = 152.39, p < .001), with medium observed heterogeneity (�̂�𝜏=.149, I2 = 47.8%). Via Egger’s test, precision of the original study was associated with the difference in effect size (b = .85, z = 1.88, one-tailed p = .030), hence imprecise original studies (large standard error) yielded larger differences in effect size between original and replication study. This is confirmed by the funnel plot in Figure S7. Discipline was not associated with the difference in effect size, χ2(3) = 2.451, p = .48, (i.e., the average difference in effect size was equal for JPSP, JEP:LMC, PSCI-soc, and PSCI-cog). Also, after controlling for the effect of the standard error of the original study, no differences between disciplines were observed (𝜒𝜒2(3) = 2.807, p = .42). No moderating effects were observed for: importance of the effect (b = -.010, p = .77), surprising effect (b = .001, p = .97), experience and expertise of original team (b = -.0017, p = .96), challenge of conducting replication (b = 0.026, p = .45), and self-assessed quality of replication (b = -.037, p = .51). However, a positive effect of experience and expertise of replication team was observed (b = .13, p = .0063), meaning that the difference between original and replication effect size was higher for replication teams with more experience and expertise.
The results from the three meta-analyses tentatively suggest that the journals/disciplines are similarly influenced by publication bias leading to overestimated effect sizes, and that cognitive effects are larger than social effects on average -- possibly because of the target of study or the sensitivity of the research designs (e.g., within-subject designs reducing error and increasing sensitivity).

Reproducibility Project 20
Figure S7: Funnel plot of meta-analysis on difference in effect size (original – replication).

Reproducibility Project 21
Moderator Analyses
The main text reports correlations between five reproducibility indicators and aggregate variables of original and replication study characteristics. Below are correlations among the five reproducibility indicators (Table S3), correlations of individual characteristics of original studies with reproducibility indicators (Table S4), and correlations of individual characteristics of replication studies with reproducibility indicators (Table S5).
Table S2. Spearman’s rank order correlations among reproducibility indicators
Replications p < .05 in original direction
Effect Size Difference
Meta-analytic Estimate
original effect size
within replication
95% CI
subjective "yes" to "Did it replicate?"
Replications p < .05 in original direction .
Effect Size Difference -0.619 .
Meta-analytic Estimate 0.592 -0.218 .
original effect size within replication 95% CI 0.551 -0.498 0.515 .
subjective "yes" to "Did it replicate?" 0.956 -0.577 0.565 0.606 .
Notes: Effect size difference (original - replication) computed after converting r's to Fisher's z. Notes: Four original results had p-values slightly higher than .05, but were considered positive results in the original article and are treated that way here. Exclusions (see SI [A3] for explanation): "replications p < .05" (3 excluded; n = 97), "effect size difference" (3 excluded; n = 97); "meta-analytic mean estimates" (27 excluded; n = 73); and, "% original effect size within replication 95% CI" (5 excluded, n=95).

Reproducibility Project 22
Table S3. Descriptive statistics and spearman’s rank-order correlations of reproducibility indicators with individual original study characteristics
M SD Median Range
Replications p < .05 in original direction
Effect Size Difference
Meta-analytic Estimate
original effect size
within replication
95% CI
subjective "yes" to "Did it
replicate?"
Original effect size 0.3942 0.2158 0.3733
.0046 to .8596 0.304 0.279 0.793 0.121 0.277
Original p-value 0.0283 0.1309 0.0069
0 to .912 -0.327 -0.057 -0.468 0.032 -0.260
Original df/N 2409 22994 55 7 to
230025 -0.150 -0.194 -0.502 -0.221 -0.185
Institution prestige of 1st author 3.78 1.49 3.45
1.28 to 6.74 -0.026 0.012 -0.059 -0.132 -0.002
Institution prestige of senior author 3.97 1.54 3.65
1.28 to 6.74 -0.057 -0.062 0.019 -0.104 -0.019
Citation impact of 1st author 3074 5341 1539
54 to 44032 0.117 -0.111 0.090 0.004 0.117
Citation impact of senior author 13656 17220 8475
240 to 86172 -0.093 -0.060 -0.189 -0.054 -0.092
Article citation impact 84.91 72.95 56 6 to 341 -0.013 -0.059 -0.172 -0.081 0.016
Internal conceptual replications 0.91 1.21 0 0 to 5 -0.164 0.036 -0.185 -0.058 -0.191
Internal direct replications 0.06 0.32 0 0 to 3 0.061 0.023 0.071 0.116 0.047
Surprising original result 3.07 0.87 3
1.33 to 5.33 -0.244 0.102 -0.181 -0.113 -0.241

Reproducibility Project 23
Importance of original result 3.36 0.71 3.28
1 to 5.33 -0.105 0.038 -0.205 -0.133 -0.074
Notes: Effect size difference computed after converting r's to Fisher's z. df/N refers to the information on which the test of the effect was based (e.g., df of t-test, denominator df of F-test, sample size - 3 of correlation, and sample size for z and chi2). Four original results had p-values slightly higher than .05, but were considered positive results in the original article and are treated that way here. Exclusions (see SI [A3] for explanation): "replications p < .05" (3 original nulls excluded; n = 97), "effect size difference" (3 excluded; n = 97); "meta-analytic mean estimates" (27 excluded; n = 73); and, "% original effect size within replication 95% CI" (5 excluded, n=95).

Reproducibility Project 24
Table S4. Descriptive statistics and spearman’s rank-order correlations of reproducibility indicators with individual replication study characteristics
M SD Median Range
Replications p < .05 in original direction
Effect Size Difference
Meta-analytic Estimate
original effect size
within replication
95% CI
subjective "yes" to "Did it
replicate?"
Institution prestige of 1st author 3.04 1.42 2.53
1.31 to 6.74 -0.224 0.114 -0.436 -0.267 -0.243
Institution prestige of senior author 3.03 1.4 2.61
1.31 to 6.74 -0.231 0.092 -0.423 -0.307 -0.249
Citation count of 1st author 570 1280 91
0 to 6853 0.064 -0.114 -0.045 0.220 0.058
Citation count of senior author 1443 2573 377
0 to 15770 -0.078 0.104 -0.070 0.038 -0.067
Position of senior member of replication team 2.91 1.89 2 1 to 7 -0.157 0.087 -0.241 -0.195 -0.159
Highest degree of senior member 1.24 0.62 1 1 to 4 -0.034 -0.029 -0.040 -0.155 -0.025
Senior member's total publications 44.81 69.01 18 0 to 400 -0.021 0.079 0.037 0.054 -0.004
Domain expertise 3.22 1.07 3 1 to 5 0.042 0.022 0.130 0.180 0.101
Method expertise 3.43 1.08 3 1 to 5 -0.057 0.151 0.214 0.009 -0.026
Perceived expertise required 2.25 1.2 2 1 to 5 -0.114 0.042 -0.054 -0.077 -0.044
Perceived opportunity for expectancy bias 1.74 0.8 2 1 to 4 -0.214 0.117 -0.355 -0.109 -0.172
Perceived opportunity for 2.21 1.02 2 1 to 5 -0.194 0.086 -0.333 -0.037 -0.149

Reproducibility Project 25
impact of lack of diligence
Implementation quality 3.85 0.86 4 1 to 6 -0.058 0.093 -0.115 0.043 -0.023
Data collection quality 3.60 1.00 4 1 to 6 -0.103 0.038 0.230 0.026 -0.106
Replication similarity 5.72 1.05 6 3 to 7 0.015 -0.075 -0.005 -0.036 0.044
Difficulty of implementation 4.06 1.44 4 1 to 6 -0.072 0.000 -0.059 -0.116 -0.073
Replication df/N 4804 4574 68.5 7 to
455304 -0.085 -0.224 -0.692 -0.257 -0.164
Replication power 0.921 0.086 0.95
.56 to .99 0.368 -0.053 0.142 -0.056 0.285
Replication team surprised by outcome of replication 2.51 1.07 2 1 to 5 -0.468 0.344 -0.323 -0.362 -0.498 Notes: Effect size difference computed after converting r's to Fisher's z. df/N refers to the information on which the test of the effect was based (e.g., df of t-test, denominator df of F-test, sample size - 3 of correlation, and sample size for z and chi2). Four original results had p-values slightly higher than .05, but were considered positive results in the original article and are treated that way here. Exclusions (see SI [A3] for explanation): "replications p < .05" (3 original nulls excluded; n = 97), "effect size difference" (3 excluded; n = 97); "meta-analytic mean estimates" (27 excluded; n = 73); and, "% original effect size within replication 95% CI" (5 excluded, n=95).