supplementary information - nature c6 c4 c5 c7 a groups at2g31010 at3g58640 ... plants were...
TRANSCRIPT

Supplementary Information A Raf-like protein kinase BHP mediates blue light-dependent stomatal opening Maki Hayashi1, Shin-ichiro Inoue1, Yoshihisa Ueno1,3, Toshinori Kinoshita1,2,*
1Division of Biological Science, Graduate School of Science, Nagoya University, Chikusa, Nagoya 464-8602, Japan 2Institute of Transformative Bio-Molecules (WPI-ITbM), Nagoya University, Chikusa, Nagoya 464-8602, Japan 3Current address: Department of Agriculture, Ryukoku University, Seta Oe-cho, Otsu, Shiga 520-2194, Japan *Corresponding author: Toshinori Kinoshita Institute of Transformative Bio-Molecules (WPI-ITbM), Nagoya University, Chikusa, Nagoya 464-8602, Japan Tel/ Fax: +81-52-789-4778 E-mail: [email protected]
Exp
ress
ion
leve
l in
guar
d ce
lls
HT1
b
B1
B2
B3
B4
C1
C2
C3
C6
C4
C5
C7
a G
roup
s A
t2g3
1010
At3
g586
40 A
t2g4
2640
At4
g230
50 A
t1g6
7890
At5
g494
70 A
t3g0
6620
At3
g066
30 A
t3g0
6640
At1
g087
20 A
t5g1
1850
At1
g181
60 A
t1g7
3660
At4
g244
80 A
t5g0
3730
At1
g162
70 A
t1g7
9570
At2
g350
50 A
t1g0
4700
At3
g247
15 A
t3g4
6920
At5
g576
10 A
t1g1
4000
At3
g598
30 A
t2g4
3850
At2
g318
00 A
t4g1
8950
At3
g587
60 A
t2g1
7700
At4
g357
80 A
t4g3
8470
At3
g275
60 A
t5g4
0540
At5
g501
80 A
t5g0
1850
At3
g507
20 A
t3g5
0730
At5
g667
10 A
t2g2
4360
At4
g311
70 A
t1g6
2400
At3
g469
30 A
t5g5
8950
At3
g014
90 A
t5g5
0000
At3
g227
50 A
t4g1
4780
At3
g632
60 A
t3g0
7980
At3
g135
30 A
t4g0
8500
At4
g084
80 A
t4g0
8470
At4
g120
20 A
t1g5
3570
At1
g637
00 A
t5g6
6850
At3
g060
30 A
t1g0
9000
At1
g549
60
0
500
1000
1500
2000
2500
3000
At2
g310
10
At3
g586
40
At2
g426
40
At4
g230
50
At1
g678
90
At5
g494
70
At3
g066
20
At3
g066
30
At3
g066
40
At1
g087
20
At5
g118
50
At1
g181
60
At1
g736
60
At4
g244
80
At5
g037
30
At1
g162
70
At1
g795
70
At2
g350
50
At1
g047
00
At3
g247
15
At3
g469
20
At5
g576
10
At1
g140
00
At3
g598
30
At2
g438
50
At2
g318
00
At4
g189
50
At3
g587
60
At2
g177
00
At4
g357
80
At4
g384
70
At3
g275
60
At5
g405
40
At5
g501
80
At5
g018
50
At3
g507
20
At3
g507
30
At5
g667
10
At3
g469
30
At5
g589
50
At1
g624
00
At2
g243
60
At4
g311
70
At3
g014
90
At5
g500
00
At3
g227
50
At4
g147
80
At3
g632
60
B1 B2 B3 B4 C1 C2 C3 C4 C5 C6 C7
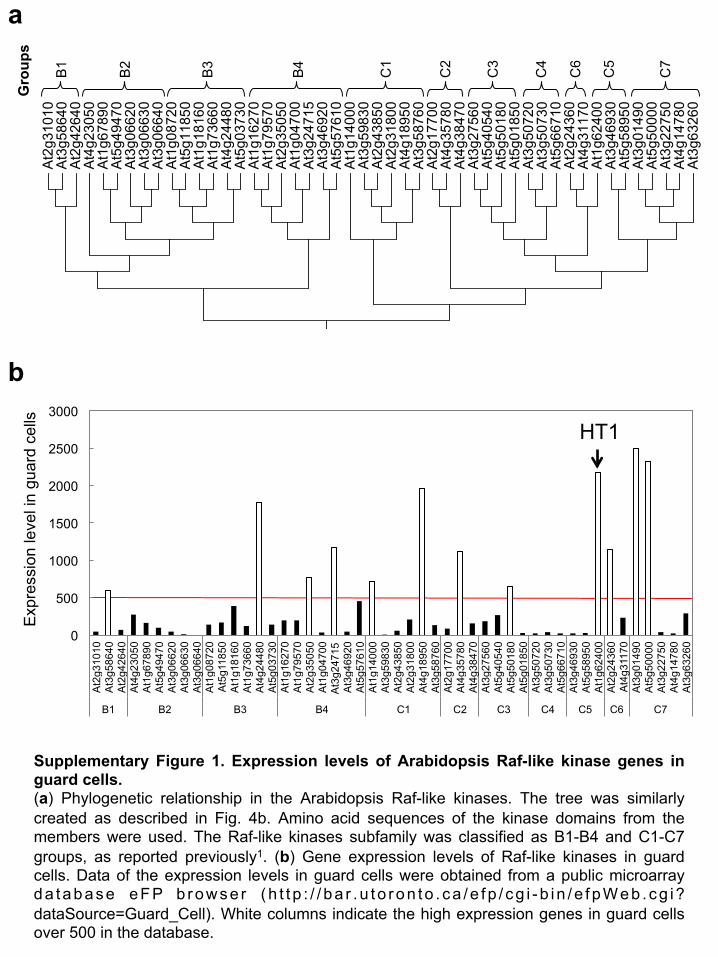
Supplementary Figure 1. Expression levels of Arabidopsis Raf-like kinase genes in guard cells. (a) Phylogenetic relationship in the Arabidopsis Raf-like kinases. The tree was similarly created as described in Fig. 4b. Amino acid sequences of the kinase domains from the members were used. The Raf-like kinases subfamily was classified as B1-B4 and C1-C7 groups, as reported previously1. (b) Gene expression levels of Raf-like kinases in guard cells. Data of the expression levels in guard cells were obtained from a public microarray da tabase eFP b rowse r ( h t t p : / / ba r . u to ron to . ca /e fp / cg i - b i n /e fpWeb .cg i?dataSource=Guard_Cell). White columns indicate the high expression genes in guard cells over 500 in the database.

B1
B4
B3 SALK_ 061250
SALK_ 005607 WT
At3g58640
TUB2
SALK_ 025685 WT
At4g24480
TUB2
At3g24715
TUB2
At2g35050
TUB2
SALK_ 205151 WT
SALK_ 107170 WT
C1 C2
At1g14000
TUB2
SALK_ 002267 WT
At4g35780
TUB2
SALK_ 139573 WT
C6
At2g24360
TUB2
SALK_ 105195 WT C3
At5g50180
TUB2
SALK_ 119787 WT
Groups
C7
At3g01490
At5g50000
SALK_ 005187 WT
SAIL_ 63F05
TUB2
Supplementary Figure 2. Confirmation of gene knockouts in the T-DNA insertion mutants in this study. RT-PCR was performed using total RNAs from the rosette leaves in wild-type (WT) and T-DNA insertion mutants. All genes were amplified by PCR using the specific primer sets (see Supplementary Table 2). TUB2 was amplified as an internal control.

0 1 2 3 4 5
Dark
Light
B1
B4
B3
0
1
2
3
4
Dark
Light
0 1 2 3 4 5
Dark
Light
0
1
2
3
4
Dark Light
C1
0
1
2
3
4
Dark Light
Sto
mat
al a
pertu
re
(µm
)
Sto
mat
al a
pertu
re
(µm
)
Sto
mat
al a
pertu
re
(µm
)
Sto
mat
al a
pertu
re
(µm
)
Sto
mat
al a
pertu
re
(µm
)
C2
Sto
mat
al a
pertu
re
(µm
)
0
1
2
3
4
Dark
Light
C6 C3
0 1 2 3 4 5
Dark
Light
Sto
mat
al a
pertu
re
(µm
)
0 1 2 3 4 5
Dark
Light
Sto
mat
al a
pertu
re
(µm
)
C7
Sto
mat
al a
pertu
re
(µm
)
0
1
2
3
Dark Light
WT
SALK_061250
SALK_005607 WT SALK_025685
WT SALK_205151 WT SALK_107170
WT SALK_002267 WT SALK_139573
WT SALK_119787 WT SALK_105195
SALK_005187
(At3g01490) SAIL_63F05
(At5g50000)
Groups
At4g24480 At3g58640
At2g35050 At3g24715
At5g50180
At1g14000 At4g35780
At2g24360
*
Supplementary Figure 3. Measurements of the blue light-dependent stomatal opening in the T-DNA insertion mutants. Values represent means±s.d. (n=3); measurement of 30 stomata in each experiment. * indicates values that statistically differ from WT blue light sample (Student’s t test; *p<0.01).

a
BHP
TUB2
bhp-2 WT
0
2
4
Col #3 #6
Dark
Light
#2
Sto
mat
al
aper
ture
(µm
)
WT
Anti-PKSO
Anti- H+-ATPase
#1
WT proGC1: PKSO
#1 #2
I
proGC1: PKSO
**
**
0
0.5
1
1.5
Col #3 #6
R B
Red Red+Blue
Sig
nal i
nten
sity
(R
elat
ive
valu
e)
WT #1 #2
WT #1 #2
proGC1: PKSO
proGC1: PKSO
Red
Red+Blue
b
c
G
bhp-2 (WiscDsLox345_348B17)
ATG TGA
0
1
2
3
Col gabi wisc
Dark Light
WT bhp-1 bhp-2
Sto
mat
al
aper
ture
(µm
)
* *
Supplementary Figure 4. Blue light-dependent stomatal opening in T-DNA insertion alleles of BHP. (a) Schematic representation of the BHP gene (At4g18950) and position of the T-DNA insertion in the bhp-2 mutant. Boxes and lines indicate exons and introns, respectively. (b) Knockout of the BHP gene in the bhp-2 mutant. (c) Blue light-dependent stomatal opening in leaves from WT, bhp-1, and bhp-2. The experiment was performed as described in Fig. 2d. Values represent means±s.d. (n=4); measurement of 30 stomata in each experiment. * indicates values that statistically differ from the corresponding WT (Student’s t test; *p<0.01).

b
0
0.5
1
1.5
2
2.5
Red
Blue
FC S
igna
l int
ensi
ty
(Rel
ativ
e va
lue)
WT SALK_002267
0
0.5
1
1.5
Sig
nal i
nten
sity
(R
elat
ive
valu
e)
WT SALK_002267
c
a
0
0.5
1
1.5
2
2.5
3
3.5
0 1 10
WT SALK_002267 S
tom
atal
ap
ertu
re (µ
m)
FC (µM) 0 1 10
Anti-H+-ATPase
Anti-pThr
* **

Supplementary Figure 5. Immunohistochemical detection of guard cell H+-ATPase and fusicoccin (FC) induced-stomatal opening in the At1g14000 knockout mutant. (a) Phosphorylation of the guard cell H+-ATPase in SALK_002267 in response to blue light and fusicoccin (FC). The immunohistochemical experiments using anti-pThr antibody were performed and are shown in Fig. 2h. Values represent means±s.d. (n=3); measurement of 30 stomata in each experiment. (b) Immunohistochemical detection of the amount of guard cell H+-ATPase in WT and SALK_002267 using anti-H+-ATPase antibody. The relative signal intensity was expressed as the ratio of the signal intensity from the SALK_002267 mutant to that from WT. Values indicate means±s.d. (n=3), and measurements of 30 stomata in each experiment. (c) Stomatal opening in response to FC in WT and SALK_002267 epidermis. Epidermal fragments from dark-adapted plants were incubated in reaction buffer 2 (see Methods) containing FC at the indicated concentrations for 3 h in the dark. Data represent means±s.d. (n=4). Thirty stomata were measured in each experiment. * and ** indicate values that statistically differ from the corresponding WT (Student’s t test; **p<0.01, *p<0.05).

-50
0
50
100
150
WT bhp-1 phot1 phot2
WT
bhp-1
phot1 phot2 WT
bhp-1
phot1 phot2
a
b
c
WT bhp-1
phot1 phot2
WT bhp-1
phot1 phot2
Blue light
Pho
totro
pic
cu
rvat
ure
(deg
ree)
Supplementary Figure 6. Phot-mediated blue light responses in bhp-1 mutant. (a) Phototropism in WT, bhp-1, and phot1-5 phot2-1 (phot1 phot2). Etiolated seedlings were irradiated with unilateral blue light (0.5 µmol m-2 s-1) for 14 h. Values represent means±s.d. (n=18-19). (b) Slit band assays for the chloroplast movement in WT, bhp-1, and phot1 phot2. Left and right panels indicate the chloroplast avoidance and accumulation responses, respectively. Detached leaves were irradiated with blue light at 100 µmol m-2 s-1 or 5 µmol m-2 s-1 for 30 min through a slit to induce the avoidance and accumulation responses, respectively. Arrowheads indicate the irradiated areas. (c) Leaf flattening. Rosette leaves were detached from 5-week-old plants, and photos were taken from the adaxial (left panel) and abaxial (right panel) sides.

D BL
Input GST- 14-3-3
GST- BHP
Anti-GST
Anti-phot1
Pulldown
GST-BHP
GST-14-3-3
D BL D BL
a
+� + +� +
Immunoblot (Anti-FLAG)�
GST-BHP�
FLAG-PP1 �Input �
GST
Pulldown�
- � + - � +
GST
Immunoblot (Anti-GST) �
GST-BHP�
+� - +� -
b
Input GST-
14-3-3 GST-BHP
Anti-GST
Pulldown
GST-BHP
GST-14-3-3
Anti- H+-ATPase
c

Supplementary Figure 7. In vitro pull-down assays for interaction of BHP with phot1, H+-ATPase, and PP1. (a,b) The recombinant GST-14-3-3 protein or GST-BHP was purified from E. coli cells using glutathione-Sepharose 4B beads, and the proteins were reacted with microsomal proteins from Arabidopsis etiolated seedlings. The boundary matrices were subjected to SDS-PAGE and then immunoblot using anti-GST, anti-phot1, and anti-H+-ATPase antibodies. (a) Pull-down of assay of phot1 and BHP. (b) Pull-down of assay of H+-ATPase and BHP. The GST-14-3-3 was used as a positive control for the binding to phot1 and the H+-ATPase. (c) In vitro pull-down assay for interaction of BHP with PP1. Both proteins were expressed in E. coli and used. Extract from E. coli cells expressing GST or GST-BHP was mixed with that expressing FLAG-PP1 and reacted with glutathione-Sepharose 4B beads. Proteins on the beads were subjected to SDS-PAGE and then immunoblotting using anti-GST and anti-FLAG antibodies.

BLUS1-YFPC AHA1-YFPC AHA2-YFPC phot1-YFPC phot2-YFPC YFPC
D
a
b
BHP -YFPN
AHA1 -YFPC
AHA2 -YFPC
phot1 -YFPC
phot2 -YFPC
AHA1-YFPN BHP-YFPN AHA2-YFPN BHP-YFPN
phot1-YFPN BHP-YFPN phot2-YFPN BHP-YFPN
AHA1 AHA2
phot1 phot2
Supplementary Figure 8. In vivo interactions of BHP with signaling components in blue light-dependent stomatal opening by BiFC assay. (a) Fluorescence images of the interactions between BHP and BLUS1, AHA1, AHA2, phot1, and phot2 in BiFC assays. Experiments were performed as shown in Fig. 5b. For negative control, the C-terminal half of YFP (YFPC) only was co-expressed with BHP-YFPN. Scale bar is 150 µm. (b) Comparison of BHP-H+-ATPase or -phototropin interactions with the positive interaction controls in BiFC assays. Because H+-ATPase and phototropins form multimer complexes2,3, co-expression of AHA1-YFPN/AHA1-YFPC, AHA2-YFPN/AHA2-YFPC, phot1-YFPN/phot1-YFPC, and phot2-YFPN/phot2-YFPC were used as positive controlsScale bar represents 150 µm.
Inhibitor Mammaliantarget
Putative targets inArabidopsis
Identity (%)
PKC
c-Raf
EGFRK
32
33
Sphingosine
GW5074
BML-265
Raf-like kinaseAt4g38470
Raf-like kinaseAt2g17700
32
38
41
39
38
38
37
32
S6 kinae-2At3g08720
Putative proteinkinase At1g48490
Raf-like kinaseAt4g35780
Raf-like kinaseAt2g17700
Raf-like kinaseAt1g73660
Raf-like kinaseAt4g35780
Tyrphostin 9 PDGFRK Raf-like kinaseAt4g31170
39
Raf-like kinaseAt2g24360
37
Raf-like kinaseAt4g35780
S6 kinase-1At3g08730
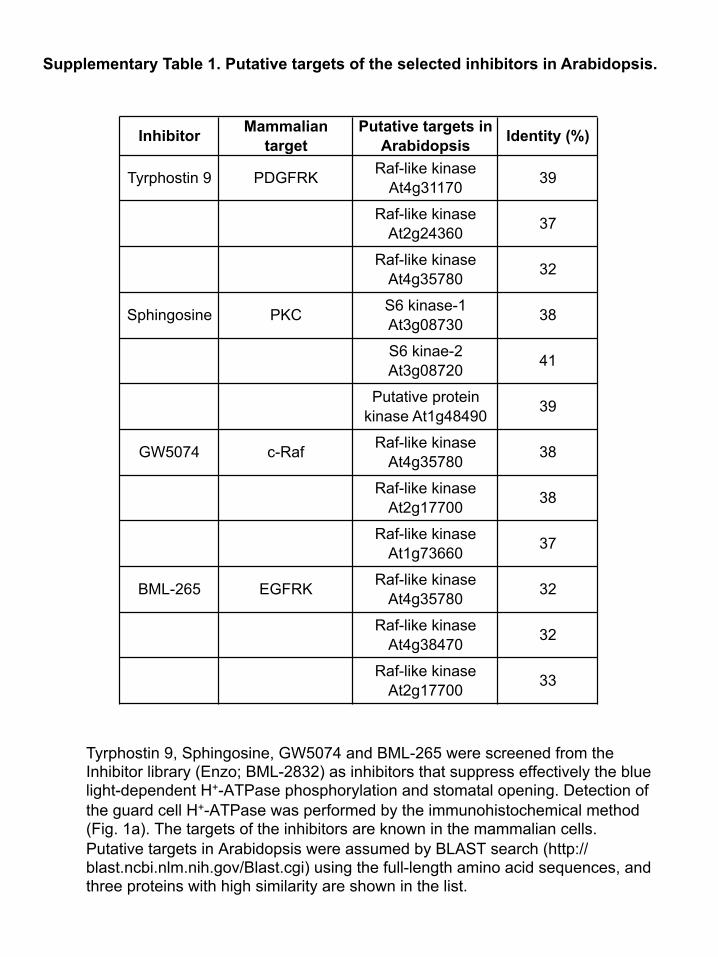
Tyrphostin 9, Sphingosine, GW5074 and BML-265 were screened from the Inhibitor library (Enzo; BML-2832) as inhibitors that suppress effectively the blue light-dependent H+-ATPase phosphorylation and stomatal opening. Detection of the guard cell H+-ATPase was performed by the immunohistochemical method (Fig. 1a). The targets of the inhibitors are known in the mammalian cells. Putative targets in Arabidopsis were assumed by BLAST search (http://blast.ncbi.nlm.nih.gov/Blast.cgi) using the full-length amino acid sequences, and three proteins with high similarity are shown in the list.
Supplementary Table 1. Putative targets of the selected inhibitors in Arabidopsis.

Gene Experiments
F: GAGGGTACCGCTCCCATGAGCACAGCAACAAGGCCTTCCR: CTTTTGCTCCATCCCGTCAACGGCTTTAGAATCATTAGAAG
Primer sequence
F: GAGGGTACCGCTCCCATGTCAGGTCTCGAAGATATCAAGR: CTTTTGCTCCATCCCCACAGTGTAGTGATGTCCTGC
F: GAGGGTACCGCTCCCATGTCAGGTCTCGAAGATATCAAGR: GTATGGGTACATCCCCACAGTGTAGTGATGTCCTGC
F: GAGGGTACCGCTCCCATGTCGAGTCTCGAAGATATCAAGR: CTTTTGCTCCATCCCCACAGTGTAGTGACTGGGAGTTTC
F: GAGGGTACCGCTCCCATGTCGAGTCTCGAAGATATCAAGR: GTATGGGTACATCCCCACAGTGTAGTGACTGGGAGTTTC
F: GAGGGTACCGCTCCCATGGCGACGACGACGACGR: GTATGGGTACATCCCAATCTTTGTGGACATCATGAACTTG
F: GAGGGTACCGCTCCCATGGCTCGGAACAAGCTCGAGTTCR: GTATGGGTACATCCCACCCAAAACACTATCTTTATCAGC
F: GAGGGTACCGCTCCCATGGAACCAACAGAAAAACCATCGR: CTTTTGCTCCATCCCAAAAACATTTGTTTGCAGATCTTCTAGC
F: GAGGGTACCGCTCCCATGGAACCAACAGAAAAACCATCGR: GTATGGGTACATCCCAAAAACATTTGTTTGCAGATCTTCTAGC
F: GAGGGTACCGCTCCCATGGAGAGGCCAAGAGCCCCTR: CTTTTGCTCCATCCCGAAGAGGTCAATGTCCAAGTCCG
F: GAGGGTACCGCTCCCATGGAGAGGCCAAGAGCCCCTR: GTATGGGTACATCCCGAAGAGGTCAATGTCCAAGTCCG
F: AATCTTGCAATGGATTCTTTGACTGR: CAAGGTTAATAACATTGATTGAAGCAG
F: AGTGAATCTTAGATTGGGAAGATGCR: TTCTCGCTGTCGTCATTATCTCTG
F: AAATGAAGGAGAAGGCGGAGAGTGR: ATCCCAAAGCTATACACATCGCAC
F: ATGAAAGAAGGAAAGGATGGGTTTGR: TTAAGGACCACGTTTCCTTCGG
F: GAGGGTACCGCTCCCATGGAAGAGGATTATCAACAGCR: CTTTTGCTCCATCCCCAAATGTGAACCGGATGATG
F: ATGGATCAAGCAAAAGGTTATGAACATGR: TTACTTGTGGATTTGGTGGTTGACAG
F: ATGTCAGATAGATGGGCTCGACR: AGGAAATTGGCAATGGGAGAG
F: CAATGGTGATCTGATGGTAGR: TCTGAATCGGTTTTGAGATG
F: ATGGAAGAGGATTATCAACAGCR: TCACAAATGTGAACCGGATG
F: ATGGCGATCAAAGAGGAGACR: TAGGCCTGAAAAGTAACCAC
for RT-PCR
for RT-PCRAt3g58640 B1
F: ATGGCGATCAAAGAGGAGACR:TAGGCCTGAAAAGTAACCAC
At4g24480 B3
F: TCAGAGTGAGATTTTAACGAAATGCR:CTATAGTATGGGAGCTGATTTAGTTGG
At2g35050 B4
At3g24715 B4
VIK At1g14000 C1
BHP At4g18950C1
At4g35780 C2
At5g50180C3
At2g24360 C6
At3g01490 C7
At5g50000C7
BHPBHP-YFPN
BLUS1BLUS1-YFPC
PHOT1 PHOT1-YFPN
PHOT1-YFPC
PHOT2 PHOT2-YFPN
PHOT2-YFPC
AHA1 AHA1-YFPN
AHA1-YFPC
AHA2AHA2-YFPN
AHA2-YFPC
PP1 TOPP4-YFPC
INHIBITOR3 INHIBITOR3-YFPN for BiFC
for BiFC
for BiFC
for BiFC
for BiFC
for BiFC
for BiFC
for BiFC
for BiFC
for BiFC
for BiFC
for BiFC
for RT-PCR
for RT-PCR
for RT-PCR
for RT-PCR
for RT-PCR
for RT-PCR
for RT-PCR
for RT-PCR
for RT-PCR
Supplementary Table 2. Primers used in RT-PCR and BiFC assay.

1. Ichimura, K. et al. Mitogen-activated protein kinase cascades in plants: a new nomenclature. Trends Plant Sci 7, 301-308 (2002).
2. Kanczewska, J. et al. Activation of the plant plasma membrane H+-ATPase by phosphorylation and binding of 14-3-3 proteins converts a dimer into a hexamer. Proc Natl Acad Sci USA 102, 11675-11680 (2005).
3. Katsura, H., Zikihara, K., Okajima, K., Yoshihara, S. & Tokutomi, S. Oligomeric structure of LOV domains in Arabidopsis phototropin. FEBS Lett 583, 526-530 (2009).
Supplementary References