supplementary information - media.nature.com · matthew r. jones, robert j. macfarlane, byeongdu...
TRANSCRIPT

SUPPLEMENTARY INFORMATIONdoi: 10.1038/nmat2870
nature materials | www.nature.com/naturematerials 1
1
Supplementary Information
DNA-Nanoparticle Superlattices Formed From Anisotropic Building Blocks
Matthew R. Jones, Robert J. Macfarlane, Byeongdu Lee, Jian Zhang, Kaylie L. Young, Andrew
J. Senesi, and Chad A. Mirkin*
[*] Prof. C. A. Mirkin
Department of Chemistry
Department of Materials Science and Engineering
International Institute for Nanotechnology
Northwestern University, 2145 Sheridan Road, Evanston, Illinois 60208-3113, USA
Fax: (+1) 847-467-5123
Email: Chad A. Mirkin ([email protected])

2 nature materials | www.nature.com/naturematerials
SUPPLEMENTARY INFORMATION doi: 10.1038/nmat2870
2
Materials and Methods
Anisotropic Nanostructure DNA Functionalization
Although each particle functionalization presented unique individual challenges, all procedures are generally based on a previously demonstrated ligand replacement reaction between cetyltrimethylammonium bromide (CTAB) and thiolated oligonucleotides1. Briefly, CTAB (0.05 M) stabilized anisotropic particles were spun down twice and resuspended in nanopure (18.2 MΩ-cm) water. Thiolated oligonucleotides (see Table S1 for sequences) that had been oxidized with 0.1 M dithiothreitol (DTT) and purified with a desalting column were then immediately added to the colloidal solution (3 OD260 of DNA per mL of nanoparticle colloid). Surface reorganization effects or irreversible particle aggregation were only observed if more than 20-30 minutes were allowed between the final resuspension in water and the addition of thiolated DNA. After allowing 1-3 hours for thiolated DNAs to react with the gold surface, particle suspensions were brought to 0.01% sodium dodecyl sulfate (SDS) and 0.01 M sodium phosphate and allowed to sit for 30 min to 1 hour. Following literature precedent2, the colloidal particle solutions were then slowly treated with NaCl to allow for electrostatic screening between neighboring DNA strands and denser surface coverage of oligonucleotides. Specifically, solutions were brought to 0.05 M, 0.1 M, 0.2 M, 0.3 M, 0.4 M, and 0.5 M NaCl sequentially with approximately 30 min between each salt addition. After reaching the final salt concentration, particles were allowed to sit overnight to achieve maximum DNA loading. In order to remove unreacted oligonucleotides from solution, particle suspensions were centrifuged, the supernatant was removed, and the pellet was resuspended in 0.01% SDS three times. The final resuspension typically occurred in 50 – 100ul to allow for a concentrated solution of particles. Sodium phosphate and NaCl were added to bring the final suspension to 0.01 M and 0.5 M sodium phosphate and NaCl, respectively. For all cases studied, as long as anisotropic particles could be stably prepared or transferred to 0.05 M CTAB, oligonucleotide functionalization following the above procedure resulted in a dense surface coverage of oligonucleotides and well ordered assemblies mediated through the addition of DNA linkers (see below for details of the synthesis and functionalization of each nanostructure).

nature materials | www.nature.com/naturematerials 3
SUPPLEMENTARY INFORMATIONdoi: 10.1038/nmat2870
3
Gold Nanorod Synthesis, Overgrowth, and Functionalization
Gold nanorods were synthesized using the silver-assisted growth procedure developed by El-Sayed and coworkers3. We observed that nanorods made in this way could not be functionalized with oligonucleotides as evidenced by either particle aggregation during the salting step or a lack of cooperative melting behavior, which indicates low DNA density on a nanoparticle’s surface4. We hypothesized that the difficulty in conjugating thiolated DNA to the particle was due to a thin layer of silver present on the nanorod surface preventing Au-S bond formation. This feature has been proposed as part of the mechanism for the silver-assisted nanorod growth5. In order to overcome this, an additional overgrowth procedure was used to deposit a thin layer of gold on the nanorod, which allowed for facile DNA functionalization.
As-synthesized nanorods were spun down (10 min, 13400 rcf) once and resuspended in water, followed by a second centrifugation to concentrate the particles with resuspension in 0.01 M CTAB. Nanorod concentrations were quantified using optical extinction spectra and the absorbance value at the longitudinal surface plasmon resonance (LSPR) maximum. An extinction coefficient of 1.1 x 10⁹ M-1cm-1 was used for rods with aspect ratio ~4 and an extinction coefficient of 9.1 x 10⁸ M-1cm-1 was used for rods with aspect ratio ~3. A 900 pM solution of nanorods was then prepared in 0.01 M CTAB and sequentially brought to 1 mM ascorbic acid and 0.005 mM HAuCl4. After allowing 30 min to 1 hour for the overgrowth to occur, the solution was then brought to 0.05 M CTAB and functionalized with DNA according to the previously outlined procedure (vide supra). The overgrown nanorods showed minimal change in their optical properties and their dimensions (Figure S1) but showed a significant improvement in their ability to be functionalized with oligonucleotides (Figure S2).
Figure S1. Optimization of nanorod overgrowth. a, Extinction spectra recorded from gold nanorods before (black) and after (red) overgrowth procedure. b-c, TEM images before (b) and after (c) overgrowth procedure. Nanorod dimensions in b are 54 nm ± 10% length, 14 nm ± 12% width. Nanorod dimensions in c are 55 nm ± 7% length, 14 nm ± 10% width.

4 nature materials | www.nature.com/naturematerials
SUPPLEMENTARY INFORMATION doi: 10.1038/nmat2870
4
Figure S2. Confirmation of DNA functionalization of gold nanorods. a-b, Extinction monitored at particle surface plasmon resonance (800 nm) as a function of temperature for nanorods treated with thiolated DNA and assembled with linker oligonucleotides according to the included procedure. a, As-synthesized gold nanorods. b, Nanorods that had been treated with the overgrowth procedure. The sharp melting transition in b (and lack of a similar transition in a) indicates dense surface coverage of DNA was achieved only after nanorod overgrowth.
nature materials | www.nature.com/naturematerials 5
SUPPLEMENTARY INFORMATIONdoi: 10.1038/nmat2870
5
Triangular Nanoprism Synthesis, Functionalization, and Purification
Triangular nanoprisms were synthesized according to Millstone et al.6. Whereas DNA functionalization of triangular nanoprisms has already been demonstrated1, a typical synthesis includes a significant population of impurity spherical particles. In order to probe only the shape directing effects of the nanoprism, these spherical particles needed to be removed. The as-synthesized solution containing both spheres and prisms at 0.05 M CTAB was functionalized with DNA according to the previously outlined procedure (vide supra). After the final step of the DNA functionalization procedure, addition of an oligonucleotide linker with a 5’TGCA3’ “sticky end” resulted in particle aggregation. These aggregates were heated to 55 °C to dissociate all the particles, then both the sphere (530 nm) and prism (900 nm) absorbances were monitored on slow cooling of the solution. Annealing the mixed sphere-prism solutions at a temperature at which prisms reaggregated but spheres remained in solution allowed for selective precipitation of the prisms and subsequent purification by removal of the primarily sphere-containing supernatant. Purified prism samples were washed (6 min, 16100 rcf) three times in a 0.01% SDS solution to remove the 5’TGCA3’ linkers before being concentrated and assembled using linker oligonucleotides.
6 nature materials | www.nature.com/naturematerials
SUPPLEMENTARY INFORMATION doi: 10.1038/nmat2870
6
Rhombic Dodecahedra and Octahedra Synthesis and Functionalization
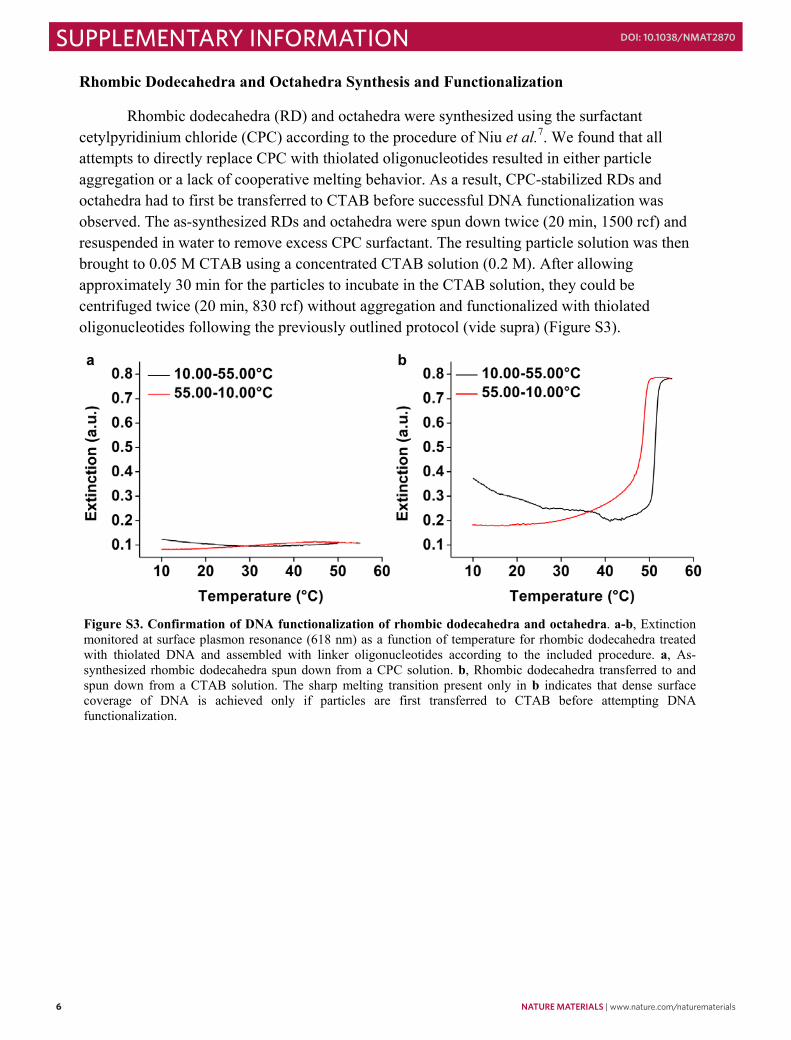
Rhombic dodecahedra (RD) and octahedra were synthesized using the surfactant cetylpyridinium chloride (CPC) according to the procedure of Niu et al.7. We found that all attempts to directly replace CPC with thiolated oligonucleotides resulted in either particle aggregation or a lack of cooperative melting behavior. As a result, CPC-stabilized RDs and octahedra had to first be transferred to CTAB before successful DNA functionalization was observed. The as-synthesized RDs and octahedra were spun down twice (20 min, 1500 rcf) and resuspended in water to remove excess CPC surfactant. The resulting particle solution was then brought to 0.05 M CTAB using a concentrated CTAB solution (0.2 M). After allowing approximately 30 min for the particles to incubate in the CTAB solution, they could be centrifuged twice (20 min, 830 rcf) without aggregation and functionalized with thiolated oligonucleotides following the previously outlined protocol (vide supra) (Figure S3).
Figure S3. Confirmation of DNA functionalization of rhombic dodecahedra and octahedra. a-b, Extinction monitored at surface plasmon resonance (618 nm) as a function of temperature for rhombic dodecahedra treated with thiolated DNA and assembled with linker oligonucleotides according to the included procedure. a, As-synthesized rhombic dodecahedra spun down from a CPC solution. b, Rhombic dodecahedra transferred to and spun down from a CTAB solution. The sharp melting transition present only in b indicates that dense surface coverage of DNA is achieved only if particles are first transferred to CTAB before attempting DNA functionalization.

nature materials | www.nature.com/naturematerials 7
SUPPLEMENTARY INFORMATIONdoi: 10.1038/nmat2870
7
Transmission Electron Microscopy Characterization of Anisotropic Nanostructures
Typically, 10ul of a concentrated nanoparticle solution was drop cast onto a carbon coated copper grid and allowed to dry under vacuum. All images were obtained using a Hitachi 8100 transmission electron microscope operating at 200kV in bright-field mode (Figure S4).
Figure S4. Representative transmission electron microscopy images of each of the anisotropic gold nanostructures synthesized. a, Nanorods 55 nm length, 14 nm width. b, Nanorods 52 nm length, 19 nm width. c, Triangular nanoprisms 140 nm edge length, 7 nm width. d, Triangular nanoprisms 95 nm edge length, 7 nm width. e, Triangular nanoprisms 60 nm edge length, 7 nm width. f, Rhombic dodecahedra 50 nm edge length, 81 nm diameter. g, Rhombic dodecahedra 39 nm edge length, 64 nm diameter. h, Octahedra 59 nm edge length, 83 nm diameter.

8 nature materials | www.nature.com/naturematerials
SUPPLEMENTARY INFORMATION doi: 10.1038/nmat2870
8
Assembly and Crystallization of Anisotropic Nanostructures
Nanoparticle superlattices were achieved via combining the DNA-AuNP solutions with linking DNA strands—a detailed description of the exact procedure can be found in reference 8. The linkers were either purchased from Integrated DNA Technologies or synthesized on an Expedite 8909 Nucleotide Synthesis System (ABI) and all reagents, including 3' C3-thiol phosphoramidites, were obtained from Glen Research; all DNA sequences are shown in Table S1. Note that DNA linkers labeled as n=1-4 contain a repeating 40-base DNA sequence—prior to adding these linkers to the nanoparticle solutions, the linkers were duplexed to n equivalents of a 40-base strand complementary to this sequence. This ensured that the DNA linking the nanoparticles was primarily double stranded, which allows for predictability in DNA length and lattice parameters of the resulting crystals9. The duplexed linkers were added to the solutions of DNA-AuNPs in a 1:1 ratio with estimates for the number of DNA strands per particle10 and allowed to aggregate at room temperature. These solutions were then split and diluted with 0.5M NaCl to concentrations appropriate for either small angle X-ray scattering (SAXS) or melting temperature analyses. The melting temperature of each system was performed in a Cary 100 UV-Vis, monitoring the change in absorbance at the nanoparticle’s predominant plasmon resonance. The solution not used for the melting temperature analysis was then annealed at a temperature ~3-5 degrees below the melting temperature of the assembled particles for a period of 30 minutes to several hours, depending upon the sample. After annealing, the samples were transferred to 2.0 mm quartz capillaries and SAXS analysis was performed.
AuNP-Bound DNA 5'AAG AAT TTA TAA GCA GAA-A10-C3SH3'
Linker DNAs
n=0 5'TTC TGC TTA TAA ATT CTT-A-GCGC3'
n=1 5'TTC TGC TTA TAA ATT CTT-A-(Block Sequence)1-GCGC3'
n=2 5'TTC TGC TTA TAA ATT CTT-A-(Block Sequence)2-GCGC3'
n=3 5'TTC TGC TTA TAA ATT CTT-A-(Block Sequence)3-GCGC3'
n=4 5'TTC TGC TTA TAA ATT CTT-A-(Block Sequence)4-GCGC3'
"Block" Sequence 5'TTT TTT TTT TTT ACT GAG CAG CAC TGA TTT TTT TTT TTT T-A3'
Duplexer Strand 5'AAA AAA AAA AAA ATC AGT GCT GCT CAG TAA AAA AAA AAA A3'
Table S1. DNA Sequences used to assemble crystals. The AuNP bound DNA was attached to the particle surface via gold-sulfur chemistry. Different DNA lengths were achieved via the use of DNA linkers that contained a variable number of "block sequences". Linkers n=1, 2, 3, and 4 were hybridized to n equivalents of the 40-base duplexer strand (which is complementary to the block sequence) prior to adding the linkers to the nanoparticle solutions.
nature materials | www.nature.com/naturematerials 9
SUPPLEMENTARY INFORMATIONdoi: 10.1038/nmat2870
9
Small Angle X-Ray Scattering Characterization of Anisotropic Nanoparticle Superlattices
SAXS experiments were performed at the DuPont-Northwestern-Dow Collaborative Access Team (DND-CAT) beamline of the Advanced Photon Source (APS) at Argonne National Laboratory. Within the SAXS sample holder, temperature was controlled to within 0.1 °C during all analyses. X-rays of wavelength 1.24 Å (10 keV) were used to probe the sample, and the scattering angle was calibrated using silver behenate as a standard. Two sets of slits were used to define and collimate the X-ray beam and a pinhole was used to remove parasitic scattering. The X-ray beam cross-section measured 1.0x1.0 mm2, exposure times varied from 0.05 to 1.0 seconds. The scattered radiation was detected with a CCD area detector. Dark current frames were subtracted from all data; scattering of the buffer, DNA, and capillary were negligible compared to the AuNP scattering in these data.
2-D SAXS patterns were then azimuthally averaged and relative scattering intensity was plotted as a function of scattering vector q:
q=4πsinθ/λ
where θ is the scattering angle and λ is the wavelength of X-ray radiation. Each scan was then divided by the particle’s form factor (the predicted scattering pattern for particles that are completely dissociated) and compared against modeled SAXS patterns for ideal nanoparticle superlattice structures. Calculations to obtain both form factor and ideal superlattice scattering plots are discussed later in this text.
Interparticle spacing in these crystals was determined using the following equations:
1. For a 2D HCP array of rods, the interparticle spacing is calculated as
2√3 2
where dAu is the distance between the centroid of two nearest neighbor particles and q0 is the position of the first order scattering peak.
2. For a linear array of prisms, the interparticle spacing is calculated as
2
3. For an FCC arrangement of rhombic dodecahedra, a BCC arrangement of octahedra, and an FCC arrangement of octahedra, the interparticle spacing is calculated as
√6

10 nature materials | www.nature.com/naturematerials
SUPPLEMENTARY INFORMATION doi: 10.1038/nmat2870
10
Crystal domain sizes were calculated using the Debye-Scherrer equation:
where t is the thickness of the crystal in a direction perpendicular to the scattering planes, λ is the wavelength of the X-rays, β is the radial full-width-half-maximum of the first-order scattering peak and θ is the scattering angle of the first-order scattering peak. The number of unit cells per crystal for the 3-D lattices was calculated assuming a spherical domain with a diameter equal to the crystal thickness t. The number of unit cells per crystal for the 2-D lattices was calculated assuming a circular domain with diameter equal to t. The average and standard deviation of these values listed in table 1 in the main text were calculated by averaging the crystal domain size for all assemblies that formed ordered crystals.

nature materials | www.nature.com/naturematerials 11
SUPPLEMENTARY INFORMATIONdoi: 10.1038/nmat2870
11
Small Angle X-ray Scattering Data for Anisotropic Nanoparticle Superlattices
Figure S5. Small angle X-ray scattering patterns from crystallized nanorods (55 nm length, 14 nm width) with tunable interparticle distances. Here, “n” refers to the number of 40-base segments present in the linker oligonucleotides used to induce crystallization (See Figure 1d, Table S1) with greater values of n resulting in larger interparticle distances, noted by scattering peaks that are shifted to smaller values of q. All samples index to a 2D hexagonal lattice, see Table 1 for calculated lattice parameters.
Figure S6. Small angle X-ray scattering patterns from crystallized nanorods (52 nm length, 19 nm width) with tunable interparticle distances. Here, “n” refers to the number of 40-base segments present in the linker oligonucleotides used to induce crystallization (See Figure 1d, Table S1) with greater values of n resulting in larger interparticle distances, noted by scattering peaks that are shifted to smaller values of q. All samples index to a 2D hexagonal lattice, see Table 1 for calculated lattice parameters.

12 nature materials | www.nature.com/naturematerials
SUPPLEMENTARY INFORMATION doi: 10.1038/nmat2870
12
Figure S7. Small angle X-ray scattering patterns from crystallized triangular nanoprisms (140 nm edge length, 7 nm width) with tunable interparticle distances. Here, “n” refers to the number of 40-base segments present in the linker oligonucleotides used to induce crystallization (See Figure 1d, Table S1) with greater values of n resulting in larger interparticle distances, noted by scattering peaks that are shifted to smaller values of q. All samples index to a 1D columnar lattice, see Table 1 for calculated lattice parameters.
Figure S8. Small angle X-ray scattering patterns from crystallized triangular nanoprisms (95 nm edge length, 7 nm width) with tunable interparticle distances. Here, “n” refers to the number of 40-base segments present in the linker oligonucleotides used to induce crystallization (See Figure 1d, Table S1) with greater values of n resulting in larger interparticle distances, noted by scattering peaks that are shifted to smaller values of q. All samples index to a 1D columnar lattice, see Table 1 for calculated lattice parameters.
nature materials | www.nature.com/naturematerials 13
SUPPLEMENTARY INFORMATIONdoi: 10.1038/nmat2870
13
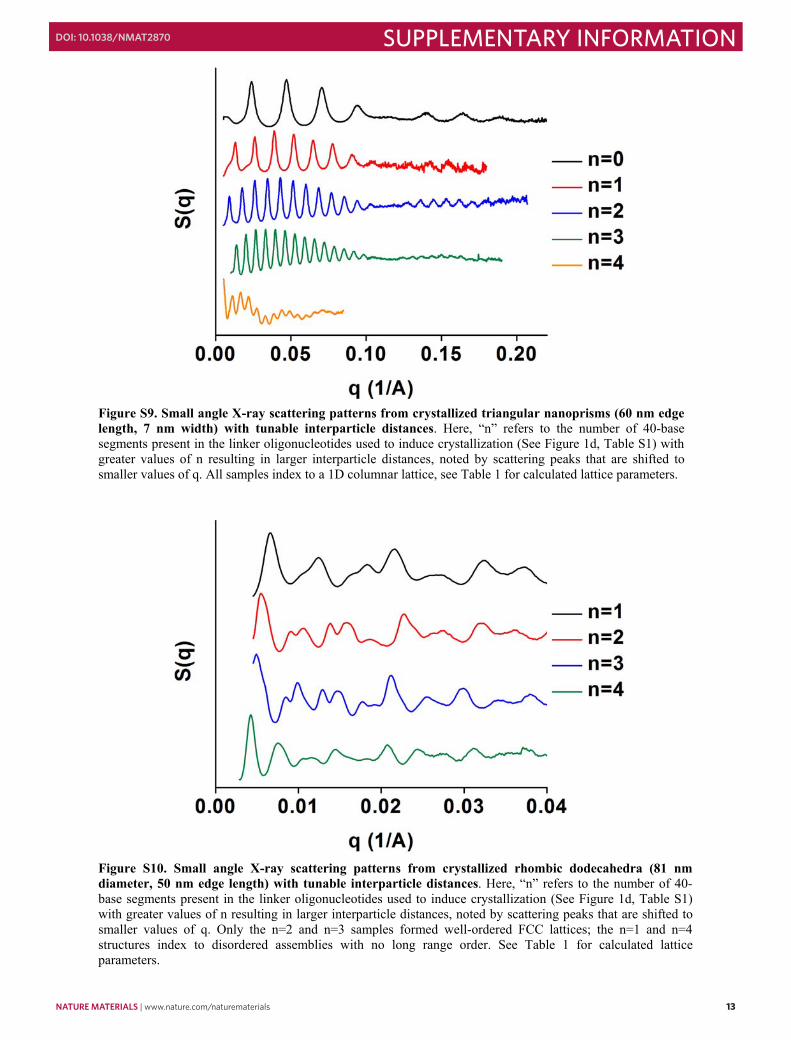
Figure S9. Small angle X-ray scattering patterns from crystallized triangular nanoprisms (60 nm edge length, 7 nm width) with tunable interparticle distances. Here, “n” refers to the number of 40-base segments present in the linker oligonucleotides used to induce crystallization (See Figure 1d, Table S1) with greater values of n resulting in larger interparticle distances, noted by scattering peaks that are shifted to smaller values of q. All samples index to a 1D columnar lattice, see Table 1 for calculated lattice parameters.
Figure S10. Small angle X-ray scattering patterns from crystallized rhombic dodecahedra (81 nm diameter, 50 nm edge length) with tunable interparticle distances. Here, “n” refers to the number of 40-base segments present in the linker oligonucleotides used to induce crystallization (See Figure 1d, Table S1) with greater values of n resulting in larger interparticle distances, noted by scattering peaks that are shifted to smaller values of q. Only the n=2 and n=3 samples formed well-ordered FCC lattices; the n=1 and n=4 structures index to disordered assemblies with no long range order. See Table 1 for calculated lattice parameters.
14 nature materials | www.nature.com/naturematerials
SUPPLEMENTARY INFORMATION doi: 10.1038/nmat2870
14
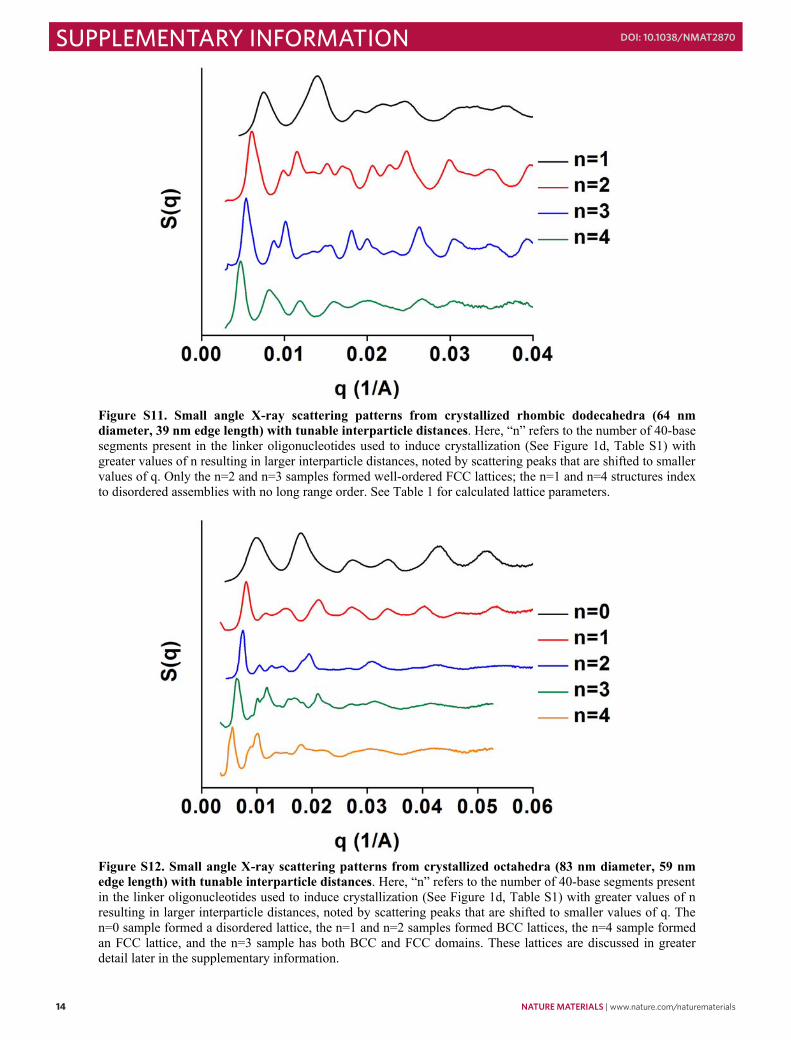
Figure S11. Small angle X-ray scattering patterns from crystallized rhombic dodecahedra (64 nm diameter, 39 nm edge length) with tunable interparticle distances. Here, “n” refers to the number of 40-base segments present in the linker oligonucleotides used to induce crystallization (See Figure 1d, Table S1) with greater values of n resulting in larger interparticle distances, noted by scattering peaks that are shifted to smaller values of q. Only the n=2 and n=3 samples formed well-ordered FCC lattices; the n=1 and n=4 structures index to disordered assemblies with no long range order. See Table 1 for calculated lattice parameters.
Figure S12. Small angle X-ray scattering patterns from crystallized octahedra (83 nm diameter, 59 nm edge length) with tunable interparticle distances. Here, “n” refers to the number of 40-base segments present in the linker oligonucleotides used to induce crystallization (See Figure 1d, Table S1) with greater values of n resulting in larger interparticle distances, noted by scattering peaks that are shifted to smaller values of q. The n=0 sample formed a disordered lattice, the n=1 and n=2 samples formed BCC lattices, the n=4 sample formed an FCC lattice, and the n=3 sample has both BCC and FCC domains. These lattices are discussed in greater detail later in the supplementary information.

nature materials | www.nature.com/naturematerials 15
SUPPLEMENTARY INFORMATIONdoi: 10.1038/nmat2870
15
Transmission Electron Microscopy Characterization of Anisotropic Nanoparticle Superlattices
Two separate sample preparation methods were used preserve the order of nanoparticle superlattices at the expense of significantly reduced lattice parameters. The first method, which was used to prepare samples of nanoprisms, involved drop-casting a solution of nanoprism superlattices onto a TEM grid and quickly wicking away excess solvent. As has been previously shown, removal of buffer from superlattice solutions results in significant reduction in lattice parameters11, but the nanoprisms still retain significant columnar ordering even after removal of solvent (Figure S14). Control experiments confirm that unassembled nanoprisms that are drop-cast and quickly dried do not form ordered assemblies, but rather lay flat on the substrate and are typically found as solitary particles. This indicates that the TEM data corroborate the SAXS data, and that the organization of nanoprisms into 1-D stacks is preserved after drying of the sample.
The second method, utilized to prepare samples of nanorods (Figure S13), rhombic dodecahedra (Figure S15), and octahedra (Figure S16), involved embedding the samples in a resin which could be sectioned and imaged using standard biological TEM techniques. First, the solutions of nanoparticles were repeatedly washed with 0.5 M NaNO3 in order to remove all chloride anions from solution. This was followed by the addition of a solution of 1 M AgNO3; the transfer into a solution of NaNO3 prevented any precipitation of insoluble AgCl upon the addition of AgNO3. An aliquot of 0.1 M NaBH4 was then added to this solution, resulting in instantaneous precipitation of insoluble silver solid. The presence of these large Ag particles provided a handle for centrifugation, embedding, and general manipulation of the nanoparticle superlattices and was found to be necessary to achieve high quality images. The solution was then centrifuged and the buffer was replaced with ethanol resulting in collapse of the DNA12 while maintaining the symmetry of the colloidal crystals.
Once in ethanol, these samples were embedded in EMBed-812 resin (Electron Microscopy Sciences) following standard protocols provided by the manufacturer. The resin was polymerized at 60 °C for 16-20 hours to solidify, then cooled and sectioned with a diamond knife and an ultramicrotome. The resulting sections varied in thickness between ~60 and ~250 nm. TEM images were obtained on a Hitachi HD-2300 transmission electron microscope in Z-contrast mode. These images were then compared with modeled lattices to verify that the particles had indeed retained their ordering, even though their lattice parameters had been significantly reduced.

16 nature materials | www.nature.com/naturematerials
SUPPLEMENTARY INFORMATION doi: 10.1038/nmat2870
16
Figure S13. Representative TEM images of ordered nanorod superlattices. a, Schematic illustration of the orientation of crystallized nanorods (55 nm length, 14 nm width) shown in part b. b, High magnification image of nanorods in a hexagonal arrangement. c, Low magnification image of ordered nanorod superlattices. In both images, sections are ~100 nm thick. Both images correspond to the sample represented in Figure 2b.
Figure S14. Representative TEM images of ordered nanoprism superlattices. a, Schematic illustration of the orientation of crystallized nanoprisms (140 nm edge length) found in part b. b, High magnification image of nanoprisms in a columnar arrangement. c, Low magnification image of ordered nanoprism superlattices. Both images correspond to the system represented in Figure S7, n=1 linker.

nature materials | www.nature.com/naturematerials 17
SUPPLEMENTARY INFORMATIONdoi: 10.1038/nmat2870
17
Figure S15. Representative TEM images of ordered rhombic dodecahedra superlattices. a, Schematic illustration of the orientation of crystallized rhombic dodecahedra (64 nm diameter) found in part b. b, High magnification image of rhombic dodecahedra in an FCC arrangement. c, Low magnification image of ordered rhombic dodecahedra superlattices. In both TEM images, sections are ~180 nm thick. Both images correspond to the sample represented in Figure 2f.
Figure S16. Representative TEM images of ordered octahedra superlattices. a, Schematic illustration of the orientation of crystallized octahedra (83 nm diameter) found in part b. b, High magnification image of octahedra in a BCC arrangement. c, Low magnification image of ordered octahedra superlattices. In part b sections are ~150 nm thick, and in part c sections are ~250 nm thick. Both images correspond to the sample represented in Figure 3c.
18 nature materials | www.nature.com/naturematerials
SUPPLEMENTARY INFORMATION doi: 10.1038/nmat2870
18
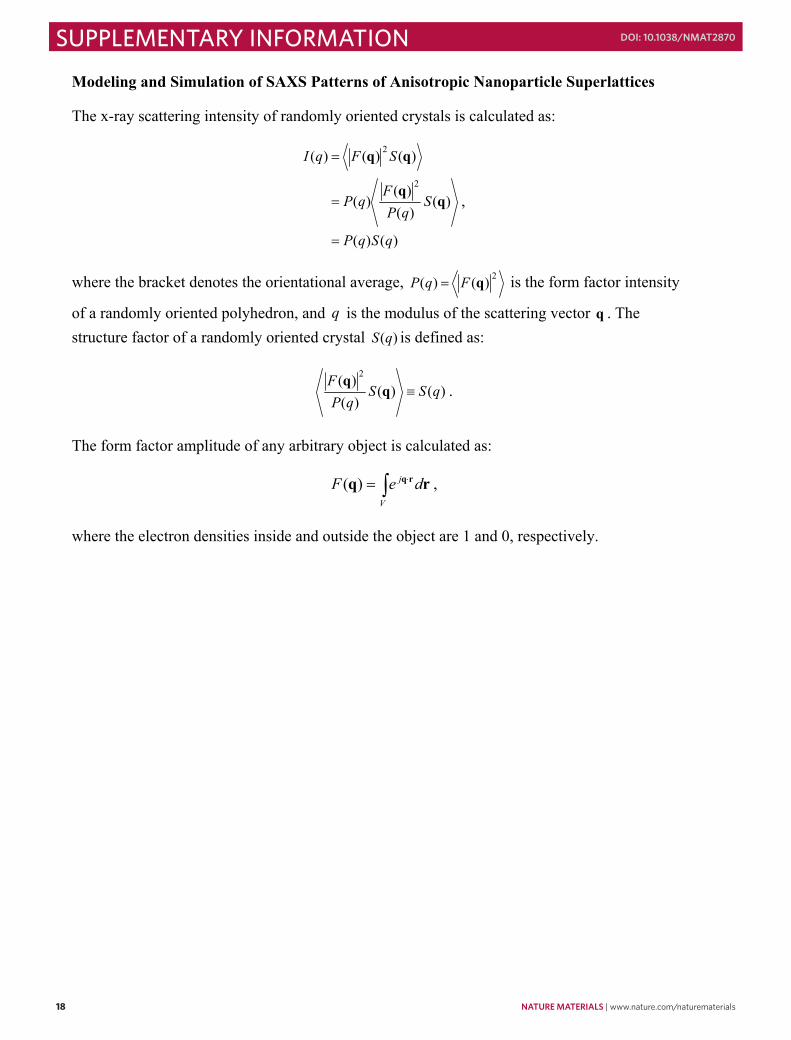
Modeling and Simulation of SAXS Patterns of Anisotropic Nanoparticle Superlattices
The x-ray scattering intensity of randomly oriented crystals is calculated as:
)()(
)()()(
)(
)()()(
2
2
qSqP
SqP
FqP
SFqI
=
=
=
,
where the bracket denotes the orientational average, 2)()( qFqP = is the form factor intensity
of a randomly oriented polyhedron, and q is the modulus of the scattering vector q . The structure factor of a randomly oriented crystal )(qS is defined as:
)()()()( 2
qSSqP
F≡q
q.
The form factor amplitude of any arbitrary object is calculated as:
∫ ⋅=V
j deF rq rq)( ,
where the electron densities inside and outside the object are 1 and 0, respectively.

nature materials | www.nature.com/naturematerials 19
SUPPLEMENTARY INFORMATIONdoi: 10.1038/nmat2870
19
The form factor amplitudes of various polyhedra used in this work are derived as follows13:
1. The form factor of a pyramid
where the length of a bottom edge: 2R; the height of the pyramid: H
2
4
3
2
1
434
433
212
211
4321
34
221
221
221
221
)(sin)(sin
)(sin)(sin
)(sin)(sin
)(sin)(sin
])sin[(])cos[(])sin[(])cos[(),,(
43
43
21
21
HRV
qqq
q
qqq
q
qqq
q
qqq
q
eHqieHqiK
eHqeHqK
eHqieHqiK
eHqeHqK
KRqqKRqqKRqqKRqqqq
HHRF
py
zyx
zyx
zyx
zyx
Hiqc
Hiqc
Hiqc
Hiqc
Hiqc
Hiqc
Hiqc
Hiqc
yxyxyxyxyx
py
=
⎥⎦
⎤⎢⎣
⎡−
+=
⎥⎦
⎤⎢⎣
⎡+
+=
⎥⎦
⎤⎢⎣
⎡−
−=
⎥⎦
⎤⎢⎣
⎡+
−=
+−=
+=
+−=
+=
+−+−−+−=
−
−
−
−
q
xxxc /)sin()(sin =
1J : The Bessel function of first order.

20 nature materials | www.nature.com/naturematerials
SUPPLEMENTARY INFORMATION doi: 10.1038/nmat2870
20
2. The form factor of a cube where the edge length: 2R
3)2(
)(sin)(sin)(sin
RV
RqRqRqVF
cube
zcycxccubecube
=
=
3. The form factor of a cylinder where the radius: R, length: H
HRV
HqRqq
RqqJVF
cyl
zcyx
yxcylcyl
2
22
221 )2/(sin
)(
))((2
π=
⋅+
⋅+=
4. The form factor of an octahedron where the edge length: 2R
3238
2
),],,,([),],,,([),(
RV
RH
HRqqqFHRqqqFRF
och
zyxpyzyxpyoch
=
=
−+=q
nature materials | www.nature.com/naturematerials 21
SUPPLEMENTARY INFORMATIONdoi: 10.1038/nmat2870
21
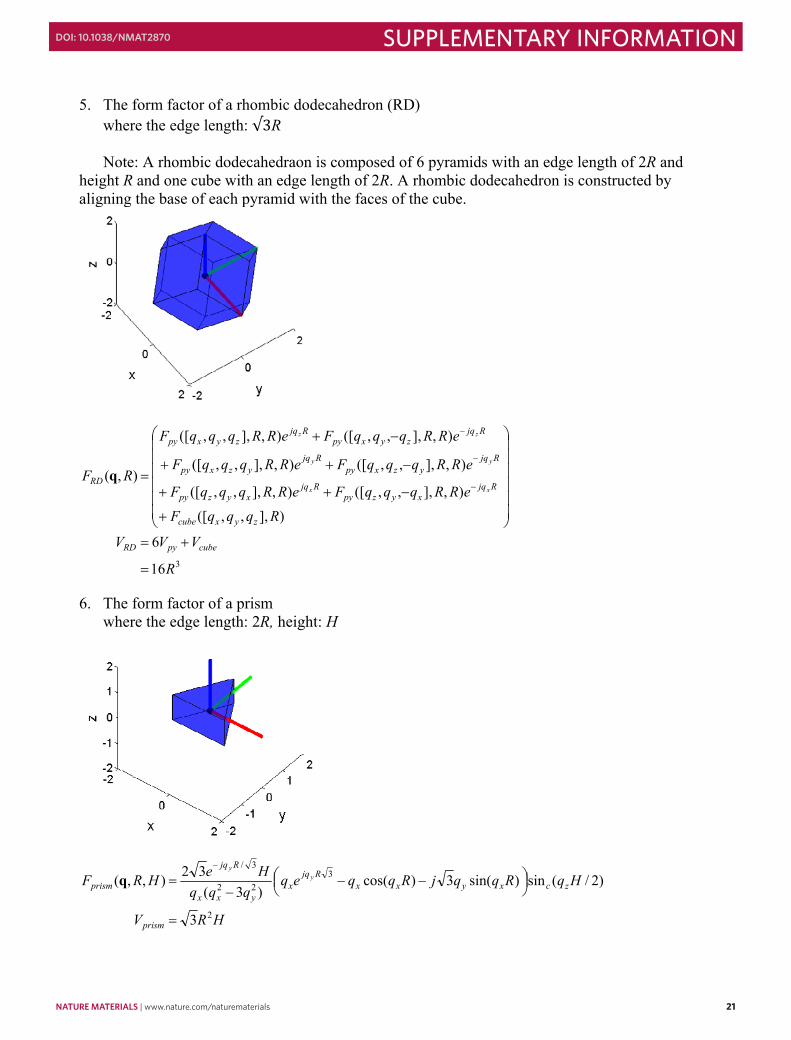
5. The form factor of a rhombic dodecahedron (RD) where the edge length: √3R Note: A rhombic dodecahedraon is composed of 6 pyramids with an edge length of 2R and
height R and one cube with an edge length of 2R. A rhombic dodecahedron is constructed by aligning the base of each pyramid with the faces of the cube.
316
6
)],,,([
),],,,([),],,,([
),],,,([),],,,([
),],,,([),],,,([
),(
R
VVV
RqqqFeRRqqqFeRRqqqF
eRRqqqFeRRqqqF
eRRqqqFeRRqqqF
RF
cubepyRD
zyxcube
Rjqxyzpy
Rjqxyzpy
Rjqyzxpy
Rjqyzxpy
Rjqzyxpy
Rjqzyxpy
RDxx
yy
zz
=
+=
⎟⎟⎟⎟⎟⎟
⎠
⎞
⎜⎜⎜⎜⎜⎜
⎝
⎛
+
−++
−++
−+
=−
−
−
q
6. The form factor of a prism where the edge length: 2R, height: H
HRV
HqRqqjRqqeqqqq
HeHRF
prism
zcxyxxRjq
xyxx
Rjq
prismy
y
2
322
3/
3
)2/(sin)sin(3)cos()3(
32),,(
=
⎟⎠⎞⎜
⎝⎛ −−
−=
−
q

22 nature materials | www.nature.com/naturematerials
SUPPLEMENTARY INFORMATION doi: 10.1038/nmat2870
22
The form factor intensity of a randomly oriented polyhedron )(qP is calculated as:
∫ ∫ −=π π
ϕθθθϕθϕθ2
0 0
2 sin|)cos,sinsin,cossin(|)( ddqqqFqP
For this work the structure factor of a randomly oriented crystal is obtained experimentally
meas
measmeas qP
qIqS)()()( =
and theoretically
22
2
1
)(22 )2/()(
)2/(|)(|)(
)(222
Lhkl
Laqm
hkl
n
i
lzkyhxjhkl
calchklhklcalc qq
eeRFqPqcqS hklD
hkl ciii
σπσσπ
+−⋅= −
=
++∑ ∑q .
Experimental measqP )( are obtained by raising the temperature of the DNA-NP solutions to a temperature at which the nanoparticles dissociate (typically > 55 °C). In the calculation of the structure factor, 1/ 2
hklq is the Lorentz factor and c is a constant. calchklqP )( is the calculated form factor intensity for a randomly oriented particle at hklqq = for hkl reflections. )( hklRF q⋅ is the amplitude of the form factor for an oriented particle in a unit cell. M is the rotation matrix for a particle in a unit cell. In this work, Rodrigues' rotation formula is used. hklm is the multiplicity of
a hkl. ( iii zyx ,, ) is the fractional coordinate of i th of particles in a unit cell. 222 aqhklDe σ− is the
Debye-Waller factor or lattice disorder factor, where Dσ and a are the disorder parameter and the nearest neighbor distance, respectively. In this work, Dσ less than 0.01 is used. Peak shape is
approximated with the Lorentz function, 22 )2/()()2/(
Lhkl
L
qq σπσ
+−, where Lσ is the width of Lorentz
function. In this work, Lσ =5·10-3.
nature materials | www.nature.com/naturematerials 23
SUPPLEMENTARY INFORMATIONdoi: 10.1038/nmat2870
23
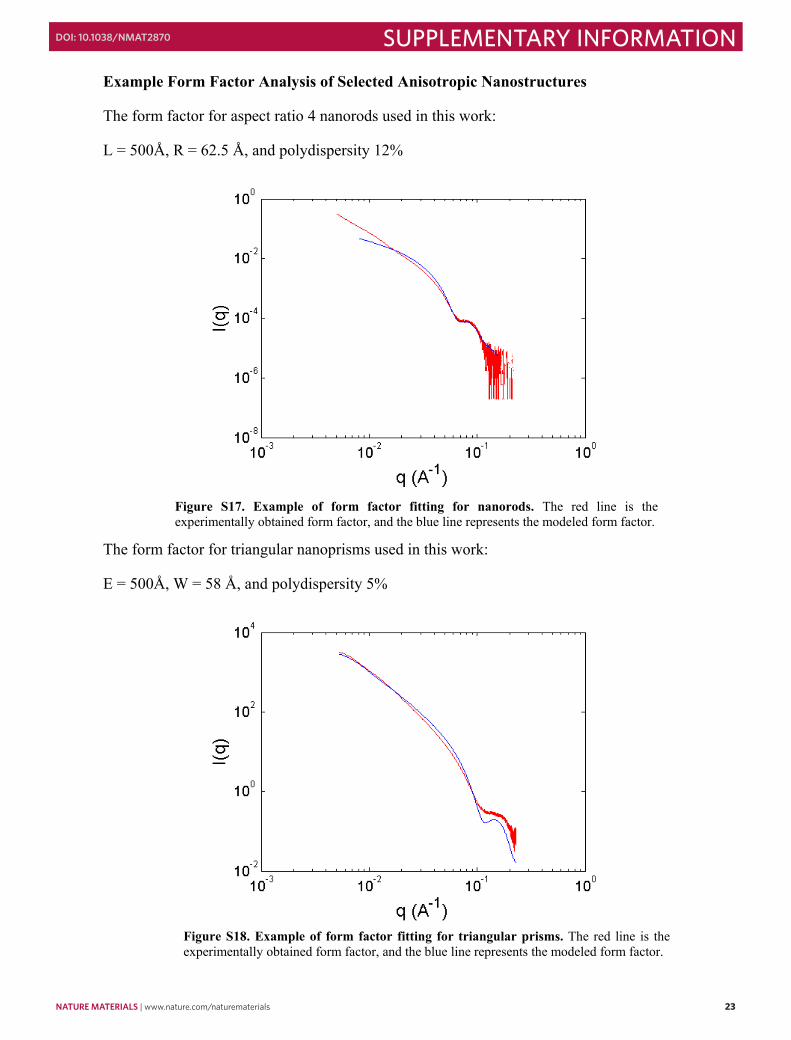
Example Form Factor Analysis of Selected Anisotropic Nanostructures
The form factor for aspect ratio 4 nanorods used in this work:
L = 500Å, R = 62.5 Å, and polydispersity 12%
The form factor for triangular nanoprisms used in this work:
E = 500Å, W = 58 Å, and polydispersity 5%
Figure S17. Example of form factor fitting for nanorods. The red line is the experimentally obtained form factor, and the blue line represents the modeled form factor.
Figure S18. Example of form factor fitting for triangular prisms. The red line is the experimentally obtained form factor, and the blue line represents the modeled form factor.

24 nature materials | www.nature.com/naturematerials
SUPPLEMENTARY INFORMATION doi: 10.1038/nmat2870
24
The form factor for rhombic dodecahedra used in this work:
R = 210.3, polydispersity 6%
The form factor for octahedra used in this work:
R=327.87, polydispersity 6%
Figure S19. Example of form factor fitting for rhombic dodecahedra. The red line is the experimentally obtained form factor, and the blue line represents the modeled form factor.
Figure S20. Example of form factor fitting for octahedra. The red line is the experimentally obtained form factor, and the blue line represents the modeled form factor.

nature materials | www.nature.com/naturematerials 25
SUPPLEMENTARY INFORMATIONdoi: 10.1038/nmat2870
25
Supplementary Discussion
Evidence of Primarily 2-D Ordering in Superlattices of Gold Nanorods
Whereas the scattering pattern and model presented in the text (Figure 2b) correspond to 2-D sheets of hexagonally packed nanorods that have ordered into a 3-D HCP structure, the majority of SAXS patterns obtained from nanorod crystals consisted of only 2-D ordered sheets (Figure S5, S6). A modeled scattering pattern of a perfect 2-D hexagonal crystal shows excellent agreement with the experimental SAXS data obtained for most of the nanorod superlattices (Figure S21a). The peaks corresponding to 2-D hexagonal order also appear in the scattering pattern presented for the HCP structure (Figure S21b) with the peaks that are unaccounted for by the model for the 2-D lattice matching well with the additional peaks included in the modeled 3-D structure (Figure 2b).
Figure S21. Observation of predominantly 2-D ordering in superlattices of gold nanorods. a, A scattering pattern representative of the majority of crystallized nanorod samples (blue) (see Figure S5) with the ideal scattering pattern from a perfect crystal with only 2-D hexagonal order (red). The agreement between the experimental and modeled peaks, in conjunction with the absence of any additional scattering peaks, suggests very little ordering between 2-D sheets of nanorods. b, A scattering pattern from a nanorod sample that underwent extensive thermal annealing, which ultimately resulted in 3-D ordering (blue trace, same as in Figure 2b), with the ideal scattering pattern from a perfect crystal with only 2-D hexagonal order (red). The scattering patterns match well but several peaks that are present in the experimental data are not present in the modeled pattern; these peaks are represented in the 3-D HCP model presented in Figure 2b.

26 nature materials | www.nature.com/naturematerials
SUPPLEMENTARY INFORMATION doi: 10.1038/nmat2870
26
Evidence for the Transition from 2-D to 3-D Order in Nanorod Superlattices
In situ monitoring of a sample of nanorods during the annealing process demonstrated that it is the 2-D hexagonal layers of nanorods that crystallize first, and that 3-D ordering is only observed after long-range 2-D ordering is already present in the sample. This is noted by the fact that peaks corresponding to 2-D ordering of the rods are present in all scans, albeit with only short-range order at room temperature (Figure S22). As the temperature increases and more thermal energy is provided to the system, reorganization occurs and the domain size of the 2-D sheets increases (as indicated by the narrower, more well-defined peaks). It is only after significant annealing that peaks corresponding to 3-D ordering between 2-D sheets are observed (arrows, 57 °C scans).
Figure S22. Analysis of the crystallization process of nanorods. Temperature-resolved SAXS scans of nanorods (55 nm length, 14 nm width) with the n=2 linker, starting at low temperatures, then gradually increasing to just below the melting temperature of the sample (~57 °C), where the sample was held for several minutes and scanned again.
nature materials | www.nature.com/naturematerials 27
SUPPLEMENTARY INFORMATIONdoi: 10.1038/nmat2870
27
The Possibility of Orientational Ordering Between 1-D Columns of Nanoprisms
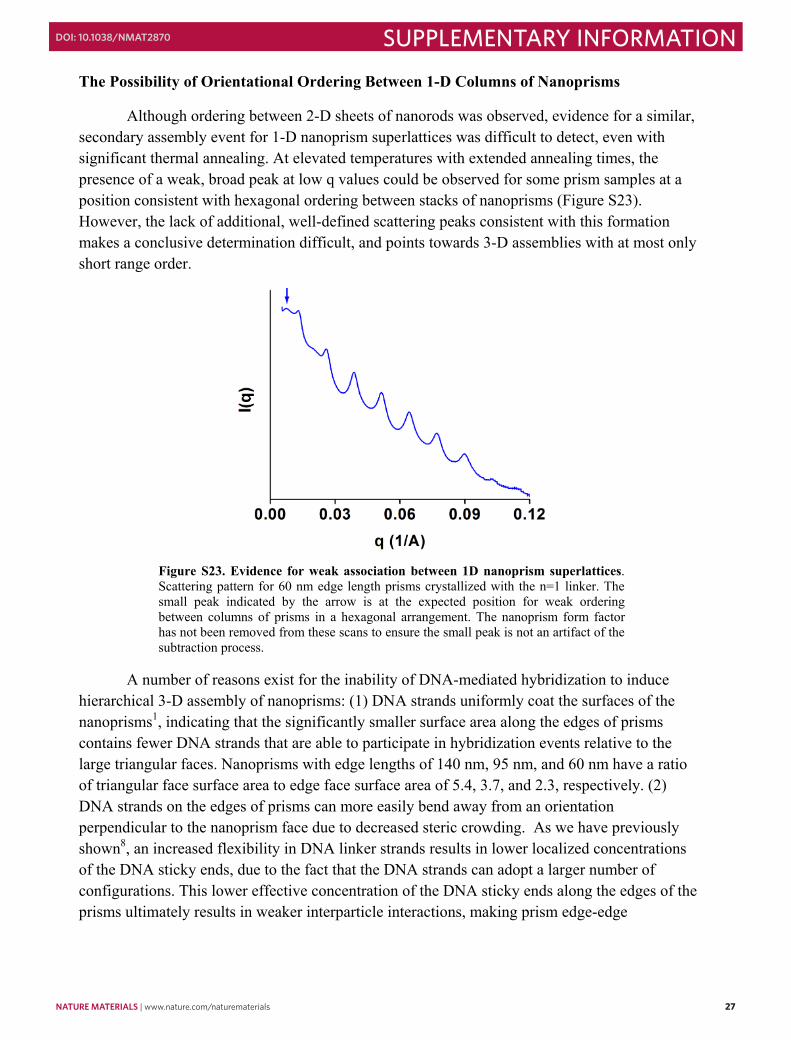
Although ordering between 2-D sheets of nanorods was observed, evidence for a similar, secondary assembly event for 1-D nanoprism superlattices was difficult to detect, even with significant thermal annealing. At elevated temperatures with extended annealing times, the presence of a weak, broad peak at low q values could be observed for some prism samples at a position consistent with hexagonal ordering between stacks of nanoprisms (Figure S23). However, the lack of additional, well-defined scattering peaks consistent with this formation makes a conclusive determination difficult, and points towards 3-D assemblies with at most only short range order.
A number of reasons exist for the inability of DNA-mediated hybridization to induce hierarchical 3-D assembly of nanoprisms: (1) DNA strands uniformly coat the surfaces of the nanoprisms1, indicating that the significantly smaller surface area along the edges of prisms contains fewer DNA strands that are able to participate in hybridization events relative to the large triangular faces. Nanoprisms with edge lengths of 140 nm, 95 nm, and 60 nm have a ratio of triangular face surface area to edge face surface area of 5.4, 3.7, and 2.3, respectively. (2) DNA strands on the edges of prisms can more easily bend away from an orientation perpendicular to the nanoprism face due to decreased steric crowding. As we have previously shown8, an increased flexibility in DNA linker strands results in lower localized concentrations of the DNA sticky ends, due to the fact that the DNA strands can adopt a larger number of configurations. This lower effective concentration of the DNA sticky ends along the edges of the prisms ultimately results in weaker interparticle interactions, making prism edge-edge
Figure S23. Evidence for weak association between 1D nanoprism superlattices. Scattering pattern for 60 nm edge length prisms crystallized with the n=1 linker. The small peak indicated by the arrow is at the expected position for weak ordering between columns of prisms in a hexagonal arrangement. The nanoprism form factor has not been removed from these scans to ensure the small peak is not an artifact of the subtraction process.

28 nature materials | www.nature.com/naturematerials
SUPPLEMENTARY INFORMATION doi: 10.1038/nmat2870
28
association less stable than face-face association8. (3) After assembling into 1-D superlattices, distances between nanoprisms range from ~25 to ~115 nm. Since nanoprisms are ~7 nm thick, the side of a column of assembled nanoprisms consists of small ~7 nm patches of DNA spaced by considerable distances. This means that, even in 1-D stacks of prisms, the DNA density perpendicular to the prism edges (along the length of a stack), is significantly lower than what is observed perpendicular to the faces of the prisms. It is possible for stacks to make weak associations with each other without registry of the prisms, which results in the relatively disordered 3-D assemblies of prism superlattices observed in Figure S23. However, a perfectly ordered 3-D lattice is unlikely to occur, as it is not significantly favorable over other, more disordered states.
While entropic effects have been shown to induce ordering between plate and rod-like objects as in nematic and discotic columnar liquid crystalline phases, this type of assembly requires nanoparticle concentrations significantly higher than what has been used in this work (crystallized nanoprisms are at most 200 nM). For example, Lekkerkerker and coworkers found nematic phases of plate-like nanostructures at concentrations above ~30 µM14, and Zhang et al. showed that ordering between columnar stacks of triangular nanoprisms occurs at concentrations of ~50 µM15. Therefore, although entropic effects may direct the formation of liquid crystalline phases of 1-D columns of nanoprisms at high concentrations, this study focuses on relatively dilute concentration regimes wherein DNA-mediated interactions are more relevant.

nature materials | www.nature.com/naturematerials 29
SUPPLEMENTARY INFORMATIONdoi: 10.1038/nmat2870
29
Origin of Oscillations in the Intensity of Diffraction Peaks from Assembled Triangular Nanoprisms
After form factor correction, nearly all columnar superlattices of triangular nanoprisms exhibit a distinct oscillation in the intensity of the scattering pattern (Figure 2d, S7, S8, S9). The oscillation in peak intensities can be attributed to the uniform thickness of the prism; this effect is commonly observed in SAXS investigations of lipid bilayers16. Importantly, this oscillation does not affect the positions of the scattering peaks which are used to determine lattice spacing and domain size.

30 nature materials | www.nature.com/naturematerials
SUPPLEMENTARY INFORMATION doi: 10.1038/nmat2870
30
Evidence for the Orientational Alignment of Rhombic Dodecahedra in FCC Superlattices In order to probe the orientational alignment of rhombic dodecahedra within a superlattice, several probable cases were modeled and compared to the experimental scattering plot. The modeled data in which face-to-face association is maximized shows the best correlation to the experimental data (Figure S24, S25). Rotation around [0, 0, 1] with an angle = 0
0
1000
2000 0
1000
2000
0
1000
2000
ba
c
0 500 1000 1500 2000
0
500
1000
1500
2000
bc
0.01 0.02 0.03 0.04 0.050
1
2
3
4
5
q (A-1)
S(q
)
Figure S24. Schematic illustration of rhombic dodecahedra in an FCC lattice with a rotation angle about [0, 0, 1] of 0. All rhombic dodecahedra are equivalent in this lattice, but are displayed with two different colors to aid in visualization of the 3D unit cell.
Figure S25. Comparison of experimental and simulated scattering patterns to investigate rhombic dodecahedra orientational alignment. Experimental SAXS data for rhombic dodecahedra (blue) with simulated peaks for rhombic dodecahedra in an FCC arrangement with a rotation angle about [0, 0, 1] of 0 (black and red). The excellent agreement between the experiment and the simulation suggest rhombic dodecahedra adopt a preferential face-to-face orientation within the FCC unit cell.
nature materials | www.nature.com/naturematerials 31
SUPPLEMENTARY INFORMATIONdoi: 10.1038/nmat2870
31
Rotation around [0, 0, 1] with an angle = π /4
0
1000
2000 01000
2000
0
1000
2000
ba
c
0 500 1000 1500 2000
0
500
1000
1500
2000
b
c
0.01 0.02 0.03 0.04 0.050
1
2
3
4
5
q (A-1)
S(q
)
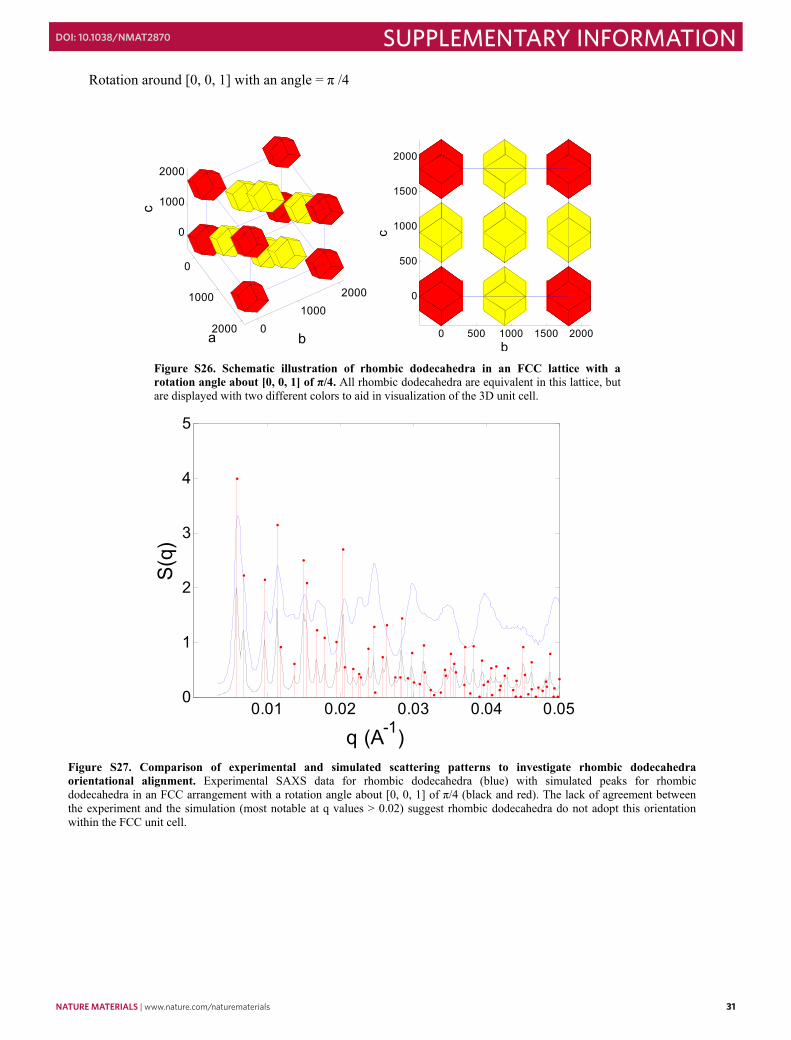
Figure S26. Schematic illustration of rhombic dodecahedra in an FCC lattice with a rotation angle about [0, 0, 1] of π/4. All rhombic dodecahedra are equivalent in this lattice, but are displayed with two different colors to aid in visualization of the 3D unit cell.
Figure S27. Comparison of experimental and simulated scattering patterns to investigate rhombic dodecahedra orientational alignment. Experimental SAXS data for rhombic dodecahedra (blue) with simulated peaks for rhombic dodecahedra in an FCC arrangement with a rotation angle about [0, 0, 1] of π/4 (black and red). The lack of agreement between the experiment and the simulation (most notable at q values > 0.02) suggest rhombic dodecahedra do not adopt this orientation within the FCC unit cell.

32 nature materials | www.nature.com/naturematerials
SUPPLEMENTARY INFORMATION doi: 10.1038/nmat2870
32
Rotation around [0, 0, 1] with an angle = π /3
01000
2000
0
1000
2000
0
1000
2000
ab
c
0 500 1000 1500 2000
0
500
1000
1500
2000
b
c
0.01 0.02 0.03 0.04 0.050
1
2
3
4
5
q (A-1)
S(q
)
Figure S28. Schematic illustration of rhombic dodecahedra in an FCC lattice with a rotation angle about [0, 0, 1] of π/3. All rhombic dodecahedra are equivalent in this lattice, but are displayed with two different colors to aid in visualization of the 3D unit cell.
Figure S29. Comparison of experimental and simulated scattering patterns to investigate rhombic dodecahedra orientational alignment. Experimental SAXS data for rhombic dodecahedra (blue) with simulated peaks for rhombic dodecahedra in an FCC arrangement with a rotation angle about [0, 0, 1] of π/3 (black and red). The lack of agreement between the experiment and the simulation suggest rhombic dodecahedra do not adopt this orientation within the FCC unit cell.

nature materials | www.nature.com/naturematerials 33
SUPPLEMENTARY INFORMATIONdoi: 10.1038/nmat2870
33
Analysis and Discussion of the Assembly of Octahedra with Short and Intermediate DNA Lengths
As has been previously stated8,17, the driving force for DNA-mediated nanoparticle crystallization is the maximization of DNA hybridization interactions between particles – this can be correlated with the maximum amount of face-to-face overlap between neighboring nanostructures. When considering octahedra, it is important to note that it is not possible to align the particles in an ordered lattice with completely commensurate face-to-face interactions. Therefore, in order to determine the 3D structure of octahedra assembled with short DNA strands (Figure 3b), different possible lattices were examined.
First, the theoretical densest packing of octahedra18 is presented as follows:
This structure has two types of face-to-face interactions:
Type A Type B
-5000
5001000 -500
0500
10001500
-500
0
500
1000
1500
ba
c
Figure S30. Schematic illustration of the densest packing of octahedra. All octahedra are equivalent, however, different colors are used to aid visualization of the 3D lattice.
Figure S31. Schematic illustration of two types of face-to-face interactions present in the densest packing of octahedra structure with an interparticle distance of 0 nm. Different colors are used to aid in visualization of the face-to-face interactions. Interactions of type A exhibit much greater face-to-face overlap between nearest neighbors, which results in a greater number of favorable hybridization interactions between DNA linking strands.

34 nature materials | www.nature.com/naturematerials
SUPPLEMENTARY INFORMATION doi: 10.1038/nmat2870
34
2 of 8 faces of the octahedra exhibit type A interactions with their nearest neighbors, while 6 of 8 faces exhibit type B interactions.
When assembling octahedra with DNA linkers, the face-to-face distance between particles is uniformly increased by the length of the DNA strands. In this case, type B interactions exhibit reduced face-to-face overlap with increasing lattice parameters, due to the geometry of the lattice18 (Figure S32). (The amount of face-to-face overlap of type A does not change with increasing particle distance.) This indicates that, when assembling octahedra with DNA, the theoretical densest packing of octahedra is not an optimal structure, as it has minimal face-to-face overlap between neighboring particles and therefore minimal DNA hybridization interactions.
Other experimentally obtained lattices19-20 exhibit the same problem—minimal face-to-face overlap is achieved when the particles are aligned in these structures. Importantly, this problem is exacerbated when the lattice parameters increase.
Based on previous calculations8-9 and comparisons with the DNA lengths for the assemblies studied in this work, we can estimate that the DNA length for the shortest interparticle distance (n=0) is approximately 15 nm. If we calculate the scattering pattern for octahedra assembled with 15nm DNA linkers into the lattice described above, the lattice parameters should be 122 nm and 68.5 nm for a and c, respectively (Figure S33, S34).
Figure S32. Schematic illustration of two types of face-to-face interactions present in the densest packing of octahedra structure with particles separated by 15 nm DNA linkers. Different colors are used to aid in visualization of the face-to-face interactions.

nature materials | www.nature.com/naturematerials 35
SUPPLEMENTARY INFORMATIONdoi: 10.1038/nmat2870
35
While the simulation does present a limited degree of matching with the experimental data, there is little correlation for peak intensities at q values > 0.025 and in peak positions at q values > 0.03. Additionally, the breadth of the peaks indicates that, despite a small amount of correspondence with the predicted scattering pattern, there is no long range order (which would
Figure S33. Schematic illustration of the densest packing of octahedra for short (15 nm) DNA lengths.
Figure S34. Evidence of a disordered arrangement of octahedra with short DNA lengths. Experimental scattering pattern from octahedra with short DNA length (blue) with simulated scattering pattern from octahedra in a densest packed arrangement (black and red) with 15 face-to-face distance (Figure S33). The lack of agreement between the experiment and the simulation at large q values suggest octahedra do not adopt a dense packed arrangement for short DNA lengths.

36 nature materials | www.nature.com/naturematerials
SUPPLEMENTARY INFORMATION doi: 10.1038/nmat2870
36
manifest as sharp diffraction peaks, as can be seen in most other scattering patterns presented in this work).
Secondly, we considered the possibility of octahedra packing into a BCC lattice with short DNA. This presented a logical choice, as longer DNA linkers crystallized octahedra into BCC lattices (Figure 3c, S12). We again assume that the face-to-face distance for nearest neighbor particles is 15nm. In this case, the lattice parameter should be 79.2 nm, and the amount of face-to-face overlap should be increased relative to the theoretically determined densest packing (vide supra), as each particle should have 8 interactions of type A instead of 2. However, the particle and lattice geometries prevent this from being a stable structure, as this lattice parameter would result in overlap between the particle tips (Figure S35).
This indicates that this lattice is not possible unless the particle tips are significantly truncated. However, even assuming that the particle tips are truncated enough to allow such a structure, the modeled scattering pattern does not provide a good match to the experimental data (Figure S36).
Figure S35. Schematic illustration of the BCC packing of octahedra for short (15 nm) DNA lengths showing overlap between particles.

nature materials | www.nature.com/naturematerials 37
SUPPLEMENTARY INFORMATIONdoi: 10.1038/nmat2870
37
Of the lattices presented above, the experimental data of octahedra assembled with short DNA match more closely to the densest packed structure than to the BCC packing. However, thermodynamically we would predict that the BCC lattice should be the preferred structure considering its larger degree of face-to-face interactions. The interplay between these and other possible structures, combined with the relative rigidity of short DNA results in frustration of the assembled structure8, which in turn causes only short range order as demonstrated in the pair distribution function below:
Figure S36. Evidence of a disordered arrangement of octahedra with short DNA lengths. Experimental scattering pattern from octahedra with short DNA length (blue) with simulated scattering pattern from octahedra in a BCC arrangement (black and red) with 15 face-to-face distance (Figure S35). The lack of agreement between the experiment and the simulation suggest octahedra do not adopt a BCC arrangement for short DNA lengths.
Figure S37. Pair distribution function analysis of octahedra superlattice scattering patterns. Pair distribution functions for assembled octahedra with short (blue, n=0) and intermediate (red, n=1) DNA lengths.

38 nature materials | www.nature.com/naturematerials
SUPPLEMENTARY INFORMATION doi: 10.1038/nmat2870
38
From these curves, the nearest center-to-center distances for the two samples are obtained: 76.8 nm for the n=0 linker (blue) and 105 nm for the n=1 linker (red, presented as a comparison). The distance between the center of an octahedron and the center of one of its faces is 23.9 nm. This means that, if the particles were aligned in a commensurate face-to-face arrangement, the interparticle distance for the n=0 linker would be predicted to be ~63 nm — much lower than the interparticle distance calculated via the PDF. This indicates that the lattice does not exhibit significant ordering through commensurate face-to-face interactions. Additionally, the octahedra superlattice with short, n=0 DNA (blue curve) has much shorter range ordering than that with intermediate DNA (red curves) as seen from the fast damping of correlation peaks.
nature materials | www.nature.com/naturematerials 39
SUPPLEMENTARY INFORMATIONdoi: 10.1038/nmat2870
39
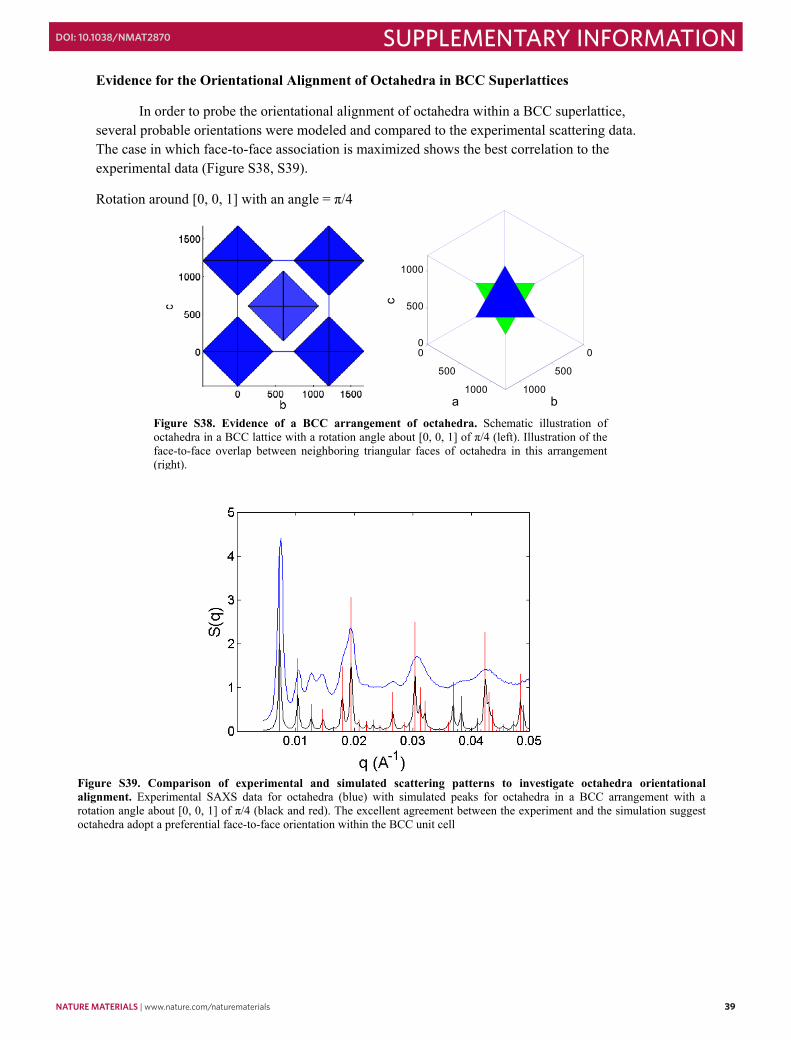
Evidence for the Orientational Alignment of Octahedra in BCC Superlattices
In order to probe the orientational alignment of octahedra within a BCC superlattice, several probable orientations were modeled and compared to the experimental scattering data. The case in which face-to-face association is maximized shows the best correlation to the experimental data (Figure S38, S39).
Rotation around [0, 0, 1] with an angle = π/4
0
500
1000
0
500
1000
0
500
1000
bac
Figure S38. Evidence of a BCC arrangement of octahedra. Schematic illustration of octahedra in a BCC lattice with a rotation angle about [0, 0, 1] of π/4 (left). Illustration of the face-to-face overlap between neighboring triangular faces of octahedra in this arrangement (right).
Figure S39. Comparison of experimental and simulated scattering patterns to investigate octahedra orientational alignment. Experimental SAXS data for octahedra (blue) with simulated peaks for octahedra in a BCC arrangement with a rotation angle about [0, 0, 1] of π/4 (black and red). The excellent agreement between the experiment and the simulation suggest octahedra adopt a preferential face-to-face orientation within the BCC unit cell

40 nature materials | www.nature.com/naturematerials
SUPPLEMENTARY INFORMATION doi: 10.1038/nmat2870
40
Rotation around [0, 0, 1] with an angle = 0
Figure S40. Schematic illustration of octahedra in a BCC lattice with a rotation angle about [0, 0, 1] of 0.
Figure S41. Comparison of experimental and simulated scattering patterns to investigate octahedra orientational alignment. Experimental SAXS data for octahedra (blue) with simulated peaks for octahedra in a BCC arrangement with a rotation angle about [0, 0, 1] of 0 (black and red). The poor correlation between the experiment and the simulation relative to the π/4 rotation angle case suggests octahedra do not adopt this orientation within the BCC unit cell.

nature materials | www.nature.com/naturematerials 41
SUPPLEMENTARY INFORMATIONdoi: 10.1038/nmat2870
41
Rotation around [0, 0, 1] with an angle = π/3
Figure S42. Schematic illustration of octahedra in a BCC lattice with a rotation angle about [0, 0, 1] of π/3.
Figure S43. Comparison of experimental and simulated scattering patterns to investigate octahedra orientational alignment. Experimental SAXS data for octahedra (blue) with simulated peaks for octahedra in a BCC arrangement with a rotation angle about [0, 0, 1] of π/3 (black and red). The poor correlation between the experiment and the simulation relative to the π/4 rotation angle case suggests octahedra do not adopt this orientation within the BCC unit cell.

42 nature materials | www.nature.com/naturematerials
SUPPLEMENTARY INFORMATION doi: 10.1038/nmat2870
42
Evidence for a BCC to FCC Phase Transformation in Octahedra Superlattices
In addition to observing a BCC lattice of octahedra for intermediate DNA lengths (n = 1, 2) and an FCC lattice of octahedra for long DNA (n = 4), we also observed a scattering pattern which indicates both BCC and FCC lattices are present for a DNA length in-between these two cases (n = 3). In this scattering plot, peaks are observed that index to both BCC and FCC ordering (Figure S44). We hypothesize that at this DNA length there are domains of each type of lattice within the sample, which provides further evidence of a nanoparticle superlattice phase transformation as a function of DNA length and nanostructure shape.
Figure S44. Evidence of a phase transformation in assembled octahedra. Whereas octahedra crystallized with short DNA lengths (n=1,2) showed BCC ordering and octahedra crystallized with long DNA (n=4) showed FCC ordering (Figure 3c,d; Figure S12), an intermediate DNA length (n=3) demonstrated both BCC and FCC ordering. Experimental data (blue) exhibit peaks corresponding to both a BCC arrangement of octahedra with orientational order (red) and an FCC arrangement of octahedra without orientational order (grey). Arrows denote specific peaks which are unique to BCC (red) and FCC (grey) lattices.

nature materials | www.nature.com/naturematerials 43
SUPPLEMENTARY INFORMATIONdoi: 10.1038/nmat2870
43
References
1 Millstone, J. E. et al. DNA-Gold Triangular Nanoprism Conjugates. Small 4, 2176-2180 (2008).
2 Hill, H. D. & Mirkin, C. A. The bio-barcode assay for the detection of protein and nucleic acid targets using DTT-induced ligand exchange. Nat. Protoc. 1, 324-336 (2006).
3 Nikoobakht, B. & El-Sayed, M. A. Preparation and Growth Mechanism of Gold Nanorods (NRs) Using Seed-Mediated Growth Method. Chem. Mater. 15, 1957-1962 (2003).
4 Jin, R., Wu, G., Li, Z., Mirkin, C. A. & Schatz, G. C. What Controls the Melting Properties of DNA-Linked Gold Nanoparticle Assemblies? J. Am. Chem. Soc. 125, 1643-1654 (2003).
5 Liu & Guyot-Sionnest, P. Mechanism of Silver(I)-Assisted Growth of Gold Nanorods and Bipyramids. J. Phys. Chem. B. 109, 22192-22200 (2005).
6 Millstone, J. E., Wei, W., Jones, M. R., Yoo, H. & Mirkin, C. A. Iodide Ions Control Seed-Mediated Growth of Anisotropic Gold Nanoparticles. Nano Lett. 8, 2526-2529 (2008).
7 Niu, W. et al. Selective Synthesis of Single-Crystalline Rhombic Dodecahedral, Octahedral, and Cubic Gold Nanocrystals. J. Am. Chem. Soc. 131, 697-703 (2008).
8 Macfarlane, R. J. et al. Establishing the Design Rules for DNA-Mediated Programmable Colloidal Crystallization. Angew. Chem. Int. Edit. 49, 4589-4592 (2010).
9 Hill, H. D. et al. Controlling the Lattice Parameters of Gold Nanoparticle FCC Crystals with Duplex DNA Linkers. Nano Lett. 8, 2341-2344 (2008).
10 Hurst, S. J., Lytton-Jean, A. K. R. & Mirkin, C. A. Maximizing DNA Loading on a Range of Gold Nanoparticle Sizes. Anal. Chem. 78, 8313-8318 (2006).
11 Cheng, W. et al. Probing in Real Time the Soft Crystallization of DNA-Capped Nanoparticles. Angew. Chem. Int. Edit. 49, 380-384 (2010).
12 Smith, B. D. & Liu, J. Assembly of DNA-Functionalized Nanoparticles in Alcoholic Solvents Reveals Opposite Thermodynamic and Kinetic Trends for DNA Hybridization. J. Am. Chem. Soc. 132, 6300-6301 (2010).
13 Renaud, G., Lazzari, R. & Leroy, F. Probing surface and interface morphology with Grazing Incidence Small Angle X-Ray Scattering. Surf. Sci. Rep. 64, 255-380 (2009).
14 van der Kooij, F. M., van der Beek, D. & Lekkerkerker, H. N. W. Isotropic−Nematic Phase Separation in Suspensions of Polydisperse Colloidal Platelets. J. Phys. Chem. B. 105, 1696-1700 (2001).
15 Zhang, Z., Horsch, M. A., Lamm, M. H. & Glotzer, S. C. Tethered Nano Building Blocks: Toward a Conceptual Framework for Nanoparticle Self-Assembly. Nano Lett. 3, 1341-1346 (2003).
16 Tristram-Nagle, S. & Nagle, J. F. Lipid bilayers: thermodynamics, structure, fluctuations, and interactions. Chem. Phys. Lipids 127, 3-14 (2004).
17 Park, S. Y. et al. DNA-programmable nanoparticle crystallization. Nature 451, 553-556 (2008).
18 Torquato, S. & Jiao, Y. Dense packings of the Platonic and Archimedean solids. Nature 460, 876-879 (2009).
19 Lu, W. et al. Super Crystal Structures of Octahedral c-In2O3 Nanocrystals. J. Am. Chem. Soc. 130, 6983-6991 (2008).

44 nature materials | www.nature.com/naturematerials
SUPPLEMENTARY INFORMATION doi: 10.1038/nmat2870
44
20 Xie, S. et al. Supercrystals from Crystallization of Octahedral MnO Nanocrystals. J.Phys. Chem. C. 113, 19107-19111 (2009).