supplementary financial information - rbc · notes to users the consolidated financial statements...
TRANSCRIPT
Dave Mun SVP, Performance Management & Investor Relations (416) 974-4924 [email protected]
Asim Imran Senior Director, Investor Relations (416) 955-7804 [email protected]
Jennifer Nugent Senior Director, Investor Relations (416) 974-0973 [email protected]
www.rbc.com/investorrelations
For further information, please contact:
This document outlines the proposed changes due to the adoption of IFRS 9 indicated by the yellow shading. The document does not include financial information
and is subject to change.
Supplementary Financial Information
Proposed template reflecting the impact of the adoption of International Financial Reporting Standard 9, Financial
Instruments (IFRS 9)

Table of Contents
Page Page
1 Notes to Users Capital (continued)
30 Leverage ratio
2 Financial Highlights 31 Leverage ratio common disclosure template
Consolidated Results Credit Quality
5 Statements of income 32 Loans and acceptances
6 Revenue from trading activities 33 Gross impaired loans and acceptances
7 Non-interest expense 36 Provision for credit losses
38 Allowance for credit losses
Segment Details 40 Credit quality ratios
8 Personal & Commercial Banking
9 Canadian Banking Credit Risk Exposure
10 Wealth Management 41 Gross credit risk exposure by geography and portfolio
11 Insurance 42 Reconciliation of gross credit risk exposure to balance sheet
12 Investor & Treasury Services 43 Exposure covered by credit risk mitigation
13 Capital Markets 43 Credit exposure by residual contractual maturity
14 Corporate Support 44 Credit exposure of portfolios under the standardized approach
by risk weight
On- and Off-Balance Sheet 44 Actual losses vs. estimated losses
15 Balance sheets (period-end balances) 44 Basel Pillar 3 back-testing (Internal ratings based)
16 Selected average balance sheet items 45 Credit quality of advanced internal ratings based (AIRB) exposure -
16 Assets under administration and management retail portfolios by portfolio and risk rating
17 Statements of comprehensive income 46 Credit quality of advanced internal ratings based (AIRB) exposure -
18 Statements of changes in equity wholesale loans and acceptances by portfolio and risk rating
19 Securitization 47 Realized gains and losses on investment securities
47 Trading credit derivatives
Capital 47 Other than trading credit derivatives positions
22 Basel lll regulatory capital and ratios (all-in basis) 48 Fair value of derivative instruments
24 Regulatory capital balance sheet 48 Derivatives - Notional amounts
26 Flow statement of the movements in regulatory capital 49 Derivatives - Related credit risk
27 Total capital risk-weighted assets 50 Market risk regulatory capital - Internal models-based approach VaR
29 Market Risk - Risk-weighted assets by approach (all-in basis)
29 Total capital risk-weighted assets by business segments (all-in basis) 51 Calculation of ROE and RORC
29 Movement of total capital risk-weighted assets by risk type (all-in basis) 52 Key performance and Non-GAAP measures
29 Attributed capital 52 Glossary
(i)

Notes to Users
The Consolidated Financial Statements are prepared in compliance with International Financial Reporting Standards (IFRS) as issued by the International Accounting Standards Board (IASB), International Accounting Standard
(IAS) 34, Interim Financial Reporting unless otherwise noted. Unless otherwise stated, monetary amounts are stated in Canadian dollars. This document is not audited and should be read in conjunction with our Q1 2018 Report to Shareholders
and 2017 Annual Report. Certain comparative amounts have been amended to conform to the current period's presentation.
IFRS 9
Effective November 1, 2017, we adopted IFRS 9 Financial Instruments . Results from periods prior to November 1, 2017 are reported in accordance with IAS 39 Financial Instruments: Recognition and Measurement . Under IFRS 9, Provisions for credit
losses (PCL) relates primarily to loans, acceptances and commitments and also applies to all financial assets except for those classified or designated as fair value through profit or loss (FVTPL) and equity securities designated as fair value through other
comprehensive income (FVOCI). Prior to the adoption of IFRS 9, PCL related only to loans, acceptances and commitments. Provisions for credit losses (PCL) on performing (Stages 1 and 2) and impaired (Stage 3) financial assets are recorded
including the description of accounting policies selected, refer to our Q1 2018 Report to Shareholders and 2017 Annual Report.
Capital Disclosure Requirements related to Basel III Pillar 3
Capital main features disclosure provides a qualitative disclosure and sets out summary information on the terms and conditions of the main features of all capital instruments. We have also included the full terms
and conditions for each of our capital instruments on our Investor Relations website at http://www.rbc.com/investorrelations/quarterly-financial-statements.html.
EDTF Disclosures
The Financial Stability Board's Enhanced Disclosure Task Force (EDTF) issued a report titled "Enhancing the Risk Disclosures of Banks " in October 2012. The following index lists the disclosure related to these recommendations
contained in this document.
Type of Risk Recommendation Disclosure Page
Capital adequacy and risk-weighted assets 10 Composition of capital and reconciliation of the 21-24
accounting balance sheet to the regulatory balance sheet
11 Flow statement of the movements in regulatory capital 25
13 Risk-weighted assets (RWA) by business segments 28
14 Analysis of capital requirement, and related measurement 26-27
model information
15 RWA credit risk and related risk measurements 42-44
16 Movement of risk-weighted assets by risk type 28
17 Basel Pillar 3 back-testing 42
Credit risk 26 Bank's credit risk profile 31-44
Reconciliation of gross credit risk exposure to balance sheet 40
28 Reconciliation of the opening and closing balances of 33, 37
impaired loans and impairment allowances during the year
29 Quantification of gross notional exposure for OTC 46
derivatives or exchange-traded derivatives
30 Credit risk mitigation, including collateral held for all 41
sources of credit risk
For a full index of where to find all EDTF related disclosures, see p. xx of our Q1 2018 Report to Shareholders.
within the respective business segment. Under IAS 39 and prior to November 1, 2017, PCL on performing financial assets (loans not yet identified as impaired) was included in Corporate Support. For further details on the impacts of the adoption of IFRS 9
-1-
1st Quarter 2018 - Supplementary Financial Information ROYAL BANK OF CANADA
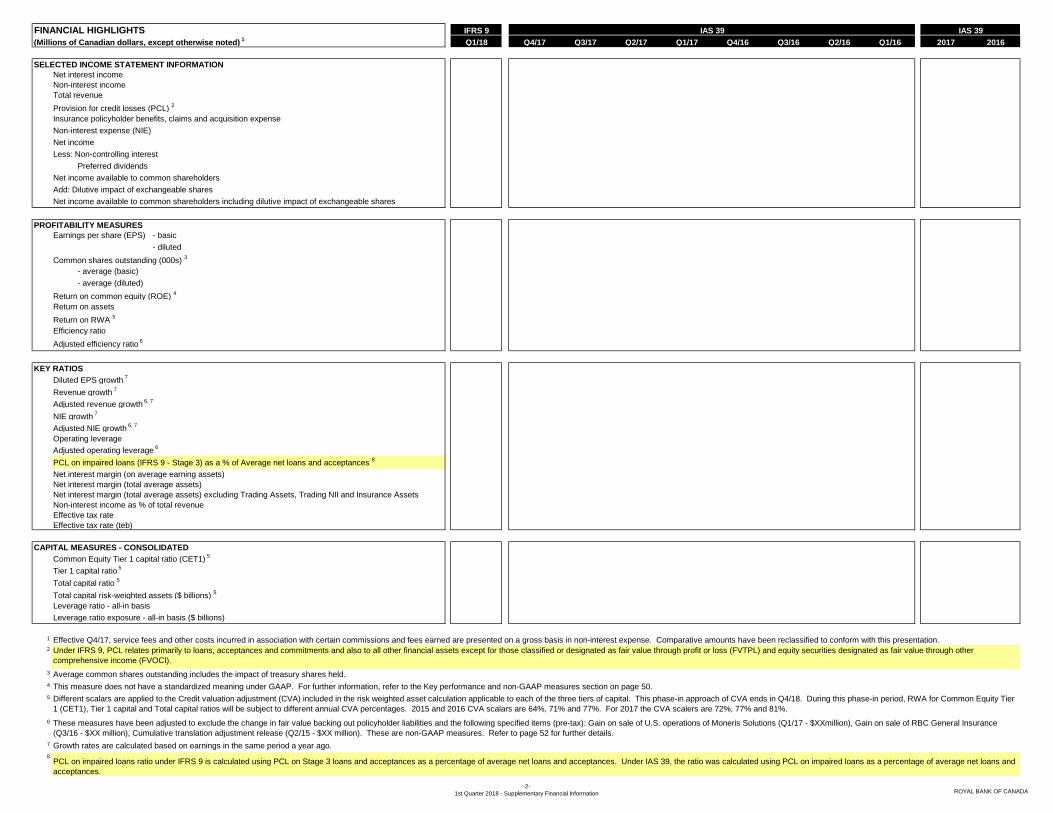
FINANCIAL HIGHLIGHTS IFRS 9
(Millions of Canadian dollars, except otherwise noted) 1
Q1/18 Q4/17 Q3/17 Q2/17 Q1/17 Q4/16 Q3/16 Q2/16 Q1/16 2017 2016
SELECTED INCOME STATEMENT INFORMATION
Net interest income
Non-interest income
Total revenue
Provision for credit losses (PCL) 2
Insurance policyholder benefits, claims and acquisition expense
Non-interest expense (NIE)
Net income
Less: Non-controlling interest
Preferred dividends
Net income available to common shareholders
Add: Dilutive impact of exchangeable shares
Net income available to common shareholders including dilutive impact of exchangeable shares
PROFITABILITY MEASURES
Earnings per share (EPS) - basic
- diluted
Common shares outstanding (000s) 3
- average (basic)
- average (diluted)
Return on common equity (ROE) 4
Return on assets
Return on RWA 5
Efficiency ratio
Adjusted efficiency ratio 6
KEY RATIOS
Diluted EPS growth 7
Revenue growth 7
Adjusted revenue growth 6, 7
NIE growth 7
Adjusted NIE growth 6, 7
Operating leverage
Adjusted operating leverage 6
PCL on impaired loans (IFRS 9 - Stage 3) as a % of Average net loans and acceptances 8
Net interest margin (on average earning assets)
Net interest margin (total average assets)
Net interest margin (total average assets) excluding Trading Assets, Trading NII and Insurance Assets
Non-interest income as % of total revenue
Effective tax rate
Effective tax rate (teb)
CAPITAL MEASURES - CONSOLIDATED
Common Equity Tier 1 capital ratio (CET1) 5
Tier 1 capital ratio 5
Total capital ratio 5
Total capital risk-weighted assets ($ billions) 5
Leverage ratio - all-in basis
Leverage ratio exposure - all-in basis ($ billions)
1
2
3
4
5
6
7
8PCL on impaired loans ratio under IFRS 9 is calculated using PCL on Stage 3 loans and acceptances as a percentage of average net loans and acceptances. Under IAS 39, the ratio was calculated using PCL on impaired loans as a percentage of average net loans and
acceptances.
Growth rates are calculated based on earnings in the same period a year ago.
IAS 39 IAS 39
Effective Q4/17, service fees and other costs incurred in association with certain commissions and fees earned are presented on a gross basis in non-interest expense. Comparative amounts have been reclassified to conform with this presentation.
Average common shares outstanding includes the impact of treasury shares held.
This measure does not have a standardized meaning under GAAP. For further information, refer to the Key performance and non-GAAP measures section on page 50.
Different scalars are applied to the Credit valuation adjustment (CVA) included in the risk weighted asset calculation applicable to each of the three tiers of capital. This phase-in approach of CVA ends in Q4/18. During this phase-in period, RWA for Common Equity Tier
1 (CET1), Tier 1 capital and Total capital ratios will be subject to different annual CVA percentages. 2015 and 2016 CVA scalars are 64%, 71% and 77%. For 2017 the CVA scalers are 72%, 77% and 81%.
These measures have been adjusted to exclude the change in fair value backing out policyholder liabilities and the following specified items (pre-tax): Gain on sale of U.S. operations of Moneris Solutions (Q1/17 - $XXmillion), Gain on sale of RBC General Insurance
(Q3/16 - $XX million), Cumulative translation adjustment release (Q2/15 - $XX million). These are non-GAAP measures. Refer to page 52 for further details.
Under IFRS 9, PCL relates primarily to loans, acceptances and commitments and also to all other financial assets except for those classified or designated as fair value through profit or loss (FVTPL) and equity securities designated as fair value through other
comprehensive income (FVOCI).
-2-
1st Quarter 2018 - Supplementary Financial Information ROYAL BANK OF CANADA
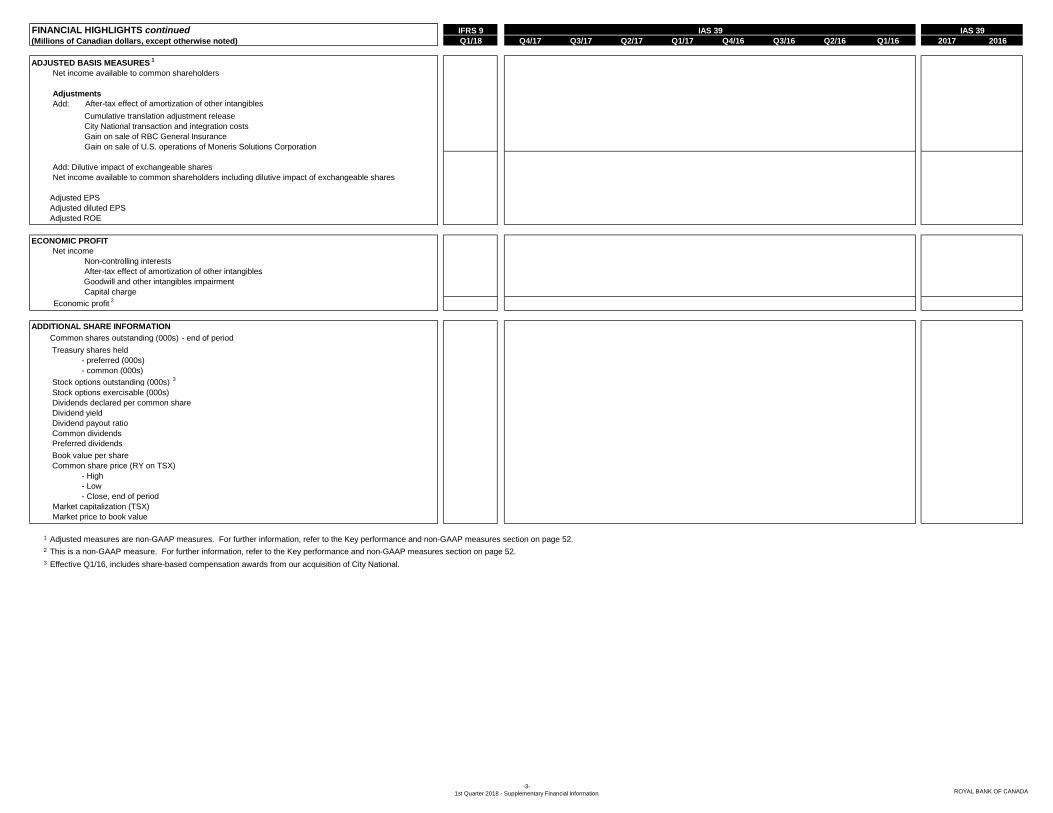
FINANCIAL HIGHLIGHTS continued IFRS 9
(Millions of Canadian dollars, except otherwise noted) Q1/18 Q4/17 Q3/17 Q2/17 Q1/17 Q4/16 Q3/16 Q2/16 Q1/16 2017 2016
ADJUSTED BASIS MEASURES 1
Net income available to common shareholders
Adjustments
Add: After-tax effect of amortization of other intangibles
Cumulative translation adjustment release
City National transaction and integration costs
Gain on sale of RBC General Insurance
Gain on sale of U.S. operations of Moneris Solutions Corporation
Add: Dilutive impact of exchangeable shares
Net income available to common shareholders including dilutive impact of exchangeable shares
Adjusted EPS
Adjusted diluted EPS
Adjusted ROE
ECONOMIC PROFIT
Net income
Non-controlling interests
After-tax effect of amortization of other intangibles
Goodwill and other intangibles impairment
Capital charge
Economic profit 2
ADDITIONAL SHARE INFORMATION
Common shares outstanding (000s) - end of period
Treasury shares held
- preferred (000s)
- common (000s)
Stock options outstanding (000s) 3
Stock options exercisable (000s)
Dividends declared per common share
Dividend yield
Dividend payout ratio
Common dividends
Preferred dividends
Book value per share
Common share price (RY on TSX)
- High
- Low
- Close, end of period
Market capitalization (TSX)
Market price to book value
1
2
3
Adjusted measures are non-GAAP measures. For further information, refer to the Key performance and non-GAAP measures section on page 52.
This is a non-GAAP measure. For further information, refer to the Key performance and non-GAAP measures section on page 52.
Effective Q1/16, includes share-based compensation awards from our acquisition of City National.
IAS 39 IAS 39
-3-
1st Quarter 2018 - Supplementary Financial Information ROYAL BANK OF CANADA

FINANCIAL HIGHLIGHTS continued IFRS 9
(Millions of Canadian dollars, except otherwise noted) Q1/18 Q4/17 Q3/17 Q2/17 Q1/17 Q4/16 Q3/16 Q2/16 Q1/16 2017 2016
SELECTED BALANCE SHEET INFORMATION
Average loans and acceptances
Total assets
Average assets
Average earning assets
Deposits
Common equity
Average common equity
OTHER INFORMATION
Number of employees (full-time equivalent) 1
Canada
US
Other
Total
Number of banking branches
Canada
US
Other
Total
Number of automated teller machines (ATMs)
Active digital (Online and Mobile) users (000's) 2
Active mobile users (000's) 1
MARKET RISK MEASURES - Structural Interest Rate Sensitivities
Before-tax impact of 1% increase in rates on:
Net interest income risk 3
Economic value of equity
Before-tax impact of 1% decrease in rates on:
Net interest income risk 3
Economic value of equity
1
2
3Amounts represent the 12-month Net interest exposure to an instantaneous and sustained shift in interest rates.
IAS 39 IAS 39
Amounts have been revised from those previously presented.
This figure represents the 90-Day Active customers in Canadian Banking only.
-4-
1st Quarter 2018 - Supplementary Financial Information ROYAL BANK OF CANADA
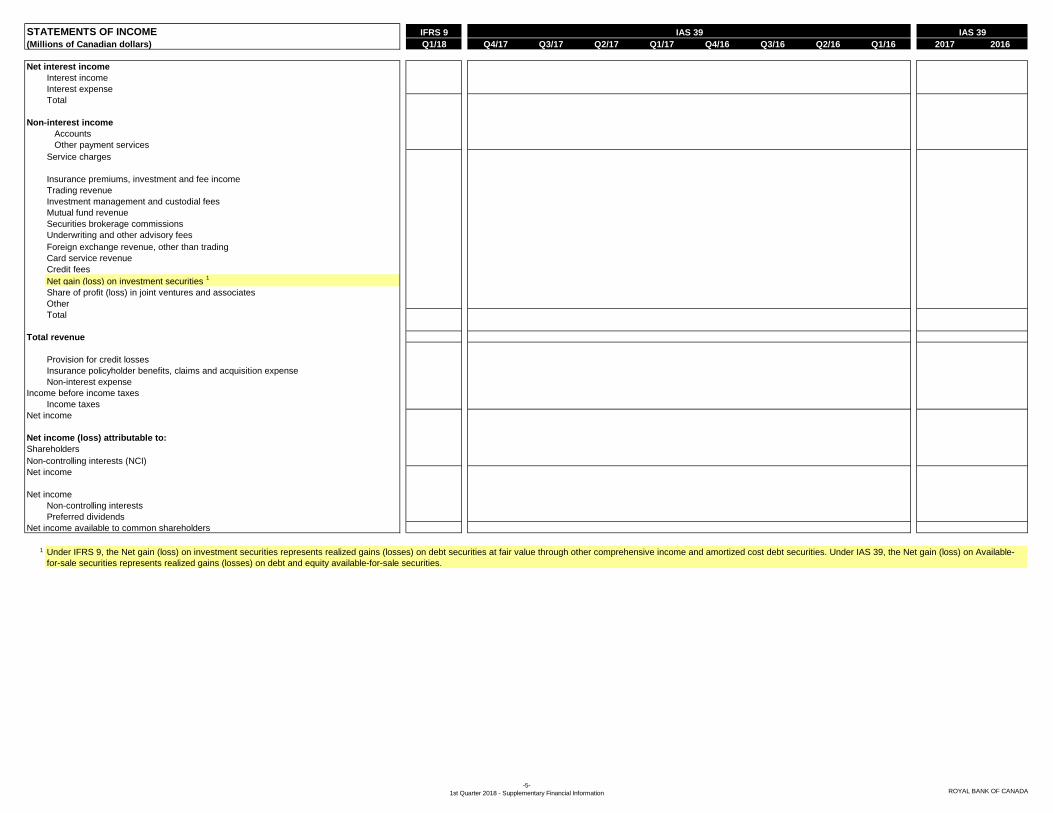
STATEMENTS OF INCOME IFRS 9
(Millions of Canadian dollars) Q1/18 Q4/17 Q3/17 Q2/17 Q1/17 Q4/16 Q3/16 Q2/16 Q1/16 2017 2016
Net interest income
Interest income
Interest expense
Total
Non-interest income
Accounts
Other payment services
Service charges
Insurance premiums, investment and fee income
Trading revenue
Investment management and custodial fees
Mutual fund revenue
Securities brokerage commissions
Underwriting and other advisory fees
Foreign exchange revenue, other than trading
Card service revenue
Credit fees
Net gain (loss) on investment securities 1
Share of profit (loss) in joint ventures and associates
Other
Total
Total revenue
Provision for credit losses
Insurance policyholder benefits, claims and acquisition expense
Non-interest expense
Income before income taxes
Income taxes
Net income
Net income (loss) attributable to:
Shareholders
Non-controlling interests (NCI)
Net income
Net income
Non-controlling interests
Preferred dividends
Net income available to common shareholders
1
IAS 39 IAS 39
Under IFRS 9, the Net gain (loss) on investment securities represents realized gains (losses) on debt securities at fair value through other comprehensive income and amortized cost debt securities. Under IAS 39, the Net gain (loss) on Available-
for-sale securities represents realized gains (losses) on debt and equity available-for-sale securities.
-5-
1st Quarter 2018 - Supplementary Financial Information ROYAL BANK OF CANADA
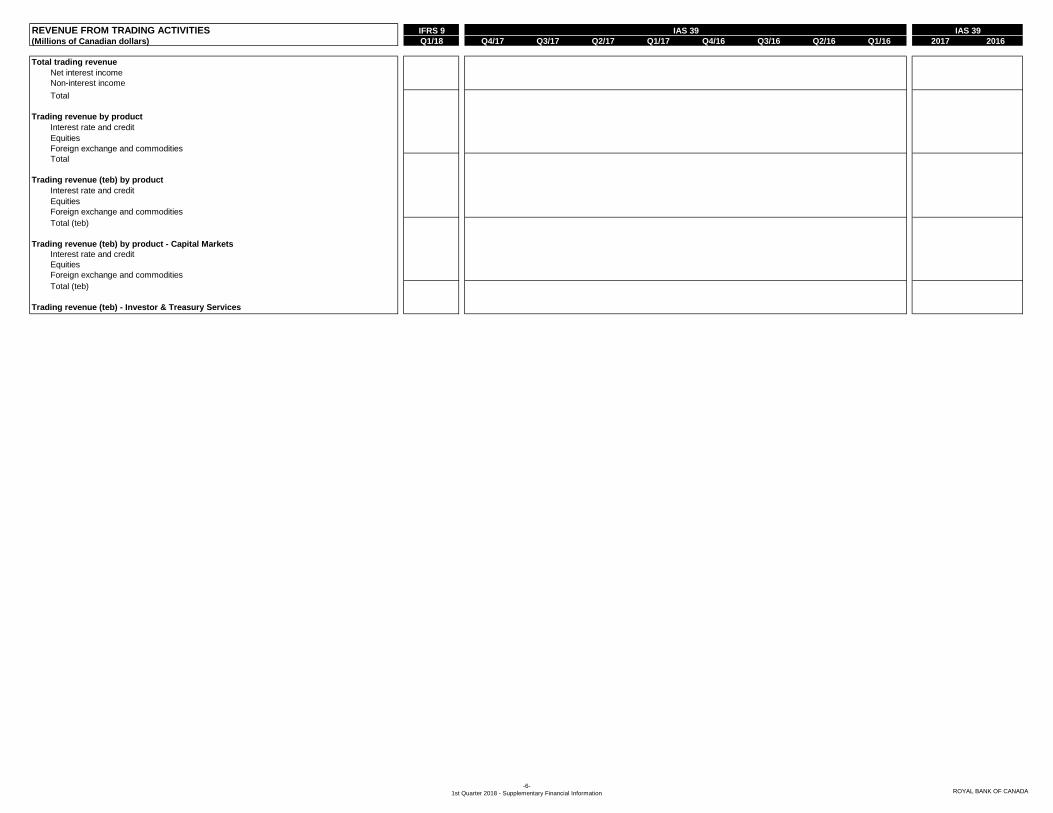
REVENUE FROM TRADING ACTIVITIES IFRS 9
(Millions of Canadian dollars) Q1/18 Q4/17 Q3/17 Q2/17 Q1/17 Q4/16 Q3/16 Q2/16 Q1/16 2017 2016
Total trading revenue
Net interest income
Non-interest income
Total
Trading revenue by product
Interest rate and credit
Equities
Foreign exchange and commodities
Total
Trading revenue (teb) by product
Interest rate and credit
Equities
Foreign exchange and commodities
Total (teb)
Trading revenue (teb) by product - Capital Markets
Interest rate and credit
Equities
Foreign exchange and commodities
Total (teb)
Trading revenue (teb) - Investor & Treasury Services
IAS 39 IAS 39
-6-
1st Quarter 2018 - Supplementary Financial Information ROYAL BANK OF CANADA
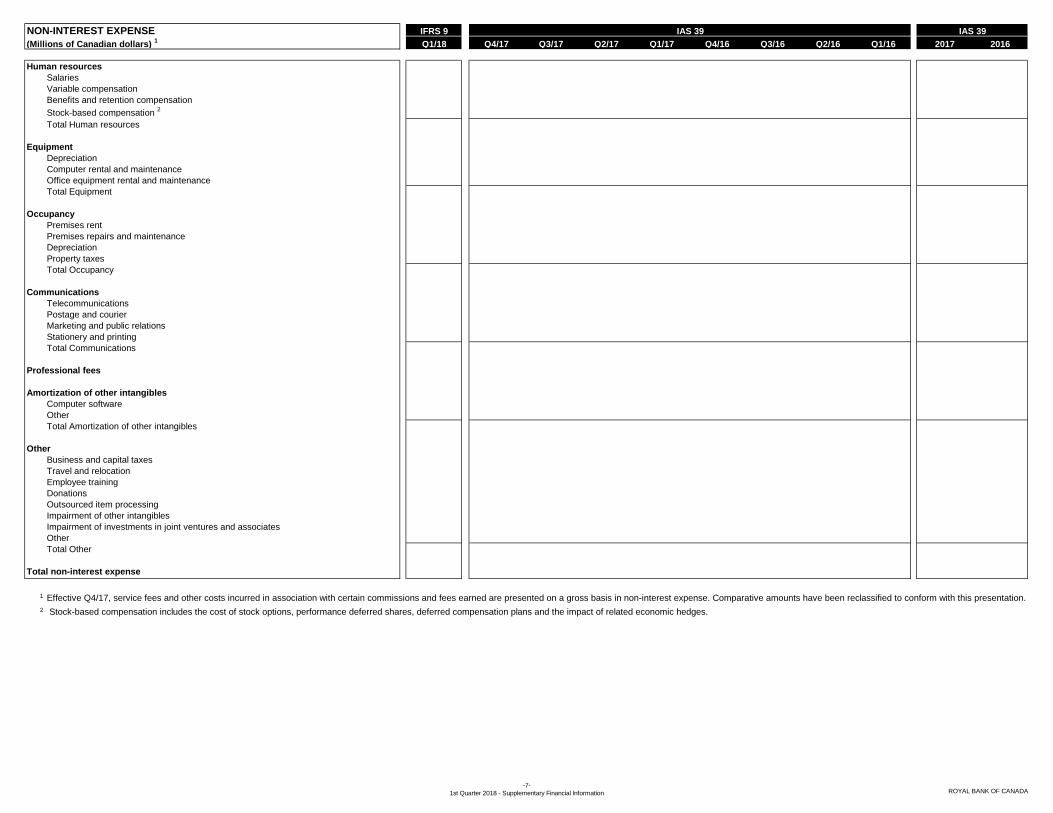
NON-INTEREST EXPENSE IFRS 9
(Millions of Canadian dollars) 1
Q1/18 Q4/17 Q3/17 Q2/17 Q1/17 Q4/16 Q3/16 Q2/16 Q1/16 2017 2016
Human resources
Salaries
Variable compensation
Benefits and retention compensation
Stock-based compensation 2
Total Human resources
Equipment
Depreciation
Computer rental and maintenance
Office equipment rental and maintenance
Total Equipment
Occupancy
Premises rent
Premises repairs and maintenance
Depreciation
Property taxes
Total Occupancy
Communications
Telecommunications
Postage and courier
Marketing and public relations
Stationery and printing
Total Communications
Professional fees
Amortization of other intangibles
Computer software
Other
Total Amortization of other intangibles
Other
Business and capital taxes
Travel and relocation
Employee training
Donations
Outsourced item processing
Impairment of other intangibles
Impairment of investments in joint ventures and associates
Other
Total Other
1
2
Total non-interest expense
Effective Q4/17, service fees and other costs incurred in association with certain commissions and fees earned are presented on a gross basis in non-interest expense. Comparative amounts have been reclassified to conform with this presentation.
Stock-based compensation includes the cost of stock options, performance deferred shares, deferred compensation plans and the impact of related economic hedges.
IAS 39 IAS 39
-7-
1st Quarter 2018 - Supplementary Financial Information ROYAL BANK OF CANADA
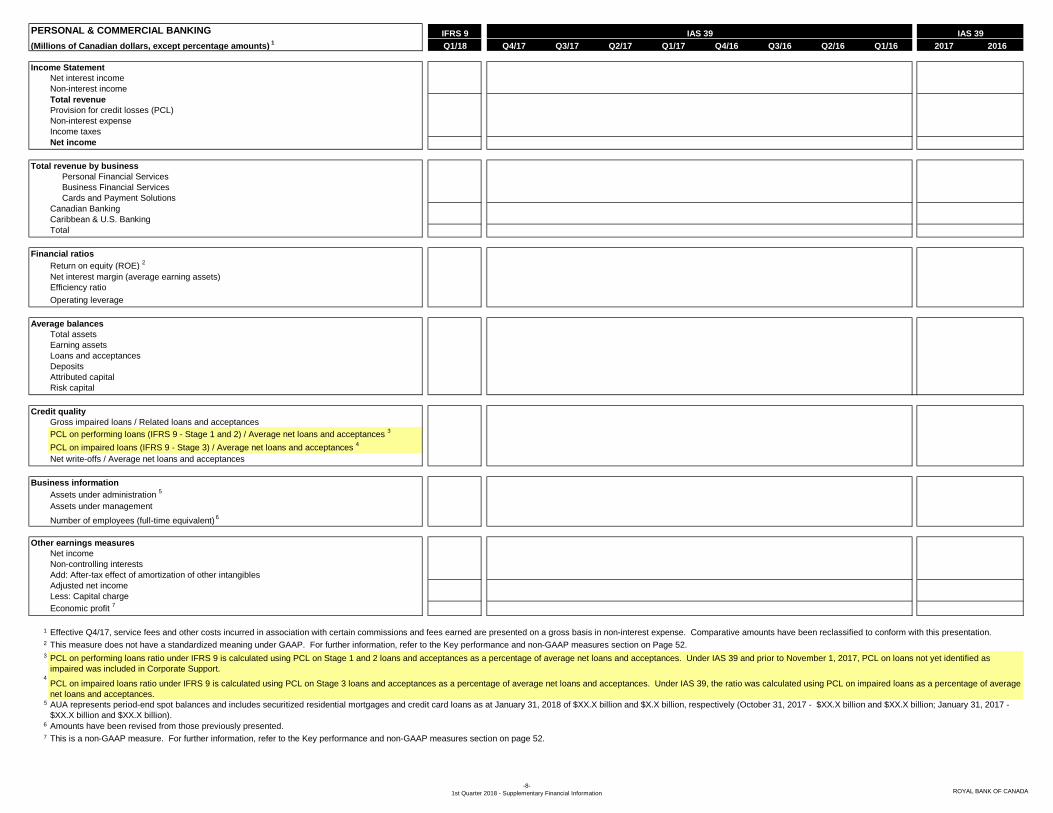
PERSONAL & COMMERCIAL BANKING IFRS 9
(Millions of Canadian dollars, except percentage amounts) 1
Q1/18 Q4/17 Q3/17 Q2/17 Q1/17 Q4/16 Q3/16 Q2/16 Q1/16 2017 2016
Income Statement
Net interest income
Non-interest income
Total revenue
Provision for credit losses (PCL)
Non-interest expense
Income taxes
Net income
Total revenue by business
Personal Financial Services
Business Financial Services
Cards and Payment Solutions
Canadian Banking
Caribbean & U.S. Banking
Total
Financial ratios
Return on equity (ROE) 2
Net interest margin (average earning assets)
Efficiency ratio
Operating leverage
Average balances
Total assets
Earning assets
Loans and acceptances
Deposits
Attributed capital
Risk capital
Credit quality
Gross impaired loans / Related loans and acceptances
PCL on performing loans (IFRS 9 - Stage 1 and 2) / Average net loans and acceptances 3
PCL on impaired loans (IFRS 9 - Stage 3) / Average net loans and acceptances 4
Net write-offs / Average net loans and acceptances
Business information
Assets under administration 5
Assets under management
Number of employees (full-time equivalent) 6
Other earnings measures
Net income
Non-controlling interests
Add: After-tax effect of amortization of other intangibles
Adjusted net income
Less: Capital charge
Economic profit 7
1
2
3
4
5
6
7
Amounts have been revised from those previously presented.
This is a non-GAAP measure. For further information, refer to the Key performance and non-GAAP measures section on page 52.
IAS 39 IAS 39
Effective Q4/17, service fees and other costs incurred in association with certain commissions and fees earned are presented on a gross basis in non-interest expense. Comparative amounts have been reclassified to conform with this presentation.
This measure does not have a standardized meaning under GAAP. For further information, refer to the Key performance and non-GAAP measures section on Page 52.
AUA represents period-end spot balances and includes securitized residential mortgages and credit card loans as at January 31, 2018 of $XX.X billion and $X.X billion, respectively (October 31, 2017 - $XX.X billion and $XX.X billion; January 31, 2017 -
$XX.X billion and $XX.X billion).
PCL on impaired loans ratio under IFRS 9 is calculated using PCL on Stage 3 loans and acceptances as a percentage of average net loans and acceptances. Under IAS 39, the ratio was calculated using PCL on impaired loans as a percentage of average
net loans and acceptances.
PCL on performing loans ratio under IFRS 9 is calculated using PCL on Stage 1 and 2 loans and acceptances as a percentage of average net loans and acceptances. Under IAS 39 and prior to November 1, 2017, PCL on loans not yet identified as
impaired was included in Corporate Support.
-8-
1st Quarter 2018 - Supplementary Financial Information ROYAL BANK OF CANADA

CANADIAN BANKING IFRS 9
(Millions of Canadian dollars, except percentage amounts) 1
Q1/18 Q4/17 Q3/17 Q2/17 Q1/17 Q4/16 Q3/16 Q2/16 Q1/16 2017 2016
Income Statement
Net interest income
Non-interest income
Total revenue
Provision for credit losses (PCL)
Non-interest expense
Income taxes
Net income
Total revenue by business
Personal Financial Services
Business Financial Services
Cards and Payment Solutions
Total
Financial ratios
Return on equity (ROE) 2
Net interest margin (average earning assets)
Efficiency ratio
Operating leverage
Average balances
Total assets
Earning assets
Loans and acceptances
Residential mortgages
Personal 3
Credit cards
Small business
Total retail
Wholesale
Personal deposits
Business deposits
Attributed capital
Risk capital
Credit quality
Gross impaired loans / Related loans and acceptances
PCL on performing loans (IFRS 9 - Stage 1 and 2) / Average net loans and acceptances 4
PCL on impaired loans (IFRS 9 - Stage 3) / Average net loans and acceptances 5
Net write-offs / Average net loans and acceptances
Business information
Assets under administration 6
Number of employees (full-time equivalent) 7
Other earnings measures
Net income
Add: After-tax effect of amortization of other intangibles
Adjusted net income
Less: Capital charge
Economic profit 8
1
2
3
4
5
6
7 Amounts have been revised from those previously presented.
8
IAS 39 IAS 39
Effective Q4/17, service fees and other costs incurred in association with certain commissions and fees earned are presented on a gross basis in non-interest expense. Comparative amounts have been reclassified to conform with this presentation.
This measure does not have a standardized meaning under GAAP. For further information, refer to the Key performance and non-GAAP measures section on page 52.
As at Q1/18, average personal secured loans was $XX.X billion and average personal unsecured loans was $XX.X billion. The loans are secured by securities, residential real estate, automotive assets and government guarantees.
This is a non-GAAP measure. For further information, refer to the Key performance and non-GAAP measures section on page 52.
PCL on impaired loans ratio under IFRS 9 is calculated using PCL on Stage 3 loans and acceptances as a percentage of average net loans and acceptances. Under IAS 39, the ratio was calculated using PCL on impaired loans as a percentage of average
net loans and acceptances.
AUA represents period-end spot balances and includes securitized residential mortgages and credit card loans as at January 31, 2018 of $XX.X billion and $X.X billion, respectively (October 31, 2017 - $XX.X billion and $X.X billion; January 31, 2017 - $XX.X
billion and $X.X billion).
PCL on performing loans ratio under IFRS 9 is calculated using PCL on Stage 1 and 2 loans and acceptances as a percentage of average net loans and acceptances. Under IAS 39 and prior to November 1, 2017, PCL on loans not yet identified as impaired
was included in Corporate Support.
-9-
1st Quarter 2018 - Supplementary Financial Information ROYAL BANK OF CANADA

WEALTH MANAGEMENT IFRS 9
(Millions of Canadian dollars, except percentage amounts) 1
Q1/18 Q4/17 Q3/17 Q2/17 Q1/17 Q4/16 Q3/16 Q2/16 Q1/16 2017 2016
Income Statement
Net interest income
Fee-based revenue
Transaction and other revenue
U.S. Wealth accumulation plan gains/(losses) 2
Total revenue
Provision for credit losses (PCL)
Non-interest expense
U.S. Wealth accumulation plan (gains)/losses 2
Income taxes
Net income
Total revenue by business
Canadian Wealth Management
U.S. Wealth Management (including City National)
Global Asset Management
International Wealth Management
Total
Financial ratios
Return on equity (ROE) 3
Net interest margin (average earning assets)
Pre-tax margin
Average balances
Total assets
Earning assets
Loans and acceptances
Retail loans
Wholesale loans
Deposits
Attributed capital
Risk capital
Credit quality
Gross impaired loans / Related loans and acceptances
Gross impaired loans on acquired credit impaired loans / Related loans
and acceptances
PCL on performing loans (IFRS 9 - Stage 1 and 2) / Average net loans and acceptances 4
PCL on impaired loans (IFRS 9 - Stage 3) / Average net loans and acceptances 5
Net write-offs / Average net loans and acceptances
Business information
Assets under administration
Canadian Wealth Management
U.S. Wealth Management (including City National)
Global Asset Management
International Wealth Management 6
Total
Assets under management
Canadian Wealth Management
U.S. Wealth Management (including City National)
Global Asset Management 7
International Wealth Management
Total
Number of employees (full-time equivalent)
Other earnings measures
Net income
Non-controlling interests
Add: After-tax effect of amortization of other intangibles
Adjusted net income
Less: Capital charge
Economic profit 8
(Millions of U.S. dollars)
U.S. Wealth Management (including City National)
Revenue
Assets under administration
1
2
3
4
5
6 Amounts have been revised from those previously presented.
7
8
IAS 39 IAS 39
Effective Q4/17, service fees and other costs incurred in association with certain commissions and fees earned are presented on a gross basis in non-interest expense. Comparative amounts have been reclassified to conform with this
presentation.
Gains (losses) on investments in mutual funds used as economic hedges are included in revenue and related variability is included in market-linked compensation expense in our U.S. Wealth Accumulation Plan.
This measure does not have a standardized meaning under GAAP. For further information, refer to the Key performance and non-GAAP measures section on page 52.
Excludes assets held by clients of Phillips, Hager & North Investment Management Ltd. for which we earn either a nominal or no management fee. In Q1/18 $X million of balances of these assets were excluded.
This is a non-GAAP measure. For further information, refer to the Key performance and non-GAAP measures section on page 52.
PCL on impaired loans ratio under IFRS 9 is calculated using PCL on Stage 3 loan and acceptances as a percentage of average net loans and acceptances. Under IAS 39, the ratio was calculated using PCL on impaired loans as a percentage of average
net loans and acceptances.
PCL on performing loans ratio under IFRS 9 is calculated using PCL on Stage 1 and 2 loans and acceptances as a percentage of average net loans and acceptances. Under IAS 39 and prior to November 1, 2017, PCL on loans not yet identified as
impaired was included in Corporate Support.
-10-
1st Quarter 2018 - Supplementary Financial Information ROYAL BANK OF CANADA
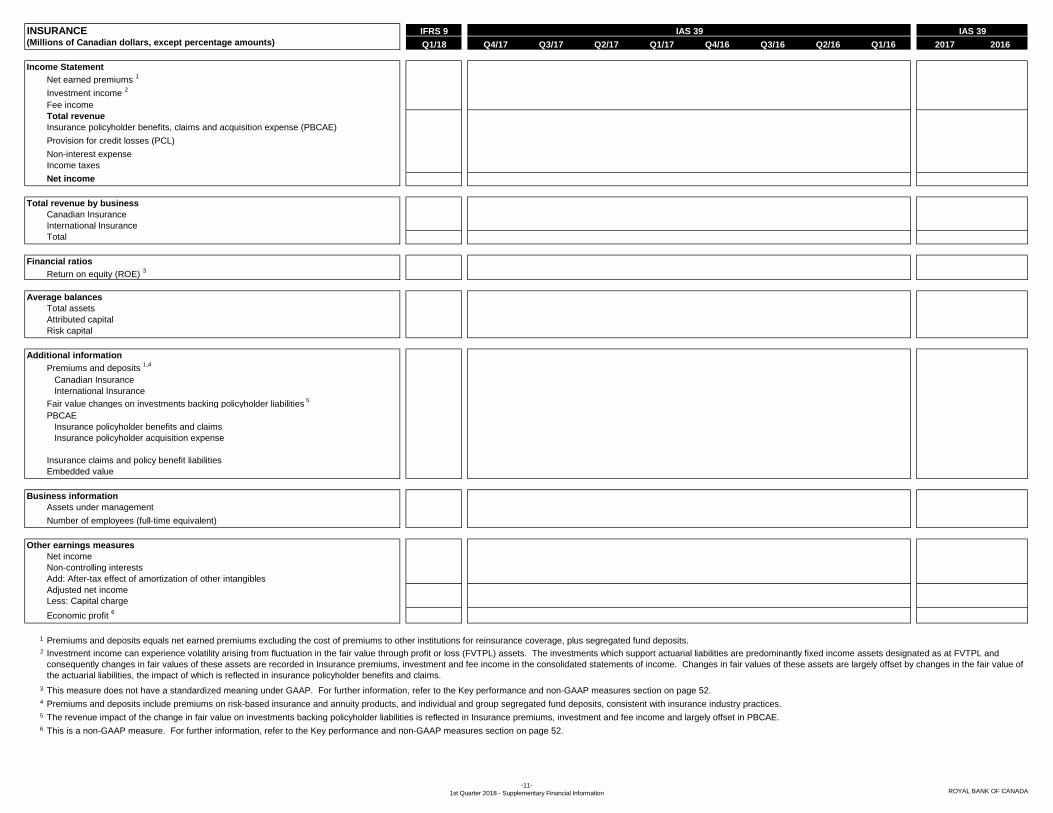
INSURANCE IFRS 9
(Millions of Canadian dollars, except percentage amounts) Q1/18 Q4/17 Q3/17 Q2/17 Q1/17 Q4/16 Q3/16 Q2/16 Q1/16 2017 2016
Income Statement
Net earned premiums 1
Investment income 2
Fee income
Total revenue
Insurance policyholder benefits, claims and acquisition expense (PBCAE)
Provision for credit losses (PCL)
Non-interest expense
Income taxes
Net income
Total revenue by business
Canadian Insurance
International Insurance
Total
Financial ratios
Return on equity (ROE) 3
Average balances
Total assets
Attributed capital
Risk capital
Additional information
Premiums and deposits 1,4
Canadian Insurance
International Insurance
Fair value changes on investments backing policyholder liabilities 5
PBCAE
Insurance policyholder benefits and claims
Insurance policyholder acquisition expense
Insurance claims and policy benefit liabilities
Embedded value
Business information
Assets under management
Number of employees (full-time equivalent)
Other earnings measures
Net income
Non-controlling interests
Add: After-tax effect of amortization of other intangibles
Adjusted net income
Less: Capital charge
Economic profit 6
1
2
3
4
5
6
IAS 39 IAS 39
Premiums and deposits equals net earned premiums excluding the cost of premiums to other institutions for reinsurance coverage, plus segregated fund deposits.
Investment income can experience volatility arising from fluctuation in the fair value through profit or loss (FVTPL) assets. The investments which support actuarial liabilities are predominantly fixed income assets designated as at FVTPL and
consequently changes in fair values of these assets are recorded in Insurance premiums, investment and fee income in the consolidated statements of income. Changes in fair values of these assets are largely offset by changes in the fair value of
the actuarial liabilities, the impact of which is reflected in insurance policyholder benefits and claims.
This measure does not have a standardized meaning under GAAP. For further information, refer to the Key performance and non-GAAP measures section on page 52.
Premiums and deposits include premiums on risk-based insurance and annuity products, and individual and group segregated fund deposits, consistent with insurance industry practices.
The revenue impact of the change in fair value on investments backing policyholder liabilities is reflected in Insurance premiums, investment and fee income and largely offset in PBCAE.
This is a non-GAAP measure. For further information, refer to the Key performance and non-GAAP measures section on page 52.
-11-
1st Quarter 2018 - Supplementary Financial Information ROYAL BANK OF CANADA
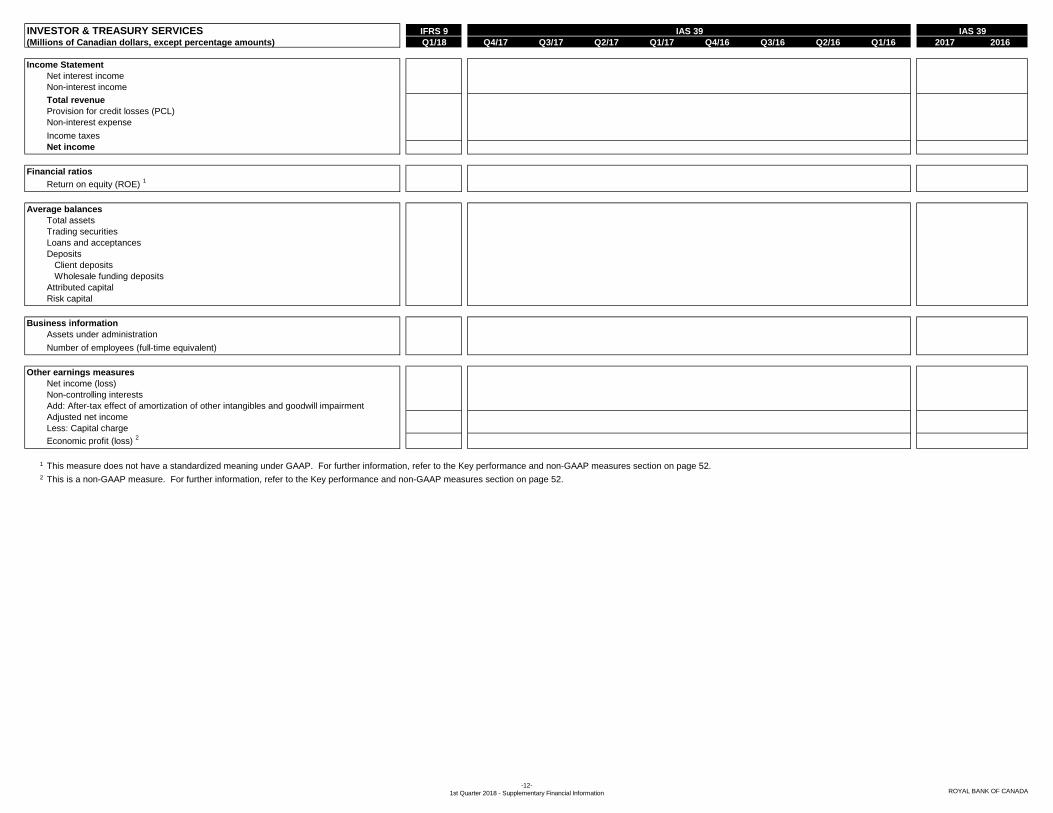
INVESTOR & TREASURY SERVICES IFRS 9
(Millions of Canadian dollars, except percentage amounts) Q1/18 Q4/17 Q3/17 Q2/17 Q1/17 Q4/16 Q3/16 Q2/16 Q1/16 2017 2016
Income Statement
Net interest income
Non-interest income
Total revenue
Provision for credit losses (PCL)
Non-interest expense
Income taxes
Net income
Financial ratios
Return on equity (ROE) 1
Average balances
Total assets
Trading securities
Loans and acceptances
Deposits
Client deposits
Wholesale funding deposits
Attributed capital
Risk capital
Business information
Assets under administration
Number of employees (full-time equivalent)
Other earnings measures
Net income (loss)
Non-controlling interests
Add: After-tax effect of amortization of other intangibles and goodwill impairment
Adjusted net income
Less: Capital charge
Economic profit (loss) 2
1
2
This measure does not have a standardized meaning under GAAP. For further information, refer to the Key performance and non-GAAP measures section on page 52.
This is a non-GAAP measure. For further information, refer to the Key performance and non-GAAP measures section on page 52.
IAS 39 IAS 39
-12-
1st Quarter 2018 - Supplementary Financial Information ROYAL BANK OF CANADA
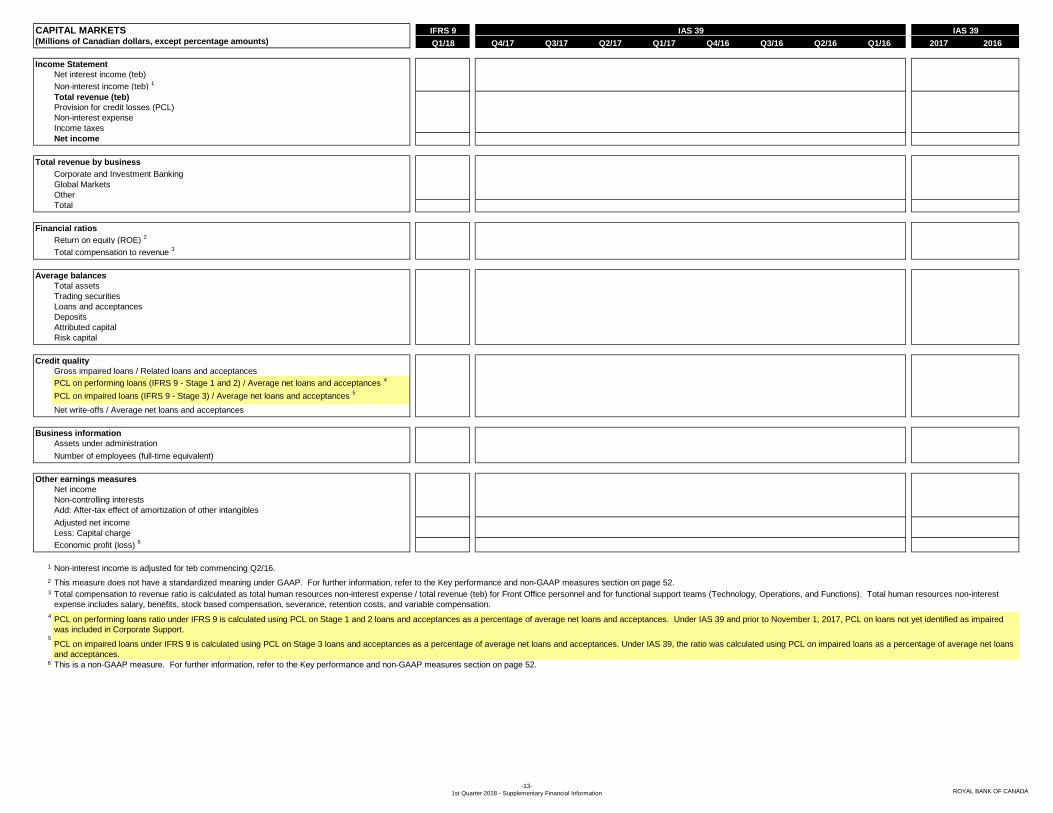
CAPITAL MARKETS IFRS 9
(Millions of Canadian dollars, except percentage amounts) Q1/18 Q4/17 Q3/17 Q2/17 Q1/17 Q4/16 Q3/16 Q2/16 Q1/16 2017 2016
Income Statement
Net interest income (teb)
Non-interest income (teb) 1
Total revenue (teb)
Provision for credit losses (PCL)
Non-interest expense
Income taxes
Net income
Total revenue by business
Corporate and Investment Banking
Global Markets
Other
Total
Financial ratios
Return on equity (ROE) 2
Total compensation to revenue 3
Average balances
Total assets
Trading securities
Loans and acceptances
Deposits
Attributed capital
Risk capital
Credit quality
Gross impaired loans / Related loans and acceptances
PCL on performing loans (IFRS 9 - Stage 1 and 2) / Average net loans and acceptances 4
PCL on impaired loans (IFRS 9 - Stage 3) / Average net loans and acceptances 5
Net write-offs / Average net loans and acceptances
Business information
Assets under administration
Number of employees (full-time equivalent)
Other earnings measures
Net income
Non-controlling interests
Add: After-tax effect of amortization of other intangibles
Adjusted net income
Less: Capital charge
Economic profit (loss) 6
1
2
4
5
6
3 Total compensation to revenue ratio is calculated as total human resources non-interest expense / total revenue (teb) for Front Office personnel and for functional support teams (Technology, Operations, and Functions). Total human resources non-interest
expense includes salary, benefits, stock based compensation, severance, retention costs, and variable compensation.
This is a non-GAAP measure. For further information, refer to the Key performance and non-GAAP measures section on page 52.
IAS 39 IAS 39
Non-interest income is adjusted for teb commencing Q2/16.
This measure does not have a standardized meaning under GAAP. For further information, refer to the Key performance and non-GAAP measures section on page 52.
PCL on performing loans ratio under IFRS 9 is calculated using PCL on Stage 1 and 2 loans and acceptances as a percentage of average net loans and acceptances. Under IAS 39 and prior to November 1, 2017, PCL on loans not yet identified as impaired
was included in Corporate Support.
PCL on impaired loans under IFRS 9 is calculated using PCL on Stage 3 loans and acceptances as a percentage of average net loans and acceptances. Under IAS 39, the ratio was calculated using PCL on impaired loans as a percentage of average net loans
and acceptances.
-13-
1st Quarter 2018 - Supplementary Financial Information ROYAL BANK OF CANADA
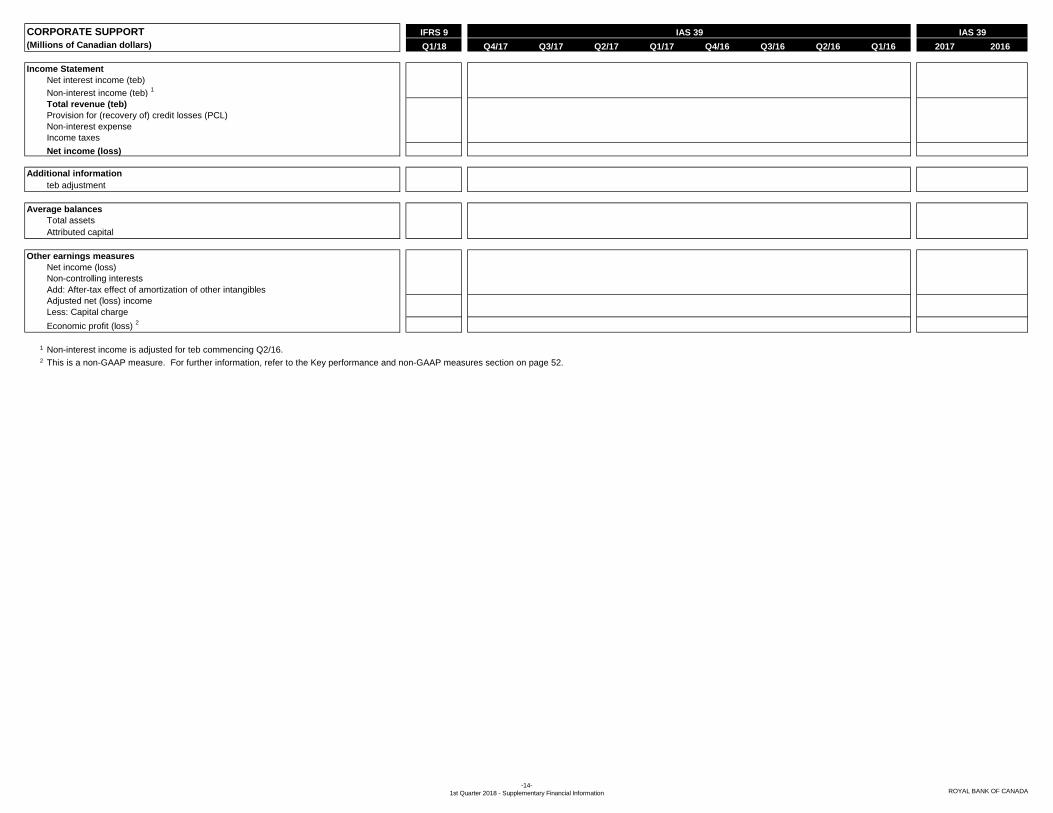
CORPORATE SUPPORT IFRS 9
(Millions of Canadian dollars) Q1/18 Q4/17 Q3/17 Q2/17 Q1/17 Q4/16 Q3/16 Q2/16 Q1/16 2017 2016
Income Statement
Net interest income (teb)
Non-interest income (teb) 1
Total revenue (teb)
Provision for (recovery of) credit losses (PCL)
Non-interest expense
Income taxes
Net income (loss)
Additional information
teb adjustment
Average balances
Total assets
Attributed capital
Other earnings measures
Net income (loss)
Non-controlling interests
Add: After-tax effect of amortization of other intangibles
Adjusted net (loss) income
Less: Capital charge
Economic profit (loss) 2
1
2
Non-interest income is adjusted for teb commencing Q2/16.
This is a non-GAAP measure. For further information, refer to the Key performance and non-GAAP measures section on page 52.
IAS 39 IAS 39
-14-
1st Quarter 2018 - Supplementary Financial Information ROYAL BANK OF CANADA
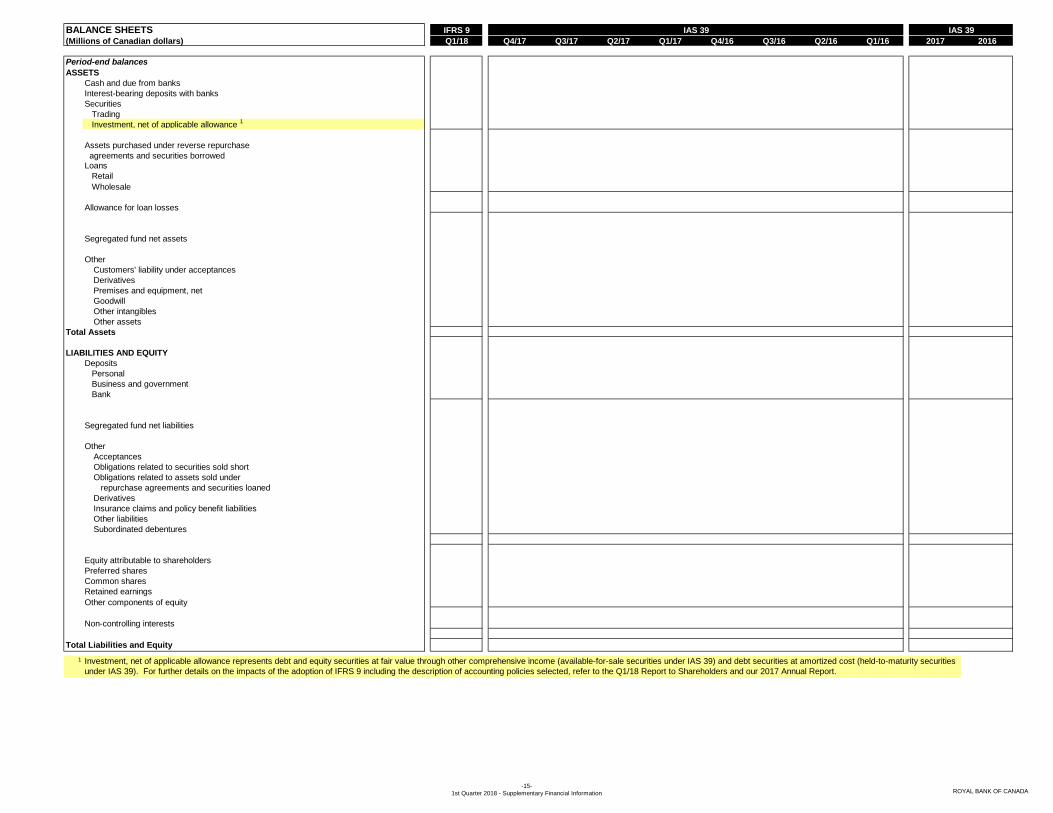
BALANCE SHEETS IFRS 9
(Millions of Canadian dollars) Q1/18 Q4/17 Q3/17 Q2/17 Q1/17 Q4/16 Q3/16 Q2/16 Q1/16 2017 2016
Period-end balances
ASSETS
Cash and due from banks
Interest-bearing deposits with banks
Securities
Trading
Investment, net of applicable allowance 1
Assets purchased under reverse repurchase
agreements and securities borrowedLoans
Retail
Wholesale
Allowance for loan losses
Segregated fund net assets
Other
Customers' liability under acceptances
Derivatives
Premises and equipment, net
Goodwill
Other intangibles
Other assets
Total Assets
LIABILITIES AND EQUITY
Deposits
Personal
Business and government
Bank
Segregated fund net liabilities
Other
Acceptances
Obligations related to securities sold short
Obligations related to assets sold under
repurchase agreements and securities loaned
Derivatives
Insurance claims and policy benefit liabilities
Other liabilities
Subordinated debentures
Equity attributable to shareholders
Preferred shares
Common shares
Retained earnings
Other components of equity
Non-controlling interests
Total Liabilities and Equity
1
IAS 39 IAS 39
Investment, net of applicable allowance represents debt and equity securities at fair value through other comprehensive income (available-for-sale securities under IAS 39) and debt securities at amortized cost (held-to-maturity securities
under IAS 39). For further details on the impacts of the adoption of IFRS 9 including the description of accounting policies selected, refer to the Q1/18 Report to Shareholders and our 2017 Annual Report.
-15-
1st Quarter 2018 - Supplementary Financial Information ROYAL BANK OF CANADA
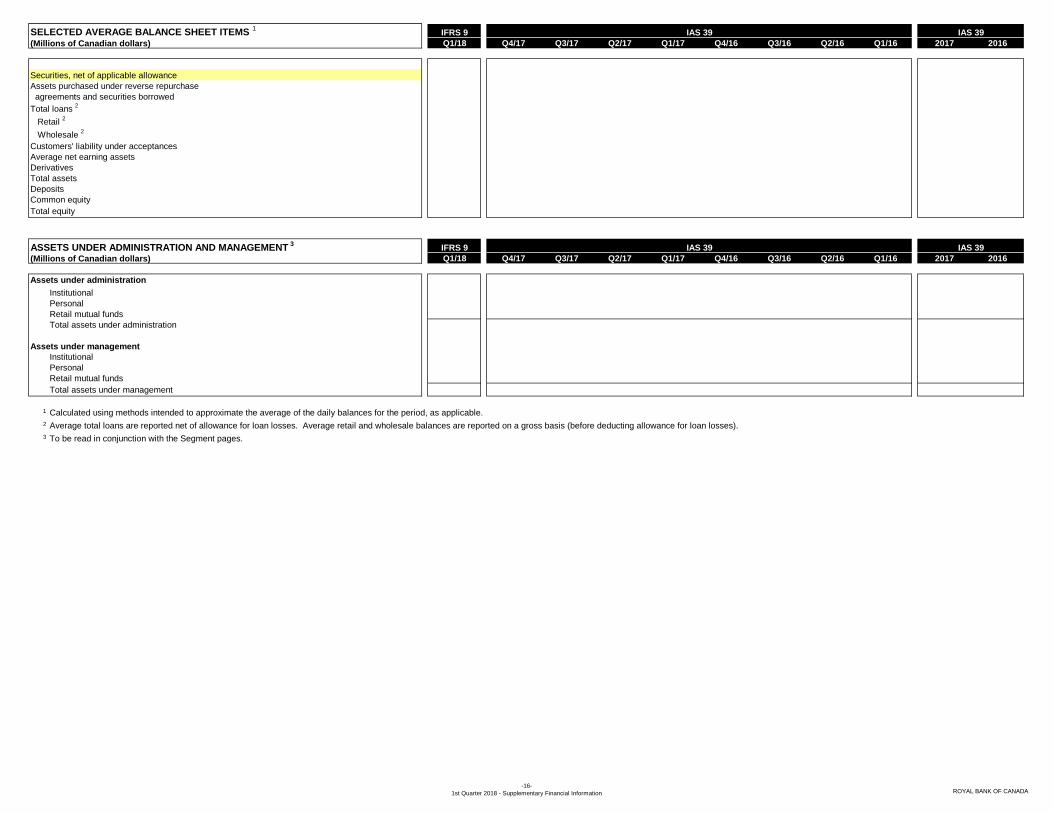
SELECTED AVERAGE BALANCE SHEET ITEMS 1
IFRS 9
(Millions of Canadian dollars) Q1/18 Q4/17 Q3/17 Q2/17 Q1/17 Q4/16 Q3/16 Q2/16 Q1/16 2017 2016
Securities, net of applicable allowance
Assets purchased under reverse repurchase
agreements and securities borrowed
Total loans 2
Retail 2
Wholesale 2
Customers' liability under acceptances
Average net earning assets
Derivatives
Total assets
Deposits
Common equity
Total equity
ASSETS UNDER ADMINISTRATION AND MANAGEMENT 3
IFRS 9
(Millions of Canadian dollars) Q1/18 Q4/17 Q3/17 Q2/17 Q1/17 Q4/16 Q3/16 Q2/16 Q1/16 2017 2016
Assets under administration
Institutional
Personal
Retail mutual funds
Total assets under administration
Assets under management
Institutional
Personal
Retail mutual funds
Total assets under management
1
2
3 To be read in conjunction with the Segment pages.
IAS 39 IAS 39
IAS 39 IAS 39
Calculated using methods intended to approximate the average of the daily balances for the period, as applicable.
Average total loans are reported net of allowance for loan losses. Average retail and wholesale balances are reported on a gross basis (before deducting allowance for loan losses).
-16-
1st Quarter 2018 - Supplementary Financial Information ROYAL BANK OF CANADA
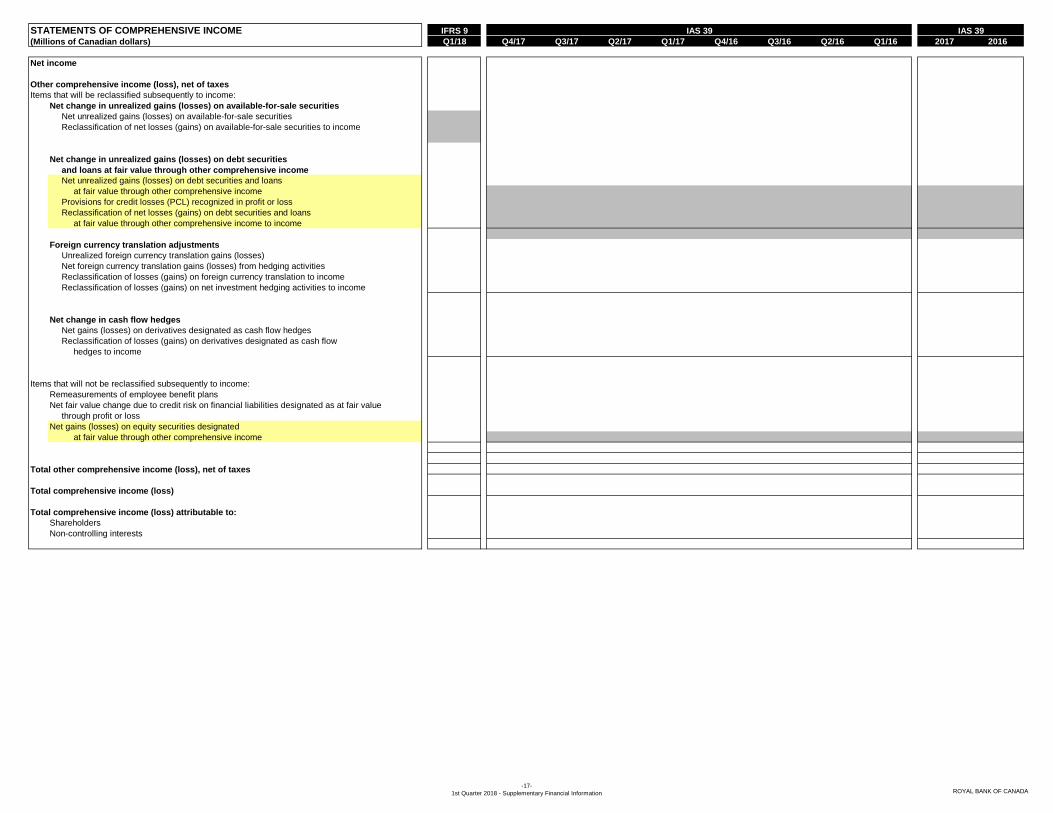
STATEMENTS OF COMPREHENSIVE INCOME IFRS 9
(Millions of Canadian dollars) Q1/18 Q4/17 Q3/17 Q2/17 Q1/17 Q4/16 Q3/16 Q2/16 Q1/16 2017 2016
Net income
Other comprehensive income (loss), net of taxes
Items that will be reclassified subsequently to income:
Net change in unrealized gains (losses) on available-for-sale securities
Net unrealized gains (losses) on available-for-sale securities
Reclassification of net losses (gains) on available-for-sale securities to income
Net change in unrealized gains (losses) on debt securities
and loans at fair value through other comprehensive income
Net unrealized gains (losses) on debt securities and loans
at fair value through other comprehensive income
Provisions for credit losses (PCL) recognized in profit or loss
Reclassification of net losses (gains) on debt securities and loans
at fair value through other comprehensive income to income
Foreign currency translation adjustments
Unrealized foreign currency translation gains (losses)
Net foreign currency translation gains (losses) from hedging activities
Reclassification of losses (gains) on foreign currency translation to income
Reclassification of losses (gains) on net investment hedging activities to income
Net change in cash flow hedges
Net gains (losses) on derivatives designated as cash flow hedges
Reclassification of losses (gains) on derivatives designated as cash flow
hedges to income
Items that will not be reclassified subsequently to income:
Remeasurements of employee benefit plans
Net fair value change due to credit risk on financial liabilities designated as at fair value
through profit or loss
Net gains (losses) on equity securities designated
at fair value through other comprehensive income
Total other comprehensive income (loss), net of taxes
Total comprehensive income (loss)
Total comprehensive income (loss) attributable to:
Shareholders
Non-controlling interests
IAS 39IAS 39
-17-
1st Quarter 2018 - Supplementary Financial Information ROYAL BANK OF CANADA
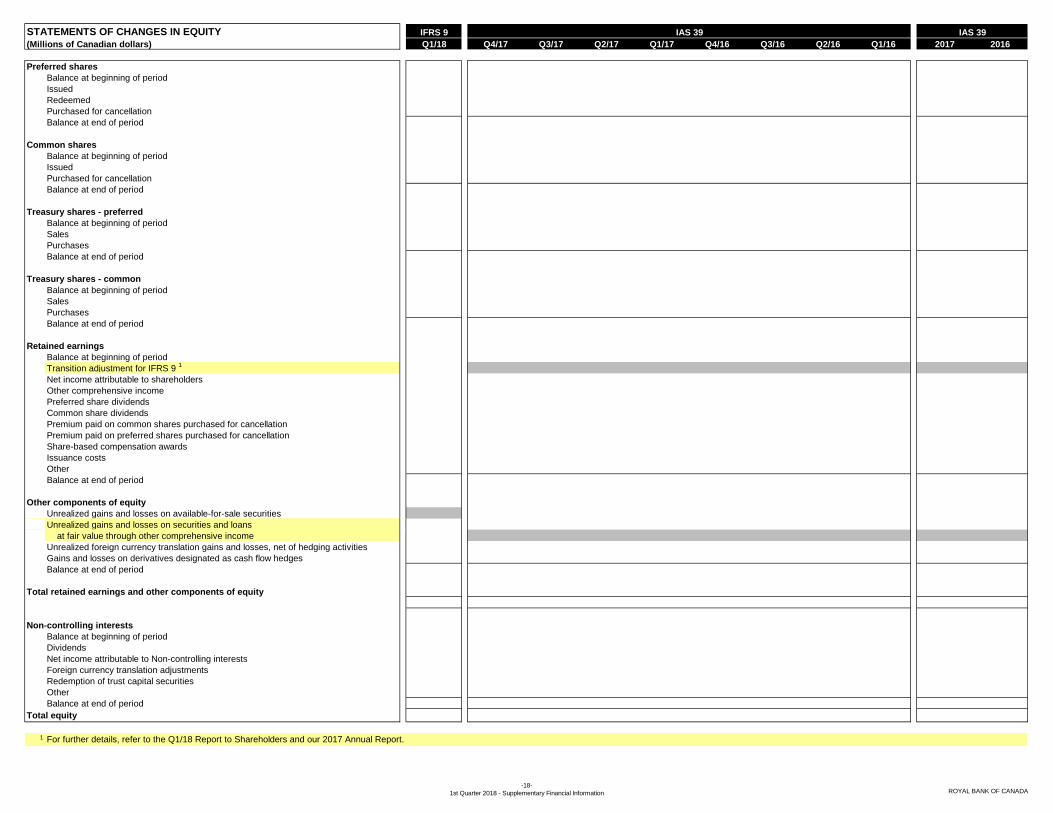
STATEMENTS OF CHANGES IN EQUITY IFRS 9
(Millions of Canadian dollars) Q1/18 Q4/17 Q3/17 Q2/17 Q1/17 Q4/16 Q3/16 Q2/16 Q1/16 2017 2016
Preferred shares
Balance at beginning of period
Issued
Redeemed
Purchased for cancellation
Balance at end of period
Common shares
Balance at beginning of period
Issued
Purchased for cancellation
Balance at end of period
Treasury shares - preferred
Balance at beginning of period
Sales
Purchases
Balance at end of period
Treasury shares - common
Balance at beginning of period
Sales
Purchases
Balance at end of period
Retained earnings
Balance at beginning of period
Transition adjustment for IFRS 9 1
Net income attributable to shareholders
Other comprehensive income
Preferred share dividends
Common share dividends
Premium paid on common shares purchased for cancellation
Premium paid on preferred shares purchased for cancellation
Share-based compensation awards
Issuance costs
Other
Balance at end of period
Other components of equity
Unrealized gains and losses on available-for-sale securities
Unrealized gains and losses on securities and loans
at fair value through other comprehensive income
Unrealized foreign currency translation gains and losses, net of hedging activities
Gains and losses on derivatives designated as cash flow hedges
Balance at end of period
Total retained earnings and other components of equity
Non-controlling interests
Balance at beginning of period
Dividends
Net income attributable to Non-controlling interests
Foreign currency translation adjustments
Redemption of trust capital securities
Other
Balance at end of period
Total equity
1
IAS 39 IAS 39
For further details, refer to the Q1/18 Report to Shareholders and our 2017 Annual Report.
-18-
1st Quarter 2018 - Supplementary Financial Information ROYAL BANK OF CANADA
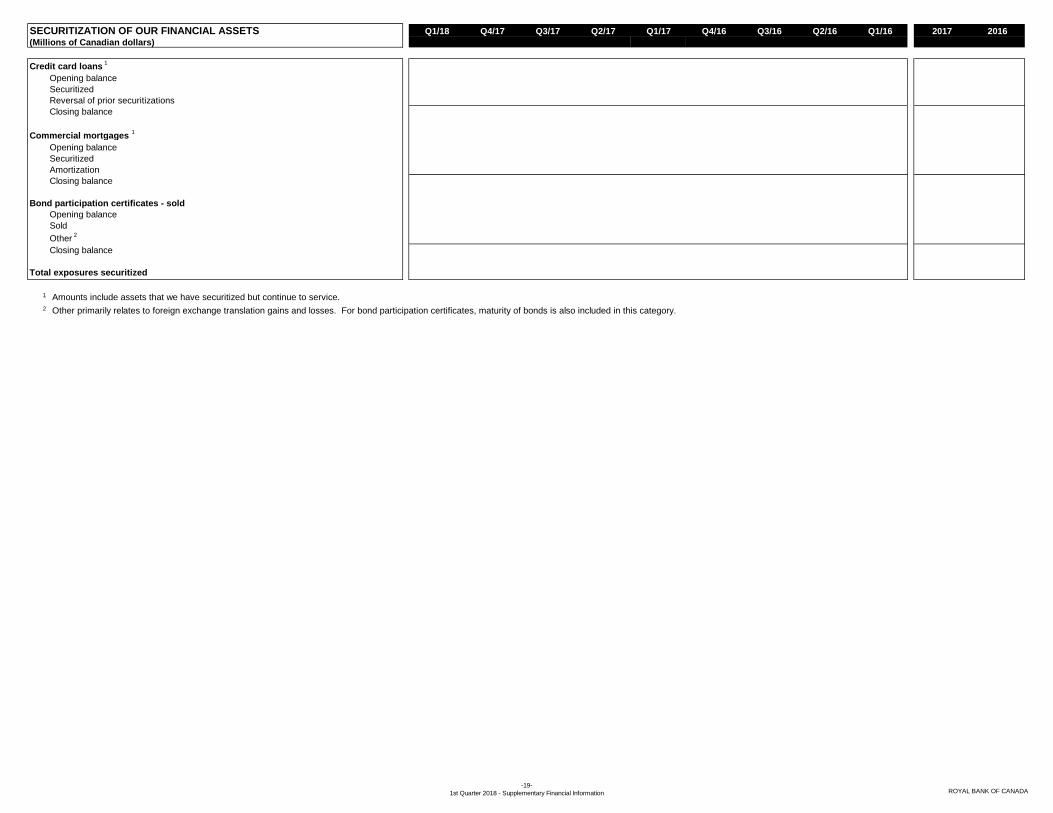
SECURITIZATION OF OUR FINANCIAL ASSETS Q1/18 Q4/17 Q3/17 Q2/17 Q1/17 Q4/16 Q3/16 Q2/16 Q1/16 2017 2016
(Millions of Canadian dollars)
Credit card loans 1
Opening balance
Securitized
Reversal of prior securitizations
Closing balance
Commercial mortgages 1
Opening balance
Securitized
Amortization
Closing balance
Bond participation certificates - sold
Opening balance
Sold
Other 2
Closing balance
1
2
Total exposures securitized
Amounts include assets that we have securitized but continue to service.
Other primarily relates to foreign exchange translation gains and losses. For bond participation certificates, maturity of bonds is also included in this category.
-19-
1st Quarter 2018 - Supplementary Financial Information ROYAL BANK OF CANADA

SECURITIZATION SUBJECT TO EARLY AMORTIZATION Q1/18 Q4/17 Q3/17 Q2/17 Q1/17 Q4/16 Q3/16 Q2/16 Q1/16
SELLER'S INTEREST(Millions of Canadian dollars)
Our financial assets 1
Credit cards
Total drawn
Capital charges drawn
Capital charges undrawn
Credit card loans securitized
Past due 2
Net write-offs
OFF-BALANCE SHEET ARRANGEMENTS
OUTSTANDING SECURITIZED ASSETS Average Average Average Average
(Millions of Canadian dollars, except percentage amounts) coverage coverage coverage coverage
Annualized multiple of Annualized multiple of Annualized multiple of Annualized multiple of
Securitized average net average net Securitized average net average net Securitized average net average net Securitized average net average net
exposures 3
loss rate 4, 5
losses 4, 5
exposures 3
loss rate 4, 5
losses 4, 5
exposures 3
loss rate 4, 5
losses 4, 5
exposures 3
loss rate 4, 5
losses 4, 5
Asset-backed securities
Auto loans and leases
Consumer loans ⁵Credit cards
Dealer floor plan receivables
Equipment receivables
Fleet finance receivables
Insurance premiums
Residential mortgages
Student loans
Trade receivables
Transportation finance
Total off-balance sheet arrangements outstanding securitized assets
1
2
3
4
5
Comprised of multi-seller asset-backed commercial paper conduit programs. The outstanding securitized assets reflect our maximum exposure to loss for liquidity and credit facilities only, and excludes derivative transactions with RBC. Of the outstanding securitized assets, XX% of
these are internally rated as investment grade.
Average annual net loss rates reflect impaired/past due assets. In our conduit programs, our risk of loss is significantly reduced due to the presence of first loss credit protection provided by the sellers of the financial assets. This protection provides an average coverage multiple as
disclosed above, representing the number of times the credit enhancement provided by others, would cover losses. Refer to our Q1/18 Report to Shareholders for a detailed discussion on credit protection and other factors, including additional credit enhancements which reduce our
risk of loss.
Amounts are reported on a two-month lag.
Q1/18 Q4/17 Q3/17 Q2/17
Amounts reported are based on regulatory securitization reporting requirements as it includes our credit card loans. It excludes our Canadian residential mortgages under the National Housing Act MBS (NHA MBS) program, which also encompasses our Canadian social housing
mortgages. These amounts differ from, and are not directly comparable to amounts reported in our Q1/18 Report to Shareholders due to the differences between IFRS accounting and regulatory consolidation.
Amounts represent credit card loans securitized greater than 90 days past due.
-20-
1st Quarter 2018 - Supplementary Financial Information ROYAL BANK OF CANADA
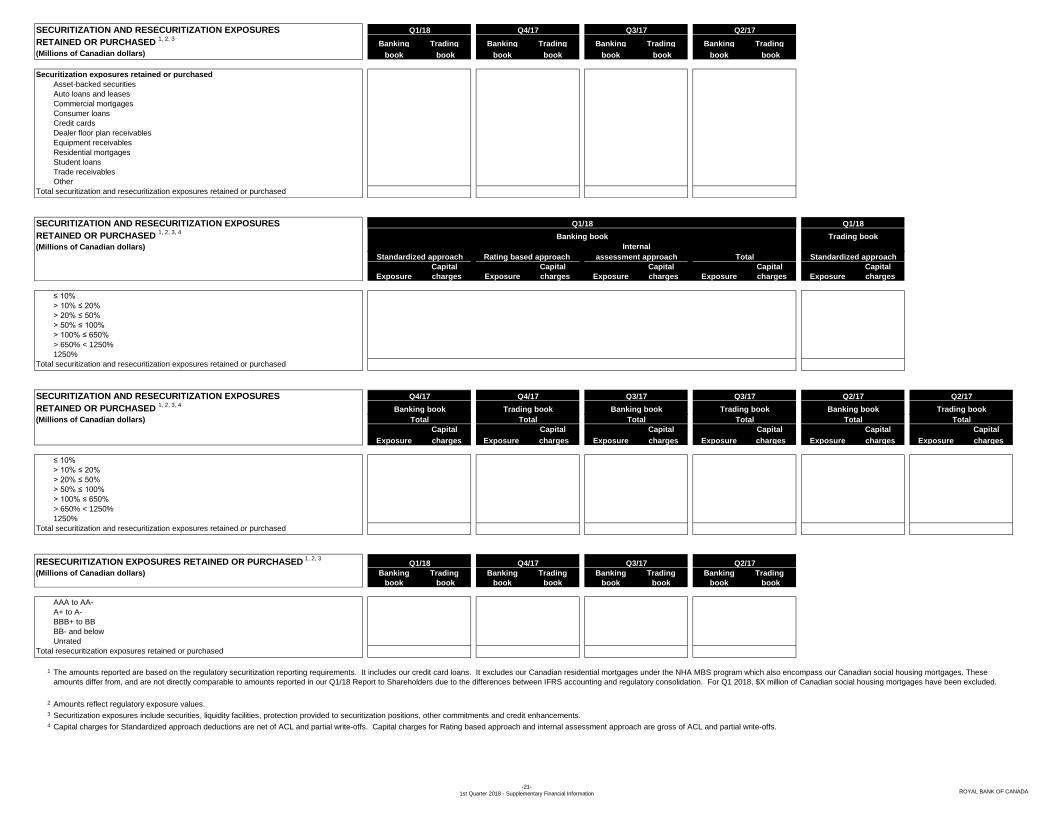
RETAINED OR PURCHASED 1, 2, 3
Banking Trading Banking Trading Banking Trading Banking Trading
(Millions of Canadian dollars) book book book book book book book book
Asset-backed securities
Auto loans and leases
Commercial mortgages
Consumer loans
Credit cards
Dealer floor plan receivables
Equipment receivables
Residential mortgages
Student loans
Trade receivables
Other
Total securitization and resecuritization exposures retained or purchased
SECURITIZATION AND RESECURITIZATION EXPOSURES
RETAINED OR PURCHASED 1, 2, 3, 4
(Millions of Canadian dollars)
Capital Capital Capital Capital Capital
Exposure charges Exposure charges Exposure charges Exposure charges Exposure charges
≤ 10%
> 10% ≤ 20%
> 20% ≤ 50%
> 50% ≤ 100%
> 100% ≤ 650%
> 650% < 1250%
1250%
SECURITIZATION AND RESECURITIZATION EXPOSURES
RETAINED OR PURCHASED 1, 2, 3, 4
(Millions of Canadian dollars)
Capital Capital Capital Capital Capital Capital
Exposure charges Exposure charges Exposure charges Exposure charges Exposure charges Exposure charges
≤ 10%
> 10% ≤ 20%
> 20% ≤ 50%
> 50% ≤ 100%
> 100% ≤ 650%
> 650% < 1250%
1250%
RESECURITIZATION EXPOSURES RETAINED OR PURCHASED 1, 2, 3
(Millions of Canadian dollars) Banking Trading Banking Trading Banking Trading Banking Trading
book book book book book book book book
AAA to AA-
A+ to A-
BBB+ to BB
BB- and below
Unrated
Total resecuritization exposures retained or purchased
1
2
3
4
Securitization exposures retained or purchased
SECURITIZATION AND RESECURITIZATION EXPOSURES Q1/18 Q4/17 Q3/17 Q2/17
Standardized approach Rating based approach assessment approach Total Standardized approach
Q1/18 Q1/18
Banking book Trading book
Internal
Total securitization and resecuritization exposures retained or purchased
Q4/17 Q4/17 Q3/17 Q3/17
Total
Q2/17
Banking book Trading book Banking book Trading book Banking book Trading book
Q2/17
Total Total Total Total Total
Amounts reflect regulatory exposure values.
Securitization exposures include securities, liquidity facilities, protection provided to securitization positions, other commitments and credit enhancements.
Capital charges for Standardized approach deductions are net of ACL and partial write-offs. Capital charges for Rating based approach and internal assessment approach are gross of ACL and partial write-offs.
Total securitization and resecuritization exposures retained or purchased
Q1/18 Q4/17 Q3/17 Q2/17
The amounts reported are based on the regulatory securitization reporting requirements. It includes our credit card loans. It excludes our Canadian residential mortgages under the NHA MBS program which also encompass our Canadian social housing mortgages. These
amounts differ from, and are not directly comparable to amounts reported in our Q1/18 Report to Shareholders due to the differences between IFRS accounting and regulatory consolidation. For Q1 2018, $X million of Canadian social housing mortgages have been excluded.
-21-
1st Quarter 2018 - Supplementary Financial Information ROYAL BANK OF CANADA
Cross Reference of IFRS 9
Current Quarter to Q1/18 Q4/17 Q3/17 Q2/17 Q1/17
Regulatory Capital
Balance Sheet Pages
23-24
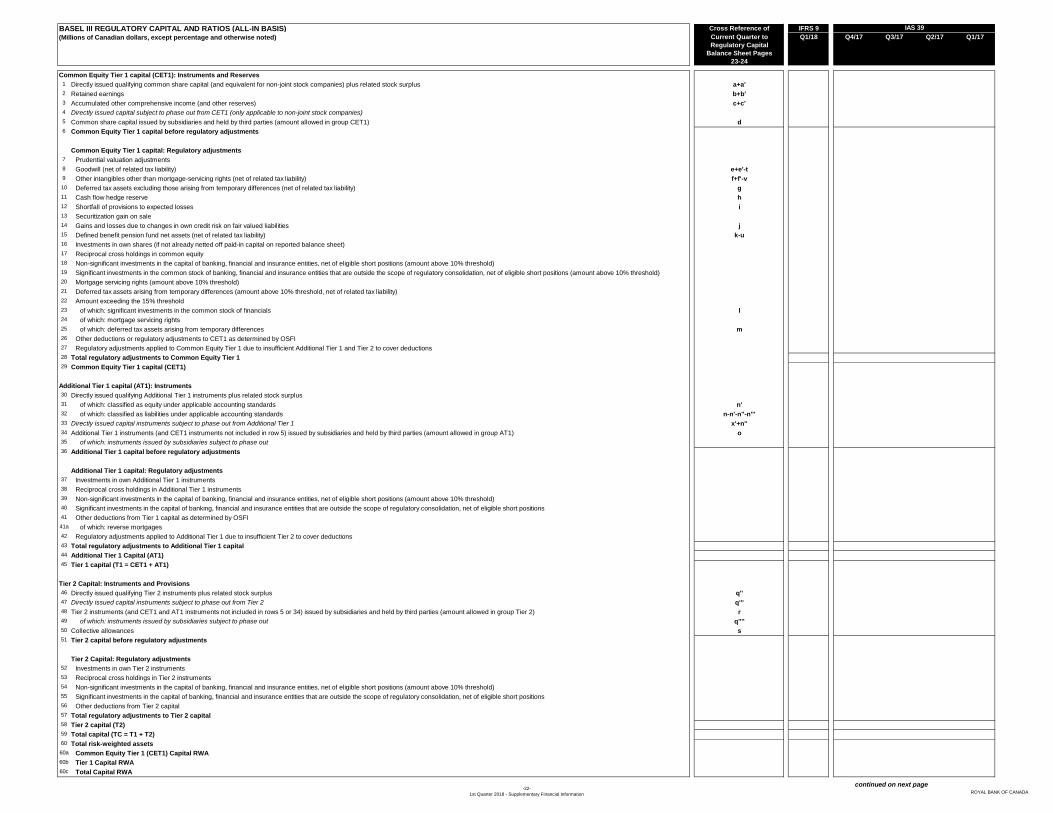
Common Equity Tier 1 capital (CET1): Instruments and Reserves
1 Directly issued qualifying common share capital (and equivalent for non-joint stock companies) plus related stock surplus a+a'
2 Retained earnings b+b'
3 Accumulated other comprehensive income (and other reserves) c+c'
4 Directly issued capital subject to phase out from CET1 (only applicable to non-joint stock companies)
5 Common share capital issued by subsidiaries and held by third parties (amount allowed in group CET1) d
6 Common Equity Tier 1 capital before regulatory adjustments
Common Equity Tier 1 capital: Regulatory adjustments
7 Prudential valuation adjustments
8 Goodwill (net of related tax liability) e+e'-t
9 Other intangibles other than mortgage-servicing rights (net of related tax liability) f+f'-v
10 Deferred tax assets excluding those arising from temporary differences (net of related tax liability) g
11 Cash flow hedge reserve h
12 Shortfall of provisions to expected losses i
13 Securitization gain on sale
14 Gains and losses due to changes in own credit risk on fair valued liabilities j
15 Defined benefit pension fund net assets (net of related tax liability) k-u
16 Investments in own shares (if not already netted off paid-in capital on reported balance sheet)
17 Reciprocal cross holdings in common equity
18 Non-significant investments in the capital of banking, financial and insurance entities, net of eligible short positions (amount above 10% threshold)
19 Significant investments in the common stock of banking, financial and insurance entities that are outside the scope of regulatory consolidation, net of eligible short positions (amount above 10% threshold)
20 Mortgage servicing rights (amount above 10% threshold)
21 Deferred tax assets arising from temporary differences (amount above 10% threshold, net of related tax liability)
22 Amount exceeding the 15% threshold
23 of which: significant investments in the common stock of financials l
24 of which: mortgage servicing rights
25 of which: deferred tax assets arising from temporary differences m
26 Other deductions or regulatory adjustments to CET1 as determined by OSFI
27 Regulatory adjustments applied to Common Equity Tier 1 due to insufficient Additional Tier 1 and Tier 2 to cover deductions
28 Total regulatory adjustments to Common Equity Tier 1
29 Common Equity Tier 1 capital (CET1)
Additional Tier 1 capital (AT1): Instruments
30 Directly issued qualifying Additional Tier 1 instruments plus related stock surplus
31 of which: classified as equity under applicable accounting standards n'
32 of which: classified as liabilities under applicable accounting standards n-n'-n''-n'''
33 Directly issued capital instruments subject to phase out from Additional Tier 1 x'+n''
34 Additional Tier 1 instruments (and CET1 instruments not included in row 5) issued by subsidiaries and held by third parties (amount allowed in group AT1) o
35 of which: instruments issued by subsidiaries subject to phase out
36 Additional Tier 1 capital before regulatory adjustments
Additional Tier 1 capital: Regulatory adjustments
37 Investments in own Additional Tier 1 instruments
38 Reciprocal cross holdings in Additional Tier 1 instruments
39 Non-significant investments in the capital of banking, financial and insurance entities, net of eligible short positions (amount above 10% threshold)
40 Significant investments in the capital of banking, financial and insurance entities that are outside the scope of regulatory consolidation, net of eligible short positions
41 Other deductions from Tier 1 capital as determined by OSFI
41a of which: reverse mortgages
42 Regulatory adjustments applied to Additional Tier 1 due to insufficient Tier 2 to cover deductions
43 Total regulatory adjustments to Additional Tier 1 capital
44 Additional Tier 1 Capital (AT1)
45 Tier 1 capital (T1 = CET1 + AT1)
Tier 2 Capital: Instruments and Provisions
46 Directly issued qualifying Tier 2 instruments plus related stock surplus q''
47 Directly issued capital instruments subject to phase out from Tier 2 q'''
48 Tier 2 instruments (and CET1 and AT1 instruments not included in rows 5 or 34) issued by subsidiaries and held by third parties (amount allowed in group Tier 2) r
49 of which: instruments issued by subsidiaries subject to phase out q''''
50 Collective allowances s
51 Tier 2 capital before regulatory adjustments
Tier 2 Capital: Regulatory adjustments
52 Investments in own Tier 2 instruments
53 Reciprocal cross holdings in Tier 2 instruments
54 Non-significant investments in the capital of banking, financial and insurance entities, net of eligible short positions (amount above 10% threshold)
55 Significant investments in the capital of banking, financial and insurance entities that are outside the scope of regulatory consolidation, net of eligible short positions
56 Other deductions from Tier 2 capital
57 Total regulatory adjustments to Tier 2 capital
58 Tier 2 capital (T2)
59 Total capital (TC = T1 + T2)
60 Total risk-weighted assets
60a Common Equity Tier 1 (CET1) Capital RWA
60b Tier 1 Capital RWA
60c Total Capital RWA
BASEL III REGULATORY CAPITAL AND RATIOS (ALL-IN BASIS)(Millions of Canadian dollars, except percentage and otherwise noted)
continued on next page
IAS 39
-22-
1st Quarter 2018 - Supplementary Financial Information ROYAL BANK OF CANADA
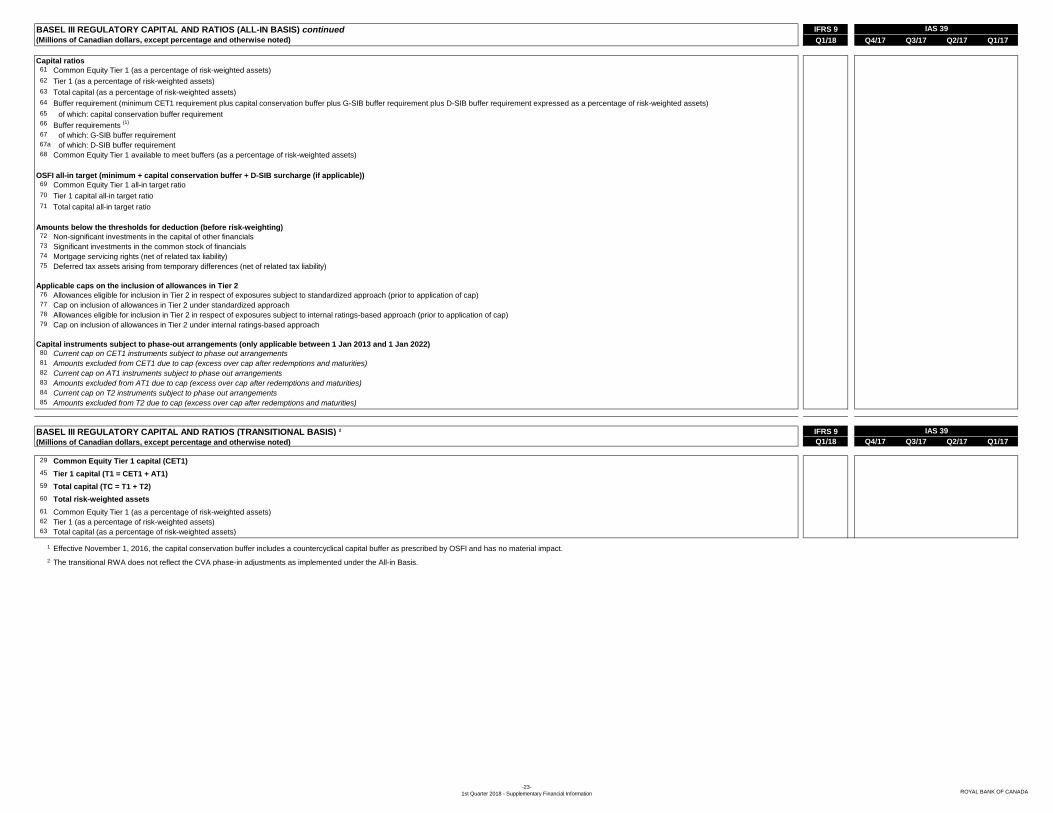
IFRS 9
Q1/18 Q4/17 Q3/17 Q2/17 Q1/17
Capital ratios61 Common Equity Tier 1 (as a percentage of risk-weighted assets)
62 Tier 1 (as a percentage of risk-weighted assets)
63 Total capital (as a percentage of risk-weighted assets)
64 Buffer requirement (minimum CET1 requirement plus capital conservation buffer plus G-SIB buffer requirement plus D-SIB buffer requirement expressed as a percentage of risk-weighted assets)
65 of which: capital conservation buffer requirement66 Buffer requirements
(1)
67 of which: G-SIB buffer requirement 67a of which: D-SIB buffer requirement
68 Common Equity Tier 1 available to meet buffers (as a percentage of risk-weighted assets)
OSFI all-in target (minimum + capital conservation buffer + D-SIB surcharge (if applicable))69 Common Equity Tier 1 all-in target ratio
70 Tier 1 capital all-in target ratio
71 Total capital all-in target ratio
Amounts below the thresholds for deduction (before risk-weighting)72 Non-significant investments in the capital of other financials73 Significant investments in the common stock of financials74 Mortgage servicing rights (net of related tax liability)75 Deferred tax assets arising from temporary differences (net of related tax liability)
Applicable caps on the inclusion of allowances in Tier 276 Allowances eligible for inclusion in Tier 2 in respect of exposures subject to standardized approach (prior to application of cap)77 Cap on inclusion of allowances in Tier 2 under standardized approach78 Allowances eligible for inclusion in Tier 2 in respect of exposures subject to internal ratings-based approach (prior to application of cap)79 Cap on inclusion of allowances in Tier 2 under internal ratings-based approach
Capital instruments subject to phase-out arrangements (only applicable between 1 Jan 2013 and 1 Jan 2022)80 Current cap on CET1 instruments subject to phase out arrangements81 Amounts excluded from CET1 due to cap (excess over cap after redemptions and maturities)82 Current cap on AT1 instruments subject to phase out arrangements83 Amounts excluded from AT1 due to cap (excess over cap after redemptions and maturities)84 Current cap on T2 instruments subject to phase out arrangements85 Amounts excluded from T2 due to cap (excess over cap after redemptions and maturities)
IFRS 9
Q1/18 Q4/17 Q3/17 Q2/17 Q1/17
29 Common Equity Tier 1 capital (CET1)
45 Tier 1 capital (T1 = CET1 + AT1)
59 Total capital (TC = T1 + T2)
60 Total risk-weighted assets
61 Common Equity Tier 1 (as a percentage of risk-weighted assets)62 Tier 1 (as a percentage of risk-weighted assets)63 Total capital (as a percentage of risk-weighted assets)
1
2 The transitional RWA does not reflect the CVA phase-in adjustments as implemented under the All-in Basis.
BASEL III REGULATORY CAPITAL AND RATIOS (ALL-IN BASIS) continued(Millions of Canadian dollars, except percentage and otherwise noted)
BASEL III REGULATORY CAPITAL AND RATIOS (TRANSITIONAL BASIS) 2
(Millions of Canadian dollars, except percentage and otherwise noted)
Effective November 1, 2016, the capital conservation buffer includes a countercyclical capital buffer as prescribed by OSFI and has no material impact.
IAS 39
IAS 39
-23-
1st Quarter 2018 - Supplementary Financial Information ROYAL BANK OF CANADA
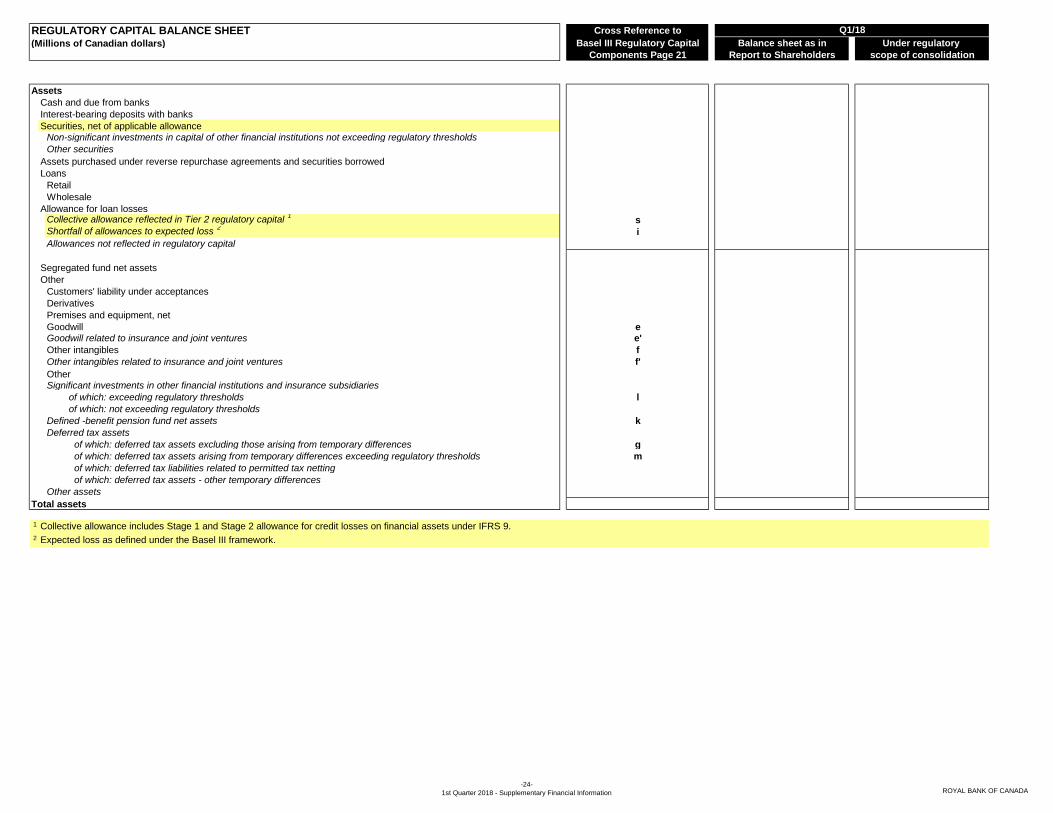
Cross Reference to
Basel III Regulatory Capital Balance sheet as in Under regulatory
Components Page 21 Report to Shareholders scope of consolidation
Assets
Cash and due from banks
Interest-bearing deposits with banks
Securities, net of applicable allowanceNon-significant investments in capital of other financial institutions not exceeding regulatory thresholds
Other securities
Assets purchased under reverse repurchase agreements and securities borrowed
Loans
Retail
Wholesale
Allowance for loan lossesCollective allowance reflected in Tier 2 regulatory capital
1s
Shortfall of allowances to expected loss 2
i
Allowances not reflected in regulatory capital
Segregated fund net assets
Other
Customers' liability under acceptances
Derivatives
Premises and equipment, net
Goodwill eGoodwill related to insurance and joint ventures e'
Other intangibles f
Other intangibles related to insurance and joint ventures f'
OtherSignificant investments in other financial institutions and insurance subsidiaries
of which: exceeding regulatory thresholds l
of which: not exceeding regulatory thresholds
Defined -benefit pension fund net assets k
Deferred tax assets
of which: deferred tax assets excluding those arising from temporary differences g
of which: deferred tax assets arising from temporary differences exceeding regulatory thresholds m
of which: deferred tax liabilities related to permitted tax netting
of which: deferred tax assets - other temporary differences
Other assets
Total assets
1
2
REGULATORY CAPITAL BALANCE SHEET Q1/18
(Millions of Canadian dollars)
Collective allowance includes Stage 1 and Stage 2 allowance for credit losses on financial assets under IFRS 9.
Expected loss as defined under the Basel III framework.
-24-
1st Quarter 2018 - Supplementary Financial Information ROYAL BANK OF CANADA

Cross Reference to
Basel III Regulatory Capital Balance sheet as in Under regulatory
Components Page 21 Report to Shareholders scope of consolidation
Liabilities
Deposits
Personal
Business and government
Bank
Segregated fund net liabilities
Other
Acceptances
Obligations related to securities sold short
Obligations related to assets sold under repurchase agreements and securities loaned
Derivatives
Insurance claims and policy benefit liabilities
Other liabilities
Gains and losses due to changes in own credit risk on fair value liabilities j
Deferred tax liabilities
of which: related to goodwill t
of which: related to intangibles v
of which: related to pensions u
of which: relates to permitted tax netting w
of which: other deferred tax liabilities
Other Liabilities
Subordinated debentures q
Regulatory capital amortization of maturing debentures
Subordinated debentures not allowed for regulatory capital q'
Subordinated debentures used for regulatory capital:
of which: are qualifying q''
of which: are subject to phase out directly issued capital: q'''
of which: are subject to phase out issued by subsidiaries and held by 3rd party q''''
Total liabilities
Equity attributable to shareholders
Common shares a
of which are treasury shares - common a''
Retained earnings
of which relates to contributed surplus a'
of which relates to retained earning for capital purposes b
of which relates to insurance and joint ventures b'
Other components of equity c
Gains and losses on derivatives designated as cash flow hedges h
Unrealized foreign currency translation gains and losses, net of hedging activities
Other reserves allowed for regulatory capital
of which relates to Insurance c'
Preferred shares n
of which: are qualifying n'
of which: are subject to phase out n''
of which portion are not allowed for regulatory capital n'''
of which: are qualifying treasury shares n''''
of which: are subject to phase out treasury shares n'''''
Non-controlling interests x
of which: are qualifying
portion allowed for inclusion into CET1 d
portion allowed for inclusion into Tier 1 capital o
portion allowed for inclusion into Tier 2 capital r
of which: are subject to phase out x'
of which: portion not allowed for regulatory capital
Total equity
Total liabilities and equity
Equity Assets
Insurance subsidiaries 1 Principal activities
Assured Assistance Inc. Service provider for insurance claims
RBC General Insurance Company Property and casualty insurance company
RBC Insurance Services Inc. Service provider for insurance companies listed and the bank (creditor)
RBC Life Insurance Company Life and health insurance company
RBC Insurance Company of Canada Property and casualty insurance company
RBC Insurance Holdings Inc. Holding company
Royal Bank of Canada Insurance Company Limited Life, annuity, trade credit, title and property reinsurance company provides coverage to international clients
1
REGULATORY CAPITAL BALANCE SHEET continued Q1/18
(Millions of Canadian dollars)
The list of legal entities that are included within the accounting scope of consolidation but excluded from the regulatory scope of consolidation.
-25-
1st Quarter 2018 - Supplementary Financial Information ROYAL BANK OF CANADA
IFRS 9
Q1/18 Q4/17 Q3/17 Q2/17 Q1/17
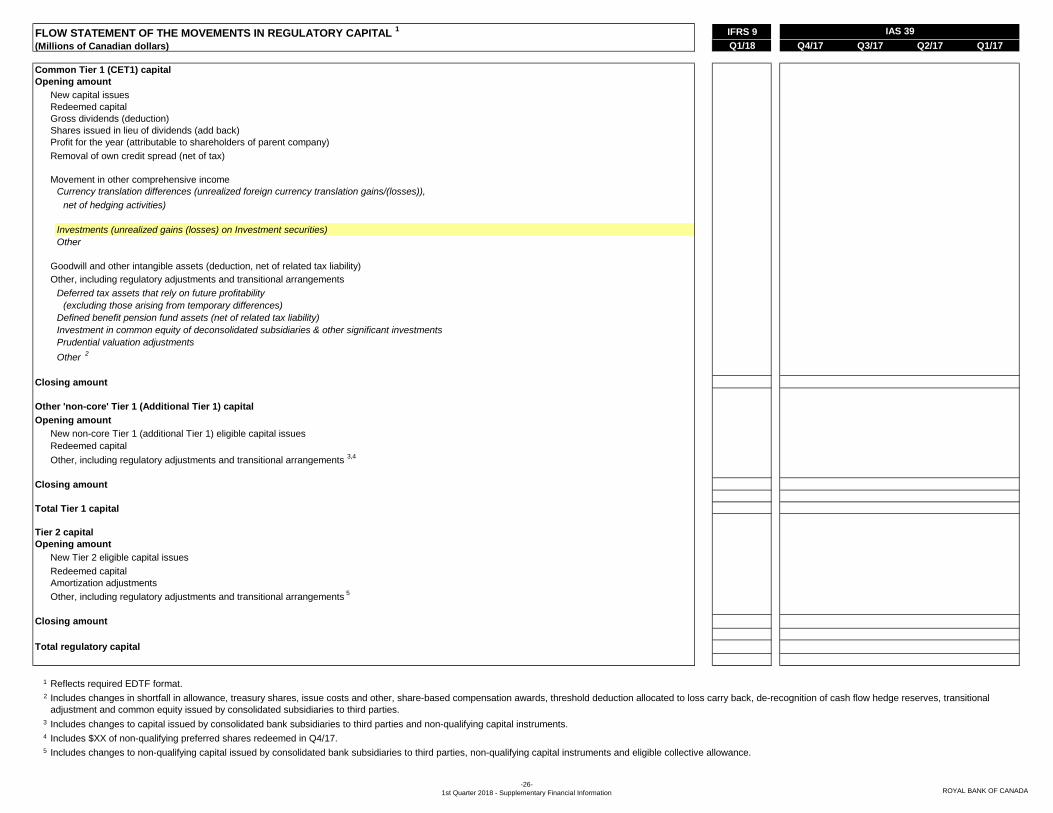
Common Tier 1 (CET1) capital
Opening amount
New capital issues
Redeemed capital
Gross dividends (deduction)
Shares issued in lieu of dividends (add back)
Profit for the year (attributable to shareholders of parent company)
Removal of own credit spread (net of tax)
Movement in other comprehensive income
Currency translation differences (unrealized foreign currency translation gains/(losses)),
net of hedging activities)
Investments (unrealized gains (losses) on Investment securities)
Goodwill and other intangible assets (deduction, net of related tax liability)
Other, including regulatory adjustments and transitional arrangements
Deferred tax assets that rely on future profitability
(excluding those arising from temporary differences)
Defined benefit pension fund assets (net of related tax liability)
Investment in common equity of deconsolidated subsidiaries & other significant investments
Prudential valuation adjustments
Other 2
Closing amount
Other 'non-core' Tier 1 (Additional Tier 1) capital
Opening amount
New non-core Tier 1 (additional Tier 1) eligible capital issues
Redeemed capital
Other, including regulatory adjustments and transitional arrangements 3,4
Closing amount
Total Tier 1 capital
Tier 2 capital
Opening amount
New Tier 2 eligible capital issues
Redeemed capital
Amortization adjustments
Other, including regulatory adjustments and transitional arrangements 5
Closing amount
Total regulatory capital
1
2
3
4
5
Includes changes to capital issued by consolidated bank subsidiaries to third parties and non-qualifying capital instruments.
Includes $XX of non-qualifying preferred shares redeemed in Q4/17.
Includes changes to non-qualifying capital issued by consolidated bank subsidiaries to third parties, non-qualifying capital instruments and eligible collective allowance.
FLOW STATEMENT OF THE MOVEMENTS IN REGULATORY CAPITAL 1
(Millions of Canadian dollars)
Other
Reflects required EDTF format.
Includes changes in shortfall in allowance, treasury shares, issue costs and other, share-based compensation awards, threshold deduction allocated to loss carry back, de-recognition of cash flow hedge reserves, transitional
adjustment and common equity issued by consolidated subsidiaries to third parties.
IAS 39
-26-
1st Quarter 2018 - Supplementary Financial Information ROYAL BANK OF CANADA

TOTAL CAPITAL RISK-WEIGHTED ASSETS 1 IFRS 9
(Millions of Canadian dollars, except percentage and per share amounts) Q1/18
Capital requirements
Average
of risk Standardized Advanced Q4/17 Q3/17 Q2/17 Q1/17
Exposure 2
weights 3 approach approach Other Total
4Total
4Total
4Total
4Total
4Total
4
Credit risk 5
Lending-related and other
Residential mortgages
Other retail (Personal, Credit cards and Small business treated as retail)
Business (Corporate, Commercial, Medium-sized enterprises and Non-bank
financial institutions)
Sovereign (Government)
Bank
Total lending-related and other
Trading-related
Repo-style transactions
Derivatives -including CVA - CET1 phase-in adjustment 6
Total trading-related
Total lending-related and other and trading-related
Bank book equities 7, 8
Securitization exposures
Regulatory scaling factor 9
Other assets 10
Total credit risk 10
Market risk 11, 12
Interest rate
Equity
Foreign exchange
Commodities
Specific risk
Incremental risk charge 13, 14
Total market risk
Operational risk 15
Regulatory floor adjustment
CET1 capital risk-weighted assets
Additional CVA adjustment, prescribed by OSFI, for Tier 1 Capital 6
Regulatory floor adjustment
Tier 1 capital risk-weighted assets
Additional CVA adjustment, prescribed by OSFI, for Total Capital 6
Regulatory floor adjustment
Total capital risk-weighted assets (RWA)
Total RWA before CVA Phase -in RWA Net CVA Regulatory RWA including
CVA OSFI Scalars CVA phase-in Adjustments phase-in Floor Regulatory Floor
RWA CVA PHASE-IN CALCULATION 6
(A) (B) (C) (D)=A*(100%-B) (E)=C-D Adjustment Adjustment, net CVA
Common equity tier 1 (CET1) capital RWA
Tier 1 capital RWA
Total capital RWA
1
2
3
4
5
6
7
8
9
10
11
12
13
14
15
IFRS 9
Risk-weighted assets All-in Basis
Calculated using guidelines issued by OSFI under the Basel III All-in framework.
Total exposure represents exposure at default which is the expected gross exposure upon the default of an obligor. This amount excludes any allowance against impaired loans or partial write-offs and does not reflect the impact of credit risk mitigation.
Represents the average of counterparty risk weights within a particular category.
Q1/18
IAS 39
Risk-weighted assets All-in Basis
For credit risk, portfolios using the Standardized and IRB Approaches represents XX% and XX%, respectively, of RWA. The remaining XX% represents Balance Sheet assets not included in Standardized or IRB Approaches.
For market risk RWA measurement, we use an internal models approach where we have obtained regulatory approval, and a standardized approach for products yet to be approved.
Regulatory capital for our correlation trading portfolios is determined through the standardized approach as prescribed by OSFI. Therefore, we do not have a Comprehensive Risk Charge for these portfolios. Our securitization and resecuritization positions in our trading book also have capital requirements
under the standardized approach. The changes in value due to market and credit risk in the securitization and resecuritization in the trading book are managed through the daily mark–to-market process. Furthermore, we employ market risk measures such as sensitivities to changes in option-adjusted
spreads and underlying asset prices as well as VaR and stress testing measures.
The incremental risk charge (IRC) was $XX million as at Q1/18. The average was $XX million, high was $XX million and low was $XX million for Q1/18. The IRC is measured over a one-year horizon at a 99.9% confidence level. We utilize a technique known as the Monte Carlo simulation process to generate a statistically relevant
number of loss scenarios due to ratings migration and default in order to establish the losses at that confidence level. We also make certain assumptions about position liquidity (the length of time to close out a position) within the model that range from a floor of three months to maximum of one year. The determination of liquidity
is based on issuer type and credit rating. Credit rating migration and default probabilities are based on historical data.
The models are subject to the same internal independent vetting and validation procedures used for all regulatory capital models. Important assumptions are re-reviewed at least annually. Due to the long time horizon and high confidence level of the risk measure, we do not perform back-testing as we do for
the VaR measure.
On May 10, 2016 OSFI approved RBC's application to use the Advanced Measurement Approach for Operational Risk, subject to a capital floor.
The scaling factor represents a calibration adjustment of 6% as prescribed by OSFI under the Basel III framework and is applied to RWA amounts for credit risk assessed under the IRB Approach.
The minimum capital requirements for each category can be calculated by multiplying the total RWA by 8%.
For credit risk, a majority of our portfolios use the Internal Ratings Based (IRB) Approach and the remainder use the Standardized Approach.
As per OSFI guidelines, the CVA regulatory capital charge applied to derivatives has a three tier capital approach with different scalars for each tier. For 2016 the scalars percentages were 64%, 71% and 77% applied to CET1, Tier 1 and Total capital respectively. 2017 scalars are shown above.
CAR (Capital Adequacy Requirement) guidelines define banking book equities based on the economic substance of the transaction rather than the legal form or accounting treatment associated with the financial instrument. As such, differences exist in the identification of equity securities held in the banking book and those
reported in the financial statements. Banking book equities are financial instruments held for investment purposes and are not part of our trading book, consisting of publicly-traded and private equities, partnership units, venture capital and derivative instruments tied to equity interests.
As at Q4/17, the amount of publicly-traded equity exposures was $XX million and private equity exposures amounted to $XX million. Total exposure represents exposure at default, which is the expected gross exposure upon the default of an obligor.
Effective Q1/17, the Basel Committee on Banking Supervision issued new requirements for Equity Investments in Funds (BCBS 266). The Simple Risk Weight method under the Market-based Approach is being used to calculate RWA for Direct Equity exposures ($XX million). On the other hand, the calculation of RWA for Equity
Investments in Funds ($XX million) uses the Mandate-based and Fall-Back Approaches.
The amount of available-for-sale securities held in the banking book that were "grandfathered" under CAR (Capital Adequacy Requirement) guidelines, and thus subject to a 100% risk-weighting until the end of 2017, was $XX million for Q4/17.
-27-
1st Quarter 2018 - Supplementary Financial Information ROYAL BANK OF CANADA
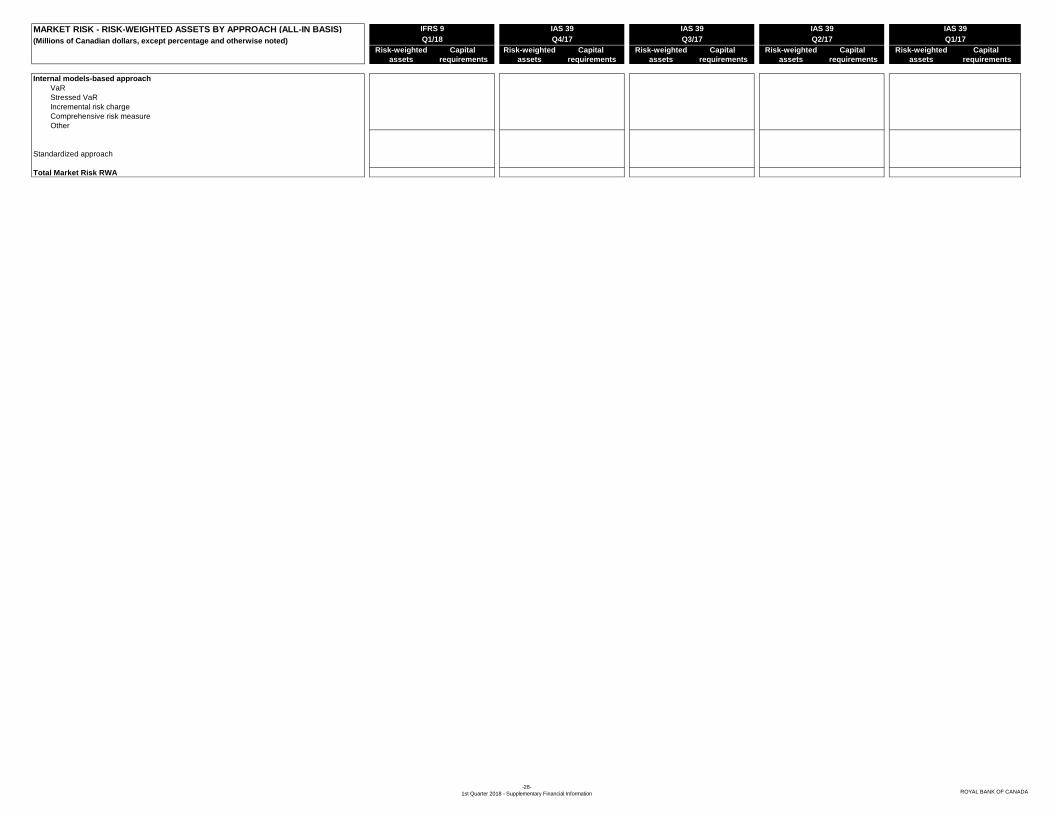
MARKET RISK - RISK-WEIGHTED ASSETS BY APPROACH (ALL-IN BASIS)
(Millions of Canadian dollars, except percentage and otherwise noted)
Risk-weighted Capital Risk-weighted Capital Risk-weighted Capital Risk-weighted Capital Risk-weighted Capital
assets requirements assets requirements assets requirements assets requirements assets requirements
Internal models-based approach
VaR
Stressed VaR
Incremental risk charge
Comprehensive risk measure
Other
Standardized approach
Total Market Risk RWA
Q1/18 Q4/17 Q3/17 Q2/17 Q1/17
IFRS 9 IAS 39 IAS 39 IAS 39 IAS 39
-28-
1st Quarter 2018 - Supplementary Financial Information ROYAL BANK OF CANADA
IFRS 9
BUSINESS SEGMENTS (ALL-IN BASIS) Q1/18 Q4/17 Q3/17 Q2/17 Q1/17 Q4/16 Q3/16
(Millions of Canadian dollars)
Personal and Commercial Banking
Canadian Banking
Caribbean & U.S. Banking
Wealth Management
Insurance
Investor & Treasury Services
Capital Markets
Corporate Support
Total capital risk-weighted assets
ASSETS (RWA) BY RISK TYPE (ALL-IN BASIS) Non- Non- Non- Non-
(Millions of Canadian dollars, except percentage counterparty Counterparty counterparty Counterparty counterparty Counterparty counterparty Counterparty
and otherwise noted) credit risk credit risk Total credit risk credit risk Total credit risk credit risk Total credit risk credit risk Total
Credit risk RWA
Opening balance of credit risk RWA
Portfolio size 1
Portfolio credit quality 2
Model updates 3
Methodology and policy 4
Acquisitions and dispositions
Foreign exchange movements
Other
Closing balance of credit risk RWA
Market risk RWA
Opening balance of market risk RWA
Movement in risk levels 5
Model updates 3
Methodology and policy 4
Acquisitions and dispositions
Foreign exchange movements
Other
Closing balance of market risk RWA
Operational risk RWA
Opening balance of operational risk RWA
Revenue generation
Closing balance of operational risk RWA
Regulatory floor adjustment
Total capital RWA
ATTRIBUTED CAPITAL IFRS 9
(Millions of Canadian dollars) Q1/18 Q4/17 Q3/17 Q2/17 Q1/17 Q4/16 Q3/16 Q2/16 Q1/16 2017 2016
Attributed capital
Credit risk
Market risk (trading and non-trading)
Operational risk
Business and fixed assets risk
Insurance risk
Goodwill and intangibles
Regulatory capital allocation 6
Attributed capital
Under/(over) attribution of capital 6, 7
Total average common equity
1
2
3
4
5
6
7
IAS 39 IAS 39
IAS 39
IAS 39TOTAL CAPITAL RISK-WEIGHTED ASSETS BY
MOVEMENT OF TOTAL CAPITAL RISK-WEIGHTED IFRS 9 IAS 39 IAS 39
Q1/18 Q4/17 Q3/17 Q2/17
Under/(over) attribution of capital is reported in Corporate Support.
Organic changes in portfolio size and composition (including new business and maturing loans).
Quality of book changes caused by experience such as underlying customer behaviour or demographics and credit migration.
Updates to the model to reflect recent experience, model implementation, change in model scope or any change to address model malfunctions including changes through model calibrations/realignments.
Methodology changes to the calculations driven by regulatory policy changes.
Change in risk due to position changes and market movements.
Our capital allocation methodology is annually revised to anticipate and incorporate any changes in the regulatory (Basel and/or OSFI) environment that affects our capital requirement.
-29-
1st Quarter 2018 - Supplementary Financial Information ROYAL BANK OF CANADA

LEVERAGE RATIO IFRS 9
Q1/18 Q4/17 Q3/17 Q2/17 Q1/17
(Millions of Canadian dollars)
1 Total consolidated assets as per published financial statements2 Adjustment for investments in banking, financial, insurance or commercial entities that are consolidated for
accounting purposes but outside the scope of regulatory consolidation3 Adjustment for fiduciary assets recognized on the balance sheet pursuant to the operative accounting
framework but excluded from the leverage ratio exposure measure4 Adjustments for derivative financial instruments5 Adjustment for securities financing transactions (SFT) (i.e. repo assets and similar secured lending)
6 Adjustments for off-balance sheet items (i.e., credit equivalent amounts of off-balance sheet exposures)7 Other adjustments
8 Leverage Ratio Exposure - (transitional basis)
Additional information
Leverage ratio exposure - transitional basis
Additional asset amounts deducted in determining Basel III all-in Tier 1 capital
Leverage Ratio Exposure - all-in basis
Summary comparison of accounting assets vs. leverage ratio exposure measure - transitional basis
IAS 39
-30-
1st Quarter 2018 - Supplementary Financial Information ROYAL BANK OF CANADA

LEVERAGE RATIO COMMON DISCLOSURE TEMPLATE 1
IFRS 9
(Millions of Canadian dollars, except percentages) Q1/18 Q4/17 Q3/17 Q2/17 Q1/17
1 On-balance sheet items (excluding derivatives, SFTs and grandfathered securitization exposures, but
including collateral)
2 (Asset amounts deducted in determining Basel III transitional Tier 1 capital)
3 Total on-balance sheet exposure (excluding derivatives and SFTs) (sum of lines 1 and 2)
4 Replacement cost associated with all derivatives transactions (i.e., net of eligible cash variation margin)
5 Add-on amounts for PFE associated with all derivatives transactions
6 Gross-up for derivatives collateral provided where deducted from the balance sheet assets pursuant to
the operative accounting framework
7 (Deductions of receivables assets for cash variation margin provided in derivatives transactions)
8 (Exempted CCP-leg of client-cleared trade exposures)
9 Adjusted effective notional amount of written credit derivatives
10 (Adjusted effective notional offsets and add-on deductions for written credit derivatives)
11 Total derivative exposures (sum of lines 4 to 10)
12 Gross SFT assets recognized for accounting purposes (with no recognition of netting), after adjusting
for sale accounting transactions
13 (Netted amounts of cash payables and cash receivables of gross SFT assets)
14 Counterparty credit risk (CCR) exposure for SFTs
15 Agent transaction exposures
16 Total securities financing transaction exposures (sum of lines 12 to 15)
17 Off-balance sheet exposures at gross notional amount
18 (Adjustments for conversion to credit equivalent amounts)
19 Off-balance sheet items (sum of lines 17 and 18)
20 Tier 1 capital
21 Total Exposures (sum of lines 3,11,16 and 19)
22 Basel III leverage ratio
23 Tier 1 capital - All-in basis
24 (Regulatory adjustments)
25 Total Exposures (sum of lines 21 and 24, less the amount reported in line 2) - All-in basis
26 Leverage ratio - All-in basis
1 Based on OSFI's Leverage Requirements Guidelines issued October 2014.
IAS 39
All-in basis (Required by OSFI)
On-balance sheet exposures
Derivatives exposures
Securities financing transaction exposures
Other off-balance sheet exposures
Capital and Total Exposures - Transitional Basis
Leverage ratio - Transitional Basis
-31-
1st Quarter 2018 - Supplementary Financial Information ROYAL BANK OF CANADA
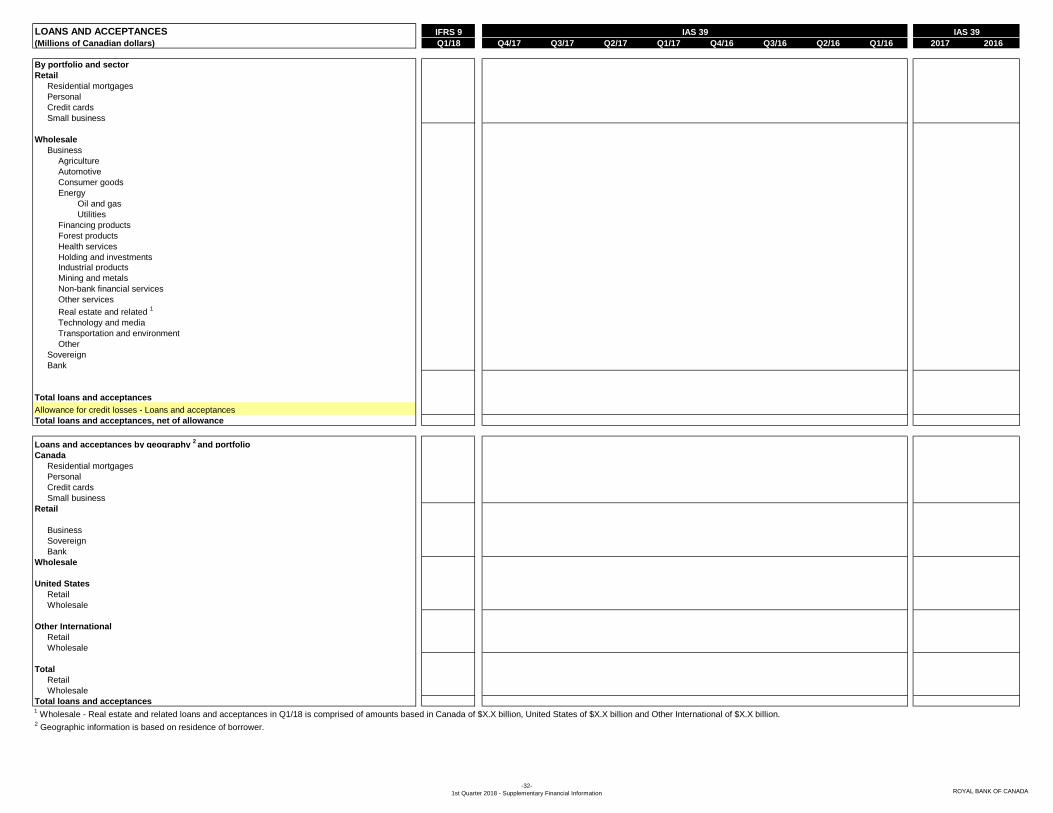
LOANS AND ACCEPTANCES IFRS 9
(Millions of Canadian dollars) Q1/18 Q4/17 Q3/17 Q2/17 Q1/17 Q4/16 Q3/16 Q2/16 Q1/16 2017 2016
By portfolio and sector
Retail
Residential mortgages
Personal
Credit cards
Small business
Wholesale
Business
Agriculture
Automotive
Consumer goods
Energy
Oil and gas
Utilities
Financing products
Forest products
Health services
Holding and investments
Industrial products
Mining and metals
Non-bank financial services
Other services
Real estate and related 1
Technology and media
Transportation and environment
Other
Sovereign
Bank
Total loans and acceptances
Allowance for credit losses - Loans and acceptances
Total loans and acceptances, net of allowance
Loans and acceptances by geography 2 and portfolio
Canada
Residential mortgages
Personal
Credit cards
Small business
Retail
Business
Sovereign
Bank
Wholesale
United States
Retail
Wholesale
Other International
Retail
Wholesale
Total
Retail
Wholesale
Total loans and acceptances
IAS 39 IAS 39
1 Wholesale - Real estate and related loans and acceptances in Q1/18 is comprised of amounts based in Canada of $X.X billion, United States of $X.X billion and Other International of $X.X billion.
2 Geographic information is based on residence of borrower.
-32-
1st Quarter 2018 - Supplementary Financial Information ROYAL BANK OF CANADA
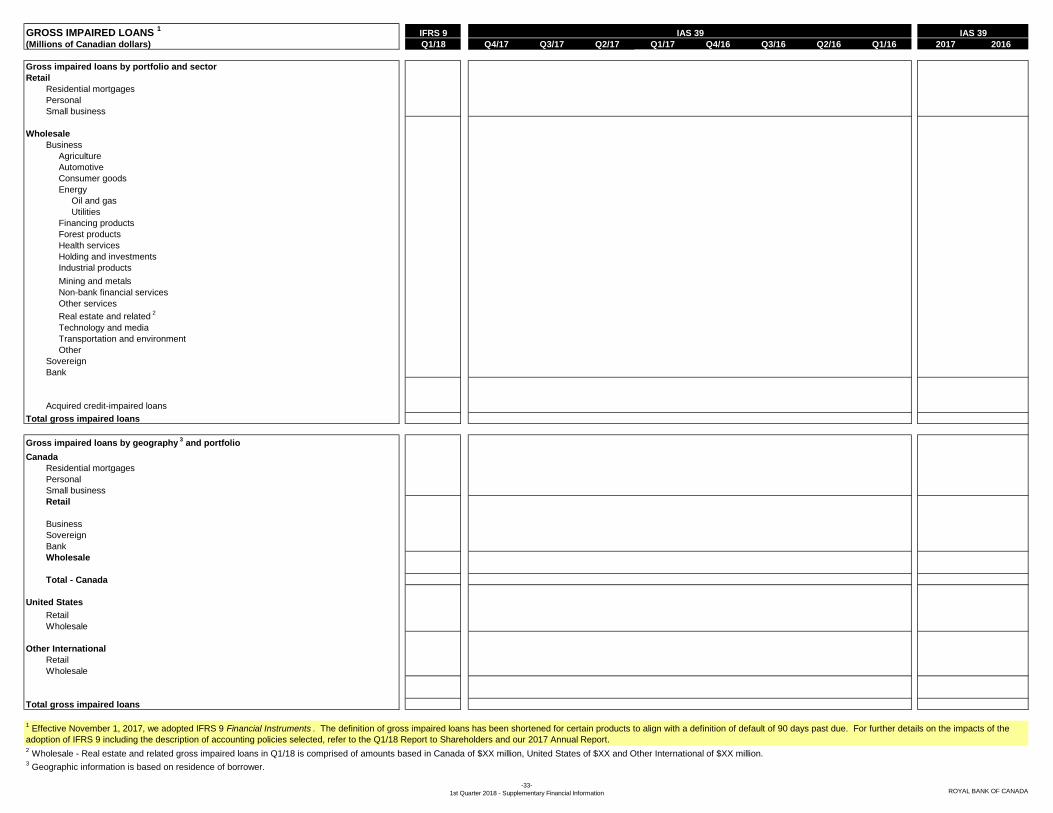
GROSS IMPAIRED LOANS 1
IFRS 9
(Millions of Canadian dollars) Q1/18 Q4/17 Q3/17 Q2/17 Q1/17 Q4/16 Q3/16 Q2/16 Q1/16 2017 2016
Gross impaired loans by portfolio and sector
Retail
Residential mortgages
Personal
Small business
Wholesale
Business
Agriculture
Automotive
Consumer goods
Energy
Oil and gas
Utilities
Financing products
Forest products
Health services
Holding and investments
Industrial products
Mining and metals
Non-bank financial services
Other services
Real estate and related 2
Technology and media
Transportation and environment
Other
Sovereign
Bank
Acquired credit-impaired loans
Total gross impaired loans
Gross impaired loans by geography 3 and portfolio
Canada
Residential mortgages
Personal
Small business
Retail
Business
Sovereign
Bank
Wholesale
Total - Canada
United States
Retail
Wholesale
Other International
Retail
Wholesale
Total gross impaired loans
3 Geographic information is based on residence of borrower.
IAS 39 IAS 39
1 Effective November 1, 2017, we adopted IFRS 9 Financial Instruments . The definition of gross impaired loans has been shortened for certain products to align with a definition of default of 90 days past due. For further details on the impacts of the
adoption of IFRS 9 including the description of accounting policies selected, refer to the Q1/18 Report to Shareholders and our 2017 Annual Report.2 Wholesale - Real estate and related gross impaired loans in Q1/18 is comprised of amounts based in Canada of $XX million, United States of $XX and Other International of $XX million.
-33-
1st Quarter 2018 - Supplementary Financial Information ROYAL BANK OF CANADA

GROSS IMPAIRED LOANS continued IFRS 9
(Millions of Canadian dollars) Q1/18 Q4/17 Q3/17 Q2/17 Q1/17 Q4/16 Q3/16 Q2/16 Q1/16 2017 2016
Impaired loans book movements (Change in gross impaired loans)
Balance at beginning of period 1
Retail
Wholesale
Classified as impaired during the period (New impaired) 2
Retail
Wholesale
Transferred to not impaired during the period (Return to performing status) 2
Retail
Wholesale
Net repayments 2
Retail
Wholesale
Amounts written off
Retail
Wholesale
Recoveries of loans and advances previously written off
Retail
Wholesale
Disposal of loans (sold) 2
Retail
Wholesale
Exchange and other movements 2
Retail
Wholesale
Balance at end of period
Retail
Wholesale
Net impaired loans by geography 3 and portfolio
Canada
Residential mortgages
Personal
Small business
Retail
Business
Sovereign
Bank
Wholesale
United States 4
Retail
Wholesale
Other International
Retail
Wholesale
Total
Retail
Wholesale
Total net impaired loans
1
2
3
4Includes acquired credit-impaired loans.
IAS 39 IAS 39
Certain GIL movements for Canadian Banking retail and wholesale portfolios are generally allocated to New Impaired, as Return to performing status, Net repayments, Sold, and Exchange and other movements amounts are not reasonably determinable. Certain GIL
movements for Caribbean Banking retail and wholesale portfolios are generally allocated to Net repayments and New Impaired, as Return to performing status, Sold, and Exchange and other movements amounts are not reasonably determinable. For Q1/16,
Exchange and other movements includes $XX million of acquired credit impaired loans from City National at the acquisition date.
Geographic information is based on residence of borrower, net of allowance for impaired loans.
Effective November 1, 2017, we adopted IFRS 9 Financial Instruments. The definition of gross impaired loans has been shortened for certain products to align with a definition of default of 90 days past due which have been reflected in the Nov 1, 2017 balances. For
further details on the impacts of the adoption of IFRS 9 including the description of accounting policies selected, refer to the Q1/18 Report to Shareholders and our 2017 Annual Report.
-34-
1st Quarter 2018 - Supplementary Financial Information ROYAL BANK OF CANADA

GROSS IMPAIRED LOANS continued IFRS 9
(Millions of Canadian dollars) Q1/18 Q4/17 Q3/17 Q2/17 Q1/17 Q4/16 Q3/16 Q2/16 Q1/16 2017 2016
Net write-offs by geography 1 and portfolio
Canada
Residential mortgages
Personal
Credit cards
Small business
Retail
Business
Sovereign
Bank
Wholesale
United States 2
Retail
Wholesale
Other International
Retail
Wholesale
Total
Retail
Wholesale
Total net write-offs
1
2
Geographic information is based on residence of borrower.
Includes acquired credit-impaired loans.
IAS 39 IAS 39
-35-
1st Quarter 2018 - Supplementary Financial Information ROYAL BANK OF CANADA
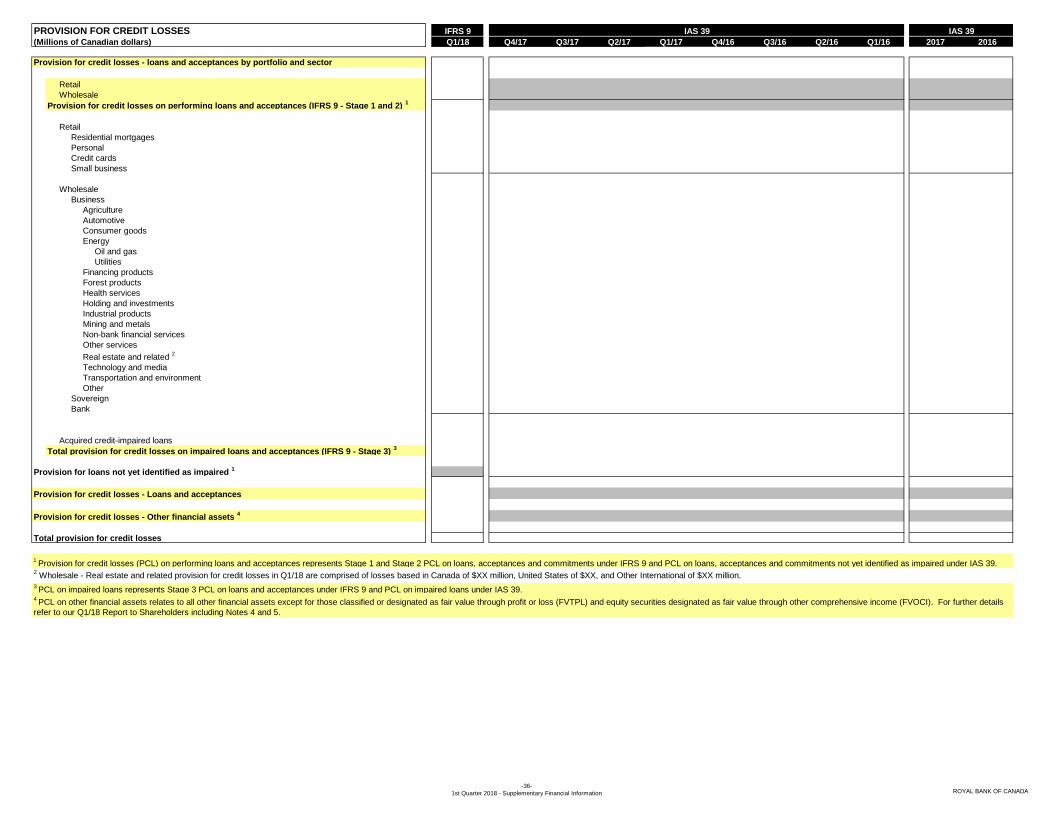
PROVISION FOR CREDIT LOSSES IFRS 9
(Millions of Canadian dollars) Q1/18 Q4/17 Q3/17 Q2/17 Q1/17 Q4/16 Q3/16 Q2/16 Q1/16 2017 2016
Provision for credit losses - loans and acceptances by portfolio and sector
Retail
Wholesale
Provision for credit losses on performing loans and acceptances (IFRS 9 - Stage 1 and 2) 1
Retail
Residential mortgages
Personal
Credit cards
Small business
Wholesale
Business
Agriculture
Automotive
Consumer goods
Energy
Oil and gas
Utilities
Financing products
Forest products
Health services
Holding and investments
Industrial products
Mining and metals
Non-bank financial services
Other services
Real estate and related 2
Technology and media
Transportation and environment
Other
Sovereign
Bank
Acquired credit-impaired loans
Total provision for credit losses on impaired loans and acceptances (IFRS 9 - Stage 3) 3
Provision for loans not yet identified as impaired 1
Provision for credit losses - Loans and acceptances
Provision for credit losses - Other financial assets 4
Total provision for credit losses
1 Provision for credit losses (PCL) on performing loans and acceptances represents Stage 1 and Stage 2 PCL on loans, acceptances and commitments under IFRS 9 and PCL on loans, acceptances and commitments not yet identified as impaired under IAS 39.
3 PCL on impaired loans represents Stage 3 PCL on loans and acceptances under IFRS 9 and PCL on impaired loans under IAS 39.
2 Wholesale - Real estate and related provision for credit losses in Q1/18 are comprised of losses based in Canada of $XX million, United States of $XX, and Other International of $XX million.
IAS 39 IAS 39
4 PCL on other financial assets relates to all other financial assets except for those classified or designated as fair value through profit or loss (FVTPL) and equity securities designated as fair value through other comprehensive income (FVOCI). For further details
refer to our Q1/18 Report to Shareholders including Notes 4 and 5.
-36-
1st Quarter 2018 - Supplementary Financial Information ROYAL BANK OF CANADA
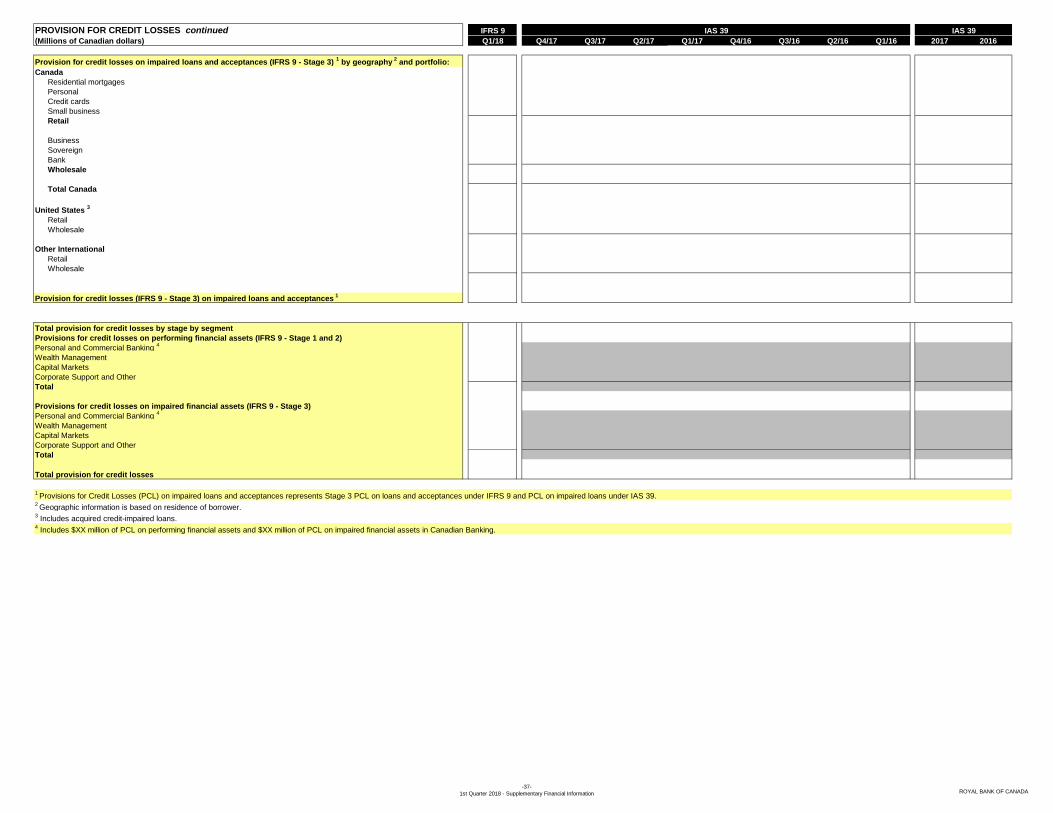
PROVISION FOR CREDIT LOSSES continued IFRS 9
(Millions of Canadian dollars) Q1/18 Q4/17 Q3/17 Q2/17 Q1/17 Q4/16 Q3/16 Q2/16 Q1/16 2017 2016
Provision for credit losses on impaired loans and acceptances (IFRS 9 - Stage 3) 1 by geography
2 and portfolio:
Canada
Residential mortgages
Personal
Credit cards
Small business
Retail
Business
Sovereign
Bank
Wholesale
Total Canada
United States 3
Retail
Wholesale
Other International
Retail
Wholesale
Provision for credit losses (IFRS 9 - Stage 3) on impaired loans and acceptances 1
Total provision for credit losses by stage by segment
Provisions for credit losses on performing financial assets (IFRS 9 - Stage 1 and 2)
Personal and Commercial Banking 4
Wealth Management
Capital Markets
Corporate Support and Other
Total
Provisions for credit losses on impaired financial assets (IFRS 9 - Stage 3)
Personal and Commercial Banking 4
Wealth Management
Capital Markets
Corporate Support and Other
Total
Total provision for credit losses
4 Includes $XX million of PCL on performing financial assets and $XX million of PCL on impaired financial assets in Canadian Banking.
3 Includes acquired credit-impaired loans.
IAS 39 IAS 39
2 Geographic information is based on residence of borrower.
1 Provisions for Credit Losses (PCL) on impaired loans and acceptances represents Stage 3 PCL on loans and acceptances under IFRS 9 and PCL on impaired loans under IAS 39.
-37-
1st Quarter 2018 - Supplementary Financial Information ROYAL BANK OF CANADA
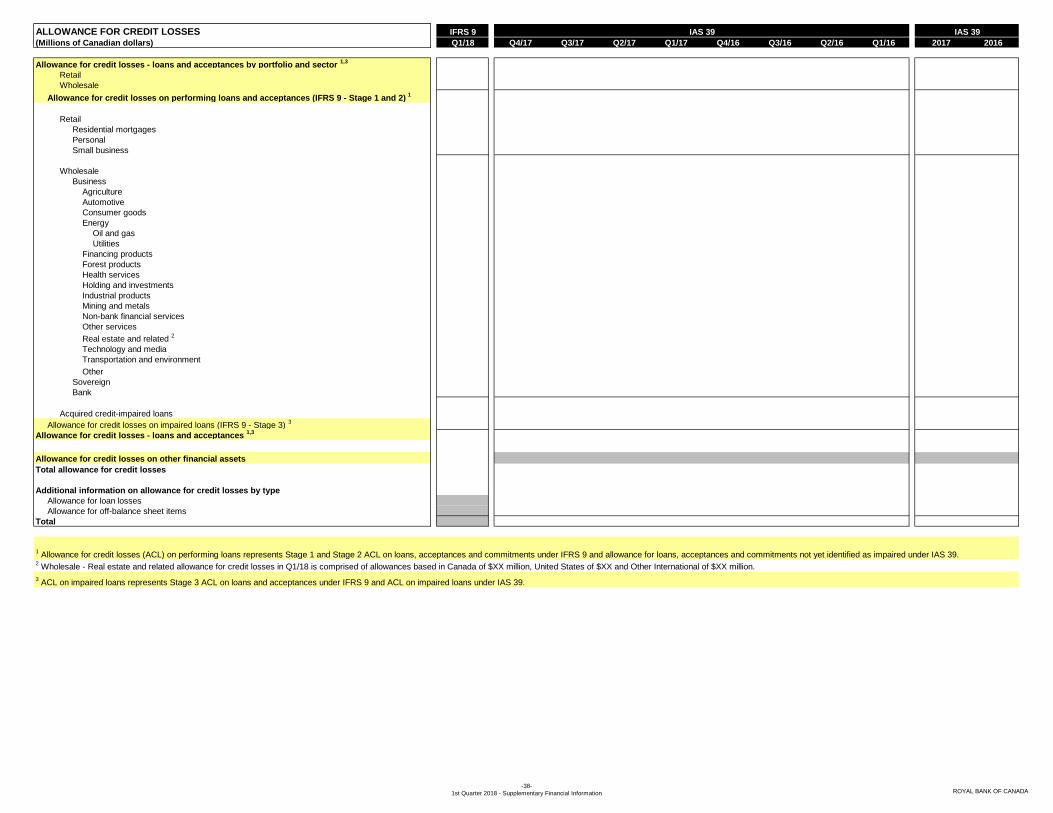
ALLOWANCE FOR CREDIT LOSSES IFRS 9
(Millions of Canadian dollars) Q1/18 Q4/17 Q3/17 Q2/17 Q1/17 Q4/16 Q3/16 Q2/16 Q1/16 2017 2016
Allowance for credit losses - loans and acceptances by portfolio and sector 1,3
Retail
Wholesale
Allowance for credit losses on performing loans and acceptances (IFRS 9 - Stage 1 and 2) 1
Retail
Residential mortgages
Personal
Small business
Wholesale
Business
Agriculture
Automotive
Consumer goods
Energy
Oil and gas
Utilities
Financing products
Forest products
Health services
Holding and investments
Industrial products
Mining and metals
Non-bank financial services
Other services
Real estate and related 2
Technology and media
Transportation and environment
Other
Sovereign
Bank
Acquired credit-impaired loans
Allowance for credit losses on impaired loans (IFRS 9 - Stage 3) 3
Allowance for credit losses - loans and acceptances 1,3
Allowance for credit losses on other financial assets
Total allowance for credit losses
Additional information on allowance for credit losses by type
Allowance for loan losses
Allowance for off-balance sheet items
Total
IAS 39 IAS 39
1 Allowance for credit losses (ACL) on performing loans represents Stage 1 and Stage 2 ACL on loans, acceptances and commitments under IFRS 9 and allowance for loans, acceptances and commitments not yet identified as impaired under IAS 39.
2 Wholesale - Real estate and related allowance for credit losses in Q1/18 is comprised of allowances based in Canada of $XX million, United States of $XX and Other International of $XX million.
3 ACL on impaired loans represents Stage 3 ACL on loans and acceptances under IFRS 9 and ACL on impaired loans under IAS 39.
-38-
1st Quarter 2018 - Supplementary Financial Information ROYAL BANK OF CANADA
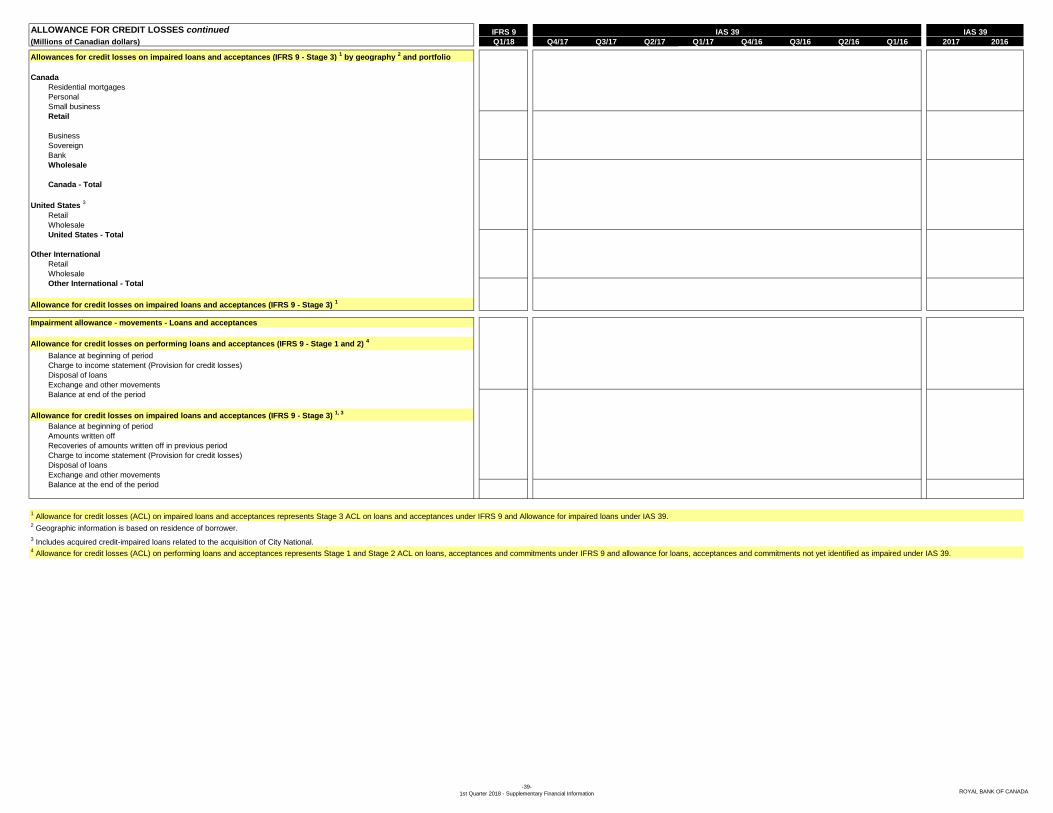
ALLOWANCE FOR CREDIT LOSSES continued IFRS 9
(Millions of Canadian dollars) Q1/18 Q4/17 Q3/17 Q2/17 Q1/17 Q4/16 Q3/16 Q2/16 Q1/16 2017 2016
Allowances for credit losses on impaired loans and acceptances (IFRS 9 - Stage 3) 1 by geography
2 and portfolio
Canada
Residential mortgages
Personal
Small business
Retail
Business
Sovereign
Bank
Wholesale
Canada - Total
United States 3
Retail
Wholesale
United States - Total
Other International
Retail
Wholesale
Other International - Total
Allowance for credit losses on impaired loans and acceptances (IFRS 9 - Stage 3) 1
Impairment allowance - movements - Loans and acceptances
Allowance for credit losses on performing loans and acceptances (IFRS 9 - Stage 1 and 2) 4
Balance at beginning of period
Charge to income statement (Provision for credit losses)
Disposal of loans
Exchange and other movements
Balance at end of the period
Allowance for credit losses on impaired loans and acceptances (IFRS 9 - Stage 3) 1, 3
Balance at beginning of period
Amounts written off
Recoveries of amounts written off in previous period
Charge to income statement (Provision for credit losses)
Disposal of loans
Exchange and other movements
Balance at the end of the period
4 Allowance for credit losses (ACL) on performing loans and acceptances represents Stage 1 and Stage 2 ACL on loans, acceptances and commitments under IFRS 9 and allowance for loans, acceptances and commitments not yet identified as impaired under IAS 39.
1 Allowance for credit losses (ACL) on impaired loans and acceptances represents Stage 3 ACL on loans and acceptances under IFRS 9 and Allowance for impaired loans under IAS 39.
2 Geographic information is based on residence of borrower.
3 Includes acquired credit-impaired loans related to the acquisition of City National.
IAS 39 IAS 39
-39-
1st Quarter 2018 - Supplementary Financial Information ROYAL BANK OF CANADA

CREDIT QUALITY RATIOS IFRS 9
Q1/18 Q4/17 Q3/17 Q2/17 Q1/17 Q4/16 Q3/16 Q2/16 Q1/16 2017 2016
Diversification ratios
Portfolio as a % of Total loans and acceptances
Retail
Wholesale
Canada
United States
Other International
Condition ratios
Gross Impaired Loans (GIL) as a % of Related loans and acceptances
Retail
Wholesale
Canada
United States
Other International
Net Impaired Loans as a % of Related loans and acceptances
Retail
Wholesale
Canada
United States
Other International
PCL on performing loans (IFRS 9 - Stage 1 and 2) as a % of average net loans and acceptances 1
PCL on impaired loans (IFRS 9 - Stage 3) as a % of Related average net loans and acceptances 2
Retail
Wholesale
Canada
United States
Other International
Coverage ratios
ACL on loans and acceptances as a % of Total loans and acceptances
ACL against impaired loans (IFRS 9 - Stage 3) as a % of Total loans and acceptances 3
Retail
Wholesale
ACL against impaired loans (IFRS 9 - Stage 3) as a % of GIL 4
Retail
Wholesale
Total net write-offs as a % of Related average net loans and acceptances
Retail
Wholesale
Canada
United States
Other International
4 ACL against impaired loans ratio under IFRS 9 is calculated using ACL on Stage 3 loans and acceptances as a percentage of gross impaired loans. Under IAS 39, the ratio was calculated using ACL on impaired loans as a percentage of gross impaired loans.
IAS 39 IAS 39
1 PCL on performing loans ratio under IFRS 9 is calculated using PCL on Stage 1 and 2 loans and acceptances as a percentage of average net loans and acceptances.
3 ACL on impaired loans ratio under IFRS 9 is calculated using ACL on Stage 3 loans and acceptances as a percentage of average net loans and acceptances. Under IAS 39, the ratio was calculated using ACL on impaired loans as a percentage of average net loans and
acceptances.
2 PCL on impaired loans ratio under IFRS 9 is calculated using PCL on Stage 3 loans and acceptances as a percentage of average net loans and acceptances. Under IAS 39, the ratio was calculated using PCL on impaired loans as a percentage of average net loans and
-40-
1st Quarter 2018 - Supplementary Financial Information ROYAL BANK OF CANADA
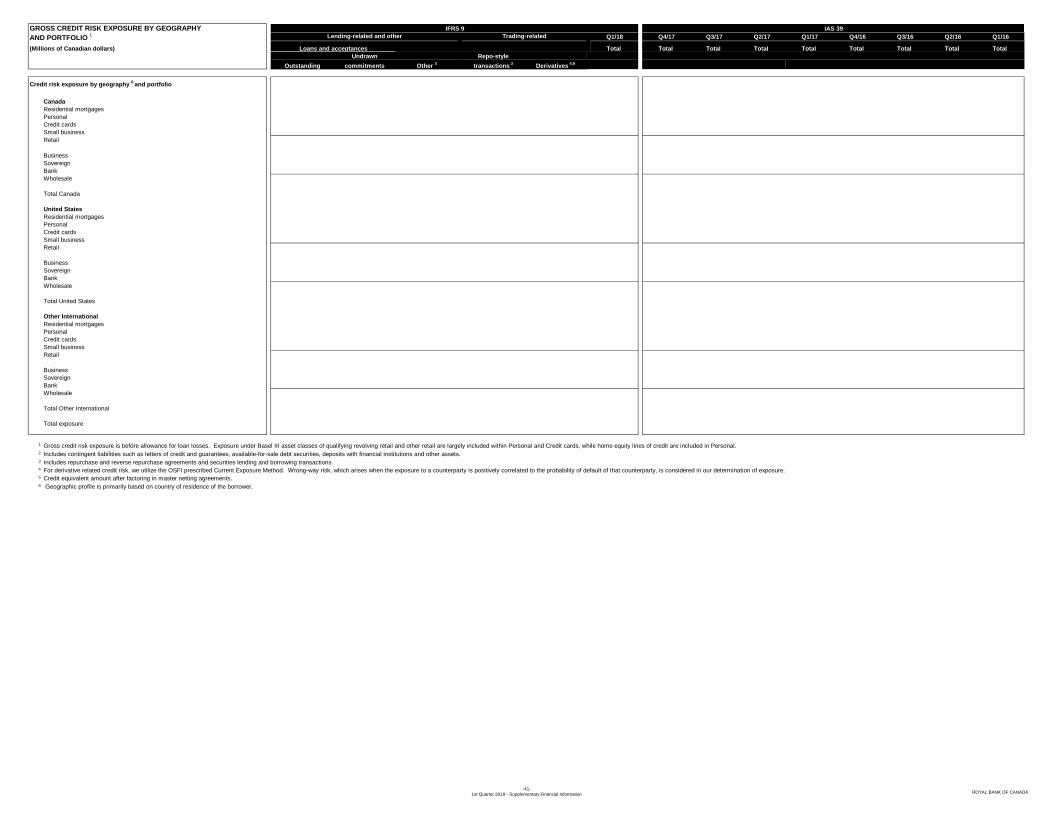
GROSS CREDIT RISK EXPOSURE BY GEOGRAPHY
AND PORTFOLIO 1 Q1/18 Q4/17 Q3/17 Q2/17 Q1/17 Q4/16 Q3/16 Q2/16 Q1/16
(Millions of Canadian dollars) Total Total Total Total Total Total Total Total Total
Undrawn Repo-style
Outstanding commitments Other 2
transactions 3
Derivatives 4,5
Credit risk exposure by geography 6 and portfolio
Canada
Residential mortgages
Personal
Credit cards
Small business
Retail
Business
Sovereign
Bank
Wholesale
Total Canada
United States
Residential mortgages
Personal
Credit cards
Small business
Retail
Business
Sovereign
Bank
Wholesale
Total United States
Other International
Residential mortgages
Personal
Credit cards
Small business
Retail
Business
Sovereign
Bank
Wholesale
Total Other International
Total exposure
1
2
3
4
5
6
Credit equivalent amount after factoring in master netting agreements.
Geographic profile is primarily based on country of residence of the borrower.
Loans and acceptances
Gross credit risk exposure is before allowance for loan losses. Exposure under Basel III asset classes of qualifying revolving retail and other retail are largely included within Personal and Credit cards, while home equity lines of credit are included in Personal.
Includes contingent liabilities such as letters of credit and guarantees, available-for-sale debt securities, deposits with financial institutions and other assets.
Includes repurchase and reverse repurchase agreements and securities lending and borrowing transactions.
Lending-related and other Trading-related
IAS 39IFRS 9
For derivative related credit risk, we utilize the OSFI prescribed Current Exposure Method. Wrong-way risk, which arises when the exposure to a counterparty is positively correlated to the probability of default of that counterparty, is considered in our determination of exposure.
-41-
1st Quarter 2018 - Supplementary Financial Information ROYAL BANK OF CANADA
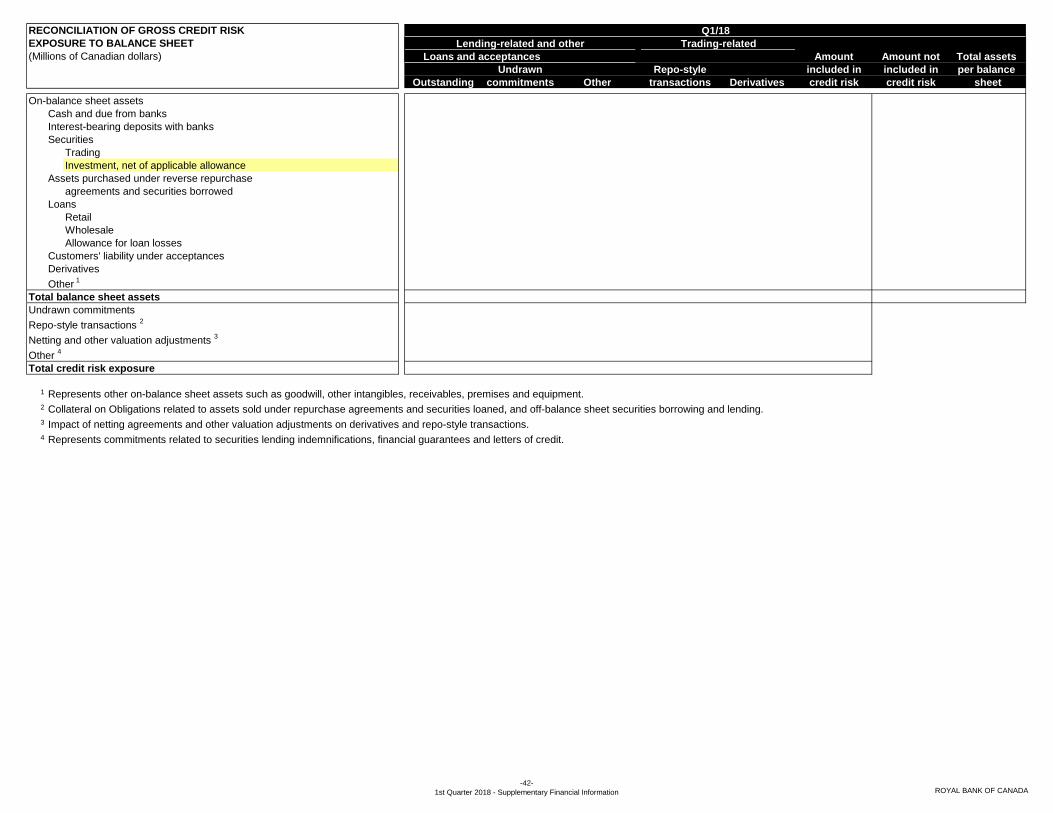
RECONCILIATION OF GROSS CREDIT RISK
EXPOSURE TO BALANCE SHEET
(Millions of Canadian dollars) Amount Amount not Total assets
Undrawn Repo-style included in included in per balance
Outstanding commitments Other transactions Derivatives credit risk credit risk sheet
Trading
Investment, net of applicable allowance
agreements and securities borrowed
Retail
Wholesale
Allowance for loan losses
1
2
3
4
Cash and due from banks
Q1/18
Lending-related and other Trading-related
Loans and acceptances
On-balance sheet assets
Other 4
Interest-bearing deposits with banks
Securities
Assets purchased under reverse repurchase
Loans
Customers' liability under acceptances
Derivatives
Other 1
Total balance sheet assets
Undrawn commitments
Repo-style transactions 2
Netting and other valuation adjustments 3
Total credit risk exposure
Represents other on-balance sheet assets such as goodwill, other intangibles, receivables, premises and equipment.
Collateral on Obligations related to assets sold under repurchase agreements and securities loaned, and off-balance sheet securities borrowing and lending.
Impact of netting agreements and other valuation adjustments on derivatives and repo-style transactions.
Represents commitments related to securities lending indemnifications, financial guarantees and letters of credit.
-42-
1st Quarter 2018 - Supplementary Financial Information ROYAL BANK OF CANADA
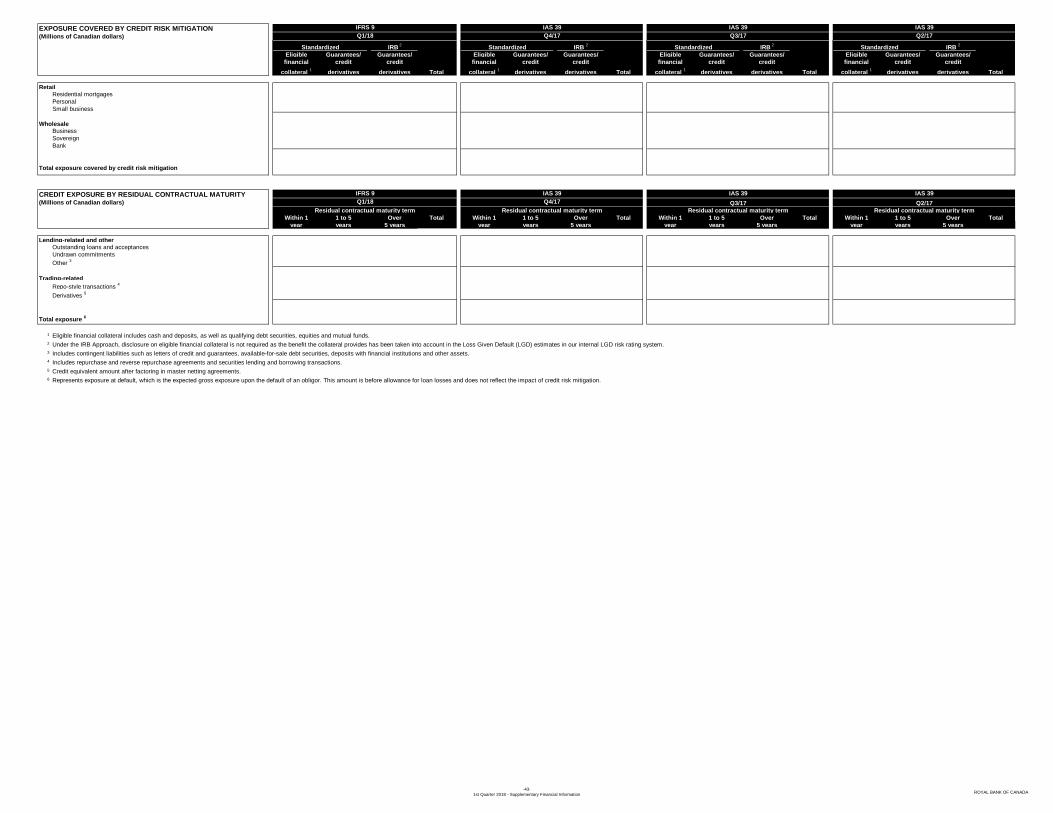
EXPOSURE COVERED BY CREDIT RISK MITIGATION(Millions of Canadian dollars)
IRB 2
IRB 2
IRB 2
IRB 2
Eligible Guarantees/ Guarantees/ Eligible Guarantees/ Guarantees/ Eligible Guarantees/ Guarantees/ Eligible Guarantees/ Guarantees/
financial credit credit financial credit credit financial credit credit financial credit credit
collateral 1
derivatives derivatives Total collateral 1
derivatives derivatives Total collateral 1
derivatives derivatives Total collateral 1
derivatives derivatives Total
RetailResidential mortgages
Personal
Small business
WholesaleBusiness
Sovereign
Bank
Total exposure covered by credit risk mitigation
CREDIT EXPOSURE BY RESIDUAL CONTRACTUAL MATURITY(Millions of Canadian dollars)
Within 1 1 to 5 Over Total Within 1 1 to 5 Over Total Within 1 1 to 5 Over Total Within 1 1 to 5 Over Total
year years 5 years year years 5 years year years 5 years year years 5 years
Lending-related and otherOutstanding loans and acceptances
Undrawn commitments
Other 3
Trading-related
Repo-style transactions 4
Derivatives 5
Total exposure 6
1
2
3
4
5
6
IFRS 9 IAS 39 IAS 39 IAS 39
Standardized Standardized Standardized Standardized
Q1/18 Q4/17 Q3/17 Q2/17
IFRS 9 IAS 39 IAS 39 IAS 39
Residual contractual maturity term Residual contractual maturity term Residual contractual maturity term Residual contractual maturity term
Q4/17 Q3/17 Q2/17Q1/18
Eligible financial collateral includes cash and deposits, as well as qualifying debt securities, equities and mutual funds.
Under the IRB Approach, disclosure on eligible financial collateral is not required as the benefit the collateral provides has been taken into account in the Loss Given Default (LGD) estimates in our internal LGD risk rating system.
Includes contingent liabilities such as letters of credit and guarantees, available-for-sale debt securities, deposits with financial institutions and other assets.
Includes repurchase and reverse repurchase agreements and securities lending and borrowing transactions.
Credit equivalent amount after factoring in master netting agreements.
Represents exposure at default, which is the expected gross exposure upon the default of an obligor. This amount is before allowance for loan losses and does not reflect the impact of credit risk mitigation.
-43-
1st Quarter 2018 - Supplementary Financial InformationROYAL BANK OF CANADA
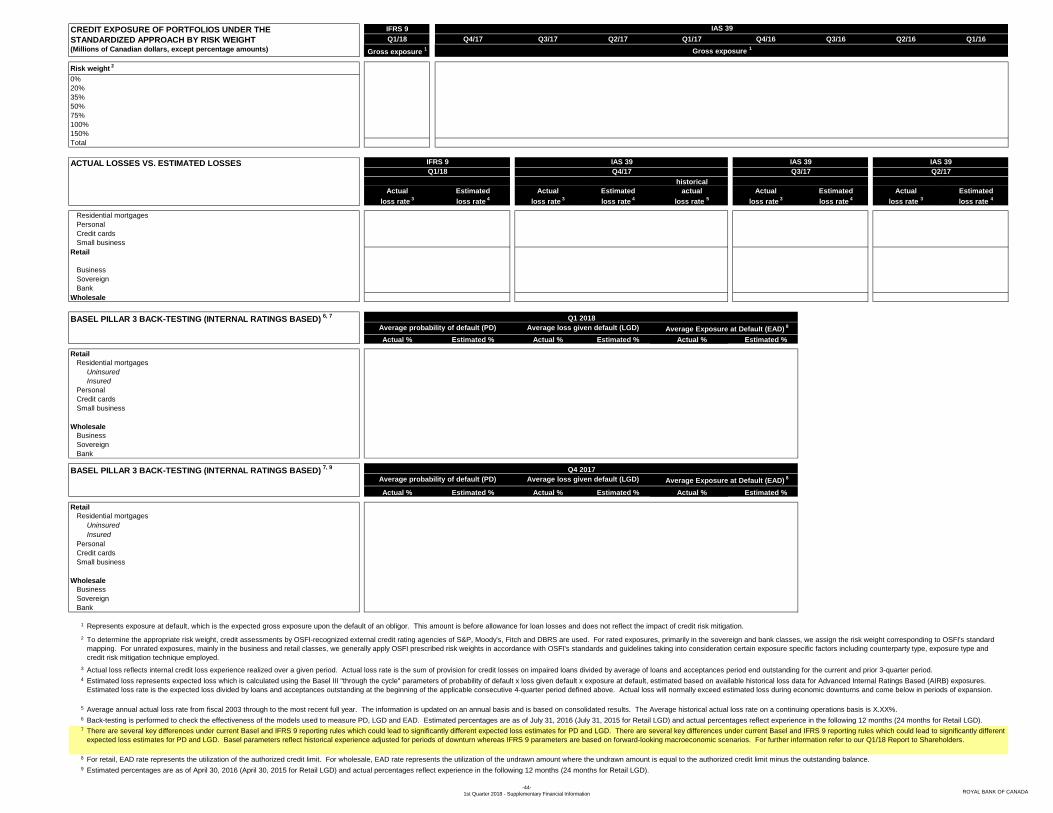
CREDIT EXPOSURE OF PORTFOLIOS UNDER THE IFRS 9
STANDARDIZED APPROACH BY RISK WEIGHT Q1/18 Q4/17 Q3/17 Q2/17 Q1/17 Q4/16 Q3/16 Q2/16 Q1/16
(Millions of Canadian dollars, except percentage amounts) Gross exposure 1
Risk weight 2
ACTUAL LOSSES VS. ESTIMATED LOSSES
historical
Actual Estimated Actual Estimated actual Actual Estimated Actual Estimated
loss rate 3
loss rate 4
loss rate 3
loss rate 4
loss rate 5
loss rate 3
loss rate 4
loss rate 3
loss rate 4
Residential mortgages
Personal
Credit cards
Small business
Retail
Business
Sovereign
Bank
Wholesale
Actual % Estimated % Actual % Estimated % Actual % Estimated %
Retail
Residential mortgages
Uninsured
Insured
Personal
Credit cards
Small business
Wholesale
Business
Sovereign
Bank
Actual % Estimated % Actual % Estimated % Actual % Estimated %
Retail
Residential mortgages
Uninsured
Insured
Personal
Credit cards
Small business
Wholesale
Business
Sovereign
Bank
1
2
3
4
5
6
7
8
9
Gross exposure 1
IAS 39
Q1/18 Q4/17 Q3/17 Q2/17
75%
0%
20%
35%
50%
100%
150%
Total
IFRS 9 IAS 39
Represents exposure at default, which is the expected gross exposure upon the default of an obligor. This amount is before allowance for loan losses and does not reflect the impact of credit risk mitigation.
IAS 39
BASEL PILLAR 3 BACK-TESTING (INTERNAL RATINGS BASED) 6, 7 Q1 2018
Average probability of default (PD) Average loss given default (LGD) Average Exposure at Default (EAD) 8
IAS 39
BASEL PILLAR 3 BACK-TESTING (INTERNAL RATINGS BASED) 7, 9 Q4 2017
Average probability of default (PD) Average loss given default (LGD) Average Exposure at Default (EAD) 8
Estimated percentages are as of April 30, 2016 (April 30, 2015 for Retail LGD) and actual percentages reflect experience in the following 12 months (24 months for Retail LGD).
To determine the appropriate risk weight, credit assessments by OSFI-recognized external credit rating agencies of S&P, Moody's, Fitch and DBRS are used. For rated exposures, primarily in the sovereign and bank classes, we assign the risk weight corresponding to OSFI's standard
mapping. For unrated exposures, mainly in the business and retail classes, we generally apply OSFI prescribed risk weights in accordance with OSFI's standards and guidelines taking into consideration certain exposure specific factors including counterparty type, exposure type and
credit risk mitigation technique employed.
Actual loss reflects internal credit loss experience realized over a given period. Actual loss rate is the sum of provision for credit losses on impaired loans divided by average of loans and acceptances period end outstanding for the current and prior 3-quarter period.
Estimated loss represents expected loss which is calculated using the Basel III "through the cycle" parameters of probability of default x loss given default x exposure at default, estimated based on available historical loss data for Advanced Internal Ratings Based (AIRB) exposures.
Estimated loss rate is the expected loss divided by loans and acceptances outstanding at the beginning of the applicable consecutive 4-quarter period defined above. Actual loss will normally exceed estimated loss during economic downturns and come below in periods of expansion.
Average annual actual loss rate from fiscal 2003 through to the most recent full year. The information is updated on an annual basis and is based on consolidated results. The Average historical actual loss rate on a continuing operations basis is X.XX%.
Back-testing is performed to check the effectiveness of the models used to measure PD, LGD and EAD. Estimated percentages are as of July 31, 2016 (July 31, 2015 for Retail LGD) and actual percentages reflect experience in the following 12 months (24 months for Retail LGD).
For retail, EAD rate represents the utilization of the authorized credit limit. For wholesale, EAD rate represents the utilization of the undrawn amount where the undrawn amount is equal to the authorized credit limit minus the outstanding balance.
There are several key differences under current Basel and IFRS 9 reporting rules which could lead to significantly different expected loss estimates for PD and LGD. There are several key differences under current Basel and IFRS 9 reporting rules which could lead to significantly different
expected loss estimates for PD and LGD. Basel parameters reflect historical experience adjusted for periods of downturn whereas IFRS 9 parameters are based on forward-looking macroeconomic scenarios. For further information refer to our Q1/18 Report to Shareholders.
-44-
1st Quarter 2018 - Supplementary Financial Information ROYAL BANK OF CANADA

CREDIT QUALITY OF INTERNAL RATINGS
BASED (IRB) EXPOSURE - RETAIL PORTFOLIOS
BY PORTFOLIO AND RISK RATING 1
Exposure Exposure Exposure Exposure Exposure Exposure
(Millions of Canadian dollars, except percentage amounts) Exposure weighted- weighted- weighted- Risk EL adjusted Exposure weighted- weighted- weighted- Risk EL adjusted
Exposure Notional weighted- average average average weighted Expected average Exposure Notional weighted- average average average weighted Expected average
at default of undrawn average probability of loss given risk assets losses risk at default of undrawn average probability of loss given risk assets losses risk
(EAD) 2 commitments EAD %
3default (PD) %
3default (LGD) %
3weight %
3 (RWA) (EL) weight (%) (EAD) 2 commitments EAD %
3default (PD) %
3default (LGD) %
3weight %
3 (RWA) (EL) weight (%)
Portfolio / Risk Category PD Range(%)
Residential Mortgages and HELOCsInsured Drawn and UndrawnExceptionally low risk 0.000% to 0.108%
0.109% to 0.214%Very low risk 0.215% to 0.308%
0.309% to 0.590%Low risk 0.591% to 1.040%
1.041% to 1.718%
Medium risk 1.719% to 2.969%2.970% to 6.430%
High risk 6.431% to 99.99%Default 100%Total Insured Drawn & Undrawn
Uninsured UndrawnExceptionally low risk 0.000% to 0.108%
0.109% to 0.214%
Very low risk 0.215% to 0.308%
0.309% to 0.590%
Low risk 0.591% to 1.040%1.041% to 1.718%
Medium risk 1.719% to 2.969%2.970% to 6.430%
High risk 6.431% to 99.99%Default 100%Total Uninsured Undrawn
Uninsured DrawnExceptionally low risk 0.000% to 0.108%
0.109% to 0.214%
Very low risk 0.215% to 0.308%
0.309% to 0.590%
Low risk 0.591% to 1.040%
1.041% to 1.718%
Medium risk 1.719% to 2.969%2.970% to 6.430%
High risk 6.431% to 99.99%Default 100%Total Uninsured Drawn
Qualifying Revolving Credit
Exceptionally low risk 0.000% to 0.108%0.109% to 0.214%
Very low risk 0.215% to 0.308%
0.309% to 0.590%
Low risk 0.591% to 1.040%
1.041% to 1.718%
Medium risk 1.719% to 2.969%2.970% to 6.430%
High risk 6.431% to 99.99%Default 100%
Total Qualifying Revolving Credit
Other RetailExceptionally low risk 0.000% to 0.108%
0.109% to 0.214%
Very low risk 0.215% to 0.308%
0.309% to 0.590%
Low risk 0.591% to 1.040%
1.041% to 1.718%
Medium risk 1.719% to 2.969%
2.970% to 6.430%
High risk 6.431% to 99.99%
Default 100%
Total Other Retail
1
2
3
IFRS 9 IAS 39
Total exposure includes loans outstanding (drawn) and undrawn commitments and represents exposure at default, which is the expected gross exposure upon the default of an obligor. This amount is before allowance for loan losses and after credit risk mitigation.
Represents the exposure-weighted average probability of default, loss given default rate, exposure at default (EAD) rate and risk weight within each risk range. Average LGD for insured residential mortgages is based on the adjustment approach where the impact of related insurance is considered. EAD rate is a percentage of undrawn.
Q1/18 Q4/17
There are several key differences under current Basel and IFRS 9 reporting rules which could lead to significantly different expected loss estimates for PD and LGD. Basel parameters reflect historical experience adjusted for periods of downturn whereas IFRS 9 parameters are based on forward-looking macroeconomic scenarios. For further
information refer to our Q1/18 Report to Shareholders.
-45-
1st Quarter 2018 - Supplementary Financial Information ROYAL BANK OF CANADA

CREDIT QUALITY OF ADVANCED INTERNAL RATINGS BASED (AIRB) EXPOSURE -
WHOLESALE LOANS & ACCEPTANCES BY PORTFOLIO AND RISK RATING 1
(Millions of Canadian dollars, except percentage amounts) Exposure Exposure Exposure Exposure
Exposure Exposure weighted weighted Risk Exposure Exposure weighted weighted Risk
Exposure Notional weighted weighted average average weighted Exposure Notional weighted weighted average average weighted
at default of undrawn average average loss given risk Assets at default of undrawn average average loss given risk Assets
(EAD) 2 commitments EAD %
3PD %
3default LGD %
3weight %
3(RWA)
4(EAD)
2 commitments EAD % 3
PD % 3
default LGD % 3
weight % 3
(RWA) 4
Internal rating 5 External rating External rating Probability of default
equivalent (S&P) equivalent (Moody's) (PD) range % 6
Business
1 AAA Aaa 0.000% to 0.030%
2 AA+ Aa1 0.000% to 0.030%
3 AA Aa2 0.000% to 0.030%
4 AA- Aa3 0.000% to 0.030%
5 A+ A1 0.031% to 0.053%
6 A A2 0.054% to 0.076%
7 A- A3 0.077% to 0.123%
8 BBB+ Baa1 0.124% to 0.173%
9 BBB Baa2 0.174% to 0.233%
10 BBB- Baa3 0.234% to 0.360%
11 BB+ Ba1 0.361% to 0.581%
12 BB Ba2 0.582% to 0.939%
13 BB- Ba3 0.940% to 1.724%
14 B+ B1 1.725% to 2.948%
15 B B2 2.949% to 4.653%
16 B- B3 4.654% to 7.343%
17 CCC+ Caa1 7.344% to 10.896%
18 CCC Caa2 10.897% to 16.748%
19 CCC- Caa3 16.749% to 27.074%
20 CC Ca 27.075% to 99.999%
21 C C 100%
22 Bankruptcy Bankruptcy 100%
Total Business
Sovereign
1 AAA Aaa 0.000% to 0.012%
2 AA+ Aa1 0.013% to 0.018%
3 AA Aa2 0.019% to 0.026%
4 AA- Aa3 0.027% to 0.037%
5 A+ A1 0.038% to 0.053%
6 A A2 0.054% to 0.076%
7 A- A3 0.077% to 0.123%
8 BBB+ Baa1 0.124% to 0.173%
9 BBB Baa2 0.174% to 0.233%
10 BBB- Baa3 0.234% to 0.360%
11 BB+ Ba1 0.361% to 0.581%
12 BB Ba2 0.582% to 0.939%
13 BB- Ba3 0.940% to 1.724%
14 B+ B1 1.725% to 2.948%
15 B B2 2.949% to 4.653%
16 B- B3 4.654% to 7.343%
17 CCC+ Caa1 7.344% to 10.896%
18 CCC Caa2 10.897% to 16.748%
19 CCC- Caa3 16.749% to 27.074%
20 CC Ca 27.075% to 99.999%
21 C C 100%
22 Bankruptcy Bankruptcy 100%
Total Sovereign
Bank
1 AAA Aaa 0.000% to 0.030%
2 AA+ Aa1 0.000% to 0.030%
3 AA Aa2 0.000% to 0.030%
4 AA- Aa3 0.000% to 0.030%
5 A+ A1 0.031% to 0.053%
6 A A2 0.054% to 0.076%
7 A- A3 0.077% to 0.123%
8 BBB+ Baa1 0.124% to 0.173%
9 BBB Baa2 0.174% to 0.233%
10 BBB- Baa3 0.234% to 0.360%
11 BB+ Ba1 0.361% to 0.581%
12 BB Ba2 0.582% to 0.939%
13 BB- Ba3 0.940% to 1.724%
14 B+ B1 1.725% to 2.948%
15 B B2 2.949% to 4.653%
16 B- B3 4.654% to 7.343%
17 CCC+ Caa1 7.344% to 10.896%
18 CCC Caa2 10.897% to 16.748%
19 CCC- Caa3 16.749% to 27.074%
20 CC Ca 27.075% to 99.999%
21 C C 100%
22 Bankruptcy Bankruptcy 100%
Total Bank
1
2
3
4
5
6 In certain cases, the average PD is outside of the internal PD range provided as RBC's internal PD estimation methodology is based on segmenting our wholesale borrowers into five homogeneous PD groups while the ranges represented above reflects the most predominant group included within the Basel III wholesale asset classes presented.
IFRS 9 IAS 39
Includes loans and acceptances outstanding and undrawn exposure and represents exposure at default, which is the expected gross exposure upon the default of an obligor. This amount is before allowance for loan losses and excludes the effects of credit risk mitigation.
Represents the exposure-weighted average of EAD rate, PD, LGD and risk weight within each internal rating. EAD rate is a percentage of the notional of undrawn commitments that is currently undrawn but expected to be drawn in the event of a default.
Risk weighted assets are calculated on exposure after credit risk mitigation.
Ratings 10 or above are regarded as investment grade while ratings 11 or below to 20 inclusive are non-investment grade. Ratings 21-22 represent impaired/default.
There are several key differences under current Basel and IFRS 9 reporting rules which could lead to significantly different expected loss estimates for PD and LGD. There are several key differences under current Basel and IFRS 9 reporting rules which could lead to significantly different expected loss estimates for PD and LGD. Basel parameters
reflect historical experience adjusted for periods of downturn whereas IFRS 9 parameters are based on forward-looking macroeconomic scenarios. For further information refer to our Q1/18 Report to Shareholders.
Q1/18 Q4/17
-46-
1st Quarter 2018 - Supplementary Financial Information ROYAL BANK OF CANADA
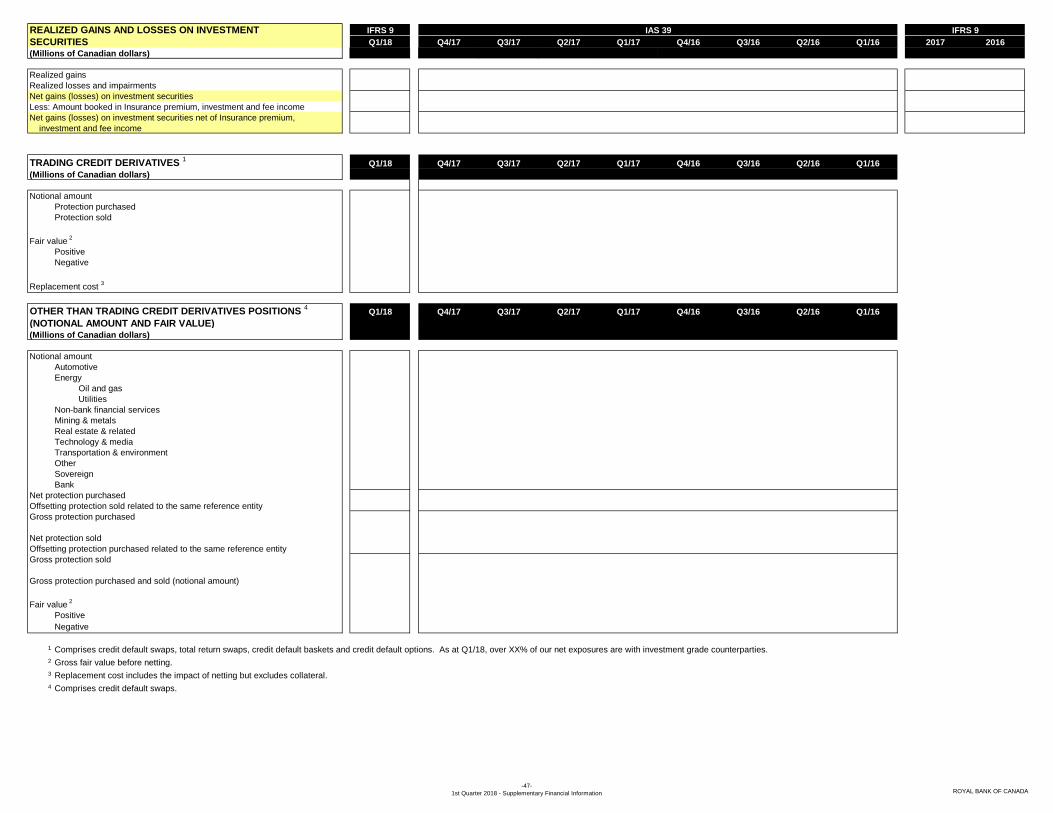
REALIZED GAINS AND LOSSES ON INVESTMENT IFRS 9
SECURITIES Q1/18 Q4/17 Q3/17 Q2/17 Q1/17 Q4/16 Q3/16 Q2/16 Q1/16 2017 2016
(Millions of Canadian dollars)
Realized gains
Realized losses and impairments
Net gains (losses) on investment securities
Less: Amount booked in Insurance premium, investment and fee income
Net gains (losses) on investment securities net of Insurance premium,
investment and fee income
TRADING CREDIT DERIVATIVES 1
Q1/18 Q4/17 Q3/17 Q2/17 Q1/17 Q4/16 Q3/16 Q2/16 Q1/16
(Millions of Canadian dollars)
Notional amount
Protection purchased
Protection sold
Fair value 2
Positive
Negative
Replacement cost 3
OTHER THAN TRADING CREDIT DERIVATIVES POSITIONS 4
Q1/18 Q4/17 Q3/17 Q2/17 Q1/17 Q4/16 Q3/16 Q2/16 Q1/16
(NOTIONAL AMOUNT AND FAIR VALUE)(Millions of Canadian dollars)
Notional amount
Automotive
Energy
Oil and gas
Utilities
Non-bank financial services
Mining & metals
Real estate & related
Technology & media
Transportation & environment
Other
Sovereign
Bank
Net protection purchased
Offsetting protection sold related to the same reference entity
Gross protection purchased
Net protection sold
Offsetting protection purchased related to the same reference entity
Gross protection sold
Gross protection purchased and sold (notional amount)
Fair value 2
Positive
Negative
1
2
3
4
Replacement cost includes the impact of netting but excludes collateral.
Comprises credit default swaps.
IAS 39 IFRS 9
Comprises credit default swaps, total return swaps, credit default baskets and credit default options. As at Q1/18, over XX% of our net exposures are with investment grade counterparties.
Gross fair value before netting.
-47-
1st Quarter 2018 - Supplementary Financial Information ROYAL BANK OF CANADA

FAIR VALUE OF DERIVATIVE
INSTRUMENTS (Millions of Canadian dollars) Positive Negative Positive Negative Positive Negative Positive Negative Positive Negative Positive Negative
Held or issued for trading purposes
Held or issued for other than trading purposes
Total gross fair values before netting 1
Impact of master netting agreements
that qualify for balance sheet offset 2
that do not qualify for balance sheet offset 3
Total
DERIVATIVES - NOTIONAL AMOUNTS 4, 5
(Millions of Canadian dollars)
Centrally Non Centrally Exchange Non- Centrally Non Centrally Exchange Non- Centrally Non Centrally Exchange Non-
cleared cleared traded Total trading Total cleared cleared traded Total trading Total cleared cleared traded Total trading Total
Interest rate contracts
Forward rate agreement
Swaps
Options purchased
Future
Foreign exchange contract
Forward contracts
Swaps
Cross-currency interest rate swaps
Options purchased
Future
Credit derivatives
Other contracts 6
Total
1
2
3
4
5
6
Fair value
Q1/18 Q4/17 Q3/17 Q2/17 Q1/17 Q4/16
Fair value Fair value Fair value Fair value Fair value
Q1/18 Q4/17 Q3/17Trading Trading Trading
Over the counter Over the counter Over the counter
Q2/17 Q1/17 Q4/16
Comprises precious metal, commodity, stable value and equity-linked derivative contracts.
Trading Trading Trading
Over the counter Over the counter Over the counter
As at Q1/18, positive and negative fair values exclude market and credit valuation adjustments of $XX million and $XX million respectively that are determined on a pooled basis.
Impact of offsetting derivative assets and liabilities on contracts where we have both (a) unconditional and legally enforceable netting agreement in place and (b) we intend to settle the contracts on either a net basis or simultaneously. The right of setoff is considered unconditional if its exercise is not contingent upon the occurrence of a future event; it is
considered conditional if it becomes exercisable only upon the occurrence of a future event, such as bankruptcy, insolvency, default, or change in control.
Additional impact of offsetting credit exposures on contracts that do not qualify for balance sheet offset.
Notional amounts do not represent assets or liabilities and therefore are not recorded in our Consolidated Balance Sheet. As of Q1/18, the notional amounts excludes exchange traded options written of $XX.X billion, over-the -counter options written of $XX.X billion and non-trading credit derivatives of $XX.X billion. It includes interest rate and currency
swaps of $XX.X billion related to a consolidated structured entity and non-trading centrally cleared interest rate contracts of $XX.X billion.
The majority of non-centrally cleared over the counter derivative activity is conducted with other professional market counterparties, under bilateral collateral arrangements with very low unsecured thresholds and daily collateral valuations. These collateral arrangements take the form of Credit Support Annex, to the International Swaps and Derivatives
Association master agreement.
-48-
1st Quarter 2018 - Supplementary Financial Information ROYAL BANK OF CANADA

DERIVATIVE - RELATED CREDIT RISK (Millions of Canadian dollars) Credit Risk- Credit Risk- Credit Risk- Credit Risk-
Notional Replacement equivalent weighted Notional Replacement equivalent weighted Notional Replacement equivalent weighted Notional Replacement equivalent weighted
amount 1 cost amount equivalent
2amount
1 cost amount equivalent 2
amount 1 cost amount equivalent
2amount
1 cost amount equivalent 2
Over-the-counter contracts
Interest rate contracts
Forward rate agreements
Swaps
Options purchased
Foreign exchange contracts
Forward contracts
Swaps
Options purchased
Credit derivatives 3
Other contracts 4
Exchange traded contracts
Total derivatives 5
1
2
3
4
5
Q1/18 Q4/17 Q3/17 Q2/17
Q1/17 Q4/16 Q3/16 Q2/16
As at Q1/18, the notional amounts excludes exchange traded options written of $XX.X billion, over-the-counter options written of $XX.X billion, and non-trading credit derivatives of $XX.X billion.
As at Q1/18, the risk-weighted equivalents for over-the-counter contracts shown are calculated by applying risk weights against the credit equivalent amounts net of credit valuation adjustment (CVA) losses of $XX million. The risk-weighted equivalent amounts shown do not reflect CVA regulatory capital charge.
Comprises credit default swaps, total return swaps, credit default baskets and credit default options.
Comprises precious metal, commodity, stable value and equity-linked derivative contracts.
As at Q1/18, the total credit equivalent amount reported above is net of $XX billion in collateral and does not reflect the netting of the credit valuation adjustment losses of $XX million described in footnote 2.
-49-
1st Quarter 2018 - Supplementary Financial Information ROYAL BANK OF CANADA
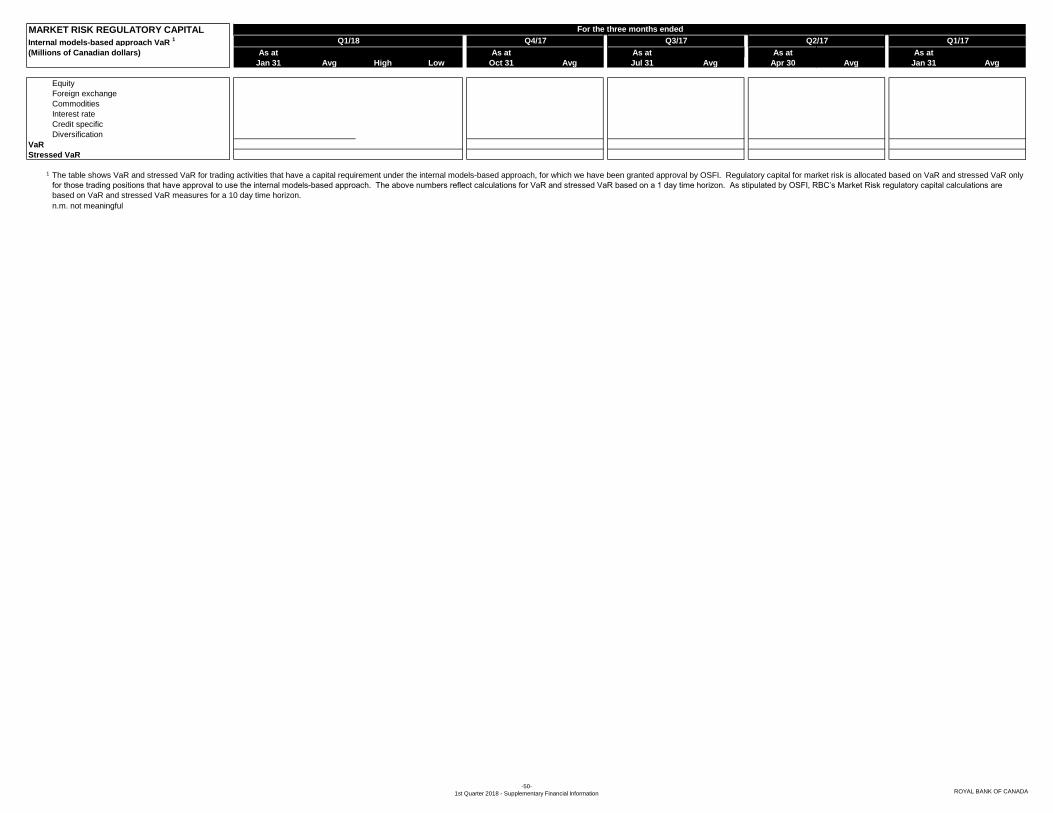
MARKET RISK REGULATORY CAPITAL
Internal models-based approach VaR 1
(Millions of Canadian dollars) As at As at As at As at As at
Jan 31 Avg High Low Oct 31 Avg Jul 31 Avg Apr 30 Avg Jan 31 Avg
Equity
Foreign exchange
Commodities
Interest rate
Credit specific
Diversification
VaR
Stressed VaR
1 The table shows VaR and stressed VaR for trading activities that have a capital requirement under the internal models-based approach, for which we have been granted approval by OSFI. Regulatory capital for market risk is allocated based on VaR and stressed VaR only
for those trading positions that have approval to use the internal models-based approach. The above numbers reflect calculations for VaR and stressed VaR based on a 1 day time horizon. As stipulated by OSFI, RBC’s Market Risk regulatory capital calculations are
based on VaR and stressed VaR measures for a 10 day time horizon.
n.m. not meaningful
For the three months ended
Q1/18 Q4/17 Q3/17 Q2/17 Q1/17
-50-
1st Quarter 2018 - Supplementary Financial Information ROYAL BANK OF CANADA

CALCULATION OF ROE 1 AND RETURN ON RISK CAPITAL (RORC) 1IFRS 9
(Millions of Canadian dollars, except percentage and per share amounts) Q1/18 Q4/17 Q3/17 Q2/17 Q1/17 Q4/16 Q3/16 Q2/16 Q1/16 2017 2016
Personal & Commercial Banking
Net income available to common shareholders
Average risk capital
Add: Average goodwill and other intangibles
Average attributed capital
ROE 2
RORC
Canadian Banking
Net income available to common shareholders
Average risk capital
Add: Average goodwill and other intangibles
Average attributed capital
ROE 2
RORC
Wealth Management
Net income available to common shareholders
Average risk capital
Add: Average goodwill and other intangibles
Average attributed capital
ROE 2
RORC
Insurance
Net income available to common shareholders
Average risk capital
Add: Average goodwill and other intangibles
Average attributed capital
ROE 2
RORC
Investor & Treasury Services
Net income available to common shareholders
Average risk capital
Add: Average goodwill and other intangibles
Average attributed capital
ROE 2
RORC
Capital Markets
Net income available to common shareholders
Average risk capital
Add: Average goodwill and other intangibles
Average attributed capital
ROE 2
RORC
Net income available to common shareholders
Average risk capital and other
Add: Average under/(over) attribution of capital
Average attributed capital
RBC
Net income
Net income available to common shareholders
Average risk capital
Average common equity
ROE
RORC
1
2
3
Corporate Support 3
These measures do not have a standardized meaning under GAAP. For further information, refer to the Key performance and non-GAAP measures section on page 50.
Business segment ROE is based on Average attributed capital. Under/(over) attribution of capital is reported in Corporate Support.
We do not report ROE and RORC for Corporate Support as they are considered not meaningful.
IAS 39 IAS 39
-51-
1st Quarter 2018 - Supplementary Financial Information ROYAL BANK OF CANADA
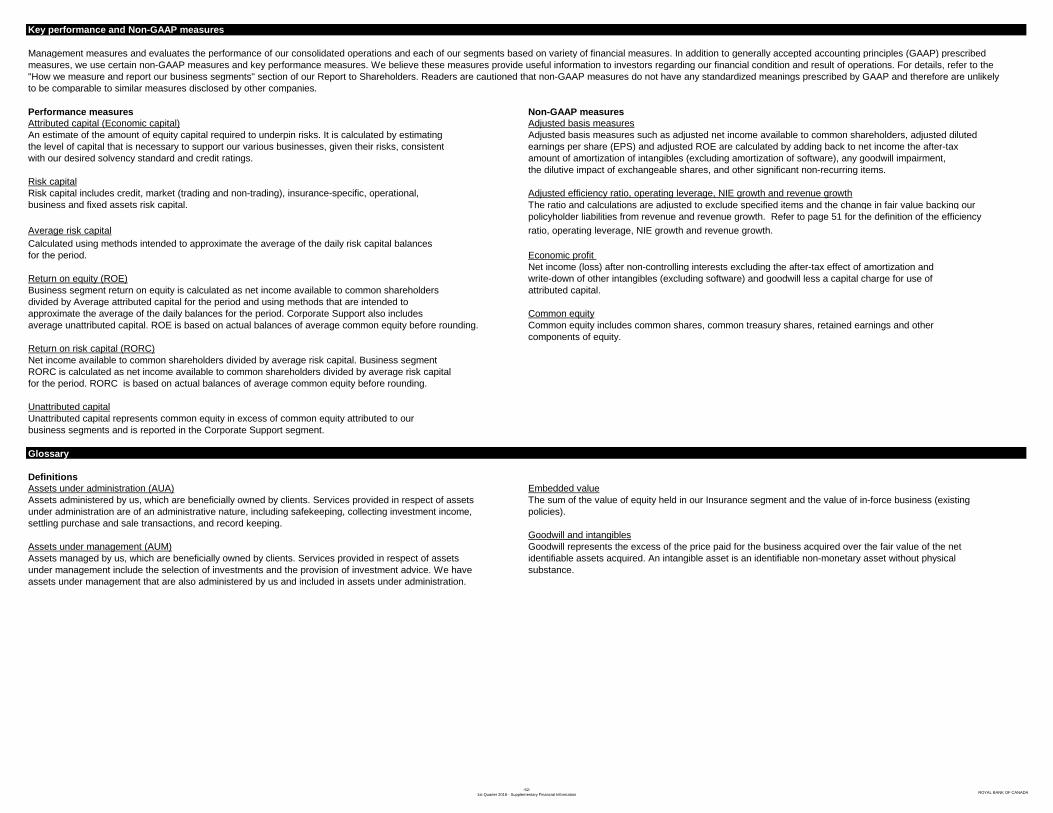
Key performance and Non-GAAP measures
Performance measures Non-GAAP measures
Attributed capital (Economic capital) Adjusted basis measures
An estimate of the amount of equity capital required to underpin risks. It is calculated by estimating Adjusted basis measures such as adjusted net income available to common shareholders, adjusted diluted
the level of capital that is necessary to support our various businesses, given their risks, consistent earnings per share (EPS) and adjusted ROE are calculated by adding back to net income the after-tax
with our desired solvency standard and credit ratings. amount of amortization of intangibles (excluding amortization of software), any goodwill impairment,
the dilutive impact of exchangeable shares, and other significant non-recurring items.
Risk capital
Risk capital includes credit, market (trading and non-trading), insurance-specific, operational, Adjusted efficiency ratio, operating leverage, NIE growth and revenue growth
business and fixed assets risk capital. The ratio and calculations are adjusted to exclude specified items and the change in fair value backing our
policyholder liabilities from revenue and revenue growth. Refer to page 51 for the definition of the efficiency
Average risk capital ratio, operating leverage, NIE growth and revenue growth.
Calculated using methods intended to approximate the average of the daily risk capital balances
for the period. Economic profit
Net income (loss) after non-controlling interests excluding the after-tax effect of amortization and
Return on equity (ROE) write-down of other intangibles (excluding software) and goodwill less a capital charge for use of
Business segment return on equity is calculated as net income available to common shareholders attributed capital.
divided by Average attributed capital for the period and using methods that are intended to
approximate the average of the daily balances for the period. Corporate Support also includes Common equity
average unattributed capital. ROE is based on actual balances of average common equity before rounding. Common equity includes common shares, common treasury shares, retained earnings and other
components of equity.
Return on risk capital (RORC)
Net income available to common shareholders divided by average risk capital. Business segment
RORC is calculated as net income available to common shareholders divided by average risk capital
for the period. RORC is based on actual balances of average common equity before rounding.
Unattributed capital
Unattributed capital represents common equity in excess of common equity attributed to our
business segments and is reported in the Corporate Support segment.
Glossary
Definitions
Assets under administration (AUA) Embedded value
Assets administered by us, which are beneficially owned by clients. Services provided in respect of assets The sum of the value of equity held in our Insurance segment and the value of in-force business (existing
under administration are of an administrative nature, including safekeeping, collecting investment income, policies).
settling purchase and sale transactions, and record keeping.
Goodwill and intangibles
Assets under management (AUM) Goodwill represents the excess of the price paid for the business acquired over the fair value of the net
Assets managed by us, which are beneficially owned by clients. Services provided in respect of assets identifiable assets acquired. An intangible asset is an identifiable non-monetary asset without physical
under management include the selection of investments and the provision of investment advice. We have substance.
assets under management that are also administered by us and included in assets under administration.
Management measures and evaluates the performance of our consolidated operations and each of our segments based on variety of financial measures. In addition to generally accepted accounting principles (GAAP) prescribed
measures, we use certain non-GAAP measures and key performance measures. We believe these measures provide useful information to investors regarding our financial condition and result of operations. For details, refer to the
"How we measure and report our business segments" section of our Report to Shareholders. Readers are cautioned that non-GAAP measures do not have any standardized meanings prescribed by GAAP and therefore are unlikely
to be comparable to similar measures disclosed by other companies.
-52-
1st Quarter 2018 - Supplementary Financial InformationROYAL BANK OF CANADA

Glossary continued
Definitions
Taxable equivalent basis (teb) Capital charge
Income from certain specified tax-advantaged sources is increased to a level that would make it comparable Calculated by multiplying the cost of capital by the amount of average common equity. The cost of capital
to income from taxable sources. There is an offsetting adjustment in the tax provision, thereby generating is a proxy for the after-tax return that we estimate to be required by shareholders for the use of their capital.
the same after-tax net income. We record teb adjustments in Capital Markets and record elimination
adjustments in Corporate Support. Dividend yield
Dividends per common share divided by the average of the high and low share prices in the relevant period.
Total trading revenue
Total trading revenue is comprised of trading related revenue recorded in Net interest income and Diluted EPS
Non-interest income. Diluted EPS is net income attributable to common shareholders divided by the average diluted shares
outstanding. Both net income and number of shares outstanding have been adjusted for the impact
Net impaired loans of exchangeable shares.
Gross impaired loans less the associated allowance for credit losses on impaired loans by portfolio.
Effective tax rate (teb)
Ratios Effective tax rate (teb) is calculated using the tax provision for the period adjusted for the teb amount divided
Capital ratios by the net income before tax for the period also adjusted for the teb amount. For teb, refer to Definitions above.
The percentage of risk-adjusted assets supported by capital, using the guidelines of OSFI based
on standards issued by the Bank for International Settlements and GAAP financial information. Market capitalization
End of period common shares outstanding multiplied by the closing common share price on the Toronto
Common Equity Tier 1 ratio Stock Exchange.
Common Equity Tier 1 (CET1) capital under Basel III comprises the highest quality of capital including
common shares, retained earnings, accumulated other comprehensive income and other items. Net interest margin (average assets)
Regulatory adjustments such as goodwill and intangibles, deferred tax assets, and other components Net interest income as a percentage of total average assets.
subject to threshold deductions are excluded from CET1 capital. This ratio is calculated by dividing CET1
by risk-weighted assets, in accordance with OSFI's Basel III Capital Adequacy Requirements guideline. Net interest margin (average earning assets)
Net interest income as a percentage of total average earning assets.
Efficiency ratio
Non-interest expense as a percentage of total revenue. For adjusted efficiency ratio refer to the Net write-offs
non-GAAP measures on page 50. Gross write-offs less recoveries of amounts previously written off.
Return on assets Operating leverage
Net income as a percentage of average assets. The difference between our revenue growth rate and non-interest expense growth rate. For adjusted
operating leverage ratio, refer to the non-GAAP measures on page 50.
Return on risk-weighted assets
Net income as a percentage of average risk-weighted assets. NIE Growth
The growth rate is calculated based on NIE in the same period a year ago. For adjusted NIE growth,
Calculations refer to the non-GAAP measures on page 50.
Average balances (assets, loans and acceptances, and deposits)
Calculated using methods intended to approximate the average of the daily balances for the period. Revenue Growth
The growth rate is calculated based on revenue in the same period a year ago. For adjusted revenue growth,
Average common equity refer to the non-GAAP measures on page 50.
Calculated using methods intended to approximate the average of the daily balances for the period.
For the business segments, calculated using methods intended to approximate the average of the Risk-weighted assets (RWA) - Basel III
daily attributed capital for the period. Used in the calculation of risk-based capital ratios as defined by the guidelines issued by OSFI. The guidelinesare Basel III effective January 1, 2013 and the “Basel III: A global regulatory framework for more resilient
Average balances (assets, loans and acceptances, and deposits) banks and banking systems - December 2010 (rev June 2011)” issued by the Basel Committee on
Calculated using methods intended to approximate the average of the daily balances for the period. Banking Supervision (BCBS) and adopted by OSFI effective January 2013. A majority of our credit risk
portfolios use IRB Approach and the remainder uses Standardized Approach for the calculation of RWA
Average common equity based on the total exposure (i.e. exposure at default, and counterparty risk weights). For market risk
Calculated using methods intended to approximate the average of the daily balances for the period. measurement we use the internal models approach for products with regulatory approval and a
For the business segments, calculated using methods intended to approximate the average of the standardized approach for all other products. For Operational risk, we use the Advanced Measurement
daily attributed capital for the period. Approach. In addition, Basel III requires a transitional capital floor adjustment.
Average earning assets n.a.
Average earning assets include interest-bearing deposits with other banks, securities, assets purchased Not applicable
reverse repurchase agreements and securities borrowed, loans, and excludes segregated fund net asset
and other assets. The averages are based on the daily balances for the period. Commencing Q2/15, average
earning assets also include cash collateral and margin deposits and exclude insurance assets.
-53-
1st Quarter 2018 - Supplementary Financial InformationROYAL BANK OF CANADA