supplementary figure 1 - nature research · ns. ns. ns * * ns. ns. ns. 0 50 100 150 200 250 300...
TRANSCRIPT
a
GIST 882 0
50
100
150
200
250
300
350
Medium
*
IFN
-γ(p
gm
l-1)
0
20
40
60
80
100
120
SKNB-SHMedium
IFN
-γ(p
gm
l-1)
**
c
b
IgG2a NKp30 crosslinking
PMA/
Iono
IL-2
(2
00UI
/mL)
IL
-2
(100
0UI/m
L)
PMA/
Iono
IL-2
(2
00UI
/mL)
IL
-2
(100
0UI/m
L)
0
0.2
0.4
0.6
0.8
1
1.2
1.4
1.6NS
NSNS
**
NS
NS NS
0
50
100
150
200
250
300TN
F-α
(pg
ml-1
)
IgG2a NKp30 crosslinking
PMA/
Iono
IL-2
(2
00UI
/mL)
IL
-2
(100
0UI/m
L)
PMA/
Iono
IL-2
(2
00UI
/mL)
IL
-2
(100
0UI/m
L)
** NS
**
**
IFN
-γ(n
gm
l-1)
Med
ium
Med
ium
Med
ium
Med
ium
NKp30
GFP
CD25CD158bCD158aNKp46NKG2D NKp44
UntransfectedNKL
NKL–NKp30 b
NKL–NKp30 c
NKL–NKp30 a
Even
ts
IL12Rβ CD160.9 0.26
14.184.8
0%
1.12 91.6
4.632.62
92%
2.53 94.6
1.761.15
95%
0.67 97.9
1.070.33
98%
14%
NKL−NKp30 b
NKL−NKp30 c
NKL−NKp30 a
Untransfected NKL
NKL−NKp30 b
NKL−NKp30 c
NKL−NKp30 a
Untransfected NKL
0100200300400500600700800900
1 000
HEK293 Medium
IFN
-γ(p
gm
l-1)
*NKL−NKp30 b
NKL−NKp30 c
NKL−NKp30 a
Untransfected NKL
Medium,
Supplementary Figure 1Nature Medicine doi:10.1038/nm.2366

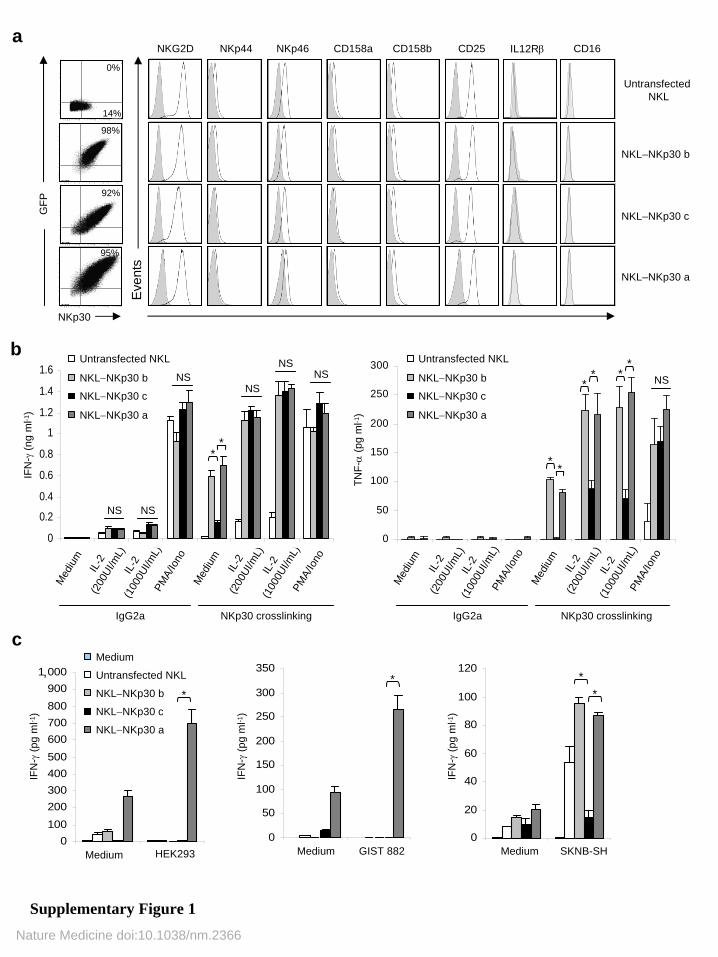
Supplementary Figure 1. Expression and phenotype of the NKp30a, b or c transfected cell lines.(a) Phenotypic analyses of GFP and NKp30 surface expression as well as various NK cell receptors expressed on the transfected and the parental NKL cell lines by flow cytometry. Mean fluorescence intensities of NKp30 oscillated between 250–320 for all NKL transfected cells. Stainings of the indicated NK cell receptors (empty histogram) were compared with the relevant isotype controls (field histogram). A representative dot plot is depicted out of two (NK receptors) to twenty (GFP). (b) Cytokine release in transfected NKL cells after stimulation with grading doses of IL-2 in the presence or absence of a crosslinking with anti–NKp30 Ab or PMA/ionomycine. IFN-γ
and TNF-α
levels are represented as means ±
SEM of triplicate wells in two independent experiments. (c) IFN-γ release by NKL-NKp30a (and to a lesser extent NKp30b) stimulated by a variety of B7-H6 expressing tumor cells. Similar setting as in Fig. 2f. *p < 0.05; NS: non significant.

DC
DC
+ N
KL
(gat
ed o
n D
C)
DC
+ N
KL
(gat
ed o
n N
KL)
T =
6 h
T =
18 h
T =
24 h
TNF-α
CD
11c
CD
11c
NKp
30
0.15
%
0.29
%
0.14
%
0.50
%
3.58
%
1.64
%
14.6
%14
.0%
15.6
%17
.9%
3.12
%1.
90%
1.56
%2.
47%
2.34
%1.
62%
1.06
%1.
18%
0.55
%0.
46%
0.43
%0.
77%
0.53
%0.
37%
0.51
%3.
37%
0.35
%5.
97%
1.96
%4.
10%
Med
ium
LPS
NK
L–N
Kp3
0 b
NK
L–N
Kp3
0 c
NK
L–N
Kp3
0 a
NK
L–N
Kp3
0 b
NK
L–N
Kp3
0 c
NK
L–N
Kp3
0 a
NK
LD
C +
NK
L(g
ated
on
NK
L)
0.15
%0.
33%
0.23
%0.
31%
2.27
%13
.1%
6.85
%32
.6%
NKp
30N
Kp30
IFN-γ
T =
18 h
NK
L–N
Kp3
0 b
NK
L–Kp
30 c
NK
L–N
Kp3
0 a
Unt
rans
fect
edN
KL
NK
L–N
Kp3
0 b
NK
L–N
Kp3
0 c
NK
L–N
Kp3
0 a
0.55
%0.
20%
0.23
%0.
19%
1.54
%2.
18%
1.20
%1.
30%
1.90
%1.
30% CD
11c
CD
11c
NKp
30
IL-10
T =
24 h
Supp
lem
enta
ryFi
gure
2
Unt
rans
fect
edN
KL
Unt
rans
fect
edN
KL
Unt
rans
fect
edN
KL
Supplementary Figure 2. Time course study of cytokine release by DC and NKL cells during the DC/NKL crosstalk.NKp30-transfected NKL cells were cocultured with iDC as described in Figure 2. TNF-α, IL-10 and IFN-γ
secretions were assessed in DC (gated on CD11c+ cells) and NKL (gated on NKp30+ cells) at 6, 18 and 24 h by intracellular staining by flow cytometry. The thresholds of positivity have been determined using isotype control antibodies. A representative dot plot out of three experiments yielding similar results is depicted.
0
10
20
30
40
50
60
70
80
90
100
20:1 10:1 5:1
HeLa
Inhi
bitio
n of
pro
lifer
atio
n(%
)
*
*
*
0
10
20
30
40
50
60
70
80
90
100
20:1 10:1 5:1
a HEK293In
hibi
tion
of p
rolif
erat
ion
(%) *
*
*
0
20
40
60
80
100
120
140
NKL:HEK293
Medium 5:1 10:1 25:1
**
**
**
IL-1
0 (p
gm
l-1)
b
0
2
4
6
8
10
12
14
P81
5 cy
toto
xici
ty(%
)
*Isotype IgG2a
Ab anti–NKp30
Untransfected NKL
NKL– NKp30 b
NKL– NKp30 c
NKL– NKp30 a
c
NKL−NKp30 b
NKL−NKp30 c
NKL−NKp30 a
Untransfected NKL
NKL−NKp30 b
NKL−NKp30 c
NKL−NKp30 a
Untransfected NKL
NKL−NKp30 b
NKL−NKp30 c
NKL−NKp30 a
Untransfected NKL
Medium
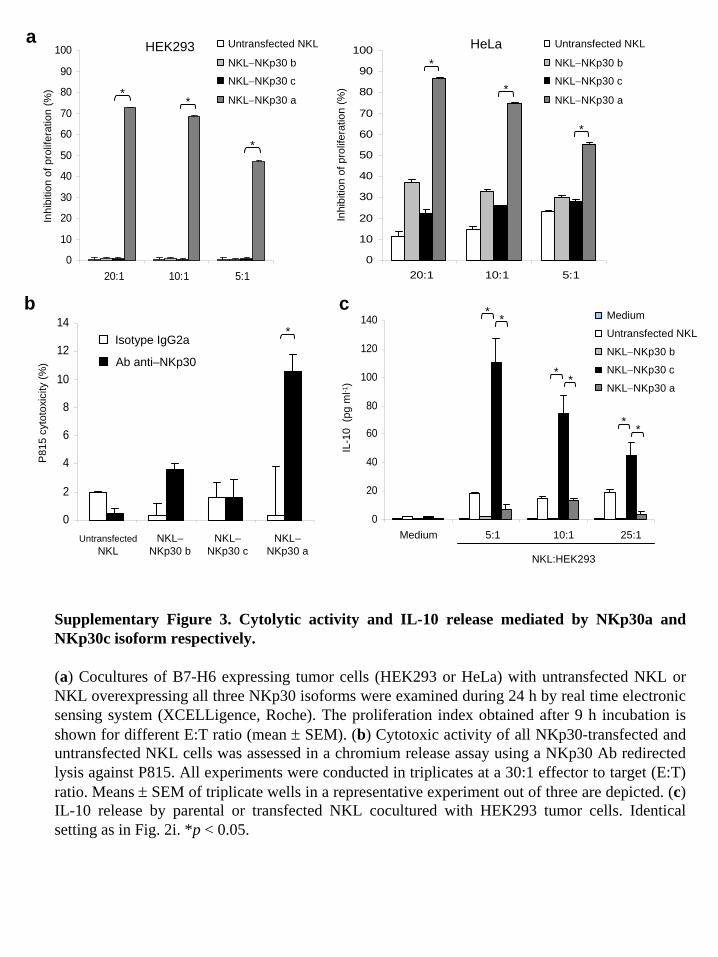
Supplementary Figure 3. Cytolytic activity and IL-10 release mediated by NKp30a and NKp30c isoform respectively.
(a) Cocultures of B7-H6 expressing tumor cells (HEK293 or HeLa) with untransfected NKL or NKL overexpressing all three NKp30 isoforms were examined during 24 h by real time electronic sensing system (XCELLigence, Roche). The proliferation index obtained after 9 h incubation is shown for different E:T ratio (mean ±
SEM). (b) Cytotoxic activity of all NKp30-transfected and untransfected NKL cells was assessed in a chromium release assay using a NKp30 Ab redirected lysis against P815. All experiments were conducted in triplicates at a 30:1 effector to target (E:T) ratio. Means ±
SEM of triplicate wells in a representative experiment out of three are depicted. (c) IL-10 release by parental or transfected NKL cocultured with HEK293 tumor cells. Identical setting as in Fig. 2i. *p < 0.05.

0
1020
30
40
5060
70
80
b
d NKp30 crosslinking(60 min)
RelA–p50
NKp3
0 b
NKp3
0 c
NKp3
0 a
Untra
nsfe
cted
NKp3
0 b
NKp3
0 c
NKp3
0 a
Untra
nsfe
cted
NKp3
0 b
NKp3
0 c
NKp3
0 a
Untra
nsfe
cted
IgG2a(60 min)
TNF-α
(60 min)
phospho-IκBα
35
40
43
a
IκBα
NKL
β-actin
IgG2a (0 min)
TNF-α(60 min)
IgG2a(60 min)
NKp3
0 b
NKp3
0 c
NKp3
0 a
Untra
nsfe
cted
NKp30 crosslinking(60 min)
NKp3
0 b
NKp3
0 c
NKp3
0 a
Untra
nsfe
cted
NKp3
0 b
NKp3
0 c
NKp3
0 a
Untra
nsfe
cted
NKp3
0 b
NKp3
0 c
NKp3
0 a
Untra
nsfe
cted
NKL
35
42
IκBα
phospho-IκBα
β-actin 42
IgG2a (120 min)
NKp30 crosslinking (120 min)
IgG2a(240 min)
NKp3
0 b
NKp3
0 c
NKp3
0 a
Untra
nsfe
cted
NKp30 crosslinking(240 min)
NKp3
0 b
NKp3
0 c
NKp3
0 a
Untra
nsfe
cted
NKp3
0 b
NKp3
0 c
NKp3
0 a
Untra
nsfe
cted
NKp3
0 b
NKp3
0 c
NKp3
0 a
Untra
nsfe
cted
5 µm
Untransfected NKL NKL–NKp30 b
NKL–NKp30 c NKL–NKp30 a
c
NKp30 crosslinking
0 min 60 min
TNF-α
60 min
*
IgG2a
Per
cent
age
of p
65 n
ucce
lls
0
1
2
3
4
5
6
0 60 120 180 240
Time (min)
Nor
mal
ized
phos
pho-
IκB
α/κ
Bα
Supplementary Figure 4.
e
0
20
40
60
80
100
120
140
160
180
IFN
-γ(p
gm
l-1)
**
**
*
*
NS NS
NS
NS
NS NS
SKNB–SH GIST 882 HeLa HEK293 Medium
Ctrl inhibitorp38 inhibitor +
--+
+-
-+
+-
-+
+-
-+
+-
-+
+-
-+
+-
-+
+-
-+
+-
-+
+-
-+
+-
-+
+-
-+
+-
-+
+-
-+
+-
-+
MW (kDa)
MW (kDa)
NKL−NKp30 b
NKL−NKp30 c
NKL−NKp30 a
Untransfected NKL
NKL−NKp30 b
NKL−NKp30 c
NKL−NKp30 a
Untransfected NKL
NKL−NKp30 b
NKL−NKp30 c
NKL−NKp30 a
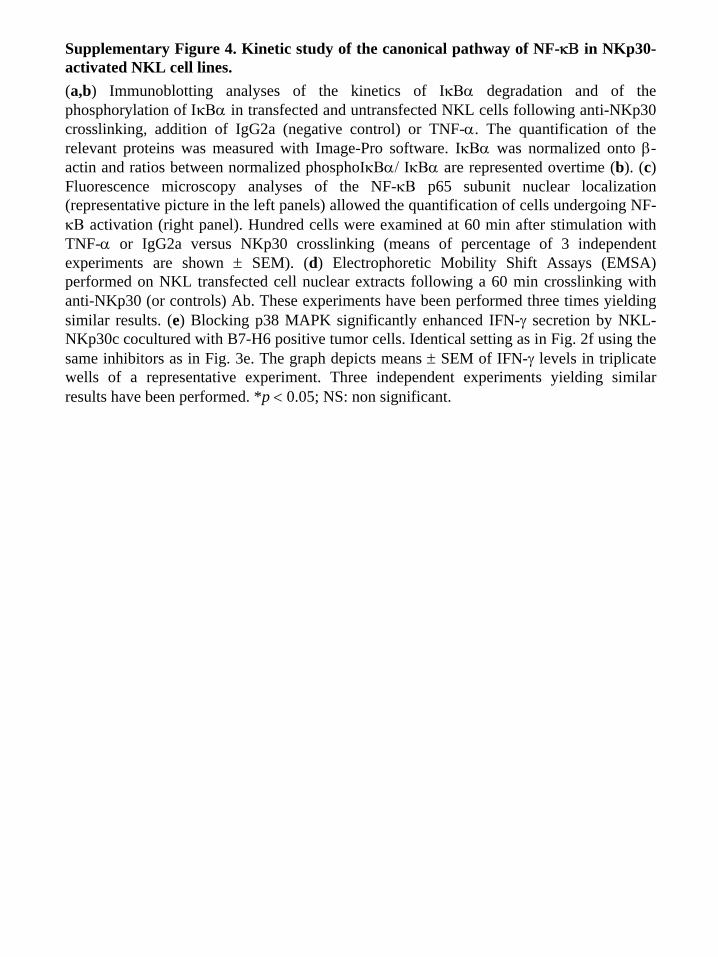
Supplementary Figure 4. Kinetic study of the canonical pathway of NF-κΒ
in NKp30- activated NKL cell lines. (a,b) Immunoblotting analyses of the kinetics of IκΒα
degradation and of the phosphorylation of ΙκΒα
in transfected and untransfected NKL cells following anti-NKp30 crosslinking, addition of IgG2a (negative control) or TNF-α. The quantification of the relevant proteins was measured with Image-Pro software. IκΒα
was normalized onto β- actin and ratios between normalized phosphoIκΒα/
IκΒα
are represented overtime (b). (c) Fluorescence microscopy analyses of the NF-κΒ
p65 subunit nuclear localization (representative picture in the left panels) allowed the quantification of cells undergoing NF- κΒ
activation (right panel). Hundred cells were examined at 60 min after stimulation with TNF-α
or IgG2a versus NKp30 crosslinking (means of percentage of 3 independent experiments are shown ±
SEM). (d) Electrophoretic Mobility Shift Assays (EMSA) performed on NKL transfected cell nuclear extracts following a 60 min crosslinking with anti-NKp30 (or controls) Ab. These experiments have been performed three times yielding similar results. (e) Blocking p38 MAPK significantly enhanced IFN-γ
secretion by NKL- NKp30c cocultured with B7-H6 positive tumor cells. Identical setting as in Fig. 2f using the same inhibitors as in Fig. 3e. The graph depicts means ±
SEM of IFN-γ
levels in triplicate wells of a representative experiment. Three independent experiments yielding similar results have been performed. *p < 0.05; NS: non significant.

b
a
c
0102030405060708090
100
0102030405060708090
100
PBMCNK cells
Pro
porti
on o
f NK
p30
isof
orm
s(%
)
NKp30 b NKp30 c NKp30 a
NS
NSNS
Pro
porti
on o
f NK
p30
isof
orm
s(%
)
NKp30 b NKp30 c NKp30 a
NS
NS
NS
PBMCNK cells
Profile AB Profile C
Supplementary Figure 5
d
NKp30 b NKp30 c NKp30 a NKp30 b NKp30 c NKp30 a 0
102030405060708090
100
Pro
porti
on o
f NK
p30
isof
orm
s(%
)
Pro
porti
on o
f NK
p30
isof
orm
s(%
)
0102030405060708090
100
NS
Profile AB
NS
NS
NS
NS
NS
Profile C
4
Before2 months5 months14 months45 months
Before3 months5 months
0
10
20
30
40
50
60
Profile AB Profile C
Per
cent
age
of N
Kp3
0 c
isof
orm
NS
NS
(n = 4) (n = 3)
PBMCLiverLymph node
A133 A204 A392 A20 A31 A54 A9 A12 A19 A38
Donor P61 Donor G Donor B Donor R
Clones
Pro
porti
on o
f NK
p30
isof
orm
s(%
)
NKp30bNKp30cNKp30a
0
10
20
30
40
50
60
70
80
90
100 NKp30 bNKp30 cNKp30 a

Supplementary Figure 5. Transcriptional profiling of NKp30 in PBMC, NK cell clones and NK cells purified from various sources.
(a) The relative expression of each NKp30 splice variant was determined in GIST patients exhibiting a profile AB (n = 11, left panel) and a profile C (n = 9, right panel) using cDNA extracted from PBMC or purified NK cells. (b) The relative expression of each individual splice variant of NKp30 was determined at different time points in a longitudinal study on IM treated GIST patients. The data pertaining to two individuals segregating in profile AB (left panel) and profile C (right panel) are shown and representative of other patients. (c) The differential expression profile of NKp30 isoforms was determined at a defined time point of the disease in four cancer patients from blood, lymph nodes and liver. Means ±
SEM are shown. NS: non significant. (d) Ten clones of NK cells derived from four different individuals, as previously described2, were assessed for their relative expression of each NKp30 isoform in RT-PCR. It is of note that donor G, B and R were defined as belonging to profile C according to the non hierarchical clustering (shown in Fig. 4) while donor P61 was profile AB. The determination has been run twice with identical results.

SUPPLEMENTARY TABLES
0BTable S1. Characteristics of GIST patients for the Immunohistochemistry study
Patients n = 44
Gender (male/female) 21/22
Age (mean ± SD) 57 ± 12
Primary tumor site Stomach 44% Small bowel 36% Others 20%
Metastasis 57% Metastatic site(s) Liver 28% Peritoneum 28% Both 44%
Miettinen Classification High risk 59% Intermediate risk 5% Low risk 16% Non evaluable 20%
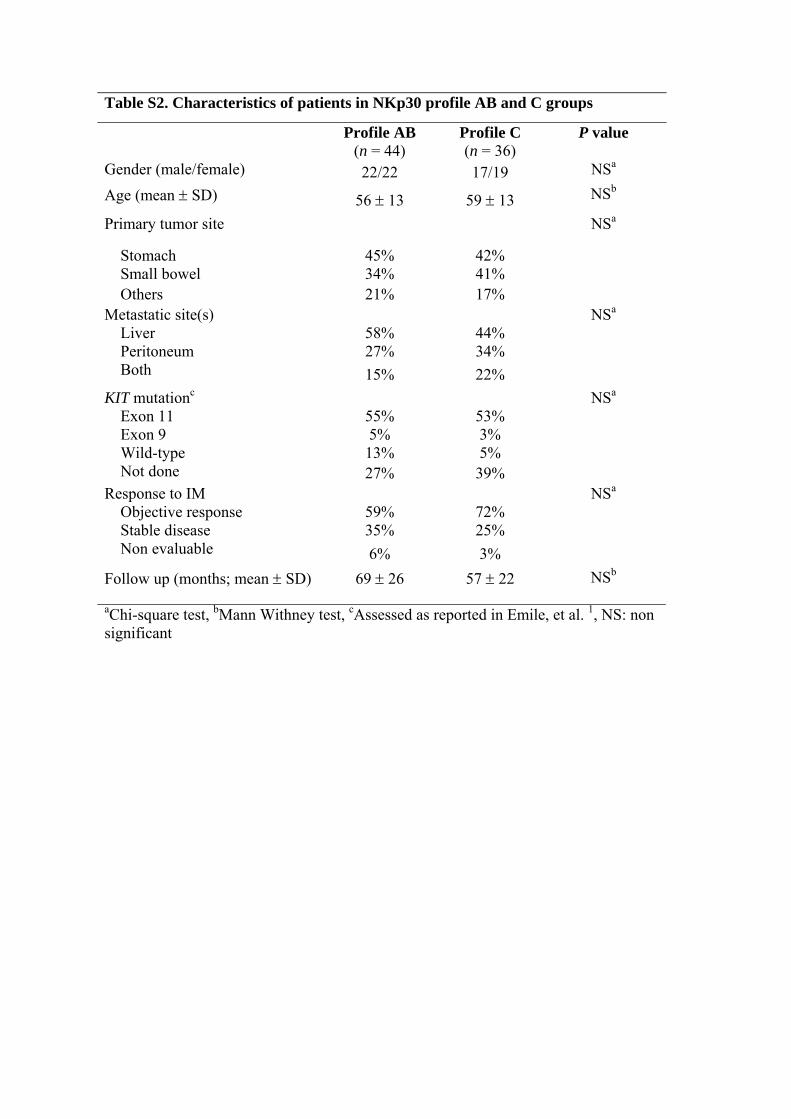
1BTable S2. Characteristics of patients in NKp30 profile AB and C groups
Profile AB (n = 44)
Profile C (n = 36)
P value
Gender (male/female) 22/22 17/19 NSa Age (mean ± SD) 56 ± 13 59 ± 13 NSb
Primary tumor site NSa
Stomach 45% 42%
Small bowel 34% 41% Others 21% 17% Metastatic site(s) NSa Liver 58% 44% Peritoneum 27% 34% Both 15% 22%
KIT mutationc NSa Exon 11 55% 53% Exon 9 5% 3% Wild-type 13% 5% Not done 27% 39% Response to IM NSa Objective response 59% 72% Stable disease 35% 25% Non evaluable 6% 3%
Follow up (months; mean ± SD) 69 ± 26 57 ± 22 NSb
aChi-square test, bMann Withney test, cAssessed as reported in Emile, et al. 1, NS: non significant
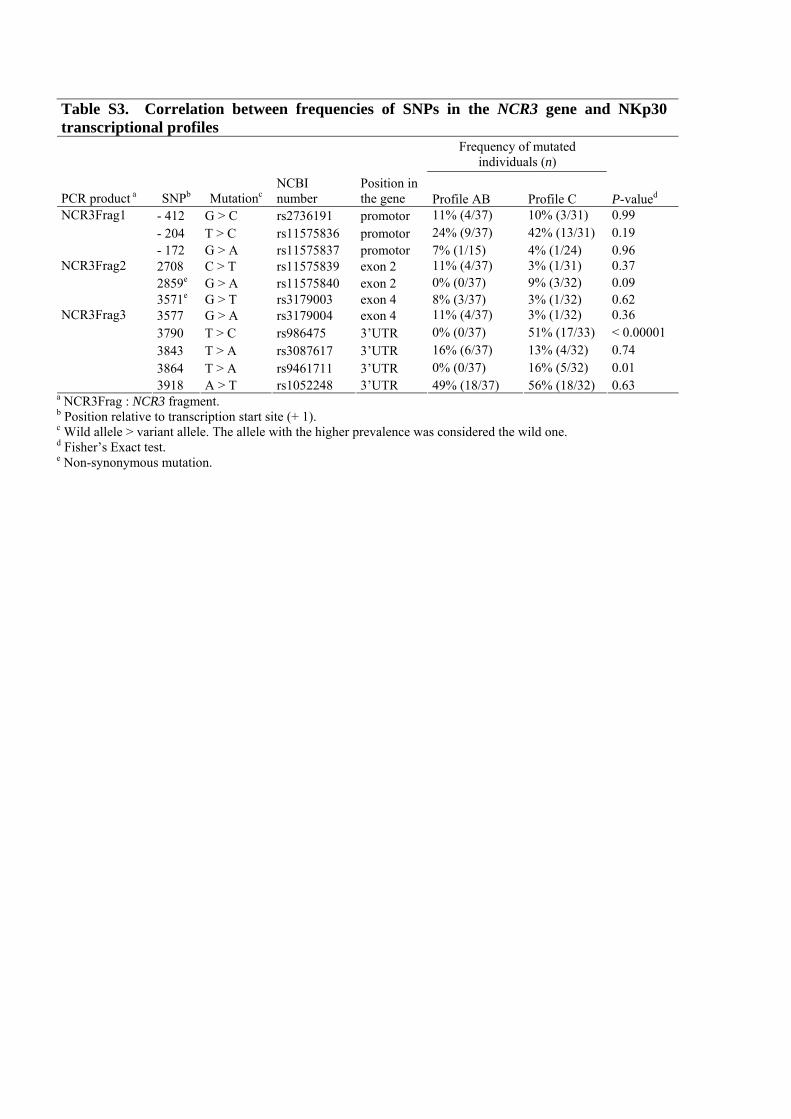
Table S3. Correlation between frequencies of SNPs in the NCR3 gene and NKp30 transcriptional profiles
Frequency of mutated individuals (n)
PCR product a SNPb Mutationc NCBI number
Position in the gene Profile AB Profile C P-valued
- 412 G > C rs2736191 promotor 11% (4/37) 10% (3/31) 0.99 - 204 T > C rs11575836 promotor 24% (9/37) 42% (13/31) 0.19
NCR3Frag1
- 172 G > A rs11575837 promotor 7% (1/15) 4% (1/24) 0.96 2708 C > T rs11575839 exon 2 11% (4/37) 3% (1/31) 0.37 2859e G > A rs11575840 exon 2 0% (0/37) 9% (3/32) 0.09
NCR3Frag2
3571e G > T rs3179003 exon 4 8% (3/37) 3% (1/32) 0.62 3577 G > A rs3179004 exon 4 11% (4/37) 3% (1/32) 0.36 3790 T > C rs986475 3’UTR 0% (0/37) 51% (17/33) < 0.00001 3843 T > A rs3087617 3’UTR 16% (6/37) 13% (4/32) 0.74 3864 T > A rs9461711 3’UTR 0% (0/37) 16% (5/32) 0.01
NCR3Frag3
3918 A > T rs1052248 3’UTR 49% (18/37) 56% (18/32) 0.63 a NCR3Frag : NCR3 fragment. b Position relative to transcription start site (+ 1). c Wild allele > variant allele. The allele with the higher prevalence was considered the wild one. d Fisher’s Exact test. e Non-synonymous mutation.
Supplementary methods
Immunohistochemistry staining of NKp46. 3μm-thick sections of formalin-fixed, paraffin-
embedded GIST specimens were mounted on poly-L-lysine-coated slides, deparaffinized and
hydrated through graded alcohols to water. Sections were pre-treated with Tris-EDTA buffer
(10mM Tris, 1mM EDTA, pH 9) for 30 minutes in a 98 °C water bath. Endogenous peroxidase
activity was inhibited with 3% hydrogen peroxidase (DAKO) for 10 minutes. The primary
antibody, mouse IgG2b anti-human NKp46 monoclonal Ab (clone 195314, 5μg mL-1, R&D) was
incubated for 1 hour, followed by the secondary Ab, Biotin F(ab’)2 Donkey anti-Mouse IgG (H+L)
(Jackson Immunoresearch) for 30 minutes, and the streptavidin-HRP was incubated for an
additional 30 minutes. Peroxidases were detected with 3-amino-9-ethylcarbazole substrate (AEC,
Vector Laboratories), and the sections were counterstained with Harris’s hematoxylin. Negative
controls were processed in the same manner, using a mouse IgG2b isotype control (5μg mL-1,
R&D) as primary Ab.
Cytokine release assays. Immature DC (iDC) cultured in AIMV (Gibco) with rhGM-CSF (1,000
UI mL-1) and rhIL-4 (400 UI mL-1, R&D) as previously described3 or mDC (obtained with 1 μg
mL-1 LPS (Sigma-Aldrich) and 1 μg mL-1 sCD40L (MACs, Miltenyi)) were admixed at a ratio 1:1
or 1:3 with 0.5x10⁵ or 1.5x10⁵ NKL-NKp30 a, b or c isoforms for 24 h. Alternatively, 1 x 10⁵ tumor
cells (HEK293, GIST 882 (kindly provided by J.A. Fletcher, Harvard Medical School, Boston,
MA), HeLa and SKN-SH) were admixed at various E:T ratio with NKL cells in AIMV medium.
Tumor cells were seeded overnight in RPMI (HEK293, GIST) or DMEM medium (HeLa, SKN-
SH) supplemented with 10% foetal calf serum (FCS, PAA) and 1% Pen/Strep. In some
experiments, transfected NKL cells were preincubated for 1 h with pharmacological inhibitors of
p38 MAPK (SB 203580, 20 μM Calbiochem) or mock reagent (SB202474 and DMSO) prior to the
cocultures. Alternatively rhIL-2 (2 ng mL-1) was added to the NKL cells. Autologous mDC/NK
crosstalk from GIST patients were performed by admixing 2.5 x 10⁴ mDC with autologous enriched

NK cells (Easy Sep kit, Stem cell Technologies) at a ratio 1:1 for 24 h. For IL-10 blocking
experiments, anti–human IL-10 antibody or isotype control (10 μg mL-1 final concentration, clone
JES3–19F1, BD Pharmingen) were incubated with mDC for 2 h at 37 °C prior to the addition of NK
cells. In some experiments, anti-human NKp30 IgM (clone F252), or as control anti-human NKp44
IgM antibodies (clone KS38) were added to NK cells for 2 h at 37 °C prior to the cocultures.
Supernatants were harvested to monitor the cytokine levels using commercial ELISA (human IFN-
γ, TNF-α, IL-12p70, IL-10 kits, BD Biosciences Pharmingen).
CD107a degranulation assays. NKp30-transfected NKL or Jurkat transfectants as well as GIST or
HV purified NK cells (1 x 10⁵) were seeded in 96-Maxisorb plates (Nunc) coated with 2.5 μg mL-1
mouse IgG2a anti-NKp30 (clone 210847, R&D), IgG1 anti-NKG2D (clone 149810, R&D), IgG1
anti-CD16 (clone 3G8, Biolegend) or isotype control for 20 h at 37 °C with or without 5 ng mL-1
PMA and 0.1 mg mL-1 ionomycine. Supernatants were harvested for cytokine quantification by
commercial ELISA. CD107a degranulation was assessed by flow cytometry by incubating
transfected NKL or purified NK cells for 7 h on NKp30 or isotype control coated plates with 2 μl of
anti-CD107a-PE and 10 μM Golgi Stop (BD Biosciences).
Sequences of primers and probes for qRT–PCR. The following primers and probes were used
for the qRT-PCR of NKp30 isoforms:
NKP30-EC (Forward): 5’-TTTCCTCCATGACCACCAGG-3’;
NKP30-EX4I (Reverse): 5’-TTCCCATGTGACAGTGGCATT-3’;
NKP30-EX4II (Reverse): 5’-CGGAGAGAGTAGATTTGGCATATT-3’;
NKP30-EX4III (Reverse): 5’-GGACCTTTCCAGGTCAGACATT-3’;
NKP30-Probe (6-FAM/TAMRA): 5’-TGGTGGAGAAAGAACATCCTCAGCTAGGG-3’;
Β2M-F (Forward): 5’-GATGAGTATGCCTGCCGTGT-3’;
Β2M-R (Reverse): 5’-AATTCATCCAATCCAAATGCG-3’;
Β2M-Probe (6-FAM/TAMRA): 5’-AACCATGTGACTTTGTCACAGCCCAA-3’.
Five microliters of first-strand cDNA was mixed with 12.5 µL of 2X TaqMan Gene Expression
Master Mix (Applied Biosystems) and 0.75 µL of NKp30 primers (10 µM) and probe (5 µM) or 0.5
µL of β2M primers (10 µM) and probe (5 µM) in a final volume of 25 µL. Temperature cycling and
real time fluorescence measurement were done using an StepOnePlus System (Applied
Biosystems). The PCR conditions were as follows: initial incubation at 50 °C for 2 min,
denaturation at 95 °C for 10 min, followed by 45 cycles at 95 °C for 15 s, and 60 °C (for NKp30a, b
and c, and β2M transcripts) for 1 min.
Sequences of primers for NCR3 sequencing. The following primers were used for the sequencing
of NCR3 gene:
NCR3Frag1 (Forward): 5’-GATGGGTCTGGGTACTGGTG-3’;
NCR3Frag1 (Reverse): 5’-GGGATCTGAGCAGTGAGGTC-3’;
NCR3Frag2 (Forward): 5’-ATCCTGTGCTCTCTGGGTGT-3’;
NCR3Frag2 (Reverse): 5’-CTGTACCAGCCCCTAGCTGA-3’;
NCR3Frag3 (Forward): 5’-CTGAACTTTCCCTTCCACCA-3’;
NCR3Frag3 (Reverse): 5’-GGTCCAGCCAGTAAAAACCA-3’.
Cloning of isoforms in expression vectors and transfections. The synthesized first-strand NK92
cDNA was amplified by PCR with the HotStarTAQ DNA polymerase (Qiagen). Primers were
designed with Primer3 v0.4.0 software and their sequences are listed with the PCR conditions
below. PCR products were purified from agarose gel using the QIAquick Gel Extraction kit
(Qiagen), digested with KpnI and EcoRI restriction enzymes (Ozyme) and ligated to pIRES-eGFP
bicistronic mammalian expression vector (Clontech). The nucleotide sequences were analyzed by
ABI PRISM 310 genetic analyzer (Applied Biosystems). NKL or Jurkat cells were transfected with
the three different NKp30 isoform-encoded plasmids using Amaxa nucleofector system (Lonza)
following the manufacturer’s instructions. The GFP+ NKp30+ transfected cells were cell-sorted by
Moflow (Beckman Coulter) and subsequently cultured with G418 antibiotic (0.8 mg mL-1 for NKL
and 2 mg mL-1 for Jurkat cells).
Sequences of primers for the NKp30 cloning system. The following primers were used for the
cloning of NKp30 isoforms (using cDNA derived from the NK92 cell line) in expression vectors:
KpnI-NKp30 (Forward): 5’-GGUGGTACCUCCGACATGGCCTGGATGCTGTT-3’;
EcoRI-NKp30b (Reverse): 5’-GUGAATTCUCTGGTGGAAGGGAAAGTTCAG-3’;
EcoRI-NKp30c (Reverse): 5’-GUGAATTCUCTTTTGAAGAGGACTAGGGACATC-3’;
EcoRI-NKp30a (Reverse): 5’-GUGAATTCUCATTTCTCAGGACAATCAGG-3’.
Underlined sequences represent restriction enzyme recognition sites for the DNA cloning in
expression plasmid vectors. Thermocycling started with a single denaturation step for 15 min at 95
°C, followed by 30 cycles of denaturation for 40 s at 95 °C, annealing for 30 s at 67 °C for NKp30a,
b and c primers, and extension at 72 °C for 1 min. One final extension step was added for 10 min at
72 °C.
Cytotoxicity Assay and Real time electronic sensing system (XCELLigence). NKL expressing
NKp30 isoforms a, b or c and untransfected NKL were assessed for their redirected cytolytic lysis
against the FcγR-positive cell line P815 (murine mastocytoma) and for their direct K562 cytotoxic
activity at different E:T ratios in a standard 4 hours chromium assay as previously described4. The
inhibition of tumor cells viability induced by all the NKL transfected cells expressing NKp30
isoforms a, b or c was assessed by the real time electronic sensing (RT-CES™) system
(XCELLigence, Roche)5. Briefly 1 x 10⁴ HEK293 or HeLa cells were seeded on 96-well plates
integrated with microelectrodes (E-plates™, Roche) and left to adhere for 4 hours. NKL a, b, c or
untransfected NKL were added at different E:T ratios and the tumor cells viability was monitored
every 15 minutes during 24 hours.

Electrophoretic mobility shift assays (EMSA) analysis
Nuclear extracts were prepared and analyzed for DNA-binding activity by using the HIV-LTR
tandem κB oligonucleotide as a κB probe as previously described6.
Cell conjugation and immunofluorescence. Cells were allowed to adhere to polylysine-L
coverslips (Sigma), fixed in PBS containing 4% paraformaldehyde at room temperature and
permeabilized with 0.03% Triton X-100 (Boehringer, Mannheim) for 30 min. Cells were then
stained for the detection of p65 (purified mouse anti-NF-κB p65, BD Biosciences Pharmingen),
revealed by goat anti-mouse Alexa 568 fluor conjugates (Molecular Probes-Invitrogen). Nuclei
were labelled with 10 mg ml-1 Hoechst 33342 (Molecular Probes-Invitrogen). Confocal microscopy
was performed with a LSM 510 Zeiss microscope equipped with a 63 objective. To determine the
percentage of p65 translocation, images were loaded into Image J software.
Flow cytometry analyses. The following mouse anti-human Abs were used: CD3-FITC, CD3-
APC, CD4-PerCP, CD8-FITC, CD40-FITC, CD83-PE, CD86-PECy5, CD158a-PE, CD158b-PE,
CD25-APC, CD107a-PE, IL12Rβ-PE (BD Pharmingen), CD11c-PECy7, NKG2D-APC, NKp30-
APC (clone P30-15), TNF-α-APC, IFN-γ-PerCP/Cy5.5 (Biolegend), HLA-DR-APC, CD16-Pacific
Blue, CD45-PCy7, CD56-PCy7 (Beckman Coulter), NKp30-PE (clone AF29-4D12), NKp44-PE,
NKp46-APC (Miltenyi), Dead cells removal reagent Vivide Violet (Molecular Probe, Invitrogen).
For intracellular staining, cells were fixed and permeabilised with Fix/Perm reagents (eBioscience)
following manufacturer’s protocol. Stained cells were acquired within 24 hours on Cyan Flow
Cytometer (Beckman Coulter) and analyses were performed using FlowJo software (Tree Star).
Supplementary references
1. Emile, J.F., et al. Length analysis of polymerase chain reaction products: a sensitive and
reliable technique for the detection of mutations in KIT exon 11 in gastrointestinal stromal
tumors. Diagn Mol Pathol 11, 107-112 (2002).
2. Vitale, M., Sivori, S., Pende, D., Moretta, L. & Moretta, A. Coexpression of two
functionally independent p58 inhibitory receptors in human natural killer cell clones results
in the inability to kill all normal allogeneic target cells. Proc Natl Acad Sci U S A 92, 3536-
3540 (1995).
3. Menard, C., et al. Natural killer cell IFN-gamma levels predict long-term survival with
imatinib mesylate therapy in gastrointestinal stromal tumor-bearing patients. Cancer Res 69,
3563-3569 (2009).
4. Borg, C., et al. Novel mode of action of c-kit tyrosine kinase inhibitors leading to NK cell-
dependent antitumor effects. J Clin Invest 114, 379-388 (2004).
5. Zhu, J., Wang, X., Xu, X. & Abassi, Y.A. Dynamic and label-free monitoring of natural
killer cell cytotoxic activity using electronic cell sensor arrays. J Immunol Methods 309, 25-
33 (2006).
6. Jacque, E., Tchenio, T., Piton, G., Romeo, P.H. & Baud, V. RelA repression of RelB
activity induces selective gene activation downstream of TNF receptors. Proc Natl Acad Sci
U S A 102, 14635-14640 (2005).