supplementary data to chan et al. plasma proteomics of ... time to clotting was measured on an acl...
TRANSCRIPT

1
Supplementary data to Chan et al. “Plasma proteomics of patients with non-valvular atrial fibrillation on chronic anti-coagulation with warfarin or a direct factor Xa inhibitor” (Thromb Haemost 2012; 108.6) Methods Supplement
Factor Xa Activity
Factor Xa activity was determined using an ACL TOP coagulation autoanalyzer (Instrument Laboratories, Lexington, MA) on platelet-poor plasma (PPP) by pre-activation of factor X to FXa with Russell's viper venom (RVV) (Pentapharm Ltd., Basel, Switzerland), followed by addition of a chromogenic substrate (ZD-Arg-Gly-Arg-pNA; S-2765; Chromogenix, Milan, Italy), which is hydrolysed by FXa releasing the chromogenic group pNA (p-nitroanilin). A 50 µl volume of RVV (3.5 mU/ml in 0.1 M CaCl2) was added to a 50 µl sample of plasma and incubated for 15 min, followed by the addition of 50 µl Chromozym X® (600 µM). The quantity of pNA released—which is proportional to the FXa activity—was determined by a photometer at 405 nm. Results were expressed as a percentage of the level of FXa activity in control plasma. Depending on availability, the same standards and controls utilized in the early phase of clinical development of rivaroxaban, prepared from the 3rd International Standard Coagulation Factors II and X Concentrate, Human, 98/590 (National Institute for Biological Standards and Control, Potters Bar, United Kingdom).
The FXa reportable range was 5% to 200%.
Prothrombin Time
Prothrombin time (PT) was measured on an ACL TOP coagulation autoanalyzer (Beckman Coulter, Fullerton, CA) using freeze-dried rabbit brain thromboplastin (PT, STA Neoplastin C1 Plus® Diagnostica Stago, Parsippany, NJ); this was the same thromboplastin reagent used in the preclinical and early phase of rivaroxaban programmes.
The PT min-max in seconds was 7.0 to 140.0 seconds.
Prothrombinase-Induced Clotting Time
Prothrombinase-induced clotting time (PiCT) is a plasma clotting assay based on the activation of coagulation using a combination of a defined amount of FXa, phospholipids (mimicking the platelet membrane or other negatively charged surfaces), and an enzyme that specifically activates factor V (FV; FV activator from RVV). Because the assay is dependent on the activity of FXa in the plasma sample, the presence in a sample of FXa inhibitors results in delayed clotting. The only other variable in the assay is the availability of FV in the sample, which is not affected by anticoagulants to a significant extent. A recently referenced method (1-step PiCT) is able to detect the effects of direct FXa inhibitors.1

2
Prothrombinase-induced clotting time (PiCT) was obtained by adding 50 μL of activator reagent (containing FXa, phospholipids, and RVV-V) and 50 μL CaCl2 (25 mM) to 50 μL of PPP sample. This reagent was mixed with the sample for 3 seconds, and then the time to clotting was measured on an ACL TOP coagulation analyzer (Beckman Coulter, Fullerton, CA). All reagents (Pefakit PiCT) were obtained from the same manufacturer that supplied reagents for the other rivaroxaban programmes (Pentapharm Ltd, Basel, Switzerland). The absolute results were reported in seconds (pre-dose normal range on the ACL system: 8–10 seconds) and final results were reported as ratio relative to PiCT measured in control plasma. The PiCT min-max in seconds was 7.0 to 180.0 seconds. MARS Immunoaffinity Depletion
A. Immunoaffinity depletion was used to simplify the proteome to provide for
increased coverage of lower abundance proteins.
B. A multi-laboratory consortium performed “a head-to-head comparison of
several serum fractionation schemes, including N-linked glycopeptide
enrichment, cysteinyl-peptide enrichment, magnetic bead separation (C3, C8,
and WCX), size fractionation, protein A/G depletion, and immunoaffinity
column depletion of abundant serum proteins. Each technique was compared
to results obtained from unfractionated human serum. The results show
immunoaffinity subtraction is the most effective means for simplifying the
serum proteome while maintaining reasonable sample throughput.” (Journal
of Proteome Research, 2007, 6, 828-836).
C. Published results (Journal of Proteome Research 2010, 9, 4982-4991) have
shown the MARS-14 to provide:
a. “The depletion columns afforded highly repeatable and efficient
plasma protein fractionation”
b. “Relatively few nontargeted proteins were captured by the depletion
columns”
c. “demonstrated enrichment of nontargeted plasma proteins by an
average of 4-fold”
d. “resulted in a 25% increase in identified proteins compared to
unfractionated plasma”
D. It is known that other proteins are depleted by the MARS-14 columns, either
through non-specific binding to the beads and/or specific/non-specific binding
to the antibodies immobilized onto the beads. Our focus was not in trying to
release these proteins from the column, rather we focused on insuring the
reproducibility of this immunodepletion strategy. We utilized a QC protocol
which included:
a. An individual aliquot of a standard pooled plasma sample (large pool
acquired from Bioreclamation, Inc; aliquotted and stored at -80⁰C) is

3
depleted (MARS 14, Agilent) on a daily basis, and three distinct
depletion QC metrics are calculated:
i. ratio of bound to unbound fraction (from AUC from LC/UV
data)
ii. protein levels pre- and post-depletion (from Bradford assays)
iii. 1D gel (for visual inspection of outliers).
iv. Representative figures of these depletion metrics (from other
plasma proteomic studies) are given below to all contextual
visualization of these QC parameters.
b. These same QC depletion metrics are also acquired for each plasma
sample
Meso Scale Discovery Candidate Protein Assay Candidate multiplexed antibody-based assays were performed, targeting 18 pre-specified
proteins based on their established roles in inflammation, cardiac injury,
endothelial/endocardial coagulant regulation, structural remodelling and endocardial toxicity
(Supplemental Table 1). Samples were randomized for daughter plate location and Meso
Scale Discovery® (Meso Scale Discovery, Gaithersburg, MD) sandwich ELISA assays were
performed on daughter plates. Each 96-well plate had carbon electrodes at the bottom of each
well, with each electrode pre-coated with an antibody of interest. The supplied standards
were reconstituted in the assay diluent provided. Blocking solution (150 µl) was added to

4
each well, and samples, standards and controls were added at 25 µl to each well. The plate
was sealed and incubated for 1 h at room temperature on an orbital shaker (~100 rpm). At the
end of the incubation, the wells were washed 3 times using the supplied wash buffer.
Detection antibody was added at 25 µl per well, and the plate sealed and incubated for 1 h at
room temperature on an orbital shaker (~100 rpm). At the end of the incubation, the plate
was washed another 3 times and 150 µl of the Meso Scale Discovery Read Buffer T, with
surfactant, was added to each well. Because the heat shock protein (HSP) assays (pS15
HSP27, pS78 HSP27, pS82 HSP27, HSP 70), cleaved caspase, and total caspase assays are
all sold as cell lysate assays and not plasma assays, the laboratory transformed these to a
quantitative plasma matrix assay by acquiring their own standards and developing alternative
plate-blocking protocols.
Quantification of total protein for sample normalization
The Bio-Rad Quick-StartTM Bradford Protein Assay kit was used for total protein
measurements. BSA was used as the reference calibration protein, with seven calibration
standards used to create a calibration curve covering the concentration range from 0.125 to 2
ug/uL. The calibration curve and each sample were run in duplicate on the same 96-well
plate. A Thermo Multiskan EX plate reader was used to measure absorbance across the 96
well plate, and Thermo Ascent software was used to create the calibration curve and
quantitate the samples against this curve. Plate-to-Plate Reproducibility of Candidate Protein Analysis In tests of plate-to-plate reproducibility of the meso-scale discovery (MSD) assays, the same set of calibration standards were analysed (in duplicate in each plate) across the nine 96 well plates used to analyse the study cohort. In samples from 347 patients, the average accuracy of protein marker concentration was measured to be 6.63%, and precision was measured to be 3.65%. Data Analysis of Unbiased Proteomics To allow robust label-free quantification of individual peptides across all sample injections, Elucidator® v3.3 (Rosetta Biosoftware Inc., Seattle, WA) with PeakTeller algorithm was utilized for feature detection, data alignment across injections, and feature quantification. Integration of each chromatographic peak belonging to the same precursor mass in the aligned chromatograms was then used to calculate the peptide intensity in each section. Only the MSE was used for quantitative measurements; the DDA data were also aligned and used to give supplementary protein identifications, but were not of use for quantization because of the low duty-cycle in the MS dimension (only one data point per ~5 seconds).
Both MS/MS (data-dependent analysis, DDA) and MSE (data-independent analysis) were used to generate peptide identifications. For DDA acquisition files, .mgf (materials and geometry format; Lawrence Berkeley National Laboratory) searchable files were produced in Rosetta Elucidator®, and searches were then submitted and retrieved from the Mascot v2.2 (Matrix Sciences, Inc) search engine in an automated fashion. For MSE data, ProteinLynx Global Server 2.4 (PLGS, Waters Corporation) was used to generate searchable files which were then submitted to the IdentityE search

5
engine (Waters Corporation, Milford, MA); files of the results were then imported back into Elucidator. Results from both search engines were concurrently validated using the PeptideTeller and ProteinTeller algorithms in Elucidator® using independent decoy database validation, and peptides were annotated at a 1% peptide false discovery rate (FDR). Both DDA and MSE data were searched against the SwissProt_human FASTA database (ExPASy Proteomics Server, Swiss Institute of Bioinformatics). Both search types used a full 1X reverse database appended for peptide FDR determination. Precursor ion mass tolerance was 20 parts per million (ppm) for both PLGS and Mascot searches, and product ion tolerance was 0.04 Da for Mascot and 40 ppm for PLGS. Carbamidomethyl cysteine was included as a fixed modification, and oxidized methionine was included as a variable modification.
Following processing of the qualitative and quantitative LC/MS/MS data as above, an output file was generated from Rosetta Elucidator and provided to the statistician for analysis. Data Alignment across LC/MS/MS Samples Rosetta Elucidator software was used to create a view of chromatographic retention time for all LC/MS/MS analyses, in order to align all of the data from the individual LC/MS/MS samples into a master data set, necessary for the quantitation of peptides across the sample cohort.
Multiple alignments were applied across each LC/MS/MS sample analysis in order to ensure accurate quantitation. Reproducibility of LC/MS/MS Quantitation across the Sample Cohort Of approximately 27,000 isotope groups quantitated in the daily quality control sample (pooled human plasma sample processed identically to the Bayer samples), 58% of the isotope groups had less than 10% coefficient of variation (CV; relative standard deviation), and 83% had less than 20% CV (Supplemental Figure 1). The high degree of quantitative precision permitted the accurate measurement of small expression changes in the peptides/proteins..

6
Supplemental Figure 1: Reproducibility of Quantitation of QC Samples
%CV for QC injections (1 analysis/day, 5 replicates)
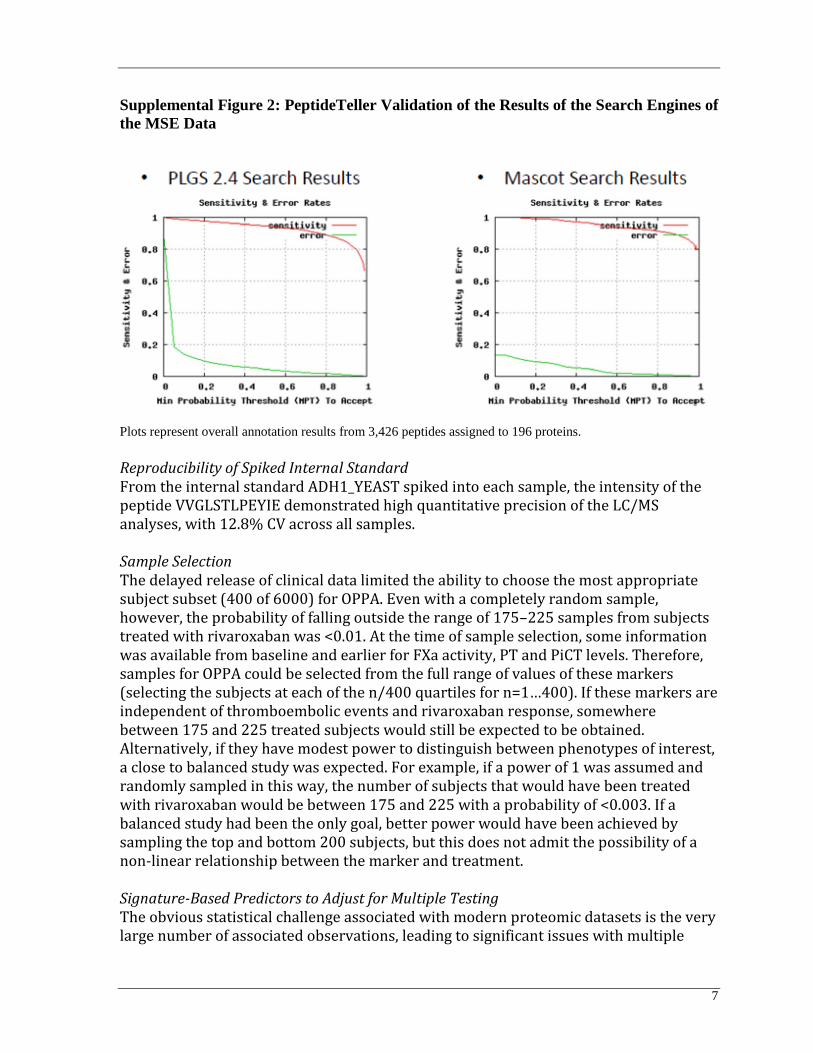
Principal Component Analysis of Precision across the Sample Cohort Principal component analysis of the quantitative precision was performed as a QC metric across the sample cohort. MSE sample data showed the desired “random” scatter of peptides as a function of analysis time, signifying that the analysis met QC specifications. Validation of Results from Search Engines The results from the search engines of the MSE data were concurrently validated using the PeptideTeller and ProteinTeller algorithms in Elucidator using independent decoy database validation. Peptides were annotated at a 1% peptide FDR. Plots of sensitivity and error rates by minimum probability threshold (MPT) for acceptance are shown in Supplemental Figure 2.
7
Supplemental Figure 2: PeptideTeller Validation of the Results of the Search Engines of
the MSE Data
Plots represent overall annotation results from 3,426 peptides assigned to 196 proteins.
Reproducibility of Spiked Internal Standard From the internal standard ADH1_YEAST spiked into each sample, the intensity of the peptide VVGLSTLPEYIE demonstrated high quantitative precision of the LC/MS analyses, with 12.8% CV across all samples. Sample Selection The delayed release of clinical data limited the ability to choose the most appropriate subject subset (400 of 6000) for OPPA. Even with a completely random sample, however, the probability of falling outside the range of 175–225 samples from subjects treated with rivaroxaban was <0.01. At the time of sample selection, some information was available from baseline and earlier for FXa activity, PT and PiCT levels. Therefore, samples for OPPA could be selected from the full range of values of these markers (selecting the subjects at each of the n/400 quartiles for n=1…400). If these markers are independent of thromboembolic events and rivaroxaban response, somewhere between 175 and 225 treated subjects would still be expected to be obtained. Alternatively, if they have modest power to distinguish between phenotypes of interest, a close to balanced study was expected. For example, if a power of 1 was assumed and randomly sampled in this way, the number of subjects that would have been treated with rivaroxaban would be between 175 and 225 with a probability of <0.003. If a balanced study had been the only goal, better power would have been achieved by sampling the top and bottom 200 subjects, but this does not admit the possibility of a non-linear relationship between the marker and treatment. Signature-Based Predictors to Adjust for Multiple Testing The obvious statistical challenge associated with modern proteomic datasets is the very large number of associated observations, leading to significant issues with multiple

8
testing and significance. The simplest approach to adjusting for multiple testing is the Bonferroni correction, which is equivalent to simply requiring much stronger association before declaring statistical significance. This approach assumes independence of the mass spectrometry peak intensities, however, and therefore ignores the strong dependencies that exist among subsets of measured peak intensities. Indeed, up to 30 isotope groups can be associated with a single protein, and even if no other correlations existed, these groupings would lead to significant structure (and thus substantial possible dimension reduction) in the dataset. In modelling this coherent structure, we could better assess the presence or absence of markers of particular disease states of interest. Clustering, principal components, and analysis of gene set enrichment can provide varying levels of information and visualization of structure within large datasets. Our chief interest was the discovery of markers of disease state, however. The ability to generate predictive models can be very difficult with these techniques. Because it effectively describes the correlational structure contained in large, high-dimensional datasets and allows building of predictive models, we intended to use Bayesian sparse latent factor regression.2 This would allow generation of factors based on the expression patterns of the polypeptides measured by OPPA. The factors generated in this analysis consist of sets of polypeptides that share expression patterns along with a single vector (the factor score vector) that describes that pattern.

9
Testing for Differential Expression To test for differential protein expression between groups within clinical variables, Student’s t-test was used for clinical variables containing two groups (e.g. sex, hypertension, or MI); one-way analysis of variance (ANOVA) was applied for variables such as treatment allocation that contained more than two groups, and correlation analysis was used to test continuous variables (e.g. age, baseline BMI, or ejection fraction). For each isotope group where one-way ANOVA indicated a statistically significant difference within a variable containing more than two groups, Tukey’s post-hoc test was then applied to determine between which group pairings this significant difference exists. Latent Factor Modelling Latent factor modelling, a classification approach that groups peptides based on co-expression, was used to avoid errors in quantitative analysis of proteins due to such challenges as incorrect peptide identification, sharing of peptides among homologs, and post-translational modification. Only those peptides having protein identifications were utilized; these were grouped into meta-proteins using a latent factor model with informative priors. Each meta-protein comprised individual peptides sometimes arising from more than one protein. Meta-protein nomenclature is based on predominance of peptides associated with a known protein. Significance Threshold To determine statistically significant isotope groups or meta-proteins, and to account for testing of multiple hypotheses, the false discovery rate (FDR) was used at a level of 5%. This can be thought of as the expected false positive rate, for example, if 500 isotope groups were experimentally predicted to be different, then 25 of these would be expected to be false positives if the false discovery rate was set at 5%.

10
Data Supplement Supplemental Table 1: Targeted Proteomic Assays
MSD Kit Panel name/ Protein markers
MSD 96-Well MULTI-ARRAY® and MULTI-SPOT®
Human Cytokine Assays: Base Kit
Pro-Inflammatory 4-Plex:
IL-1b, IL-6, IL-8, TNF-a
MSD 96-Well MULTI-SPOT®
Vascular Injury Panel I Assay
Vascular Injury Panel 1:
sICAM-3, E-Selectin, P-Selectin, Thrombomodulin
MSD 96-Well MULTI-ARRAY® and MULTI-SPOT®
Human Matrix Metalloproteinase 3-plex Assays:
Ultrasensitive Kit
MMP 3-Plex:
MMP1, MMP3, MMP9
MSD 96-Well MULTI-ARRAY®
Total HSP70 Assay
Total HSP70
MSD MULTI-SPOT® Biomarker Detection
Whole Cell Lysate Kit
Phospho (Ser 15)/Total HSP27
Total HSP27, pS15 HSP27
MSD MULTI-ARRAY® Biomarker Detection
Base kit - Phospho-HSP27 (Ser 78)
Total HSP27, pS78 HSP27
MSD® 96-Well MULTI-ARRAY®
Phospho-HSP27 (Ser82)
Total HSP27, pS82 HSP 27
MSD MULTI-SPOT®
Whole Cell Lysate Kit – Cleaved/Total Caspase-3 Assay
Cleaved Caspase-3, Total Caspase-3

11
Supplemental Table 2: Baseline Characteristics for All Patients with Protein Marker Measured at Both Day 1 and Week 24
Rivaroxaban Group
(N=75) Warfarin Group
(N=82) P-value
Age (year) 0.4495 N 75 82 Mean (SD) 72.1 (8.6) 71.5 (7.7) Median (25th, 75th percentile) 74.0 (66.0, 79.0) 70.5 (66.0, 77.0) (Min, Max) (43.0, 87.0) (52.0, 88.0)
Male 60/75 (80.0%) 60/82 (73.2%) 0.3139 Body Mass Index 0.2563
N 75 82 Mean (SD) 23.6 (3.3) 24.3 (3.6) Median (25th, 75th percentile) 23.5 (21.5, 25.6) 23.9 (21.9, 26.5) (Min, Max) (16.2, 33.1) (16.3, 37.0)
Creatinine Clearance (ml/min) 0.5098 N 75 82 Mean (SD) 64.6 (22.4) 61.5 (18.4) Median (25th, 75th percentile) 62.0 (48.0, 76.0) 56.5 (48.0, 71.0) (Min, Max) (33.0, 132.0) (29.0, 122.0)
History of Hypertension 61/75 (81.3%) 68/82 (82.9%) 0.7945 History of Diabetes 32/75 (42.7%) 30/82 (36.6%) 0.4362 History of Stroke/TIA 41/75 (54.7%) 44/82 (53.7%) 0.8992 History of Myocardial Infarction 8/75 (10.7%) 9/82 (11.0%) 0.9504 History of Coronary Artery Bypass Graft Surgery (CABG)
5/75 (6.7%) 3/82 (3.7%) 0.4804
History of Percutaneous coronary intervention (PCI)
13/75 (17.3%) 14/82 (17.1%) 0.9656
History of Congestive heart failure (CHF)
31/75 (41.3%) 32/82 (39.0%) 0.7681
History of Aspirin use 36/75 (48.0%) 43/82 (52.4%) 0.5784 History of Warfarin use 69/75 (92.0%) 71/82 (86.6%) 0.2754 Factor Xa Activity (%) 0.5156
N 75 82 Mean (SD) 58.5 (21.6) 62.4 (25.7) Median (25th, 75th percentile) 54.1 (42.9, 70.6) 56.6 (44.2, 71.4) (Min, Max) (25.1, 143.5) (24.3, 131.3)
PT (sec) 0.3251 N 75 82 Mean (SD) 17.2 (4.0) 16.6 (4.2) Median (25th, 75th percentile) 16.7 (14.0, 20.2) 16.4 (13.1, 18.9) (Min, Max) (10.8, 28.7) (10.6, 30.1)
PiCT (sec) 0.8432 N 75 82 Mean (SD) 8.1 (0.4) 8.1 (0.5) Median (25th, 75th percentile) 8.0 (7.9, 8.2) 8.0 (7.9, 8.3) (Min, Max) (7.4, 9.8) (7.2, 10.3)

12
Supplemental Figure 43. Metaprotein Heatmap for Unbiased Proteomic Samples Among Diabetic and Non-diabetic Patients
Heatmap of the 26 meta-proteins exhibiting significant differential expression among
patients with- and without a reported medical history of diabetes at day 1.